Article

A Multiphysics System-to-Cell Framework to Assess the Impact of Operating Conditions of Standalone PV Systems on Lithium-Ion Battery Lifetime

1
Division of Energy Systems, Department of Energy Technology, KTH-Royal Institute of Technology, 11428 Stockholm, Sweden
2
Department of Mechanics and Maritime Sciences, Chalmers University of Technology, 41296 Göteborg, Sweden
3
Materials and Energy Research Center, Karaj 3177983634, Iran
*
Authors to whom correspondence should be addressed.
Electronics 2021, 10(21), 2582; https://doi.org/10.3390/electronics10212582
Submission received: 28 September 2021 / Revised: 19 October 2021 / Accepted: 20 October 2021 / Published: 22 October 2021
(This article belongs to the Special Issue Multiphysics Simulation and Optimization of Electrical Energy Systems)

Abstract

:
This paper proposes a multiphysics simulation structure for predicting Li-ion batteries’ useful life by consolidating battery cell electrochemical and thermal-aging models into the electrical domain of PV-battery standalone systems. This model can consider the effect of operating conditions at the system level, such as charge/discharge patterns and energy management strategies, to evaluate battery capacity fade at the cell level. The proposed model is validated using experimental observations with a RRMSE of 1.1%. Results show that the operating conditions of the battery bank affect its lifetime significantly. A wide range of 2.7 to 12.5 years of battery lifetime is predicted by applying the model to different case studies. In addition, the model predicts that managing the maximum cell state of charge level can enhance the battery bank lifetime by 60%. The developed model is a generic multiscale decision-making framework to investigate the effect of operating conditions on battery service life.

1. Introduction

Energy generation using renewable energy systems for distant areas is a viable alternative compared to conventional energy technologies, but the stochastic nature of renewable energies makes them unreliable [1,2,3]. A convenient battery storage component is required to provide a consistent energy output from an intermittent source [4,5]. Lithium (Li)-ion batteries are considered as the most promising energy storage technology with higher energy density than other battery technologies for hybrid, plug-in hybrid, and electric vehicles (HEV/PHEV/EV) [6,7,8,9]. Their successful applications in portable electronic devices show significant potential in renewable energy systems considering their continually decreased cost, as well as their improved safety and cycling life issues [10,11]. The weight and volume of battery systems are not considered as limitations in renewable energy systems as for portable or vehicle applications. However, their cost and cycle life are highly focused for renewable installations [12].
Electrical energy systems constitute a group of components where the interaction between different length scales, concurrent physical phenomena and domains are of crucial importance. Multiphysics and multiscale simulation approaches provide a comprehensive approach to account for the integration of multiple physical models within a larger system. However, the development and the implementation of such advanced frameworks are still challenging, particularly in long-term performance analyses at the system level. Numerous studies have been carried out on the aging mechanisms and lifetime prediction of Li-ion batteries to study the feasible solutions for increasing battery lifetime [13,14,15]. Dufo-Lopez et al. [16] analyzed different lifetime estimation methods applicable to designing and optimizing autonomous renewable energy systems. They confirmed that evaluating the actual lifespan of batteries, which is highly affected by operating conditions, is an important task. Uddin et al. [4] have depicted how considering an aging model of Li-ion batteries in renewable energy installations affects the project’s economic benefits. However, besides the necessity of battery life evaluation, quantification of the battery degradation rate is very sophisticated due to the existence of different influential mechanisms [17,18]. Table 1 summarizes the most important studies conducted to investigate Li-ion battery aging mechanisms in recent years.
Table 1 shows that there are lots of models investigating electrochemical-aging processes of Li-ion batteries in e-mobility and high charge and discharge rate applications. However, due to the low applied current in off-grid PV systems (mostly less than C/10), it is needed to implement some modifications in the battery aging model development for photovoltaic system applications. While the low C-rate of standalone renewable-powered systems causes lots of computational benefits, there is no specific model in the literature to differentiate between aging models of e-mobility applications and standalone renewable energy systems. A Li-ion battery aging model has not been developed especially for standalone photovoltaic applications to the best of authors’ knowledge. Therefore, a comprehensive thermo-electrochemical aging model adopted for PV-battery systems, which can analyze the impacts of intermittence charging/discharge processes on the lifetime of Li-ion batteries, is proposed in this work.
Furthermore, the vast majority of the previous research studies have been focused exclusively on the system level or the cell level simulations. Therefore, the system-to-cell interactions have been generally oversimplified. In other words, the system level-oriented approaches have not accounted for the physicochemical phenomena occurring within the cell domain while the real-world operating conditions have been overlooked in the studies concentrating purely on the cell scale. The current study aims at filling the afore-stated knowledge gaps by bridging the system level and the cell level simulations. We propose an advanced multiphysics simulation environment to comprehensively assess the impact of the transient operating conditions at the system level for the case study of autonomous PV systems on the Li-ion battery lifespan.
To summarize, the main contributions of this study are listed as follows:
(i)
coupling Li-ion battery thermo-electrochemical and aging models;
(ii)
improving the state-of-the-art Li-ion aging model particularly developed for PV-battery system applications;
(iii)
performing the Li-ion aging model on a high temporal resolution;
(iv)
investigating the possible impacts of system-level induced charge strategies and discharge stresses on Li-ion battery cell lifetime;
(v)
application of the multiphysics model as a decision making framework to assess the influence of operating conditions of standalone PV systems on battery lifetime.
This proposed multiphysics thermo-electrochemical aging model is fast and accurate enough to be used for battery lifetime estimation in the case of photovoltaic systems.

2. System Description

The system investigated in this work is composed of a photovoltaic array to convert solar irradiation into electrical power. The generated DC power supplies the load via a DC/AC inverter, and excess power is stored in the battery bank to meet the load in situations when the PV power is not enough. The electrical power flow from PV array is controlled by a maximum power point tracker (MPPT) charge controller to identify whether fulfilling the load or be stored in the battery bank.
In order to investigate the impacts of different charge/discharge protocols on the cell lifetime, a typical lighting load for a greenhouse case study and the demanded AC load for a residential house are taken into account in two regions with different solar irradiation capacities. Figure 1 graphically depicts the problem under consideration.

3. Materials and Methods

3.1. Electrochemical Model

The voltage of a Li-ion battery can be calculated by using Equations (1) and (2) [22,23,37].
η = ϕ s ϕ e U
V ( t ) = ϕ s ( L ) ϕ s ( 0 ) R c A I ( t ) = U p U n + η ( L ) η ( 0 ) + ϕ e ( L ) ϕ e ( 0 ) R c A I ( t )
where V(t) is the battery voltage at time t, U is thermodynamic potentials, and η is overpotentials when current is implemented to the system (by the assumption of I > 0 for discharge and I < 0 for charge processes). Substitution of different terms into Equation (2) based on Prada et al. [23] leads to Equation (3), represented in Table 2, to calculate the cell voltage as a function of the current and time. Where ζp and ζn are calculated based on Ref. [23] as a function of the cell design parameters and operating current.
The effective conductivities in Equation (3) depend on the average Li concentration within the organic electrolyte and porosity. They are calculated based on the well-known Bruggman correlation for each region, as shown in Equation (4) [38]. Electrolyte conductivity depends on Li concentration and electrolyte composition. It is assumed that the electrolyte conductivity is 2.82 mS cm−1 for commercial LFP-based cells, as reported by Doyle et al. [39].
As the battery current in standalone PV-battery installations is lower than C/10, the Li concentration within the organic solution is considered to be constant along with the cell thickness. Therefore, the electrolyte Li concentration-related term in Equation (3) is negligible.
Surface concentrations of Li on spherical particles are calculated by the interfacial balance of lithium around either graphite or Li-metal oxide particles using the diffusion length theory [19] which is shown in Equation (5). The diffusion length for spherical particles is l s = R s 5 [19,40] with the assumption of the uniform reaction current density j L i = I A δ [38]. The average concentration of Li-ions is determined by solving an ODE equation recommended by Gu et al. [41].
Thermodynamic potential, U, is calculated by Equations (7) and (8) offered by Safari et al. [42] for a commercial graphite/LiFePO4 cell. Where y s = C s , p s C s , p , m a x and x s = C s , n s C s , n , m a x are dimensionless Li concentrations which are calculated at the surface of the spherical particles in the positive and negative electrodes, respectively. Similar equations for other types of commercial Li-ion batteries can be found in the literature.
Table 2. Electrochemical model governing equations.
ExplanationFormulationEquation NumberRef.
Electrochemical voltage V ( t ) = U p ( c s , p s c s , p , m a x ) U n ( c s , n s c s , n , m a x ) + R T α F l n ( ξ p + ξ p 2 + 1 ξ n + ξ n 2 + 1 ) + ( 1 t + ) 2 R T F l n c e ( L ) c e ( 0 ) I ( t ) 2 A ( δ n κ n e f f + 2 δ s e p κ s e p e f f + δ p κ p e f f ) R c A I ( t ) (3)[23]
Effective conductivity κ e f f = κ ε e b r u g g (4)[38]
Surface concentration on spherical particles c s s ( t ) c s a v g ( t ) = j L i l s a s F D s [ 1 exp ( 4 D s t 3 l s ) ] (5)[19]
The average concentration of Li ions ( ε s c s a v g ) t = j L i F (6)[41]
Cathode thermodynamic potential U p = 3.4323 0.8428 e x p ( 80.2493 ( 1 y s ) 1.3198 ) 3.2474 × 10 6 e x p ( 20.2645 ( 1 y s ) 3.8003 ) + 3.2482 × 10 6 e x p ( 20.2645 ( 1 y s ) 3.7995 ) (7)[42]
Anode thermodynamic potential U n = 0.6379 + 0.5416 e x p ( 305.5309 x s ) + 0.044 tan h ( x s 0.1958 0.1088 ) 0.1978 tan h ( x s 1.0571 0.0854 ) 0.6875 tan h ( x s + 0.0117 0.0529 ) 0.0175 tan h ( x s 0.5692 0.0875 ) (8)[42]

3.2. Aging Model

The SEI layer growth is the dominant aging mechanism before the battery undergoes the nonlinear reduction in its usable capacity [22]. The loss of cyclable lithium ions has been cited as the main mechanism responsible for cell capacity fade [43].
The solvent reduction reaction is represented by Equation (9) [21,24,43,44].
S + 2 e + 2 L i + P
The above-referenced reaction occurs at the surface of the graphite particles, and it is quantified using the cathodic Tafel equation [21,24,43,44]. By considering these assumptions, the general mathematical formulation of SEI layer growth in the case of Li-ion batteries is depicted in Table 3.
The anode applied current per unit volume ( j n l ) is extracted by subtracting the side reaction current density ( j n s ) from the total current density ( j n L i ) (see Equation (10)). Randall et al. [21] introduced Equation (11) to obtain the side reaction current density.
Due to SEI layer growth, capacity loss and impedance rise are calculated based on Equations (12) and (13), respectively. Therefore, the voltage equation, which was calculated by Equation (3), is modified to Equation (14) to consider the impacts of capacity loss and impedance rise caused by SEI layer growth.
Equation (15) correlates the state of charge to the lithium concentration in the anode [23,43]. Where x n ( t ) = C s , n a v g ( t ) C s , n , m a x and represents the normalized value for the average Li concentration. The denominator in Equation (15) accounts for the cell nominal capacity [23]. The modified state of charge considering the cell remaining capacity is computed by S O C = S O C c e l l × Q n o m i n a l Q r e m a i n i n g [45].
By considering Section 3.1 and Section 3.2, the integrated multiphysics electrochemical and aging model for Li-ion cells is developed. By this framework, the cell end of life (EOL) is found. The EOL is when the cell’s remaining capacity is 80% of the value delivered by a new cell. In Section 3.3, we describe how the change in temperature influences the cell state estimation.

3.3. Thermal Model

Srinvasan et al. [46] mentioned that the heat generated inside the cell is dissipated under battery operation when the rate of charge/discharge process is remarkably low. Accordingly, it is realistic for PV-battery systems (I < C/10) to consider that the cell operates isothermally. Therefore, the Arrhenius relation (Equation (16)) is used to correlate the electrochemical transport parameters to the temperature, as also highlighted in Ref. [22]. It is worth noting that the solid-phase lithium diffusion, the electrolyte-phase conductivity, and the charge transfer coefficients have been mainly cited as the physico-chemical properties that follow Arrhenius equation [23,43,47].
Equation (17) shows how the open-circuit voltage is affected by temperature [48]. Here, Uref is the open-circuit voltage obtained at reference temperature (see Equations (7) and (8)).
Equation (18) is used to calculate dU/dT, which is a polynomial function of the state of charge (SOC) [49]. By integrating the impact of temperature, Equation (14) is converted to Equation (19), which is the cell voltage response to PV-battery systems’ operating current while being conscious of thermal-aging effects.

4. Multiphysics Solution Procedure

As shown in Figure 2a, the so-called multiphysics solution procedure for assessing the battery longevity is divided into two basic portions: (i) system-level design and (ii) the cell-scale battery operation and performance evaluation. PV generator and battery bank configuration are specified in the design stage based on accumulated energy methodology described in [50] using meteorological information and the demand side requirements as inputs. Subsequently, the operational current at each time slot is obtained to be fed as input to the battery operation and performance assessment part. The cell-scale battery operation part integrates the electrochemical and thermal-aging aware models (see Table 2, Table 3 and Table 4) to account for the effects of operational conditions such as current, temperature, depth of discharge, and state of charge on the cell service period. Figure 2b visualizes the final battery lifetime simulation model in detail and provides the interconnection between the main governing equations of the cell-scale thermo-electrochemical-aging model. The side reaction current density j n s (see Equation (11)), is the key factor that links the operational conditions to the cell degradation state. In addition to the operating current and the cell design parameters, j n s is dependent on the anode potential (Equation (8)). By calculating the anode lithiation state x n ( t ) = C s , n a v g ( t ) C s , n , m a x using Equation (5), the anode potential is extracted. Subsequently, one can find the cell capacity fade and the SEI layer growth which is responsible for the cell resistance rise via Equations (12) and (13), respectively. Furthermore, the battery voltage response considering thermal-aging effects is computed using Equation (19). At each time step, the battery capacity is updated and checked to determine whether the end-of-life criterion is reached. Otherwise, the updated thickness of the SEI layer and the Li inventory of the cell are calculated and used as inputs to perform the simulations at the next time step. This methodology is used to investigate the impacts of different real-world transient charging protocols and discharge patterns on PV-battery system size (at the system level) and the cell lifespan (at the cell level). It is worth noting that the integrated model has been developed in MATLAB R2019b environment for performing the simulations.

5. Results and Discussion

In this section, the proposed model to predict the battery lifetime is validated using the experimental data for a commercial graphite/LFP cell found in the literature [51]. Afterward, two case studies are considered to analyze the effects of different solar potentials (charging patterns) on the battery life. In addition, for each case, two different load profiles are considered to evaluate the influence of discharge patterns on the battery’s useful life. Finally, to enhance the battery life, the effect of controlling the maximum SOC threshold is investigated. In the first strategy, the battery SOC swing setpoints are 10% and 95%, whereas the SOCmax is 70% for the second strategy.

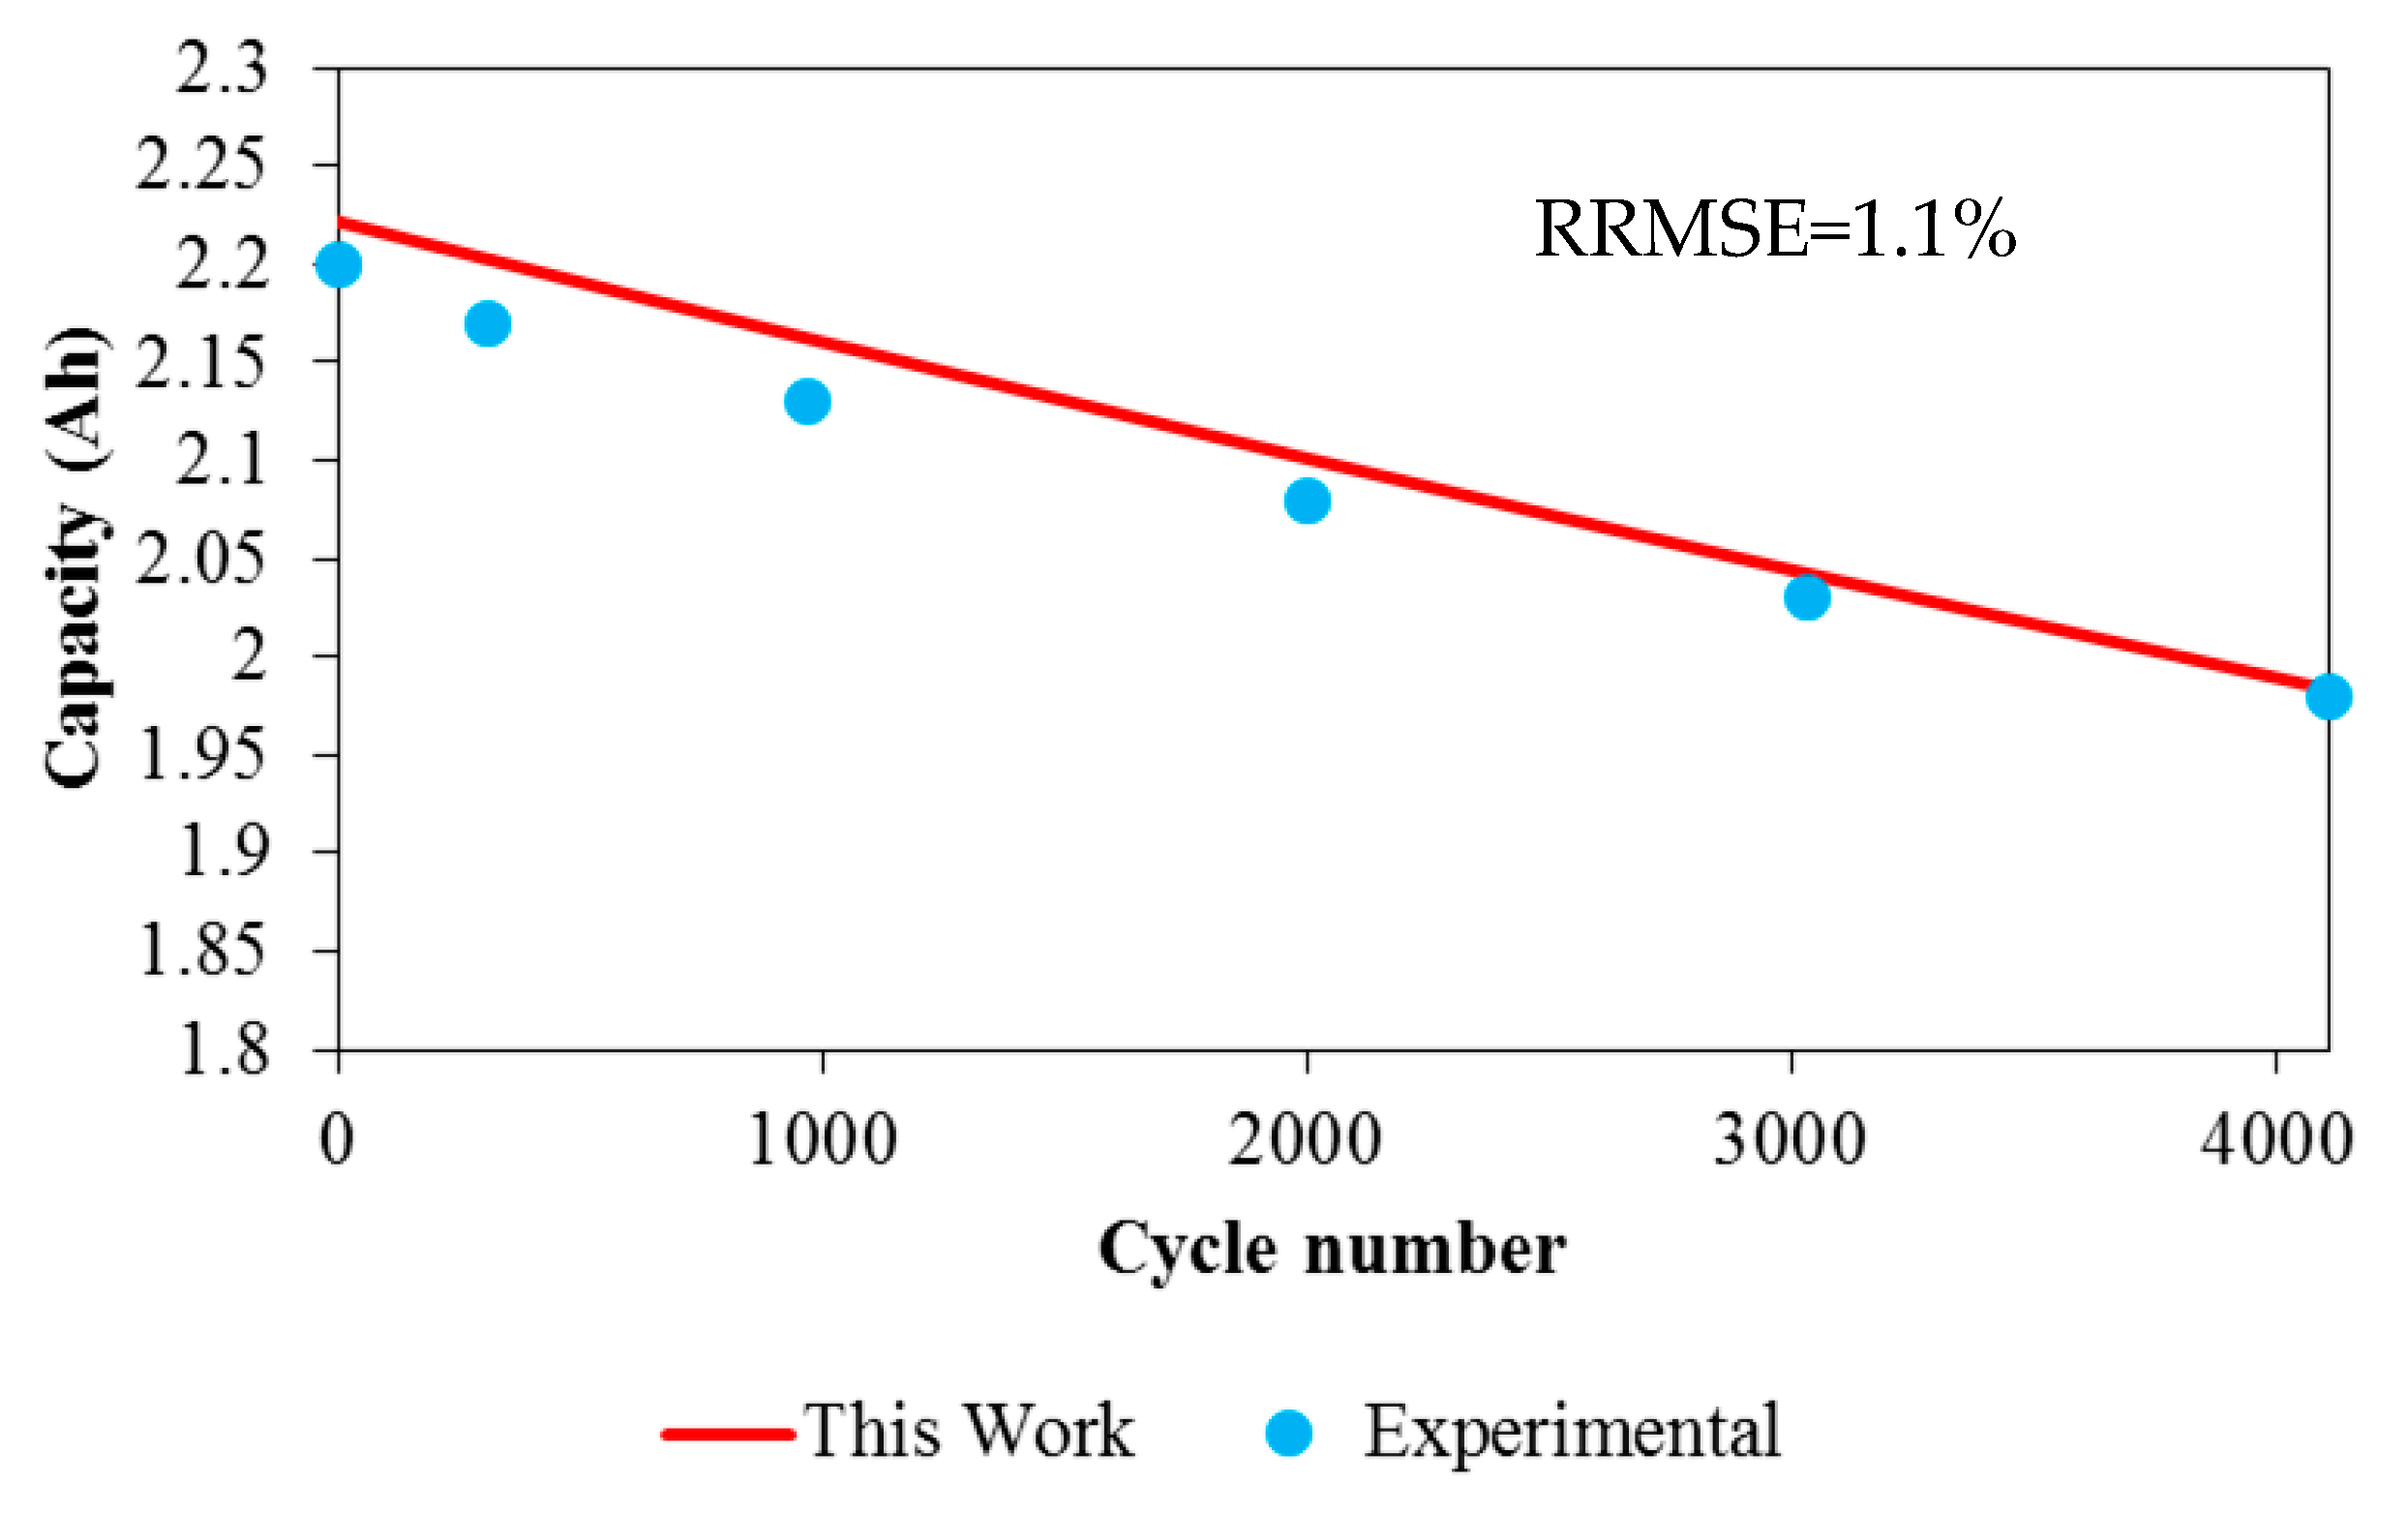
5.1. Model Verification
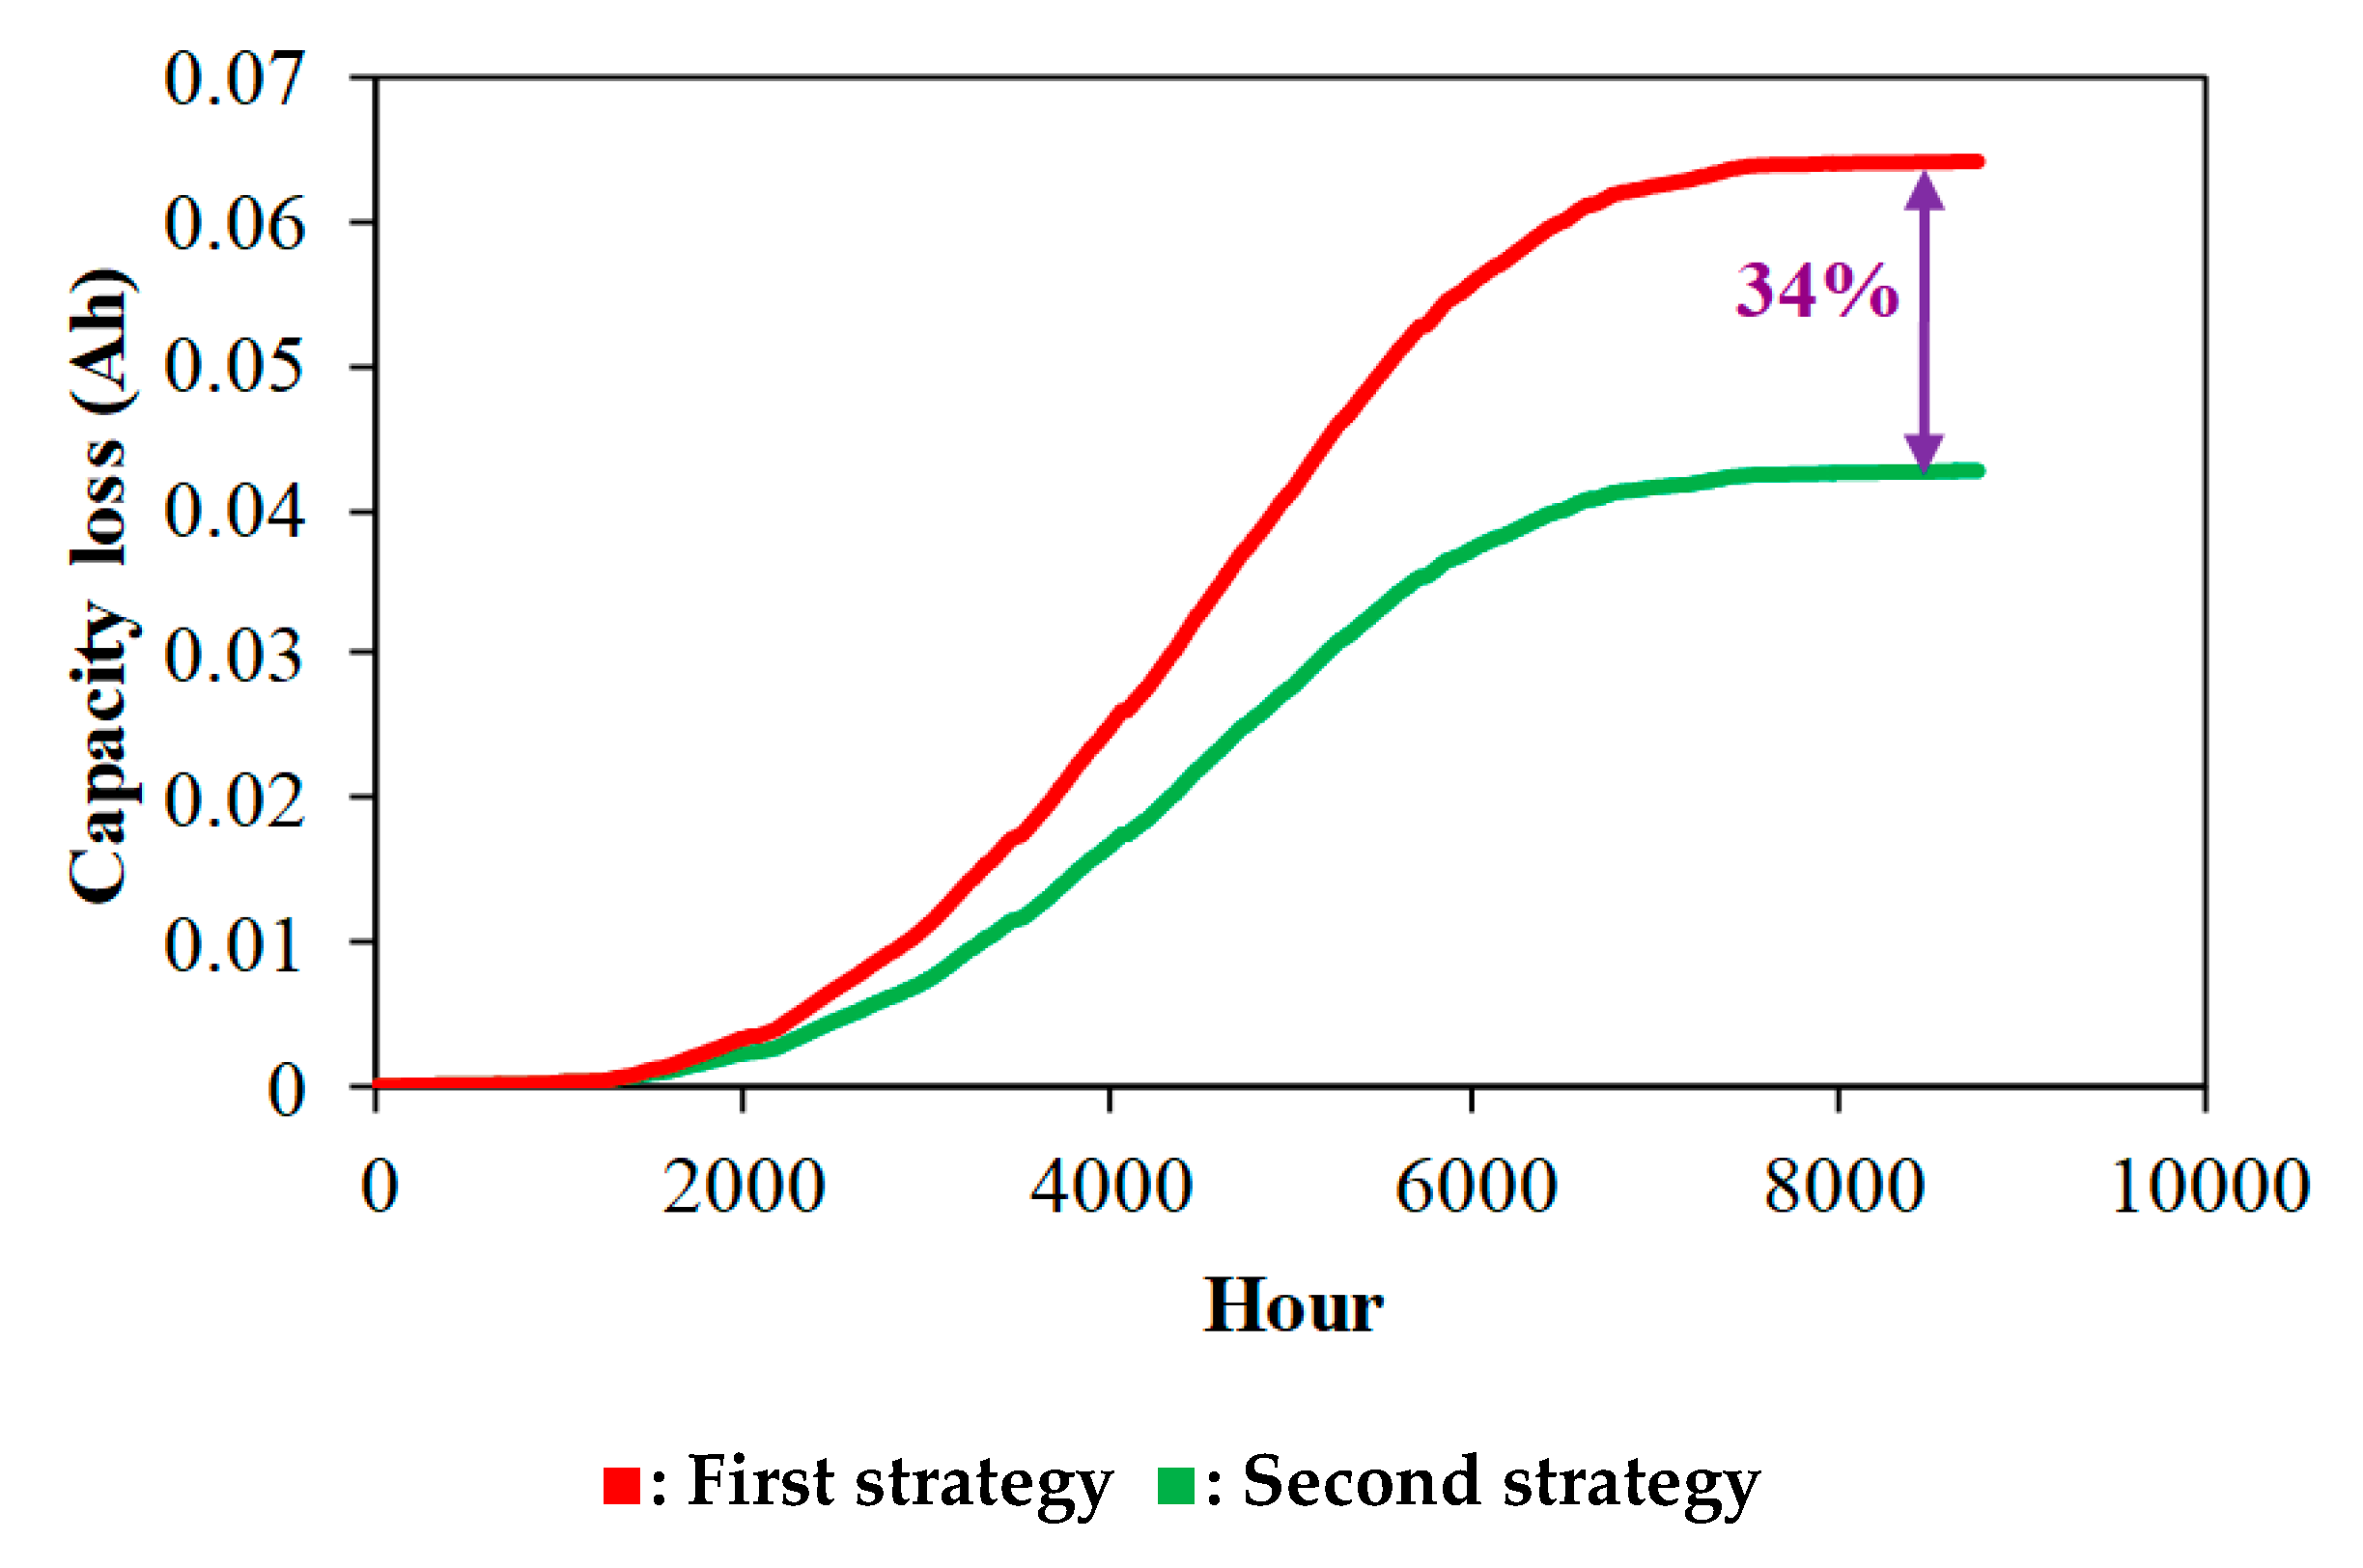
To validate the performance of the aging aware electrochemical-thermal model, the cell capacity fade trend is compared with the experimental observations reported by Safari et al. [51]. The experimental tests were performed under the so-called simple cycling protocol for a commercially available 2.3 Ah LFP cell at room temperature. The cell electrochemical properties are extracted from Refs. [22,42,43]. Figure 3 shows that the simulations capture the experiments excellently and the RRMSE is 1.1%.

5.2. Case Studies

Two cities with different solar potentials are considered to assess the impact of different transient charging protocols on the battery degradation rate. The first is Mahabad (36.7684° N, 45.7337° E) situated in north-west of Iran. The second is Yazd (31.8974° N, 54.3569° E) located in the center of Iran with 30% higher average solar irradiance than Mahabad.

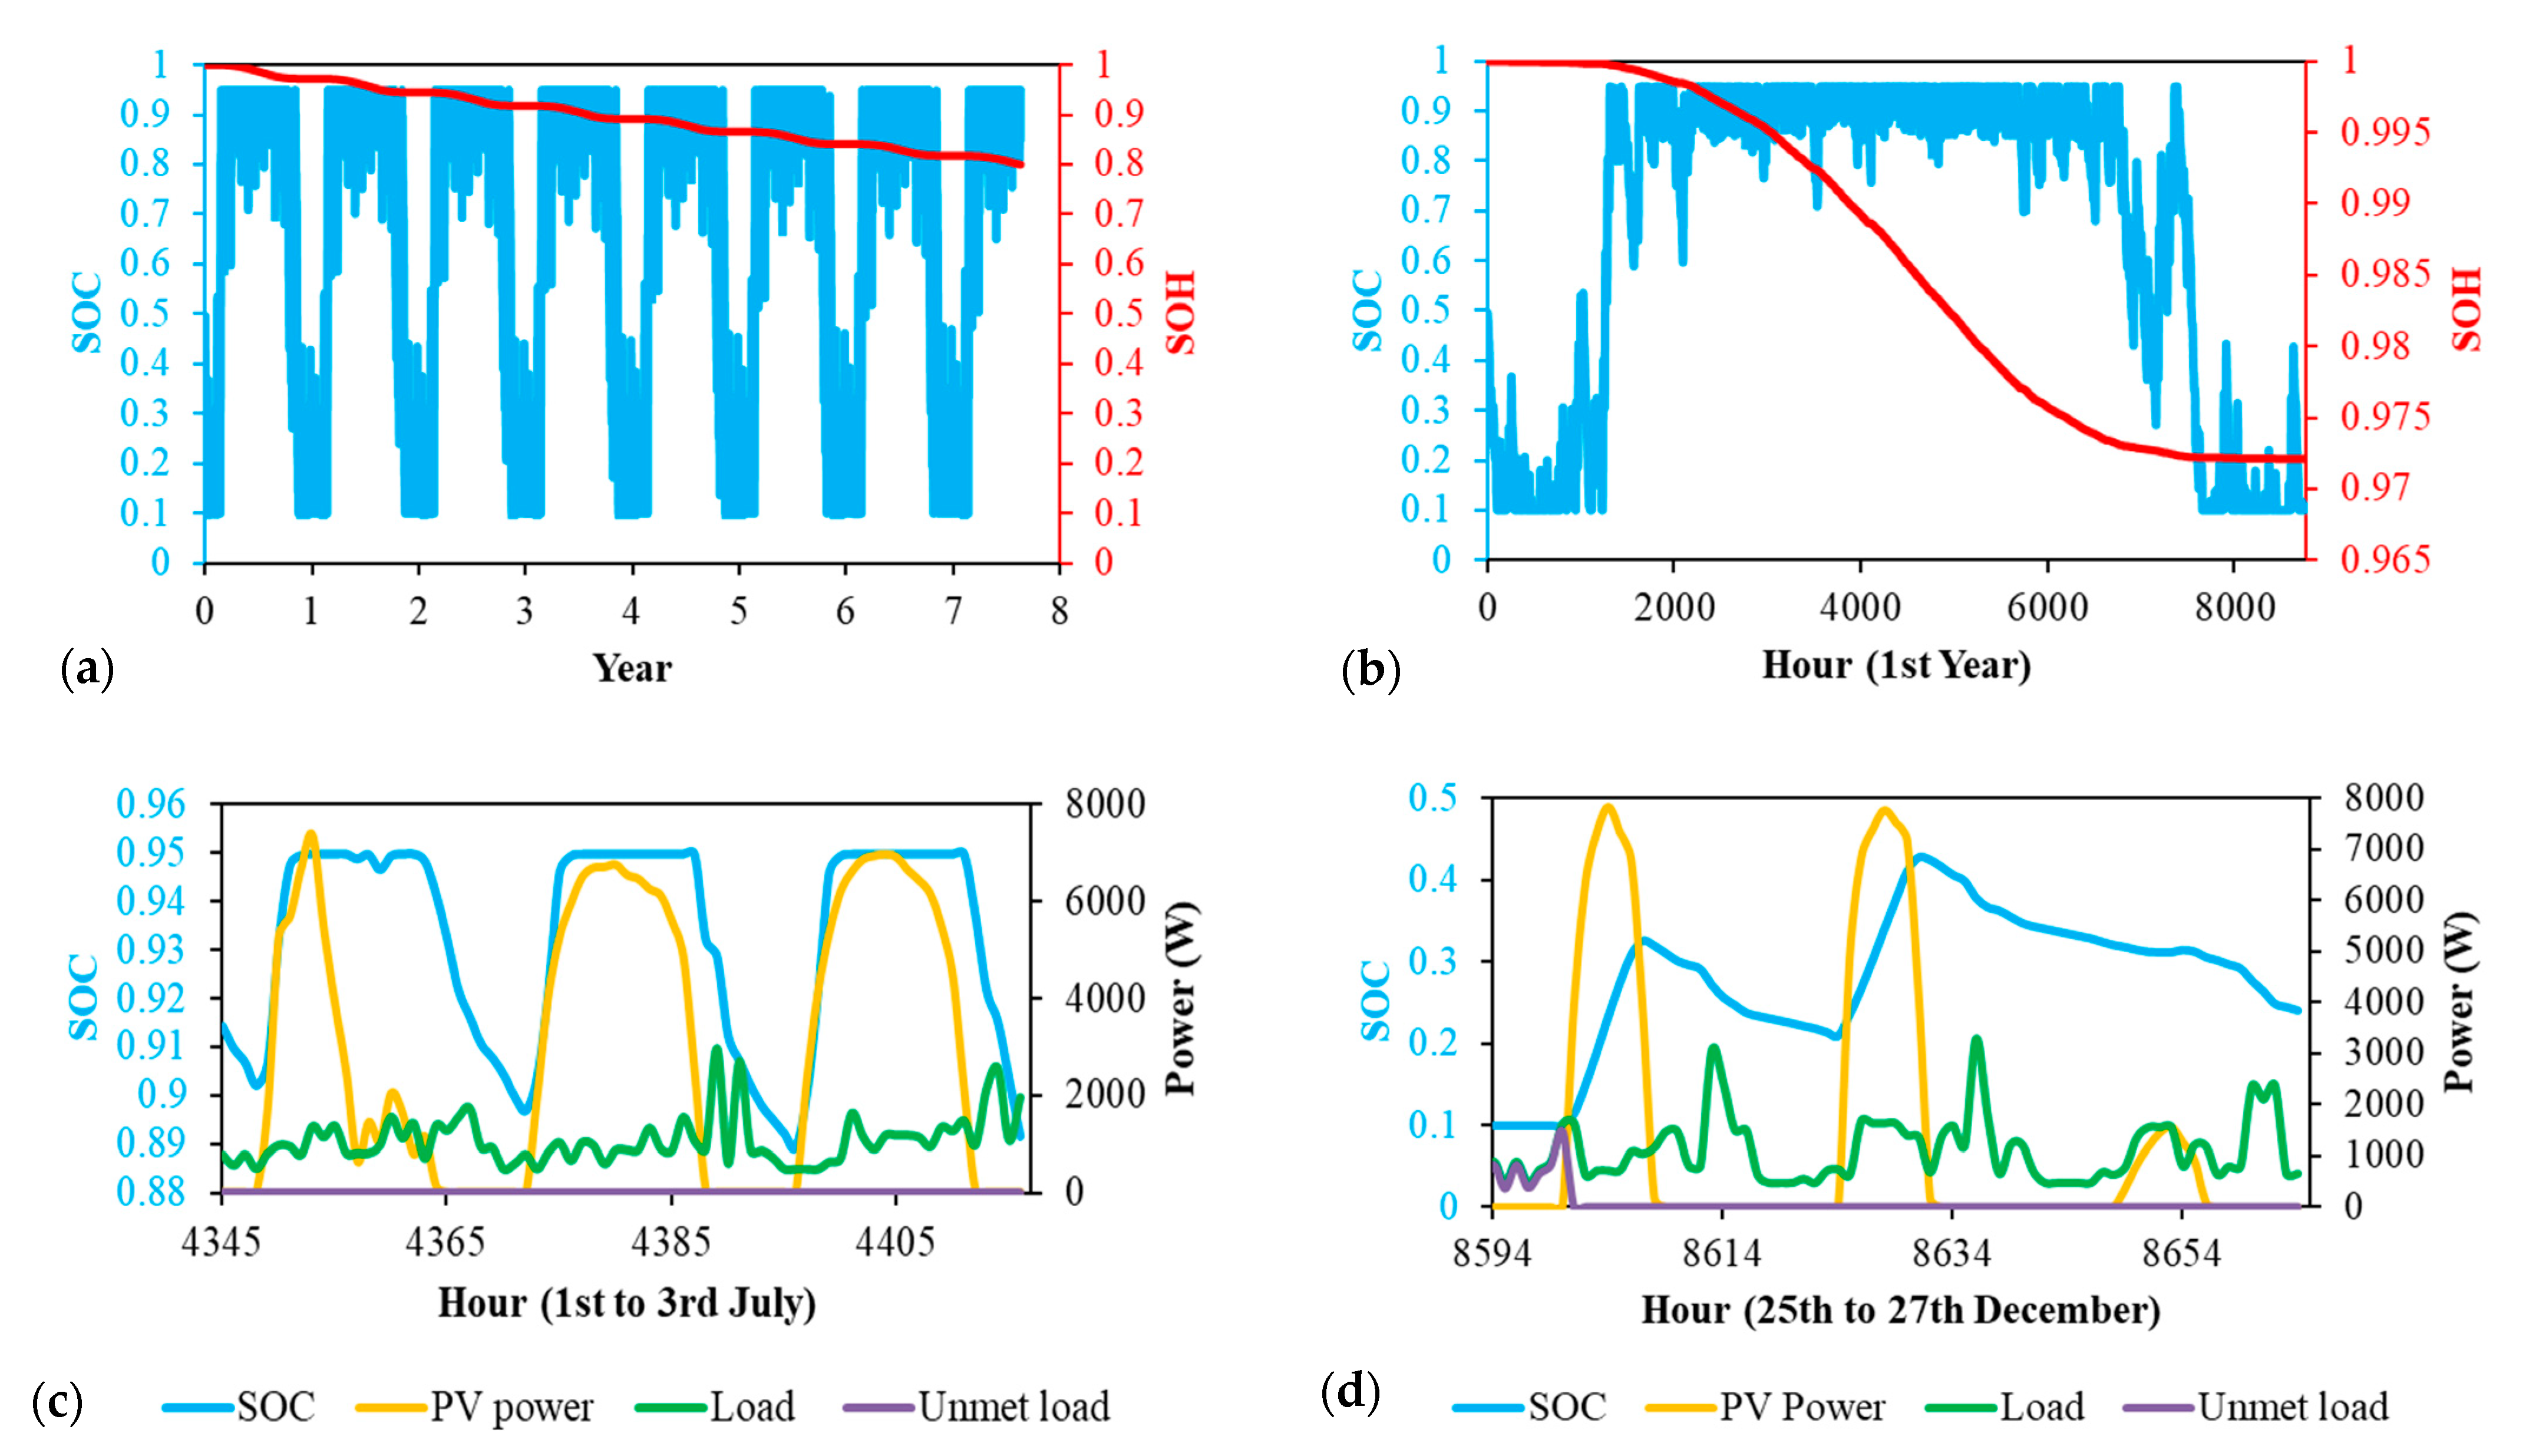
5.2.1. Mahabad (Low Solar Potential)

Here, we assume two different load types to analyze the effect of the battery discharging pattern. The first one is the electricity need for a four-person residential house, while the second is the demanded lighting load for a greenhouse. The main purpose for selecting these two loads is that the greenhouse case shows zero loading current during the daytime. Therefore, the stored electricity in the battery provides artificial lighting during the night. However, the household load is more unpredictable, and both the electricity storage and usage occur constantly.

Residential House Electricity Load

The electrochemical and thermal aging model is implemented here to the residential house under consideration which is located in Mahabad. Table 5 presents the PV-battery system size for this case.
The simulation results are demonstrated in Figure 4. Figure 4a illustrates the battery SOC/SOH evolution until the cell’s end of life. The predictions show that the battery lifetime is 7.6 years considering the SOCmin and SOCmax of 10% and 95%, respectively. The percentage of covered load is 89.6%. Figure 4b depicts the simulation results for the first year of the battery life, highlighting that the degradation rate is higher during summer when the solar irradiation is at its highest level. In other words, the high levels of SOC and temperature are the main stressors for Li-ion batteries. Figure 4c,d demonstrate a detailed look at the SOC, PV power, demanded load, and the uncovered load for three consecutive days in July and December. Figure 4c shows that the battery SOC is higher than 90% due to the high solar irradiation during 1st–3rd of July. However, it is only between 10% to 40% during 25th–27th of December, which leads to the observed unmet loads due to lack of sufficient solar energy.
Figure 4b predicts higher degradation rate when the batteries operate under high levels of SOC. It seems that decreasing the SOCmax under such conditions can enhance the battery lifetime. Therefore, corresponding results for the second strategy, when the SOCmax is set to 70%, are presented in Figure 5. By this control strategy, the battery lifetime is prolonged to 12.5 years at the expense of decreasing the percentage of the covered load to 88.8%.
Figure 6 compares the yearly capacity loss for the two control strategies under investigation. It is observed that the capacity fade under the second strategy is 34% lower compared to the first strategy. Overall, it is worth mentioning that although the percentage of the covered load is 0.8% lower for the second energy management strategy compared to the first strategy, it improves the battery lifetime by 64.5%.

Greenhouse Lighting Load

In this case, the required lighting load for a greenhouse is implemented to investigate the effect of the discharge pattern on the battery degradation trend. Table 6 presents the PV-battery system size for this case.
Figure 7 shows the simulation results for this case study while assuming 10% and 95% as the SOCmin and SOCmax criteria, respectively. As Figure 7a indicates, the estimated battery longevity is 6.5 years and the percentage of the load which the autonomous system has covered is 84.6%. As observed, the battery life for this case is 14.5% lower than the corresponding control strategy for the residential house electricity load. This is mainly as the battery is under idle state for the greenhouse case study at very high levels of SOC during the daytime. As it can be seen in Figure 7b, the degradation process is accelerated when the battery is at high levels of SOC for a long time. Detailed representations of the generated PV power, storage conditions, and the load requirements are depicted in Figure 7c,d.
Figure 8 illustrates the long-term battery performance when the second control strategy is applied. This leads to the prolongation of the battery service period to 10.4 years by sacrificing 0.9% of the met load percentage. A comparison between Figure 7b and Figure 8b indicates a higher degradation rate for the operation under the first control strategy.
The difference between the capacity loss for the two applied control strategies is represented in Figure 9. A value of 33.8% confirms the considerable influence of controlling the SOCmax on the battery capacity fade reduction.

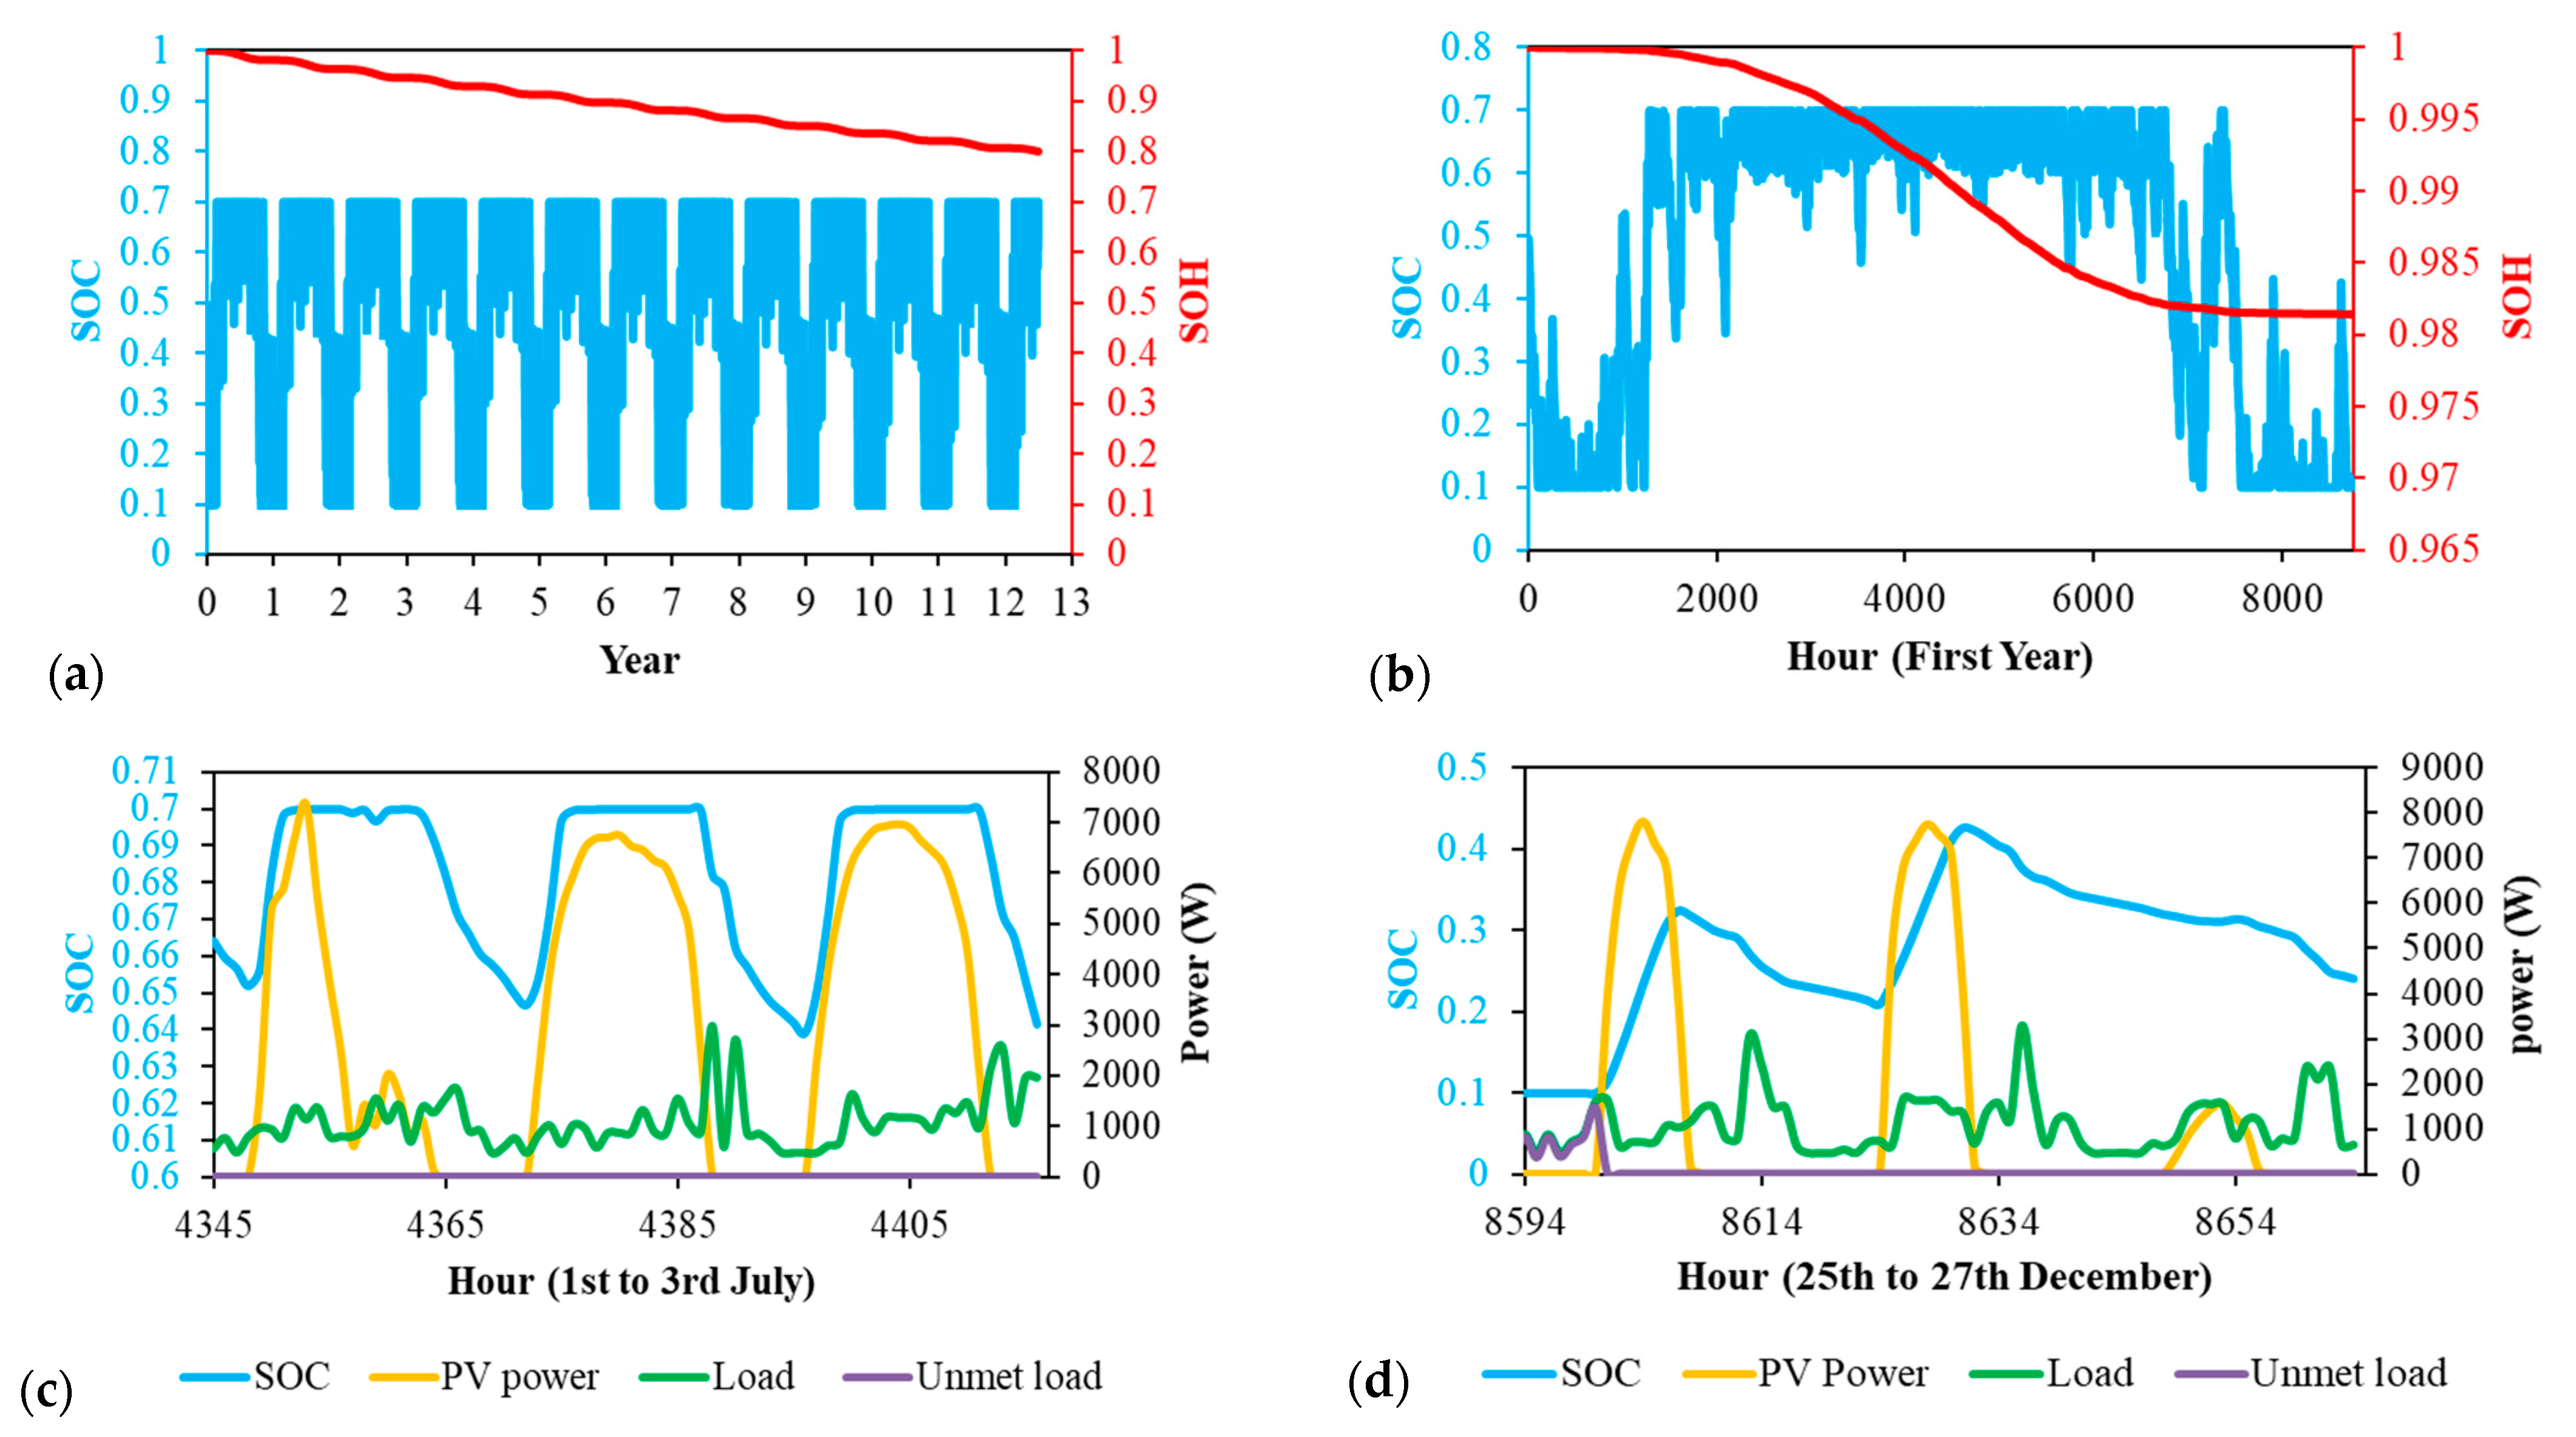
5.2.2. Yazd (High Solar Potential)

In this section, Yazd city with 31% higher yearly averaged irradiation than Mahabad is considered to account for the effect of the transient charge pattern on the battery aging process. The PV-battery design parameters are assumed to be similar as reported previously in Table 5 and Table 6.

Residential House Electricity Load

The simulation results replicating the model predictions for Yazd case study (higher solar irradiation availability) under both control strategies are presented in Figure 10 and Figure 11. By comparing Figure 4a and Figure 10a, it is understood that the battery operation under high charging states due to high solar irradiation availability yields 57% reduction in the battery life. Figure 10b shows that the battery operating SOC is often more than 60% during the year, resulting in a sharper degradation rate compared to Figure 4b. Figure 10c,d confirm that battery SOC is maintained at high levels during the summer and winter.
Figure 11 shows the results of applying the second SOC control strategy to the system located in Yazd city. Although the useful battery life is increased by 59% compared to the first strategy, it is still 33% shorter than the first strategy applied to the residential house electricity demand in Mahabad with lower solar potential.
The difference in the capacity loss between the two studied control strategies is represented in Figure 12. A value of 40% shows that applying the improved control strategy for the regions with high solar potential has a more significant impact on the battery capacity fade reduction compared to the cities with low solar potential.
Greenhouse Lighting Load
Figure 13a,b illustrate that the greenhouse demanded lighting load leads to a shorter battery lifespan and higher degradation rate than the residential house electricity demand. An approximate comparison between Figure 7a and Figure 13a shows different transient charging patterns on the battery useful life. The battery life in Yazd (high solar potential) is 58% lower than the corresponding case in Mahabad (low solar potential). Figure 13c,d represent detailed information about the power generated by the PV array, the storage condition of the battery bank, and the load profile.
For this case, the second SOC control strategy, compared to the first strategy, results in 59% improvement in battery life, as shown in Figure 13 and Figure 14.
Figure 15 shows a better representation of the capacity fade result from the two investigated control strategies during the first year of simulation. A 38.9% reduction in the lost capacity confirms the second SOC management strategy’s suitability on enhancing the battery lifetime.
The simulation outcomes resulted from applying the developed multiphysics framework on two cities with various solar potentials, two load types, and two SOC-dependent control strategies are summarized and graphically compared in Figure 16. The impact of solar potential (charging pattern) shows that, in regions with high solar irradiation (Yazd) where the batteries usually operate at fully charged states, the battery lifetime is lower compared to regions with low solar irradiation (Mahabad). The impact of the load requirements (discharging pattern) demonstrates that uninterruptible load consumption during daytime (household case study) has a lower effect on the battery capacity deterioration than non-continuous load (greenhouse case study). Furthermore, it is observed that the second control strategy, by reducing the SOCmax setpoint, improves the battery lifetime in all charge and discharge patterns.

6. Concluding Remarks

In this paper, we firstly provided a comprehensive literature review to highlight the importance and the existing challenges of developing advanced multiphysics frameworks in future design and long-term performance evaluation of renewable energy systems. Subsequently, to fill the knowledge gap, a multiphysics system-to-cell methodology to predict the useful life of Li-ion batteries by integrating the electrochemical-thermal and aging-conscious models into simulation framework of PV-battery systems was developed. The model considered the impacts of different operating conditions, including state of charge, applied current, and temperature on the battery capacity fade estimation. The proposed model was subsequently implemented into several case studies to investigate the impact of charge/discharge patterns on battery longevity.
It was concluded that the battery lifetime is highly dependent on operational conditions. By investigating two regions with unsimilar solar potentials, two load types, and two SOC-based control strategies, battery lifetime varied remarkably from 2.7 to 12.5 years. Analyzing different operational modes confirmed that the longer the time the battery stayed at high levels of SOC, the higher the capacity fade would be. Therefore, the proposed model is a generic multiphysics decision-making framework to select the most appropriate battery operating conditions for a wide variety of regions and load demands with different characteristics.
In our future research, the developed simulation environment in this study will be integrated into the optimization framework of PV-battery systems to jointly extract the optimal system configuration and the battery operational condition. Furthermore, we aim at validating the integrated multiphysics model by performing long-term field tests during the battery service period.

Author Contributions

Conceptualization, F.G. and M.A.; methodology, F.G. and M.A.; software, F.G. and M.A.; validation, M.A.; formal analysis, F.G. and M.A.; investigation, M.G.; resources, F.G. and M.A.; data curation, F.G. and M.A.; writing—original draft preparation, F.G.; writing—review and editing, M.A.; visualization, F.G. and M.A.; supervision, M.G.; and project administration, M.G. All authors have read and agreed to the published version of the manuscript.

Funding

The APC was funded by KTH Royal Institute of Technology.

Conflicts of Interest

The authors declare no conflict of interest.

Nomenclature

asActive surface area per electrode unit volume, m2 m−3
AElectrode plate area, m2
cConcentration of Li in a phase, mol m−3
csSurface concentration of lithium in the solid phase, mol m−3
DDiffusion coefficient, m2 s−1
EaActivation energy, J mol−1
FFaraday’s constant, 96,487 C mol−1
IDischarge current, A (I > 0 discharge; I < 0 charge)
i0Exchange current density, A m−2
jlVolumetric intercalation current density, A m−3
jLiTotal volumetric current density, A m−3
lsDiffusion length ls = Rs/5 for spherical particles, m
MMolecular weight, kg mol−1
QCapacity (Ah)
RUniversal gas constant, 8.314 J mol−1K−1
RcContact resistance, Ωm2
RfFilm resistance, Ωm2
RsRadius of active material particles, m
SOCState of charge
TAbsolute temperature, K
TrefReference temperature, 298 K
tTime, hours
t+Transference number
UOpen circuit or equilibrium potential, V
VVoltage, V
xNegative electrode solid-phase stoichiometry (anode lithiation state)
yPositive electrode solid-phase stoichiometry (cathode lithiation state)
zSpatial coordinate, m
Greek symbols
α Transfer coefficient for an electrode reaction
δ Thickness, m
Δ t Time interval, hours
τ Time, s
ε Volume fraction of a phase
η Overpotential of an electrode reaction, V
κ Conductivity, S m−1
ξ ξ = R s 6 ε s i 0 A δ I
ρDensity, kg m−3
ϕ Phase potential, V
ψ Transport parameters
Subscript
eElectrolyte phase
fFilm
fillerFiller
maxMaximum value
nNegative electrode
pPositive electrode
rRegion (negative electrode (n), separator (sep) or positive electrode (p))
sSolid phase
s/eSolid/electrolyte
SEISolid electrolyte interphase
sepSeparator
0%Corresponds to fully discharged battery
100%Corresponds to fully charged battery
Superscript
avgAverage
effEffective
LiLithium species
refReference condition
sSide reaction
0Initial value

References

  1. Amrouche, S.O.; Rekioua, D.; Bacha, S. Overview of energy storage in renewable energy systems. Int. J. Hydrogen Energy 2016, 41, 20914–20927. [Google Scholar] [CrossRef]
  2. Talari, S.; Shafie-Khah, M.; Osório, G.J.; Aghaei, J.; Catalão, J.P.S. Stochastic modelling of renewable energy sources from operators’ point-of-view: A survey. Renew. Sustain. Energy Rev. 2018, 81, 1953–1965. [Google Scholar] [CrossRef]
  3. Ahmed, D.; Ebeed, M.; Ali, A.; Alghamdi, A.; Kamel, S. Multi-Objective Energy Management of a Micro-Grid Considering Stochastic Nature of Load and Renewable Energy Resources. Electronics 2021, 10, 403. [Google Scholar] [CrossRef]
  4. Uddin, K.; Gough, R.; Radcliffe, J.; Marco, J.; Jennings, P. Techno-economic analysis of the viability of residential photovoltaic systems using lithium-ion batteries for energy storage in the United Kingdom. Appl. Energy 2017, 206, 12–21. [Google Scholar] [CrossRef]
  5. Schill, W.-P.; Zerrahn, A. Long-run power storage requirements for high shares of renewables: Results and sensitivities. Renew. Sustain. Energy Rev. 2018, 83, 156–171. [Google Scholar] [CrossRef]
  6. Xu, T.; Wang, W.; Gordin, M.L.; Wang, D.; Choi, D. Lithium-ion batteries for stationary energy storage. JOM 2010, 62, 24–30. [Google Scholar] [CrossRef]
  7. Hannan, M.A.; Lipu, M.S.H.; Hussain, A.; Mohamed, A. A review of lithium-ion battery state of charge estimation and management system in electric vehicle applications: Challenges and recommendations. Renew. Sustain. Energy Rev. 2017, 78, 834–854. [Google Scholar] [CrossRef]
  8. Laadjal, K.; Cardoso, A. Estimation of Lithium-Ion Batteries State-Condition in Electric Vehicle Applications: Issues and State of the Art. Electronics 2021, 10, 1588. [Google Scholar] [CrossRef]
  9. Astaneh, M.; Andric, J.; Löfdahl, L.; Maggiolo, D.; Stopp, P.; Moghaddam, M.; Chapuis, M.; Ström, H. Calibration Optimization Methodology for Lithium-Ion Battery Pack Model for Electric Vehicles in Mining Applications. Energies 2020, 13, 3532. [Google Scholar] [CrossRef]
  10. Diouf, B.; Pode, R. Potential of lithium-ion batteries in renewable energy. Renew. Energy 2015, 76, 375–380. [Google Scholar] [CrossRef]
  11. Vandepaer, L.; Cloutier, J.; Amor, B. Environmental impacts of Lithium Metal Polymer and Lithium-ion stationary batteries. Renew. Sustain. Energy Rev. 2017, 78, 46–60. [Google Scholar] [CrossRef]
  12. Georgious, R.; Refaat, R.; Garcia, J.; Daoud, A.A. Review on Energy Storage Systems in Microgrids. Electronics 2021, 10, 2134. [Google Scholar] [CrossRef]
  13. Ahmadian, A.; Sedghi, M.; Elkamel, A.; Fowler, M.; Golkar, M.A. Plug-in electric vehicle batteries degradation modeling for smart grid studies: Review, assessment and conceptual framework. Renew. Sustain. Energy Rev. 2018, 81, 2609–2624. [Google Scholar] [CrossRef]
  14. Yang, Y.; Wen, J.; Shi, Y.; Zeng, J. State of Health Prediction of Lithium-Ion Batteries Based on the Discharge Voltage and Temperature. Electronics 2021, 10, 1497. [Google Scholar] [CrossRef]
  15. Lee, C.-J.; Kim, B.-K.; Kwon, M.-K.; Nam, K.; Kang, S.-W. Real-Time Prediction of Capacity Fade and Remaining Useful Life of Lithium-Ion Batteries Based on Charge/Discharge Characteristics. Electronics 2021, 10, 846. [Google Scholar] [CrossRef]
  16. Dufo-López, R.; Lujano-Rojas, J.M.; Agustín, J.L.B. Comparison of different lead–acid battery lifetime prediction models for use in simulation of stand-alone photovoltaic systems. Appl. Energy 2014, 115, 242–253. [Google Scholar] [CrossRef]
  17. Wenzl, H.; Baring-Gould, I.; Kaiser, R.; Liaw, B.Y.; Lundsager, P.; Manwell, J.; Ruddell, A.; Svoboda, V. Life prediction of batteries for selecting the technically most suitable and cost effective battery. J. Power Sour. 2005, 144, 373–384. [Google Scholar] [CrossRef]
  18. Potteau, E.; Desmettre, D.; Mattera, F.; Bach, O.; Martin, J.-L.; Malbranche, P. Results and comparison of seven accelerated cycling test procedures for the photovoltaic application. J. Power Sour. 2003, 113, 408–413. [Google Scholar] [CrossRef]
  19. Wang, C.; Srinivasan, V. Computational battery dynamics (CBD)—electrochemical/thermal coupled modeling and multi-scale modeling. J. Power Sour. 2002, 110, 364–376. [Google Scholar] [CrossRef]
  20. Barré, A.; Deguilhem, B.; Grolleau, S.; Gérard, M.; Suard, F.; Riu, D. A review on lithium-ion battery ageing mechanisms and estimations for automotive applications. J. Power Sour. 2013, 241, 680–689. [Google Scholar] [CrossRef] [Green Version]
  21. Randall, A.V.; Perkins, R.D.; Zhang, X.; Plett, G. Controls oriented reduced order modeling of solid-electrolyte interphase layer growth. J. Power Sour. 2012, 209, 282–288. [Google Scholar] [CrossRef]
  22. Tanim, T.; Rahn, C.D. Aging formula for lithium ion batteries with solid electrolyte interphase layer growth. J. Power Sour. 2015, 294, 239–247. [Google Scholar] [CrossRef]
  23. Prada, E.; Di Domenico, D.; Creff, Y.; Bernard, J.C.; Sauvant-Moynot, V.; Huet, F. Simplified Electrochemical and Thermal Model of LiFePO4-Graphite Li-Ion Batteries for Fast Charge Applications. J. Electrochem. Soc. 2012, 159, A1508–A1519. [Google Scholar] [CrossRef] [Green Version]
  24. Ashwin, T.; Chung, Y.M.; Wang, J. Capacity fade modelling of lithium-ion battery under cyclic loading conditions. J. Power Sour. 2016, 328, 586–598. [Google Scholar] [CrossRef] [Green Version]
  25. Weißhar, B.; Bessler, W.G. Model-based lifetime prediction of an LFP/graphite lithium-ion battery in a stationary photovoltaic battery system. J. Energy Storage 2017, 14, 179–191. [Google Scholar] [CrossRef]
  26. Redondo-Iglesias, E.; Venet, P.; Pelissier, S. Eyring acceleration model for predicting calendar ageing of lithium-ion batteries. J. Energy Storage 2017, 13, 176–183. [Google Scholar] [CrossRef] [Green Version]
  27. Leng, F.; Wei, Z.; Tan, C.M.; Yazami, R. Hierarchical degradation processes in lithium-ion batteries during ageing. Electrochim. Acta 2017, 256, 52–62. [Google Scholar] [CrossRef]
  28. Berrueta, A.; Urtasun, A.; Ursúa, A.; Sanchis, P. A comprehensive model for lithium-ion batteries: From the physical principles to an electrical model. Energy 2018, 144, 286–300. [Google Scholar] [CrossRef] [Green Version]
  29. Yang, X.-G.; Leng, Y.; Zhang, G.; Ge, S.; Wang, C.-Y. Modeling of lithium plating induced aging of lithium-ion batteries: Transition from linear to nonlinear aging. J. Power Sour. 2017, 360, 28–40. [Google Scholar] [CrossRef]
  30. Yi, J.; Koo, B.; Shin, C.B.; Han, T.; Park, S. Modeling the effect of aging on the electrical and thermal behaviors of a lithium-ion battery during constant current charge and discharge cycling. Comput. Chem. Eng. 2017, 99, 31–39. [Google Scholar] [CrossRef]
  31. Mu, H.; Xiong, R.; Zheng, H.; Chang, Y.; Chen, Z. A novel fractional order model based state-of-charge estimation method for lithium-ion battery. Appl. Energy 2017, 207, 384–393. [Google Scholar] [CrossRef]
  32. Böttiger, M.; Paulitschke, M.; Bocklisch, T. Systematic experimental pulse test investigation for parameter identification of an equivalent based lithium-ion battery model. Energy Procedia 2017, 135, 337–346. [Google Scholar] [CrossRef]
  33. Ghalkhani, M.; Bahiraei, F.; Nazri, G.-A.; Saif, M. Electrochemical–Thermal Model of Pouch-type Lithium-ion Batteries. Electrochim. Acta 2017, 247, 569–587. [Google Scholar] [CrossRef]
  34. Cui, Y.; Yang, J.; Du, C.; Zuo, P.; Gao, Y.; Cheng, X.; Ma, Y.; Yin, G. Prediction Model and Principle of End-of-Life Threshold for Lithium Ion Batteries Based on Open Circuit Voltage Drifts. Electrochim. Acta 2017, 255, 83–91. [Google Scholar] [CrossRef]
  35. Chu, Z.; Feng, X.; Lu, L.; Li, J.; Han, X.; Ouyang, M. Non-destructive fast charging algorithm of lithium-ion batteries based on the control-oriented electrochemical model. Appl. Energy 2017, 204, 1240–1250. [Google Scholar] [CrossRef]
  36. Bahiraei, F.; Fartaj, A.; Nazri, G.-A. Electrochemical-thermal Modeling to Evaluate Active Thermal Management of a Lithium-ion Battery Module. Electrochim. Acta 2017, 254, 59–71. [Google Scholar] [CrossRef]
  37. Di Domenico, D.; Stefanopoulou, A.; Fiengo, G. Lithium-Ion Battery State of Charge and Critical Surface Charge Estimation Using an Electrochemical Model-Based Extended Kalman Filter. J. Dyn. Syst. Meas. Control 2010, 132, 61302–61311. [Google Scholar] [CrossRef]
  38. Smith, K.; Wang, C.-Y. Solid-state diffusion limitations on pulse operation of a lithium ion cell for hybrid electric vehicles. J. Power Sour. 2006, 161, 628–639. [Google Scholar] [CrossRef]
  39. Doyle, C. Design and Simulation of Lithium Rechargeable Batteries; University of California: Los Angeles, CA, USA, 2010. [Google Scholar]
  40. Astaneh, M.; Dufo-López, R.; Roshandel, R.; Golzar, F.; Bernal-Agustín, J.L. A computationally efficient Li-ion electrochemical battery model for long-term analysis of stand-alone renewable energy systems. J. Energy Storage 2018, 17, 93–101. [Google Scholar] [CrossRef]
  41. Gu, W.B.; Wang, C.Y. Thermal-Electrochemical Modeling of Battery Systems. J. Electrochem. Soc. 2000, 147, 2910–2922. [Google Scholar] [CrossRef]
  42. Safari, M.; Delacourt, C. Modeling of a Commercial Graphite/LiFePO4 Cell. J. Electrochem. Soc. 2011, 158, A562–A571. [Google Scholar] [CrossRef]
  43. Prada, E.; Di Domenico, D.; Creff, Y.; Bernard, J.; Sauvant-Moynot, V.; Huet, F. A Simplified Electrochemical and Thermal Aging Model of LiFePO4-Graphite Li-ion Batteries: Power and Capacity Fade Simulations. J. Electrochem. Soc. 2013, 160, A616–A628. [Google Scholar] [CrossRef] [Green Version]
  44. Ramadass, P.; Haran, B.; Gomadam, P.M.; White, R.; Popov, B.N. Development of First Principles Capacity Fade Model for Li-Ion Cells. J. Electrochem. Soc. 2004, 151, A196–A203. [Google Scholar] [CrossRef]
  45. Wang, J.; Liu, P.; Hicks-Garner, J.; Sherman, E.; Soukiazian, S.; Verbrugge, M.; Tataria, H.; Musser, J.; Finamore, P. Cycle-life model for graphite-LiFePO4 cells. J. Power Sour. 2011, 196, 3942–3948. [Google Scholar] [CrossRef]
  46. Srinivasan, V.; Wang, C.Y. Analysis of Electrochemical and Thermal Behavior of Li-Ion Cells. J. Electrochem. Soc. 2003, 150, A98–A106. [Google Scholar] [CrossRef] [Green Version]
  47. Tanim, T.R. Lithium Ion Battery Modeling, Estimation, and Aging for Hybrid Electric Vehicle Applications; The Pennsylvania State University: State College, PA, USA, 2015. [Google Scholar]
  48. Gerver, R.E.; Meyers, J.P. Three-Dimensional Modeling of Electrochemical Performance and Heat Generation of Lithium-Ion Batteries in Tabbed Planar Configurations. J. Electrochem. Soc. 2011, 158, A835–A843. [Google Scholar] [CrossRef]
  49. Forgez, C.; Do, D.V.; Friedrich, G.; Morcrette, M.; Delacourt, C. Thermal modeling of a cylindrical LiFePO4/graphite lithium-ion battery. J. Power Sour. 2010, 195, 2961–2968. [Google Scholar] [CrossRef]
  50. Masters, G.M. Renewable and Efficient Electric Power Systems, 2nd ed.; John Wiley & Sons, Inc.: Hoboken, NJ, USA, 2004. [Google Scholar]
  51. Safari, M.; Delacourt, C. Aging of a Commercial Graphite/LiFePO4 Cell. J. Electrochem. Soc. 2011, 158, A1123–A1135. [Google Scholar] [CrossRef]
Figure 1. Energy flow diagram for the problem under investigation.
Electronics 10 02582 g001
Figure 2. Multiphysics solution procedure for PV-battery system sizing and cell performance assessment. (a): The interaction between the system and the cell models. (b): The interconnection between different equations building the cell lifetime prediction model.
Electronics 10 02582 g002
Figure 3. The cell electrochemical and thermal aging model validation.
Electronics 10 02582 g003
Figure 4. Simulation results for the PV-battery system for the residential house electricity demand in Mahabad for the first control strategy. (a): Simulation during the whole battery lifetime; (b): Simulation for the first year of the battery lifetime; (c): Detailed PV-battery system performance during 1st–3rd of July; and (d): Detailed PV-battery system performance during 25th–27th of December.
Electronics 10 02582 g004
Figure 5. Simulation results for the PV-battery system for the residential house electricity demand in Mahabad for the second control strategy. (a): Simulation during the whole battery lifetime; (b): Simulation for the first year of the battery lifetime; (c): Detailed PV-battery system performance during 1st–3rd of July; and (d): Detailed PV-battery system performance during 25th–27th of December.
Electronics 10 02582 g005
Figure 6. Yearly capacity loss for the two control strategies for the residential house electricity demand in Mahabad.
Electronics 10 02582 g006
Figure 7. Simulation results for the PV-battery system for the demanded lighting load for a greenhouse in Mahabad for the first control strategy. (a): Simulation during the whole battery lifetime; (b): Simulation for the first year of the battery lifetime; (c): Detailed PV-battery system performance during 1st–3rd of July; and (d): Detailed PV-battery system performance during 25th–27th of December.
Electronics 10 02582 g007
Figure 8. Simulation results for the PV-battery system for the demanded lighting load for a greenhouse in Mahabad for the second control strategy. (a): Simulation during the whole battery lifetime; (b): Simulation for the first year of the battery lifetime; (c): Detailed PV-battery system performance during 1st–3rd of July; and (d): Detailed PV-battery system performance during 25th–27th of December.
Electronics 10 02582 g008
Figure 9. Yearly capacity loss for the two control strategies for the greenhouse demanded lighting load in Mahabad.
Electronics 10 02582 g009
Figure 10. Simulation results for the PV-battery system for the residential house electricity demand in Yazd for the first control strategy. (a): Simulation during the whole battery lifetime; (b): Simulation for the first year of the battery lifetime; (c): Detailed PV-battery system performance during 1st–3rd of July; and (d): Detailed PV-battery system performance during 25th–27th of December.
Electronics 10 02582 g010
Figure 11. Simulation results for the PV-battery system for the residential house electricity demand in Yazd for the second control strategy. (a): Simulation during the whole battery lifetime; (b): Simulation for the first year of the battery lifetime; (c): Detailed PV-battery system performance during 1st–3rd of July; (d): Detailed PV-battery system performance during 25th–27th of December.
Electronics 10 02582 g011
Figure 12. Yearly capacity loss for the two control strategies for the residential house electricity demand in Yazd.
Electronics 10 02582 g012
Figure 13. Simulation results for the PV-battery system for the demanded lighting load for a greenhouse in Yazd for the first control strategy. (a): Simulation during the whole battery lifetime; (b): Simulation for the first year of the battery lifetime; (c): Detailed PV-battery system performance during 1st–3rd of July; and (d): Detailed PV-battery system performance during 25th–27th of December.
Electronics 10 02582 g013
Figure 14. Simulation results for the PV-battery system for the demanded lighting load for a greenhouse in Yazd for the second control strategy. (a): Simulation during the whole battery lifetime; (b): Simulation for the first year of the battery lifetime; (c): Detailed PV-battery system performance during 1st–3rd of July; and (d): Detailed PV-battery system performance during 25th–27th of December.
Electronics 10 02582 g014aElectronics 10 02582 g014b
Figure 15. Yearly capacity loss for the two control strategies for the greenhouse demanded lighting load in Yazd.
Electronics 10 02582 g015
Figure 16. The effect of charge/discharge patterns and control strategy on battery lifespan.
Electronics 10 02582 g016
Table 1. Literature survey to investigate Li-ion battery aging mechanisms, estimations, and their application.
AuthorAging Model TypeModel ApplicationDescription
Wang and Srinivasan [19]Computational battery dynamics (CBD)Electric vehicles (EVs) and hybrid electric vehicles (HEVs)Coupling simulation of the thermal and electrochemical behavior of cells
Barré et al. [20] Detailed electrochemical approach to statistical methods based on dataAutomotive applicationsRenewing a summary of techniques, models, and algorithms used for Li-ion battery aging estimation (SOH, RUL)
Randall et al. [21]Physics-based PDE modelBattery management systems (BMS)Developing a comprehensive cell degradation model by deriving a model of the growth process of the solid-electrolyte interphase (SEI) layer
Tanim et al. [22]Nonlinear, electrolyte-enhanced, single particle model (NESPM)Hybrid Electric Vehicle (HEV)Deriving an electrolyte-enhanced, single particle model (NESPM) that includes aging caused by solid electrolyte interphase layer growth
Prada et al. [23] Simplified electrochemical and thermal modelBattery management systems (BMS)Integrating the main design
parameters of Li-ion and its partial differential equations mathematical structure and comprehensive aging investigations
Ashwin et al. [24] Pseudo two-dimensional (P2D) electrochemical lithium-ion battery modelHybrid electric vehicles (HEV), plug-in electric vehicles (PEV)Analyzing the capacity fade under cyclic charge/discharge conditions
Weißhar and Bessler [25] Multiscale multiphysics model of a Li-ion battery Stationary photovoltaic battery systemDynamically coupling a system-level model consisting of photovoltaic (PV), inverter, load, grid interaction, and energy management system, fed with historic weather data
Redondo-Iglesias et al. [26] Battery calendar ageing based on an Eyring acceleration modelelectric vehicles (EV) and hybrid electric vehicles (HEV)Taking into account the SOCdrift during calendar aging tests
Leng et al. [27] Electrochemical based electrical (ECBE) modelbattery-powered hybrid/electric
vehicles (HEV/EV)
Developing a Li-ion battery model link the model parameters to specific aging mechanisms
Berrueta et al. [28] Physical-based electrical model of a lithium-ion batteryE-mobility and renewable energy-based systemsProposing an equivalent circuit model to keep a straight correlation between its parameters and the electrochemical battery principles
Yang et al. [29] Physics-based Li-ion battery (LIB) aging model Electric vehicles (EVs)Accounting for both lithium plating and solid electrolyte interphase (SEI) growth
Yi et al. [30] Physical-based model of a lithium-ion batteryHybrid electric vehicles (HEV)Reporting a two-dimensional modeling to predict the aging effect on the variation of the electrical and thermal behaviors of a lithium-ion battery
Mu et al. [31] Fractional order impedance modelElectric vehicles (EVs)Improving the state of charge estimation accuracy
Bottiger et al. [32] Equivalent circuit based Li-ion battery modelGeneralSimulation model for the static and dynamic behavior of lithium-ion battery systems
Ghalkhani et al. [33] Three-dimensional layer structure of a pouch-type cellElectric vehicles (EVs)Investigating the distribution of temperature and current density across the pouch type lithium-ion battery
Cui et al. [34] Generic equivalent circuit model (ECM)Electric vehicles (EVs)Analyzing the reason for the EOL threshold of a LIB with shallow depth of discharge
Chu et al. [35] Control-oriented electrochemical modelElectric vehicles (EVs)Proposing a novel, non-destructive model-based fast charging algorithm
Bahiraei et al. [36]Electrochemical-thermal model coupled to
conjugate heat transfer and fluid dynamics
Hybrid electric and full electric vehicles (HEV and EV)Investigating the effects of various operating and design parameters on the thermal performance of a battery module
Table 3. Electrochemical-aging model governing equations.
ExplanationFormulationEquation NumberRef.
Total local volumetric current density of the anode j L i ( t ) = I ( t ) A δ n = j n l ( t ) + j n s ( t ) (10)[44]
Parasitic reaction’s current density j n s ( t ) = a s , n i 0 , s ( T ) e x p ( F ( U n ( t ) U r e f , s ) 2 R T ( t ) ) × e x p ( s i n h 1 ( I ( t ) A δ n j n s ( t ) 2 a s , n i 0 , n ) ) (11)[21]
Capacity loss Q l o s s t = 0 δ n j n s A d z (12)[22]
Impedance rise δ f t = M f a s , n ρ f F j n s (13)[22]
Electrochemical-aging voltage V ( t ) = U p ( t ) U n ( t ) + R T ( t ) α F l n ( ξ p ( t ) + ξ p 2 ( t ) + 1 ξ n ( t ) + ξ n 2 ( t ) + 1 ) I ( t ) 2 A ( δ n κ n e f f + 2 δ s e p κ s e p e f f + δ p κ p e f f ) R c A I ( t ) R f ( t ) A δ n a s , n I ( t ) (14)This work
State of charge S O C c e l l ( t ) = x n ( t ) x n , 0 % x n , 100 % x n , 0 % (15)[23]
Table 4. Thermo-electrochemical-aging model governing equations.
Explanation FormulationEquation NumberRef.
Arrhenius’s law ψ ( T ) = ψ r e f e x p ( E a ( ψ ) R ( 1 T r e f 1 T ) ) (16)[22]
Temperature effect on open circuit voltage U = U r e f + ( T T r e f ) d U d T (17)[48]
dU/dT d U d T ( mV K 1 ) = 24.137 × S O C 6 66.392 × S O C 5 + 72.066 × S O C 4 39.185 × S O C 3 + 9.8703 × S O C 2 + 0.0208 × S O C 0.3076 (18)[49]
Thermo- electrochemical-aging voltage V ( t ) = U p ( t ) U n ( t ) + ( T ( t ) T r e f ) d U d T + R T ( t ) α F l n ( ξ p ( t ) + ξ p 2 ( t ) + 1 ξ n ( t ) + ξ n 2 ( t ) + 1 ) I ( t ) 2 A ( δ n κ n e f f + 2 δ s e p κ s e p e f f + δ p κ p e f f ) R c A I ( t ) R f ( t ) A δ n a s , n I ( t ) (19)This work
Table 5. Design parameters for the PV-battery system for the residential house electricity demand in Mahabad.
ParameterValue
PV panels in parallel22
PV panels in series4
PV nominal power (W)120
Parallel connected battery cells1352
Serially connected battery cells 16
Cell initial energy (Wh)6.9
Table 6. Design parameters for PV-battery system for the demanded lighting load for a greenhouse in Mahabad.
Design ParameterValue
PV panels in parallel24
PV panels in series4
PV nominal power (W)120
Parallel connected battery cells 1354
Serially connected battery cells16
Cell initial energy (Wh)6.9
Publisher’s Note: MDPI stays neutral with regard to jurisdictional claims in published maps and institutional affiliations.

