Article

Social Welfare Maximization of Competitive Congested Power Market Considering Wind Farm and Pumped Hydroelectric Storage System

1
Department of Electrical & Electronics Engineering, Velagapudi Ramakrishna Siddhartha Engineering College, Vijayawada 520007, India
2
Department of Electrical Engineering, Mizoram University, Aizawl 796004, India
3
Fukushima Renewable Energy Institute, AIST (FREA), Koriyama 963-0298, Japan
*
Author to whom correspondence should be addressed.
Electronics 2021, 10(21), 2611; https://doi.org/10.3390/electronics10212611
Submission received: 24 September 2021 / Revised: 8 October 2021 / Accepted: 23 October 2021 / Published: 26 October 2021
(This article belongs to the Section Power Electronics)

Abstract

:
The utilization of wind energy sources with energy storage systems has been increased in the power sector to satisfy the consumer’s energy demand with minimum price. This paper presents the impact of a wind farm (WF) and pumped hydroelectric storage (PHS) system in the competitive electricity market under a congested transmission system. The PHS system is used to compensate for the deviation of WF generation in the real-time electricity market. To investigate the impact of the proposed method, initially, the market-clearing power problem is solved without consideration of WF and PHS systems, and again it is solved with the WF and PHS systems. The optimal location of the WF and PHS systems is decided by the bus sensitivity factor (BSF) of these systems. The analysis is carried out by using generator sensitivity factor (GSF) with the help of the moth flame optimization (MFO) algorithm and thereby calculating market clearing price (MCP) and market clearing volume (MCV). The MFO algorithm is used here for the first time for solving the congested market-clearing power problem with the integration of WF and PHS systems under deregulated environment. The presented approach shows the improvement of social welfare after the placement of WF and PHS in the congested deregulated system. Modified IEEE 30 bus system is used to solve the market-clearing power problem and results obtained from the MFO algorithm are compared with the firefly algorithm (FA). Three different real-time wind speed data have been considered here to verify the proposed approach with uncertainty and the continuously changing nature of wind flow. It is discovered that social welfare is improved with the quantity addition of wind power, regardless of optimization techniques.

1. Introduction

Presently, the integration of wind power in the power sector has been increased drastically for its eco-friendly behavior. For the uncertainty of wind power, the deregulated power system is facing a lot of problems viz. voltage variation, voltage fluctuation, harmonics, fault, thermal overload, etc. To mitigate some of this problem, wind farms as storage systems have been employed in the last few years. The use of a storage device minimizes the imbalance of wind power generation and it also minimizes the penalty imposed by the grid. Different types of storage devices include pumped hydroelectric storage (PHS) systems, compressed air energy storage (CAES) systems, batteries, fuel cells, flywheel super-capacitors, etc. The characteristics and applications of the storage systems are extensively studied in [1]. Among other storage systems used so far in power systems, the pumped storage hydro system is one of the matured storage systems in modern power systems [2]. To integrate wind power in the electricity market, lots of research work has been carried out with the combination of hydro generation and wind power generation. In [3], the authors combined wind generation with hydro generation to present the bidding and operation strategy of wind generation in the power market. In an electricity market, two-stage stochastic optimization problems with wind power and hydro pumped storage have been studied in [4]. Wind power and pumped storage devices are used in the bilateral and day-ahead electricity market to sell wind energy in the electricity market [5].
The characteristic of the deregulated electricity market is to compete among the different market participants present in the electricity market. The system operator tries to utilize the maximum available resource in the market so that all the market participants will get the maximum benefit from the market. The market is an environment in the electricity sector where power/energy can be sold and bought by the different market participants (here, states act as different market entities) under the control of the system operator. It is a tough job for the system operator to ensure reliable congestion-free transmission under these circumstances. Some of the available congestion mitigation techniques are generator rescheduling [6], load shedding [7], zonal approach [8,9], optimal placement of FACTS device [10,11], voltage stability [12], etc. Transmission congestion can be dealt with in wind farms [13] and pumped storage hydro units [14]. The application of the bacteria foraging optimization (BFO) algorithm in a double-sided bidding market under transmission congestion is proposed to maximize the supplier’s profit [15]. In [16], the authors presented the congestion management issues and challenges in the deregulated electricity markets. In [17], an efficient Flower pollination algorithm has been used for real power rescheduling of generators for transmission congestion management in a pool-based electricity market. Reza Hemmati et al. [18] demonstrated congestion management by optimal scheduling of energy storage systems considering renewable energy resources. The application of hydro units with the co-ordination of thermal units to minimize congestion cost and to mitigate congestion has been proposed in [19]. The increase in transmission line flow capacity is one of the most important techniques to mitigate system congestion. FACTS devices may be applied to increase the transmission line capacity, which can reduce the transmission line congestion [20].
In recent years, plenty of research accomplishments related to bidding strategies under deregulated markets were attained [21,22,23]. By using a bidding strategy in the power market, the consumer’s payment is minimized and the seller’s profit is maximized. In a deregulated environment, marker clearing mechanism has been discussed by some researchers with considering transmission congestion in [24]. In the literature, pumped storage hydro system and wind farm bidding strategies have been studied [3,4,5,24], but they have not considered the impact of a wind farm and pumped hydro system in a competitive electricity market under a congested transmission environment. The main characteristics of wind power are the unpredictability and variability of the generation source. To handle this drawback, a pumped hydroelectric storage system [5] has been used with wind power in the deregulated electricity market.
As per the author’s knowledge, very limited work has been done by previous researchers regarding the bidding strategies in renewable integrated deregulated power systems—i.e., (a) What will be the impact of the wind farm in a congested deregulated power system? (b) What will be the effect of the wind farm and PSH hybrid system in a congested day-ahead power system? (c) How do optimal bidding strategies give advancement in social benefit in a renewable integrated system? (d) How do different optimization techniques provide better economic benefits for a congested hybrid power system?
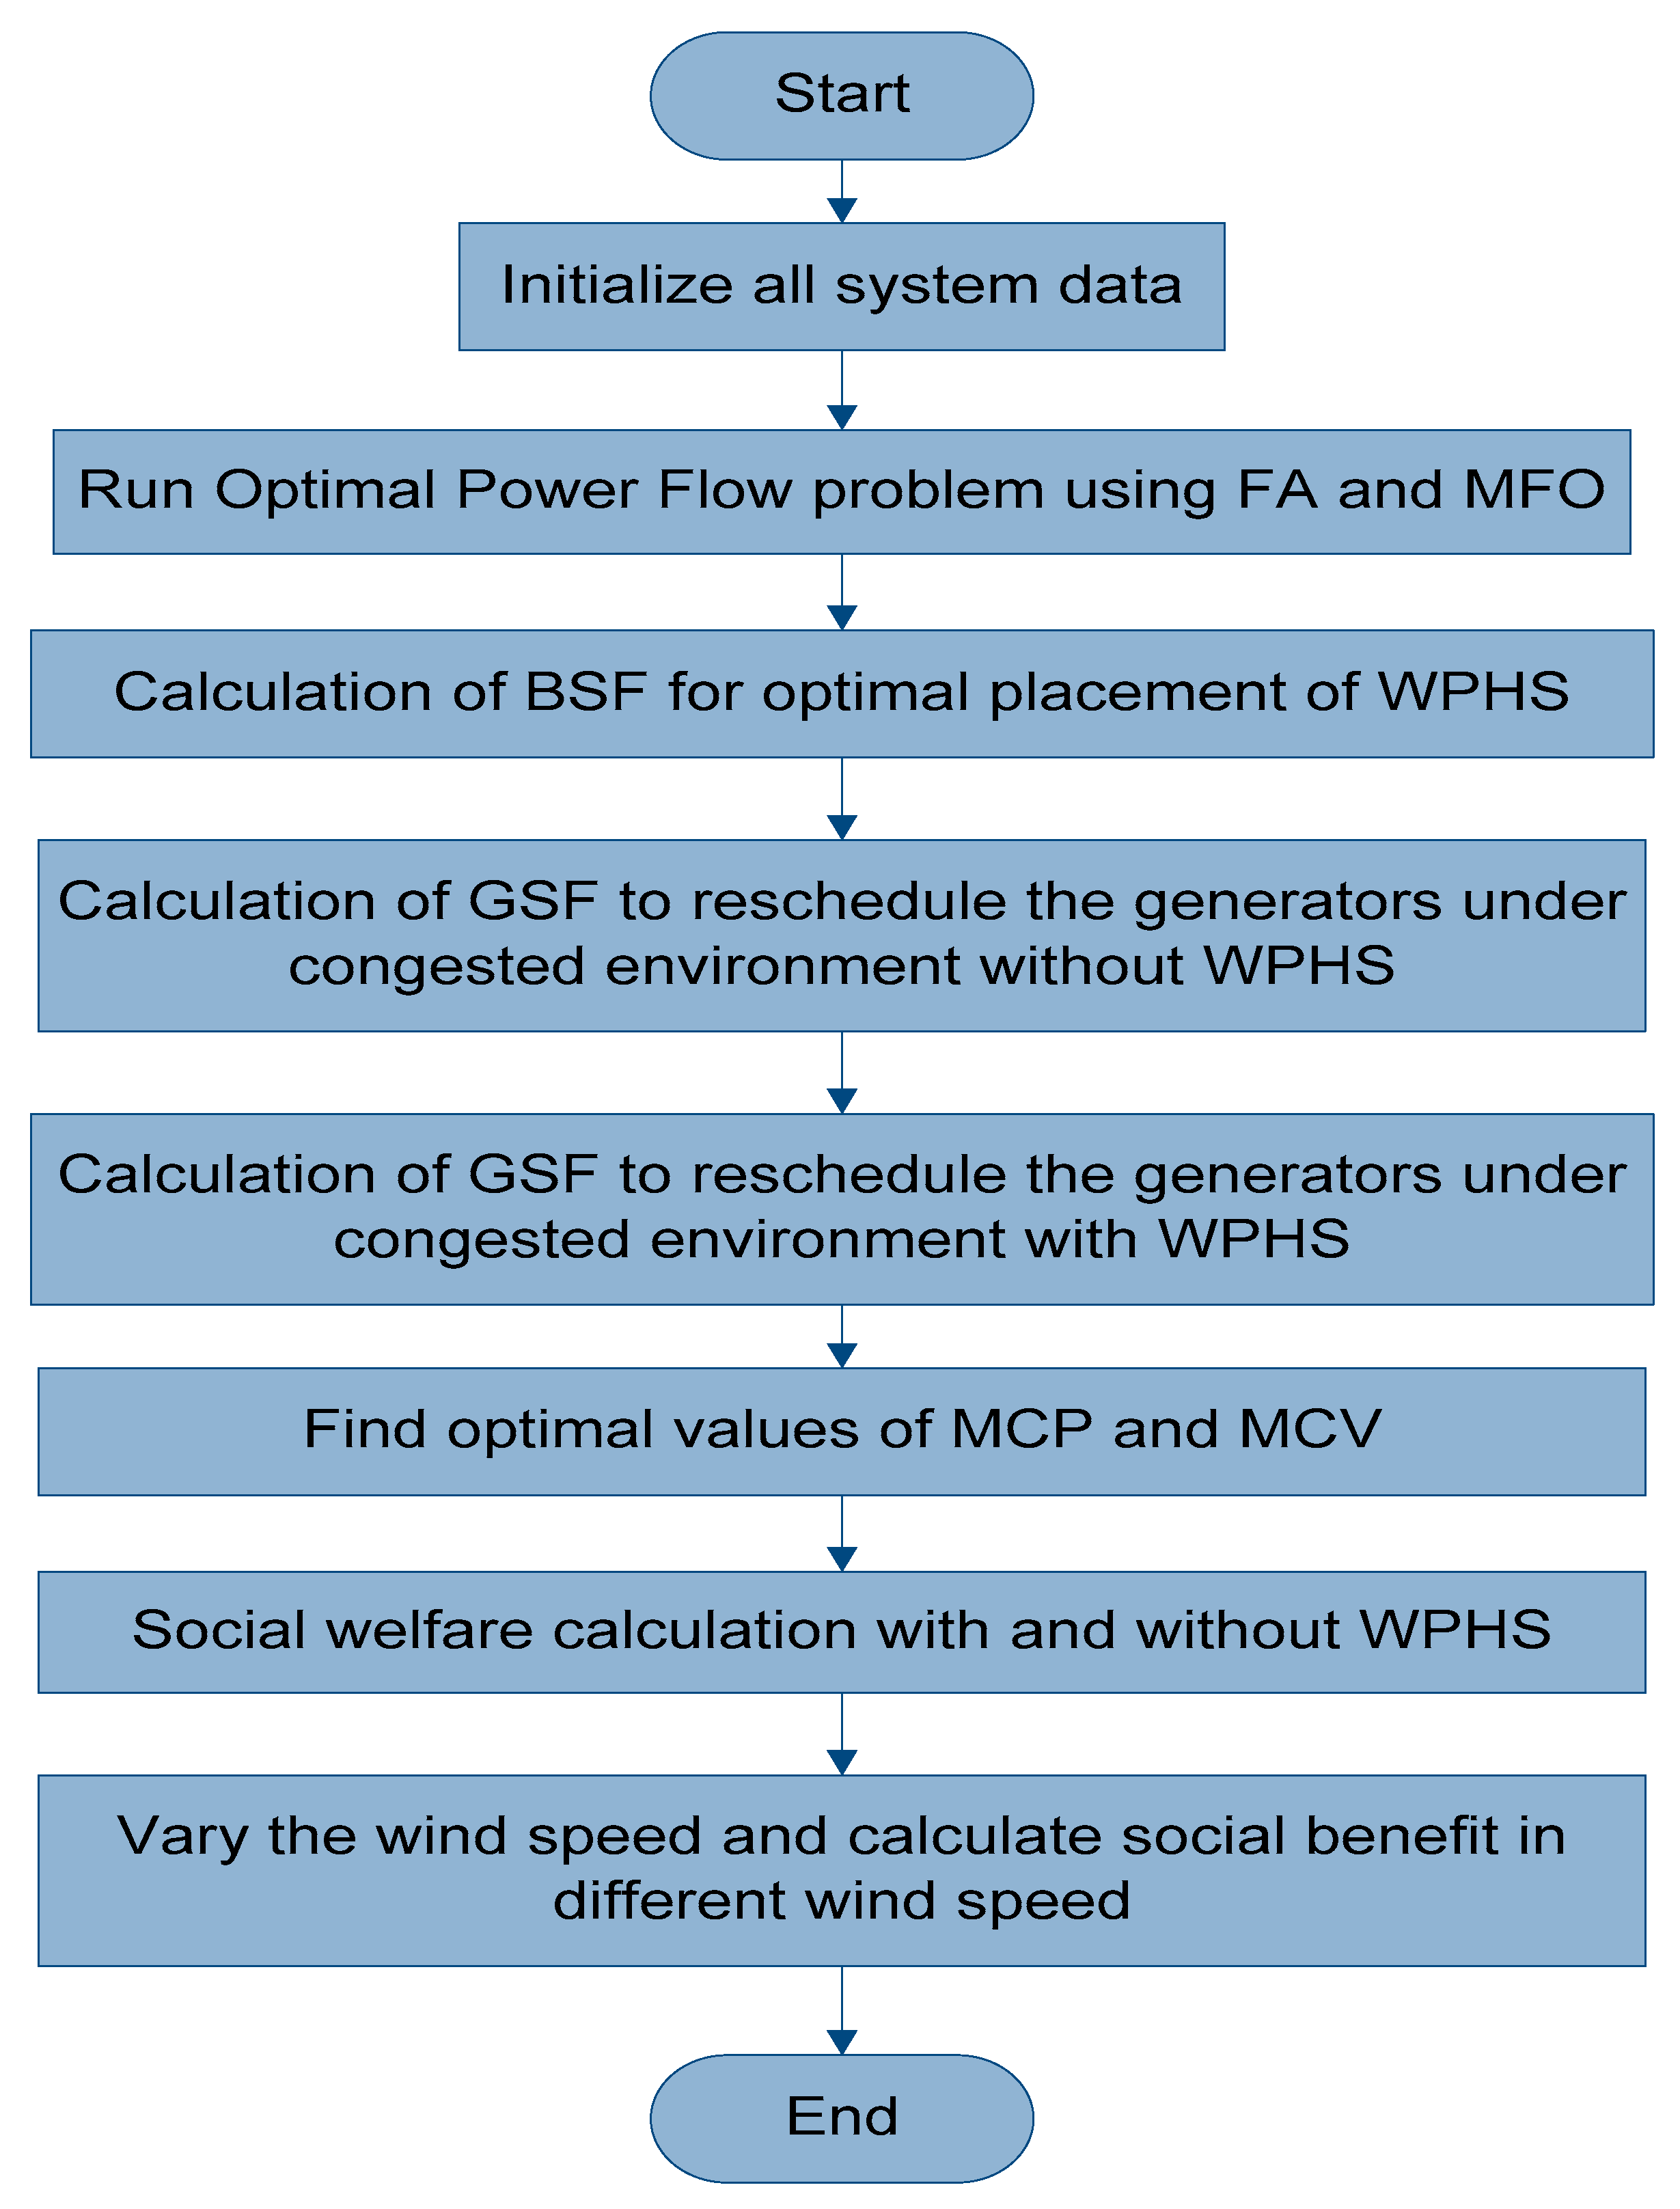
In this paper, the authors have tried to provide all feasible solutions to these questions. This paper analyzes the market clearing mechanism considering wind farm (WF) and pumped hydroelectric storage (PHS) systems under congested transmission environments. The novelty of this paper is: MFO algorithm is used for the first time in these types of congested market-clearing power problem solutions with the objective of social welfare maximization. To verify the proposed methodology, the same problem is also solved by the firefly algorithm. The impact of the WF and PHS system on social welfare in a congested deregulated system has been verified with the help of a modified IEEE 30 bus system. The highlights of this work are as follows:
  • The paper presents the impact of the wind farm (WF) and pumped hydroelectric storage system (PSH) in the competitive power market under congested transmission systems.
  • We have considered the day-ahead electricity market for our study. In this work, the wind farm is considered a secondary energy source. Therefore, wind power prediction is required for proper participating and scheduling in the electricity market. Therefore, the day-ahead electricity market has been considered here.
  • The PHS system is used to compensate for the deviation of WF generation in the electricity market. The real-time wind speed data has been considered here for checking the effectiveness of the proposed approach with considering the variable nature of wind speed.
  • The optimal location of WF and PHS system is decided by the bus sensitivity factor (BSF).
  • The analysis is carried out by using the generator sensitivity factor (GSF) with the help of the moth flame optimization (MFO) algorithm.
  • Results obtained from the MFO algorithm are compared with the firefly algorithm (FA).

2. Market Clearing Optimization Model

The model presented in this paper simulates wind power and pumped hydroelectric storage power in a deregulated power market under a congested transmission environment. This model includes a 24-h forecast and actual wind power scenario of the wind farm for every hour. The amount of demand for the scheduling period is varying (per hour basis) and is introduced by multiplying the load scaling factor with the base case load. As wind generation is highly uncertain because of uncertain wind speed, a pumped hydroelectric storage (PHS) system is considered over the entire scheduling period to maintain the uncertainties of wind power at a constant level. The PHS system consists of an upper reservoir and a lower reservoir with a reversible turbine. If the PHS system is unable to store the power beyond its maximum energy storage capacity, then dumped load consumes that excess power. At any point and time, the PHS system can operate in only one of its operating states—i.e., pumping or generating—or idle. In the proposed market-clearing power problem, it is predicted that wind farms will supply the bidding power as per the agreement between the ISO and wind pumped hydroelectric storage (WPHS) system. For any deficit or surplus of WF power as per the contractual agreement of ISO, then the PHS system will operate to compensate that power.
P w p h s t = P w t ± P p h s t t = 1 : T
where P w t is the power output of the wind farm at tth interval and P p h s t is the power generated or consumed by the pumped hydroelectric storage system. The mechanical power (watts) developed by each wind turbine at tth interval is expressed by the mathematical equation [13]:
P m t = 1 2 A S C p ( λ , β ) V w 3 t = 1 : T
where A is the density of air, S is the swept area (m2) of the turbine, Cp is the power coefficient of the wind turbine, λ is the tip speed ratio, β is the turbine blade pitch angle and Vw is the wind speed (m/s).
The proposed mathematical model uses to mitigate congestion and analysis its impact on the market-clearing price (MCP) under deregulated electricity market.
  • When there is congestion, compensation will increase due to the difference between MCP and bid price increase; hence there will be greater profits.
  • When congestion reduces, compensation will reduce due to the difference between MCP and bid price reduces; hence there will be less profit.
  • When the bidding process is finished, the system security is analyzed. If there exist security problems, curtailment must be carried out either by modifying the generator dispatch or by reducing the system load.
To find the MCP, the calculated bid price of each supplier are aggregated and sorted in ascending order curve, and bidding data of customers are aggregated and sorted in descending order curve. The bid price of each supplier is calculated using the equation
B p i t = max ( d d p C i ( P i t ) ) i G , t = 1 : T
where C i ( P i t ) is the quadratic cost curve of the ith generator unit at tth interval and it is expressed by the equation
C i ( P i t ) = b i ( P i t ) + 1 2 a i ( P i t ) 2 i G , t = 1 : T

3. Problem Formulation

The objective of this work is to maximize the social welfare of the WPHS system integrated competitive power market. The objective function (ignoring system losses) of the system is formulated in the following form:
Social welfare can be expressed by the following equation:
M a x S W t = j D B j ( D j ) i G C i ( P i t ± Δ P i t + P w p h s t ) t = 1 : T
The above problem can be solved to fulfill the following constraints:
j D D j t ± j D Δ D j t + D L t = i G P i t ± i G Δ P i t + P w p h s t t = 1 : T
P i min P i t ± Δ P i t P i max i G t = 1 : T
Δ P i min Δ P i t Δ P i max i G t = 1 : T
T L l T L l max l = 1 , 2 , 3 L
T L l lim = { T L l T L l max i f T L l T L l max i f T L l > T L l max
E p h s t = E p h s i n t t = 0 ,   E p h s t = E p h s f n l t = 24
E p h s t + 1 = E p h s t + t ( η P P p t P h t η h ) t = 1 : T
P P min P P t P P max t = 1 : T
P h min P h t P h max t = 1 : T
E p h s L E p h s t E p h s U t = 1 : T
where Equation (5) denotes the seller’s expected profit under a congested transmission system. Equation (6) shows the active power balance at each interval. Equation (7) represents the active power generation limits constraints of the generators at each interval. Equation (8) denotes the ramp limit constraints of the generator at each interval. Equation (9) is the maximum MVA flow limit constraints. Equations (11)–(15) are the constraints for a pumped hydroelectric storage system.

3.1. Bus Sensitivity Factor (BSF)

BSF is defined as the change in the active power flow in congested transmission line l connected between bus m and bus n to the change in active power injection at kth bus [13,14]. Mathematically, it is expressed as [13,14]
B S F k t = Δ P m n t Δ P k t t = 1 : T
The detailed derivations for BSF are given in [13].

3.2. Generator Sensitivity Factor (GSF)

Change in the active power flow over a transmission line l connected between bus m and bus n to the change in generator active power supply is called GSF [13,14]. Mathematically, it is expressed as [13,14]
G S F k t = Δ P m n t Δ P i t t = 1 : T
The detailed derivations for GSF are given in [13].

4. Implementation of Moth Flame Optimization (MFO)

Nature-inspired population-based MFO algorithm is proposed by Seyedali Miralili in 2015 [25]. The main inspiration for the MFO algorithm comes from the navigation method of the moon in nature. Moth travels at night by maintaining a fixed angle concerning the moon. Moths may be used as single or two or three or multi-dimensional space vectors for flying in nature [25]. Initial moth populations are randomly generated within the boundary limits of the control variable and the fitness of the moths are calculated to evaluate them for the next potential solution. The set of moths is represented by the matrix
ξ = [ ξ J 1 , 1 ξ J 1 , 2 ξ J 1 , y ξ J 2 , 1 ξ J 2 , 2 ξ J 2 , y ξ J x , 1 ξ J x , 2 ξ J x , y ]
For all the moths, fitness value is stored in matrix which is shown as
ξ f = [ ξ f 1 ξ f 2 ξ f x ]
The best position of the moth in the search space is called flame—i.e., the best solution obtained here is considered a flame. Therefore, it is a very important matrix, similar to the moth matrix which is shown here as
J ξ = [ J ξ 1 , 1 J ξ 1 , 2 J ξ 1 , y J ξ 2 , 1 J ξ 2 , 2 J ξ 2 , y J ξ x , 1 J ξ x , 2 J ξ x , y ]
To update the list of flame, the fitness value of flame is calculated and stored in the matrix
ξ f J = [ ξ f J 1 ξ f J 2 ξ f J x ]
The main difference between moth and flame are, moths are actual search agents that move around the search space, whereas flames are the best position of moths that have been obtained so far.
A detailed description of the MFO algorithm is given in [25]. To maximize the supplier’s profit and for optimal performance of the MFO algorithm, its parameters are tuned and the tuned value of parameters are, the number of moths is equal to 30, the number of variables is equal to 12, the number of iteration is equal to 300, and the random number is equal to [−1, 1]. The indicating flow chart of the proposed approach is shown in Figure 1.

5. Results and Discussion

To investigate the joint impact of WF and PHS systems in deregulated power market under the congested system, a modified IEEE 30 bus system test system is used here. The test system data is available in [26]. The detailed load requirements and marginal bid price of the load are mentioned in Table A1 in Appendix A. The model is tested for a wind farm with a maximum capacity of 50 MW and pumped hydroelectric storage minimum and maximum energy storage level is considered as 10 Mwh and 40 Mwh respectively. The initial energy level of the PHS system is considered at 80 percent of its full energy storage capacity limit. The pumping and generating efficiency is considered as 80 and 90 percent respectively. The hourly bidding price of the joint WF and PHS system is assumed as 2.5 $/Mwh. For performing market-clearing simulation, aggregated suppliers’ bidding data are sorted in ascending order curve and aggregated customer bidding data are sorted in descending order curve.
Initially, actual and forecasted wind farm power for 24 scheduling periods is assumed and is shown in Figure 2. Depending on the predicted wind farm power, contracted WF and PHS system power is decided. Based on the contracted and actual wind farm power, the operation of PHS is decided—i.e., whether it will work as pumping or generating or idle mode. The contracted WF and PHS system power is also shown in Figure 2. Since the proposed approach is applied in a congested power system, seller profit will be reduced with the integration of WF and PHS system because with the integration of joint WF and PHS system, congestion is minimized. As a result, MCP is reduced and hence profitability of sellers is reduced.
In a congested transmission system, the system operator allows some market participants to enjoy effective market power, resulting in higher market prices. To carry out the proposed approach, 24-h active power variation is made. This is made by introducing a time-varying load scaling factor for 24 scheduling periods which is shown in Figure 3 and the actual power flow rating of lines 1–2 is 130 MVA. In the proposed analysis, the base case power flow of line (1–2) is 140.95 MVA under normal operating conditions. Thus, line 1–2 is considered here to be a congested line.
To identify the location of joint WF and PHS system, BSF is calculated for a 24 h scheduling period and some selected buses BSF value is shown in Table 1. BSF gives the knowledge about the sensitivity of the bus. A high negative BSF value means the most sensitive bus of the power system. Based on the sensitivity of the bus, the location of the joint WF and PHS system is decided at bus no. 2 as it has the maximum negative BSF value. Since bus number 2 is a generator bus, the optimal location of the joint WF and PHS system is shifted to the second priority bus of the list—i.e., bus number 3 as shown in Table 1.
To reschedule the generator under a congested system, GSF is calculated for every load case in the 24 h scheduling period. GSF for all the generators of the test system without and with joint WF and PHS systems are shown in Figure 4 and Figure 5 respectively.
From Figure 4 and Figure 5, it is observed that generators with joint WF and PHS systems have less GSF value as compared to generators without the same in the maximum interval of the scheduling period. From Figure 4 and Figure 5, it is also observed that the GSF for G22, G23, and G27 has much reduced with the integration of joint WF and PHS system compared unintegrated systems. GSF value of generator G2 maintains almost the same value in both the cases and generator G13 value reduces with the integration of joint WF and PHS system.
Reduced GSF value means less active power needs to be rescheduled to mitigate congestion in that case. Apart from other generators, slack bus generator G1 is also taking part in market-clearing power problems and congestion management work. To investigate the joint impact of the WF and PHS system in the electricity market under congested conditions, the market-clearing power problem needs to be solved. For solving this market-clearing power problem, aggregated suppliers bidding data are sorted in ascending order curves and aggregated customer bidding data are sorted in descending order curves. The intersection of two curves gives the MCP and MCV. Since the hourly basis bidding strategy is considered here, this power problem is solved in each hour of the scheduling period. In every hour, the MCP and MCV are changing according to the load demand and system stability.
Figure 6 and Figure 7 respectively show the market-clearing power solution with and without the joint WF and PHS system for 50 h intervals of the scheduling period. This is the graphical representation of market-clearing power solution. From Figure 6 and Figure 7, it is observed that MCP is reduced from 3.8504 $/MWh to 3.8137 $/MWh after integration of joint WF and PHS system under congested transmission system. MCP is reducing because MVA flow of the congested line is reducing after integration of joint WF and PHS system and adjustment active power is also reduced as the congestion is reduced. Table 2 shows the MCP and MCV of the system with and without the presence of joint WF and PHS systems. From Table 2, it is observed that MCP reduces with the integration of wind farms in each hour of the scheduling periods. Since the penetration level of joint WF and PHS system power is less, the MCV does not change in this case.
From Table 2, it can be seen that MCP is reducing with the integration of joint WF and PHS systems, but MCV does not change with the presence of the same system. MCP is reducing because MVA flow of the congested line is reducing after integration of joint WF and PHS system and adjustment active power (ΔP) value is also reduced as the congestion is reduced. As a result, consumers or buyers need to pay less price for their required energy consumption. Therefore, sellers’ profit will reduce and consumers benefit economically as the MCV does not change with the presence of the same system under a congested transmission system.
To find the MCP, the bid price of individual suppliers are calculated and Figure 8 and Figure 9 represents the bid price of generator-1 (G1), generator-2 (G2), and generator-5 (G23), generator-6 (G27) with and without the presence of joint WF and PHS system for 24-h interval. Generator-3 (G13) and generator-4 (G22) bid prices are 1.9375 $/Mwh and 3.5002 $/Mwh respectively fixed for the entire scheduling period.
The generator (G13) and generator (G22) bid prices are fixed because the generation cost of generator-3 (G13) is less compared to the other generators and the generation cost of generator-4 (G22) is more compared to the other generators. Based on the bid price of the generators, generators/suppliers are optimally dispatched in the electricity market to meet the energy demand of the buyers. After optimally dispatching the supply generation, MCP and MCV are calculated for clearing the market. If congestion is present in the system, then the generator or suppliers are rescheduled with the help of GSF to mitigate the congestion. After mitigating congestion, MCP and MCV are calculated for maximizing the social welfare in every interval of the scheduling period. Table 3 shows the social welfare with and without the presence of wind pumped hydroelectric storage (WPHS) system for 24 h scheduling period by using FA and MFO algorithms. The bid price for G1 and G2 with and without WF and PHS for a 24 h scheduling period are shown in Figure 8, whereas bid prices for G23 and G27 for 24 h scheduling period are shown in Figure 9.
Table 3 shows the suppliers profit with and without the presence of joint WF and PHS system for 24 h scheduling period by using MFO algorithm. From Table 3 it is seen that the profit of suppliers is reduced with integration of joint WF and PHS in the system. From Table 3, it is also seen that—at the 6th and 7th hour intervals—profit of sellers is the same for both the cases because—at the 6th and 7th hour intervals—no power is supplied by joint WF and PHS system.
In this work, WPHS plays a vital role in mitigating congestion and as well as improves the social welfare of the system. Power flow for a 24 h scheduling period is shown in Table 4 for congested lines 1–2. From Table 4 and Figure 10, it is observed that power flow through congested lines is reduced when WPHS is considered as compared to the post rescheduling of the system. Figure 11 shows the supplier’s convergence characteristics with and without the presence of WPHS for 50-hour intervals by using the MFO algorithm. From Figure 11, it is depicted that the integration of WPHS in the power system increases the social welfare of the overall system. From Figure 11, it is also observed that both the implemented algorithms provide almost the same social welfare.
In this work, the PHS system plays an important role in balancing the contract power of the WPHS system. The combined operation of wind and PHS system helps to reduce the uncertainty of wind power economically and minimize the congestion under a completely deregulated power market.
Figure 12 shows the operation of the pumped hydroelectric storage system for 24 h scheduling period. The operating mode of the PHS system has changed every hour of the scheduling period to fulfill the system requirements and maximize the seller’s profit. At a high-demand period, it is operated as a generator for reducing the thermal limits of the other lines in the system. Figure 11 shows the variation of PHS system power due to the unpredictable wind power variation of the system. Figure 12 also shows the energy level for a 24-h interval. From Figure 12, it is clear that in maximum hours the energy levels of the PHS system have varied between its minimum and maximum energy levels.
It is seen from the energy level diagram that, in the 17th hour interval, the reservoir reaches its maximum capacity limit. After filling up the reservoir, the dumped load is used in that interval to compensate for that excess power. In other intervals, the reservoir maintains its energy level within its energy capacity limit.
Considering the uncertain nature of the wind, three different valued real-time wind speed data have been considered to check the effectiveness of the proposed approach. Like the previous case, all the real-time wind power is combined simultaneously and repeats the same solution method. Table 5 shows the details about the real-time wind power data with ISO contract power. The PSH works as a generator when contract power is more than the actual wind power and PSH works in pumping mode for the reverse situations.
Figure 13 and Figure 14 show the social welfare comparison for different wind power using FA and MFO algorithms simultaneously. It can be concluded from the figures that social welfare is improved with the growing amount of wind power integration. These results can inspire the market players to use wind farms as electricity sources.

6. Conclusions

In this paper, the congested market-clearing power problem is solved using the MFO algorithm considering WF and PHS system integrated deregulated power system. The optimal location of the WF and PHS system is decided by the BSF value of the system. GSF is used to reschedule the generators for mitigating congestion. Results show that social welfare is increased with the integration of WF and PHS systems compared to an un-integrated system in a deregulated electricity market under a congested system. The value of MCP is compared with and without WF and PHS system integration and it shows that MCP is reduced in WF and PHS system integrated system. From the results, it is concluded that, under a congested deregulated environment, WF and PHS system integration is profitable for market participants. To validate this approach, a modified IEEE 30 bus system is used and results obtained by the MFO algorithm are compared with the firefly algorithm. From the results, it is evident that the MFO algorithm gives better results compared to the firefly algorithm. The MFO algorithm is used here for the first time to solve the congested market-clearing power problem with the integration of WF and PHS systems under a deregulated environment. It is also discovered that social welfare is improved in a wind integrated deregulated system with increasing wind power quantity.

Author Contributions

Conceptualization, S.D. and S.G.; methodology, S.D., S.G. and S.S.D.; software, S.D.; validation, S.D., S.G. and S.S.D.; formal analysis, T.S.U.; investigation, S.D.; resources, S.D., S.G., S.S.D. and T.S.U.; data curation, T.S.U.; writing—original draft preparation, S.D.; writing—review and editing, S.S.D. and T.S.U.; visualization, S.D. and S.G.; supervision, S.D.; project administration, S.D, S.G. and S.S.D.; funding acquisition, T.S.U. All authors have read and agreed to the published version of the manuscript.

Funding

There is no external funding.

Conflicts of Interest

The authors declare no conflict of interest.

Nomenclature

ΔPmntChange in active power flow between bus m and n at tth interval
ΔPktChange in active power flow in kth congested line at tth interval
PitActive power generation at tth interval
ΔPitChange in generator active power supply at tth interval
PwtWind power generation at tth interval
PprctMarket clearing price at tth interval
PvltMarket clearing volume at tth interval
BpitBid price of suppliers at tth interval
PwphstContracted wind pumped hydroelectric power at tth interval
PphstPHS system power generation or consumption at tth interval
ADensity of air
CpPower coefficient of wind turbine
βTurbine blade pitch angle
SThe swept area of the turbine
λTip speed ratio
ai, biGenerator cost co-efficient
DLtDumped load at tth interval
DjtDemand at tth interval
TLlmaxMaximum MVA flow of lth transmission line
TLllimLimiting values of transmission line
PimaxMaximum real power generation limit for each generator
PiminMinimum real power generation limit for each generator
ΔPimaxThe maximum change in active power generation limit
ΔPiminThe minimum change in active power generation limit
PthHourly active power produced by the PHS system
PtPHourly active power consumed by the PHS system
P P max Maximum active power consumption limit
P h max Maximum active power generation limit
E p h s t Hourly reservoir energy storage level
E p h s int PHS system initial reservoir energy level
ηPPumping efficiencies of PHS system
ηhGeneration efficiencies of PHS system
P P min Minimum active power consumed by PHS system
P h min Minimum active power generation by PHS system
E p h s L PHS system lower reservoir limit
E p h s U PHS system upper reservoir limit
E p h s f n l PHS system final reservoir energy level
tIndex of the hour or interval
xNumber of moths
yNumber of variables
ξ J The position vector of moth
ξ f The fitness value of moth
ξ f J The fitness value of flame
J ξ The position vector of flame

Appendix A

Table A1. Load and its marginal bid price of load entities of the modified IEEE-30 bus system.
BusBid Price ($/MWh)Bid Quantity (MW)BusBid Price ($/MWh)Bid Quantity (MW)
212.0021.70179.009.00
32.002.40183.003.20
422.0074.301910.009.50
714.0022.80201.502.20
818.0030.002115.0017.50
105.005.80233.003.20
1211.0011.20248.008.70
146.006.20264.003.50
157.008.20292.002.40
164.003.503013.0010.60

References

  1. Chen, H.; Cong, T.N.; Yang, W.; Tan, C.; Li, Y.; Ding, Y. Progress in electrical energy storage system: A critical review. Prog. Nat. Sci. 2009, 19, 291–312. [Google Scholar] [CrossRef]
  2. Klumpp, F. Comparison of pumped hydro, hydrogen storage and compressed air energy storage for integrating high shares of renewable energies—Potential, cost-comparison and ranking. J. Energy Storage 2016, 8, 119–128. [Google Scholar] [CrossRef]
  3. Angarita, J.M.; Usaola, J.G. Combining hydro generation and wind energy: Bidding and operation on electricity spot market. Electr. Power Syst. Res. 2007, 77, 393–400. [Google Scholar] [CrossRef] [Green Version]
  4. Garcia-Gonzalez, J.; de la Muela, R.M.R.; Santos, L.M.; Gonzalez, A.M. Stochastic Joint Optimization of Wind Generation and Pumped-Storage Units in an Electricity Market. IEEE Trans. Power Syst. 2008, 23, 460–468. [Google Scholar] [CrossRef]
  5. Sanchez de la Nieta, A.A.; Contreras, J.; Catalao, J.P.S. Optimal single wind hydro pump storage bidding in day-ahead markets including bilateral contracts. IEEE Trans. Sustain. Energy 2016, 7, 1284–1294. [Google Scholar] [CrossRef]
  6. Dutta, S.; Singh, S.P. Optimal rescheduling of generators for congestion management based on particle swarm optimization. IEEE Trans. Power Syst. 2008, 23, 1560–1569. [Google Scholar] [CrossRef]
  7. Shandilya, A.; Gupta, H.; Sharma, J. Method for generation rescheduling and load shedding to alleviate line overloads using local optimization. IEEE Proc. C-Gener. Transm. Distrib. 1993, 140, 337–342. [Google Scholar] [CrossRef]
  8. Kumar, A.; Srivastava, S.C.; Singh, S.N. A zonal congestion management approach using real and reactive power rescheduling. IEEE Trans. Power Syst. 2004, 19, 554–562. [Google Scholar] [CrossRef]
  9. Kumar, A.; Srivastava, S.C.; Singh, S.N. A zonal congestion management approach using ac transmission congestion distribution factors. Electr. Power Syst. Res. 2004, 72, 85–93. [Google Scholar] [CrossRef]
  10. Tiwari, P.K.; Mishra, M.K.; Dawn, S. A two step approach for improvement of economic profit and emission with congestion management in hybrid competitive power market. Int. J. Electr. Power Energy Syst. 2019, 110, 548–564. [Google Scholar] [CrossRef]
  11. Kumar, A.; Sekhar, C. Congestion management with FACTS devices in deregulated electricity markets ensuring loadability limit. Int. J. Electr. Power Energy Syst. 2013, 46, 258–273. [Google Scholar] [CrossRef]
  12. Yesuratnam, G.; Thukaram, D. Congestion management in open access based on relative electrical distances using voltage stability criteria. Electr. Power Syst. Res. 2007, 77, 1608–1618. [Google Scholar] [CrossRef]
  13. Deb, S.; Gope, S.; Goswami, A.K. Congestion Management Considering Wind Energy Sources Using Evolutionary Algorithm. Electr. Power Compon. Syst. 2015, 43, 723–732. [Google Scholar] [CrossRef]
  14. Gope, S.; Goswami, A.K.; Tiwari, P.K.; Deb, S. Rescheduling of real power for congestion management with integration of pumped storage hydro unit using firefly algorithm. Int. J. Electr. Power Energy Syst. 2016, 83, 434–442. [Google Scholar] [CrossRef]
  15. Jain, A.K.; Srivastava, S.C.; Singh, S.N.; Srivastava, L. Bacteria foraging optimization based bidding strategy under transmission congestion. IEEE Syst. J. 2013, 9, 141–151. [Google Scholar] [CrossRef]
  16. Narain, A.; Srivastava, S.K.; Singh, S.N. Congestion management approaches in restructured power system: Key issues and challenges. Electr. J. 2020, 33, 1–8. [Google Scholar] [CrossRef]
  17. Peesapati, R.; Yadav, V.K.; Kumar, N. Flower pollination algorithm based multi-objective congestion management considering optimal capacities of distributed generations. Energy 2018, 147, 980–994. [Google Scholar] [CrossRef]
  18. Hemmati, R.; Saboori, H.; Jirdehi, M.A. Stochastic planning and scheduling of energy storage systems for congestion management in electric power systems including renewable energy resources. Energy 2017, 133, 380–387. [Google Scholar] [CrossRef]
  19. Verma, Y.P.; Sharma, A.K. Congestion management solution under secure bilateral transactions in hybrid electricity market for hydro-thermal combination. Int. J. Electr. Power Energy Syst. 2015, 64, 398–407. [Google Scholar] [CrossRef]
  20. Gupta, M.; Kumar, V.; Banerjee, G.K.; Sharma, N.K. Mitigating Congestion in a Power System and Role of FACTS Devices. Adv. Electr. Eng. 2017, 2017, 4862428. [Google Scholar] [CrossRef] [Green Version]
  21. Shen, F.; Wu, Q.; Jin, X.; Zhou, B.; Li, C.; Xu, Y. ADMM-based market clearing and optimal flexibility bidding of distribution-level flexibility market for day-ahead congestion management of distribution networks. Int. J. Electr. Power Energy Syst. 2020, 123, 106266. [Google Scholar] [CrossRef]
  22. Schermeyer, H.; Vergara, C.; Fichtner, W. Renewable energy curtailment: A case study on today’s and tomorrow’s congestion management. Energy Policy 2018, 112, 427–436. [Google Scholar] [CrossRef]
  23. Afshar, K.; Ghiasvand, F.S.; Bigdeli, N. Optimal bidding strategy of wind power producers in pay-as-bid power markets. Renew. Energy 2018, 127, 575–586. [Google Scholar] [CrossRef]
  24. Lekshmi, R.R.; Swathy, S.; Lakshmi, B.; Sai, N.V.; Vijaykumar, V.S. Market Clearing Mechanism Considering Congestion under Deregulated Power System. Procedia Comput. Sci. 2018, 143, 686–693. [Google Scholar]
  25. Mirjalili, S. Moth Flame Optimization Algorithm—A novel nature inspired heuristic paradigm. Knowl. Based Syst. 2015, 89, 228–249. [Google Scholar] [CrossRef]
  26. Rich Christie, Power Systems Test Case Archive. Available online: https://bit.ly/3jyjnjw (accessed on 24 September 2021).
  27. Dawn, S.; Tiwari, P.K.; Goswami, A.K. An approach for efficient assessment of the performance of double auction competitive power market under variable imbalance cost due to high uncertain wind penetration. Renew. Energy 2017, 108, 230–243. [Google Scholar] [CrossRef]
Figure 1. Indicating flow chart of the proposed market-clearing power simulation problem.
Electronics 10 02611 g001
Figure 2. Actual, forecasted, and contracted wind power for 24 h scheduling period.
Electronics 10 02611 g002
Figure 3. Load scaling factor for 24 h scheduling period.
Electronics 10 02611 g003
Figure 4. GSF without joint WF and PHS system for modified IEEE 30 bus system.
Electronics 10 02611 g004
Figure 5. GSF with joint WF and PHS system for modified IEEE 30 bus system.
Electronics 10 02611 g005
Figure 6. Market clearing simulation without considering joint WF and PHS system.
Electronics 10 02611 g006
Figure 7. Market clearing simulation with joint WF and PHS system.
Electronics 10 02611 g007
Figure 8. Bid price for G1 and G2 for 24 h scheduling period.
Electronics 10 02611 g008
Figure 9. Bid price for G23 and G27 for 24 h scheduling period.
Electronics 10 02611 g009
Figure 10. Power flow in line 1–2 before and after rescheduling with and without WPHS.
Electronics 10 02611 g010
Figure 11. Comparative convergence characteristics.
Electronics 10 02611 g011
Figure 12. Pumped hydroelectric storage system operation.
Electronics 10 02611 g012
Figure 13. Comparison of social welfare using FA algorithm.
Electronics 10 02611 g013
Figure 14. Comparison of social welfare using MFO algorithm.
Electronics 10 02611 g014
Table 1. BSF for some selected bus of modified IEEE 30 bus system.
Time (h)Bus No.Bus No.Bus No.Bus No.Bus No.Bus No.Bus No.Bus No.
1231117222530
10.3838−0.9427−0.5796−0.4677−0.4429−0.4307−0.39490.2819
20.3828−0.9402−0.5775−0.4666−0.4413−0.4292−0.39320.2827
30.3819−0.937−0.5757−0.4656−0.4399−0.428−0.39180.2834
40.3812−0.9334−0.5742−0.4648−0.4388−0.427−0.39070.284
50.3802−0.9301−0.572−0.4636−0.4371−0.4255−0.38910.2848
60.3798−0.9285−0.5713−0.4633−0.4366−0.4251−0.38860.2851
70.381−0.9314−0.5737−0.4645−0.4384−0.4266−0.39030.2842
80.3838−0.9327−0.5796−0.4677−0.4429−0.4307−0.39490.2819
90.386−0.9417−0.5847−0.4707−0.447−0.4343−0.39890.28
100.3874−0.9485−0.5882−0.4727−0.4497−0.4367−0.40170.2788
110.3879−0.9506−0.5895−0.4736−0.4508−0.4377−0.40280.2784
120.3877−0.955−0.5889−0.4732−0.4503−0.4373−0.40230.2786
130.3876−0.9514−0.5887−0.4731−0.4502−0.4371−0.40210.2787
140.3875−0.9512−0.5886−0.473−0.4501−0.4371−0.4020.2787
150.387−0.9487−0.5874−0.4722−0.4491−0.4362−0.4010.2791
160.386−0.9409−0.5847−0.4707−0.447−0.4343−0.39890.28
170.3849−0.9367−0.5822−0.4692−0.445−0.4325−0.39690.2809
180.384−0.9285−0.5802−0.4681−0.4434−0.4311−0.39540.2816
190.3838−0.9427−0.5796−0.4677−0.4429−0.4307−0.39490.2819
200.3849−0.9367−0.5822−0.4692−0.445−0.4325−0.39690.2809
210.3841−0.9442−0.5804−0.4682−0.4435−0.4312−0.39550.2816
220.3855−0.9402−0.5837−0.47−0.4461−0.4335−0.3980.2804
230.3846−0.9354−0.5815−0.4688−0.4444−0.432−0.39640.2812
240.3838−0.9427−0.5796−0.4677−0.4429−0.4307−0.39490.2819
Table 2. MCP and MCV with and without joint WF and PHS systems for modified IEEE 30 bus system.
HourWith CongestionWith Congestion and Joint WF and PHS SystemHourWith CongestionWith Congestion and Joint WF and PHS System
MCPMCVMCPMCVMCPMCVMCPMCV
13.7783242.5003.7567242.500133.864276.9353.8376276.935
23.7553233.7703.7452233.770143.862276.6923.8413276.692
33.7352226.0103.7285226.010153.850272.0853.8137272.085
43.7118219.4623.7106219.462163.826262.3853.7888262.385
53.6833209.7623.6809209.762173.800252.6853.7666252.685
63.6732206.6103.6732 *206.610183.784244.9253.7427244.925
73.7074217.2803.7047 *217.280193.7783242.5003.7437242.500
83.7783242.5003.7565242.500203.804252.6853.7883252.685
93.8373262.3853.8238262.385213.787245.413.7822245.41
103.8593274.9953.8548274.995223.814258.2623.8099258.262
113.8728279.8453.8652279.845233.794250.0173.7906250.017
123.8657277.6623.8539277.662243.7783242.5003.7707242.500
* without WPHS system power.
Table 3. Social welfare with and without WPHS for 24 h scheduling period.
HourWithout WPHSWith WPHS
FAMFOFAMFO
12981.7762981.9042983.6982983.941
22877.5922877.6342879.122879.23
32785.0992785.6632786.4412786.466
42706.8662706.9962707.5232707.636
52590.4282590.5742591.0072591.168
62552.5062552.7552552.5062552.75
72680.7072680.8532680.7072680.853
82981.7762981.9042982.6112983.046
93218.8023218.8283219.3333219.571
103367.6043367.7953369.4413369.471
113424.8803424.9033426.9143426.997
123399.3583399.5193403.2683403.415
133390.3843390.5083398.7173398.823
143387.773387.9353395.8953395.909
153333.4733333.5573345.4513345.835
163218.7913218.8173229.8773229.981
173103.4363103.553114.0073114.877
183011.4973011.7233021.1113021.362
192981.7762981.9042992.3782992.499
203103.3383103.4533107.0533107.134
213016.8533016.9313017.93017.935
223169.8343169.993171.5383171.762
233072.0773072.673073.2963073.518
242981.7762981.9042983.3772983.669
Table 4. Congested line (1–2) power flow before and after rescheduling with and without WPHS.
HourLine (1–2) Power FlowHourLine (1–2) Power Flow
Before ReschedulingAfter Rescheduling Considering WPHSBefore ReschedulingAfter Rescheduling Considering WPHS
Without WPHSWith WPHSUsing FAUsing MFOWithout WPHSWith WPHSUsing FAUsing MFO
1140.95139.70128.42128.3613167.77161.79129.72128.80
2134.25133.11129.27129.2814167.58161.60129.29128.98
3128.34127.29126.65126.2015163.95155.46129.88128.75
4123.37122.91122.84122.5316156.35148.06128.97128.33
5116.06115.69115.18115.0717148.81140.70129.38128.96
6113.69113.69113.69113.6918142.81134.84128.37128.66
7121.72121.72121.72121.7219140.95133.02128.42128.36
8140.95140.21128.42128.3620148.81145.86129.10129.01
9156.35155.33129.88129.2721143.19140.35128.97128.04
10166.24164.48129.92129.4222153.14151.66129.33129.26
11170.07168.22129.93129.7423146.74145.39128.98128.77
12168.34164.96129.87129.1224140.95139.70128.42128.36
Table 5. WPHS operation based on the real-time wind speed data.
Real-Time Wind Power [27]ISO Contract Power (MW)PHS Pumping/Generating
Sl No.Wind Speed at 10 m Height (m/s)Wind Speed at 10 m Height (m/s)Wind Power (MW)
12.223.17032.42.5Generating
23.064.35926.2456Pumping
33.615.151810.3110Pumping
Publisher’s Note: MDPI stays neutral with regard to jurisdictional claims in published maps and institutional affiliations.

