1. Introduction
The security risks and destruction of ecological balance caused by forest fires have increased dramatically in recent years in terms of both frequency and scale [
1,
2,
3,
4]. The forest fire monitoring and detection is of great significance for reducing the above hazards. However, it is very laborious to rely solely on the manual monitoring and detection of forest fires. The development of science and technology has made it possible to monitor and detect forest fires automatically [
5,
6,
7].
Many researchers have been working on automatic smoke detection to reduce damages, since smoke can provide earlier clues for forest fire alarms than flames [
8,
9,
10,
11]. Many forest fire detection methods based on smoke recognition have been proposed in the past decade. The image-based forest fire smoke detection method is the most widely used [
12,
13,
14,
15,
16,
17,
18,
19]. Strictly speaking, image-based smoke detection for forest fires can be divided into three categories. The first category is to only judge whether there is forest fire smoke in an image or not, which is known as whole image forest fire smoke recognition. The second one is not only to recognize whether there is forest fire smoke, but also to indicate the locations of forest fire smoke by bounding boxes [
20]. This category is called forest fire smoke detection. The third one is to densely classify each pixel in an image, which is known as forest fire smoke segmentation.
Forest fire smoke segmentation is a far more difficult task than forest fire smoke recognition and forest fire smoke detection. It requires accurate separation of forest fire smoke components from background scenes in an image at pixel levels. Forest fire smoke segmentation outputs a mask with detailed edges, involving object classification, localization and boundary delineation. Traditional forest fire smoke segmentation methods mainly use hand-crafted features, such as forest fire smoke color, texture and motion [
21,
22,
23,
24,
25,
26,
27,
28,
29,
30,
31]. Nevertheless, it is pretty difficult to define, design or choose useful features due to large variations of forest fire smoke appearance, resulting in quite poor segmentation performance. Furthermore, some forest fire smoke segmentation methods extract dynamic features from videos [
32]; however, they are extremely unstable in cases of bad weather. Therefore, forest fire smoke segmentation from static images plays a very important role in visual monitoring and detection for forest fire smoke.
In recent years, many methods based on convolutional neural networks (CNNs) have attracted attention due to their outstanding performance in image segmentation [
33]. Semantic segmentation based on CNN, with the input of an arbitrary-size image, utilizes a set of convolutional layers, non-linear activation functions, pooling and upsampling layers to output a predicted image [
34,
35,
36,
37,
38]. Moreover, CNNs have achieved a lot of significant results in the field of vision detection of forest fire smoke [
39,
40].
For the forest fire smoke segmentation method based on CNN, it is necessary to manually label pixels which are forest fire smoke or background in all training images. However, the fuzziness, translucency, and diversified concentration of forest fire smoke make it extremely difficult to label forest fire smoke accurately, resulting in subjectivity and ambiguity for labeling forest fire smoke; thus, annotating such a training dataset has become a bottleneck in applying these models to forest fire detection.
The labeling problem is widespread in other recognition tasks based on deep learning and has been studied by many researchers [
41,
42,
43,
44,
45]. However, in the field of forest fires, the labeling problem has not been studied. This paper focuses on how to reduce the impact of the uncertainty for labeling forest fire smoke on smoke segmentation.
In order to improve the accuracy of semantic segmentation of forest fire smoke images and eliminate the impact of labeling ambiguity on the recognition results, a semantic segmentation method based on concentration weighting was first proposed in this paper. By introducing a weighted factor as a measure of the labeling uncertainty, this method can avoid treating all labeled pixels equally so as to improve the accuracy of the model. The weighted method was tested and evaluated on the forest fire smoke dataset.
2. Materials and Methods
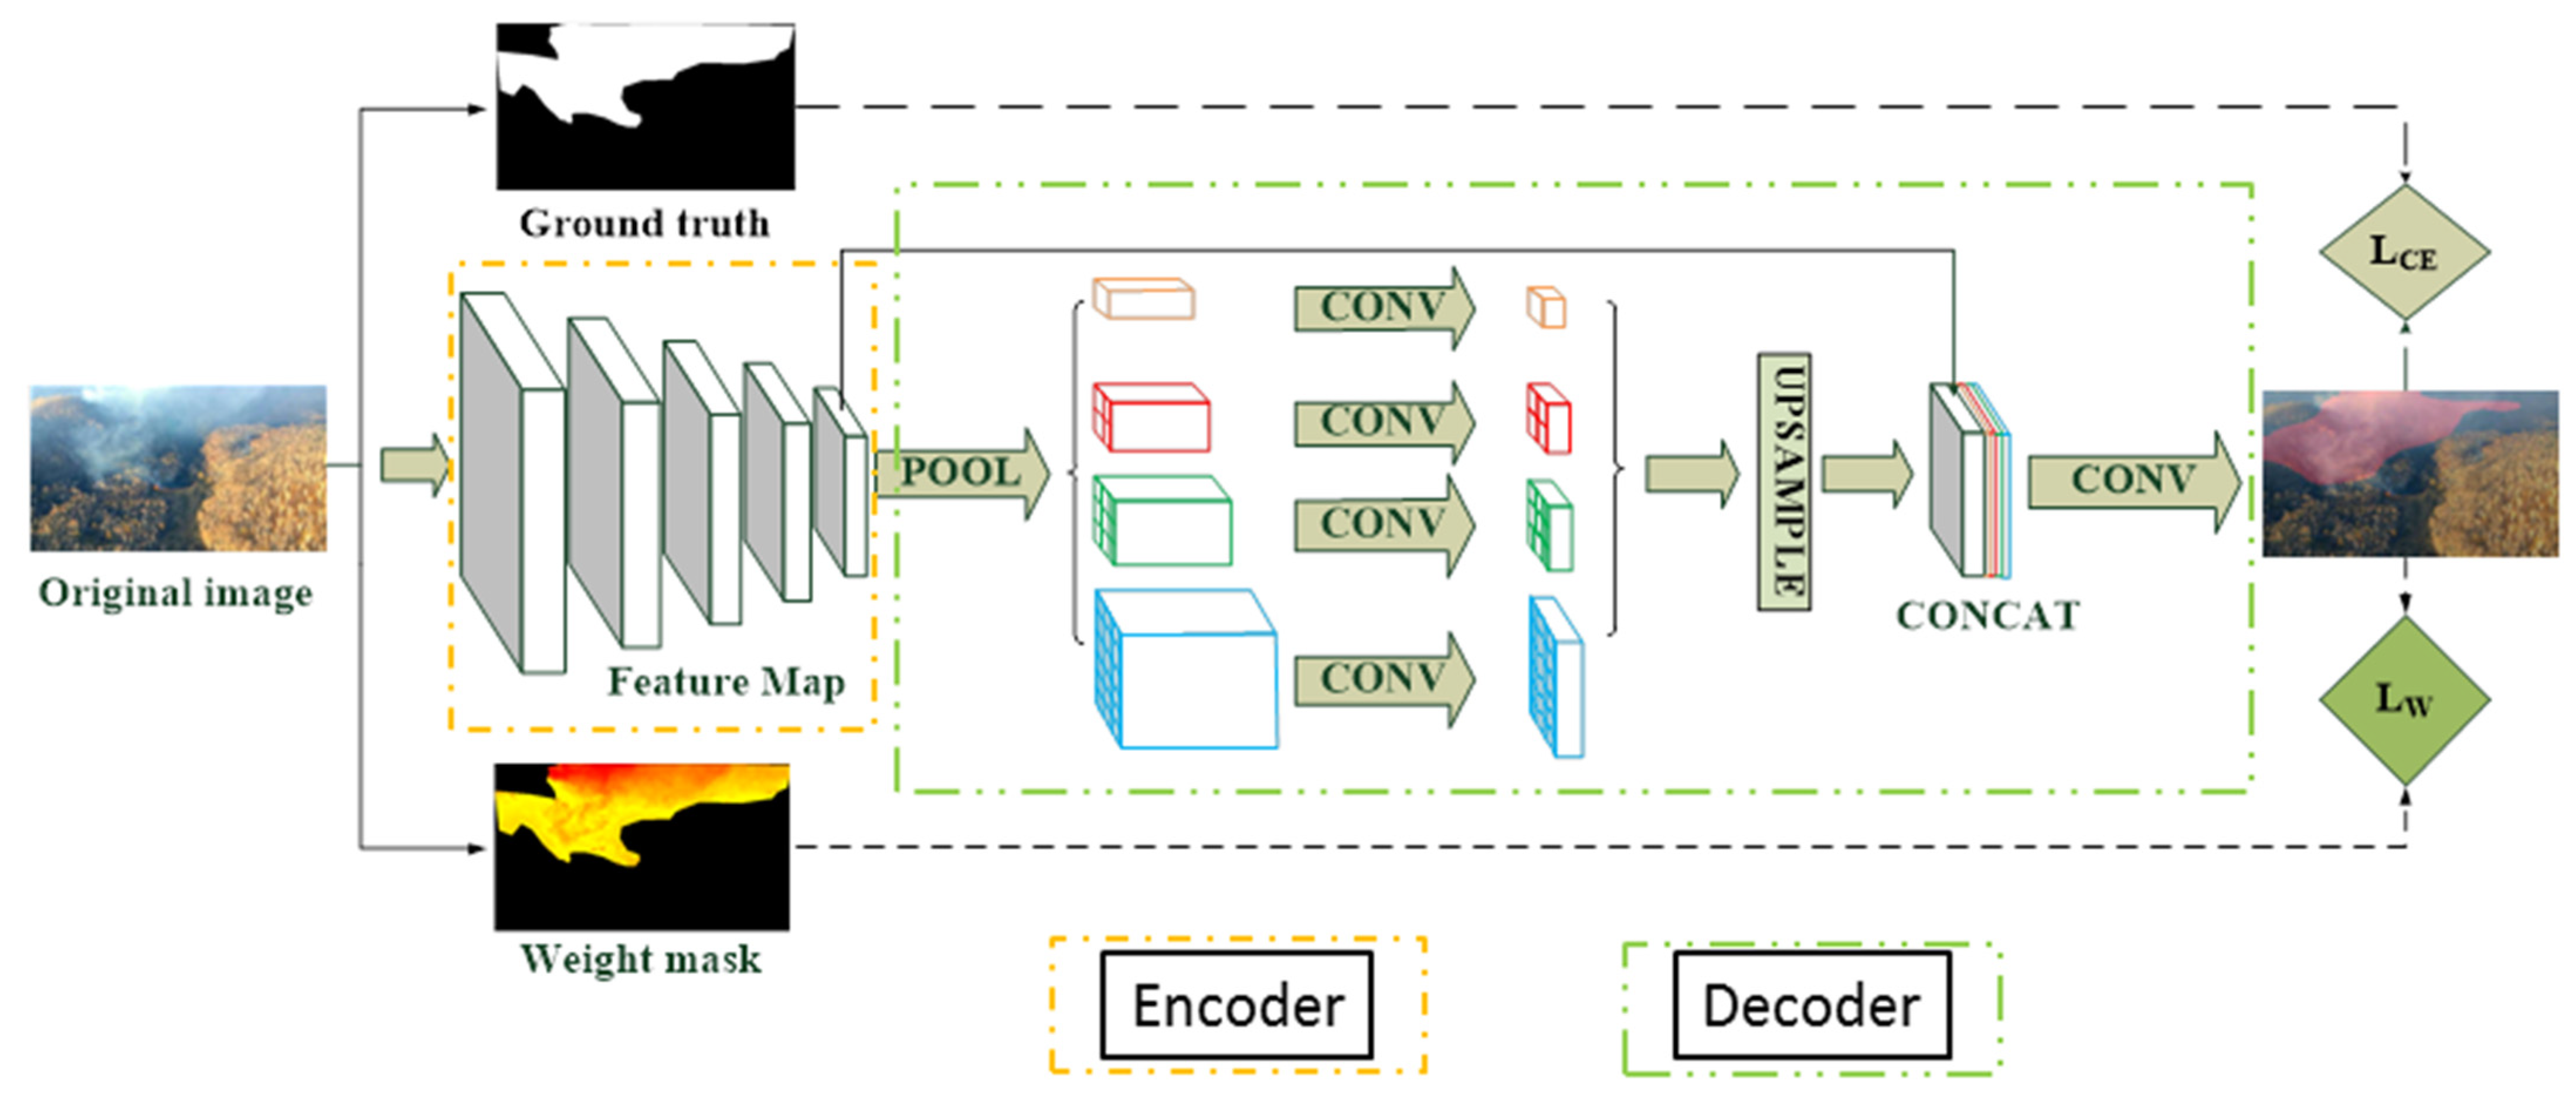
For semantic segmentation of forest fire smoke, the influence of smoke concentration was considered, and the idea of weighting was introduced in this paper. By establishing the pixel-concentration relationship of forest fire smoke in the image, the influence of the labeling ambiguity caused by non-uniform smoke diffusion would be alleviated and the recognition accuracy of forest fire smoke would be improved. The method framework of this paper is shown in
Figure 1.
2.1. Forest Fire Smoke Labeling Based on Weight
The input of the semantic segmentation network was original images and ground truth (GT) images corresponding to original images. The pixel value of the forest fire smoke pixel in GT images was labeled as 1 [
48,
49] and that of the non-forest fire smoke pixel in GT images was labeled as 0 in
Figure 2a,b. The concentration of forest fire smoke varies in pixel because of the non-uniform diffusion of forest fire smoke particles. Due to the influence of environmental factors, the concentration of smoke particles will gradually decrease in the diffusion process, which will result in blurring of the edges of the smoke image or mixing with the background such as cloud and fog to cause the uncertainty of the labeling. It is impossible to reflect this kind of uncertainty by simply labeling pixels as 1 or 0 without distinction. The misidentification of the trained network model will be caused by the inaccuracy of the labeling.
The idea of weighting in this paper is to integrate the weight into the original method in order to make the network understand that forest fire smoke is different in concentration. By introducing a weighted factor, it is used as a measure of the uncertainty of the labeled pixels to avoid treating all labeled pixels equally and to identify forest fire smoke more accurately.
The forest fire smoke concentration has a direct correlation with the smoke pixel value in the forest fire smoke image. The difference in smoke concentration in the same image is represented by the difference in smoke pixel value. For white smoke, the higher the smoke concentration, the higher the smoke pixel value in the smoke image, while the black smoke is the opposite.
Therefore, establishing the relationship between the pixel value and the concentration distribution of the forest fire smoke pixel in the image is necessary for the introduction of weight. A normalization method to establish the pixel-concentration relationship was adopted in this paper as shown in Equations (1) and (2).
where
is the pixel value of the smoke area, as shown in the white area in
Figure 2b.
is the minimum pixel value of the smoke area and
is the relative pixel value of the smoke area.
is the basic pixel-concentration coefficient and
is the maximum relative pixel value of the smoke region.
In order to discriminate between smoke, cloud, and fog, the background information of the smoke should be included in the pixel-concentration relationship. Therefore, the contrast coefficient k was introduced, as shown in Equation (3). The greater the gap between the average pixel value of the forest fire smoke area and the average pixel value of the entire image, the larger the contrast coefficient, so that it is much easier to identify the smoke area.
where
is the pixel mean of the whole image,
is the pixel mean of the smoke area,
is the pixel mean of the non-smoke area and
is the contrast coefficient. The value range of
is [0, 1], which reflects the relative distance between the pixel mean in the smoke area and the pixel mean in the whole image.
Finally, the weighted coefficient reflecting the pixel-concentration relationship is:
where
is the concentration weight. The value range of
is [1−
, 1]. The lower limit of the pixel-concentration relationship is increased for Equation (4), which can enhance the confidence of model for smoke. The weighted image is shown in
Figure 2c.
2.2. Improvement for the Loss Function
In the training process of the semantic segmentation network, when calculating the loss value, the contribution of each pixel in the smoke area to the loss value should be evaluated according to the weighted image. The improved loss function was as follows:
where
is the overall loss function,
is the cross-entropy loss function [
50,
51],
is the weighted loss function, calculating the loss between the predicted value and the weighted value, and
is the control coefficient. The proportion of the weighted part in the overall loss function was determined by the control coefficient
.
and
would be determined by experiments.
When the weighted loss was not considered, the cross-entropy loss function was used to train the network, as shown in Equation (6). When the weighted loss was considered, the idea of weighted was introduced and the loss function was Equation (5).
where
is the category label of a real image and
is the prediction probability when the corresponding category label is 1.
Since the weight was a discrete value distributed in a certain interval, calculating the weighted loss was a regression problem. The common loss functions include Mean Absolute Error Loss (
) [
52], Mean Squared Error Loss (
) [
53] and Cosine Proximity Loss (
) [
54]. On this basis, the corresponding improvements of weighted loss function were made, as shown in Equations (7)–(9).
where
N is the number of samples,
is the weight when the corresponding category label is 1.
and
are respectively named as
L1 Loss and
L2 Loss. The original
is the opposite of the cosine distance between the predicted value and the weight. Because the minimum of the original
is −1, which is not suitable to combine with other loss functions. In this paper,
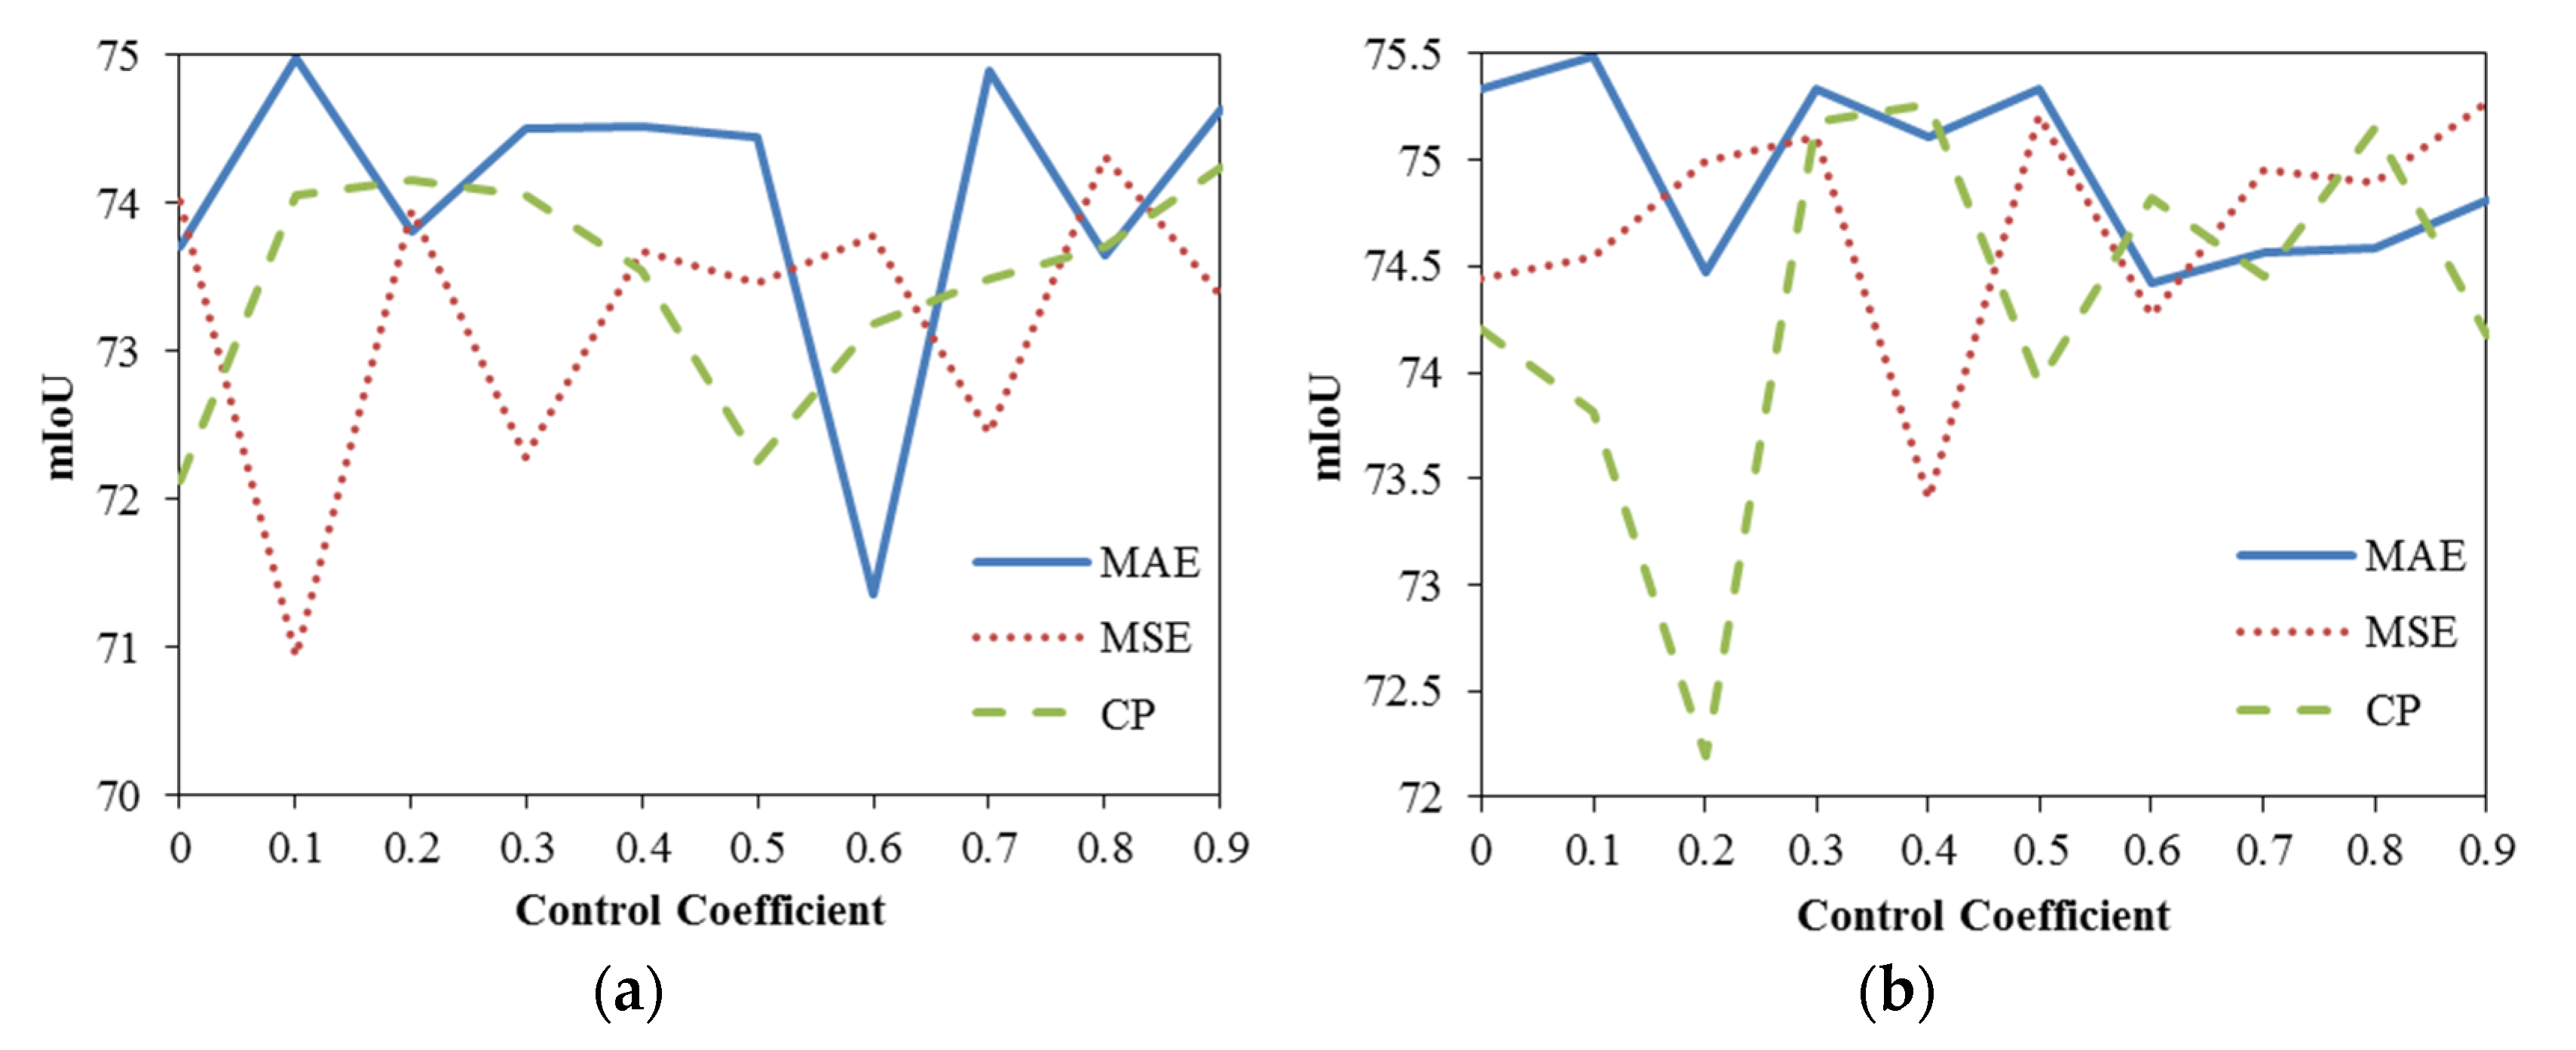
was added 1 to make sure its minimum is 0. The optimal type of weighted loss function
would be determined by experimental analysis.
4. Discussion
In order to evaluate the effectiveness of the weighted method, comparative experiments with and without the weight were conducted on several common semantic segmentation networks, such as FCN [
56], Segnet [
57] and Unet [
58], and a forest fire smoke detection method, Frizzi [
39]. The control coefficient and weighted loss function type for all the tested network architectures have been determined by alike experiments conducted in 3.4, as shown in
Table 5. The comparative results for the above segmentation methods with and without weighting are shown in
Table 6.
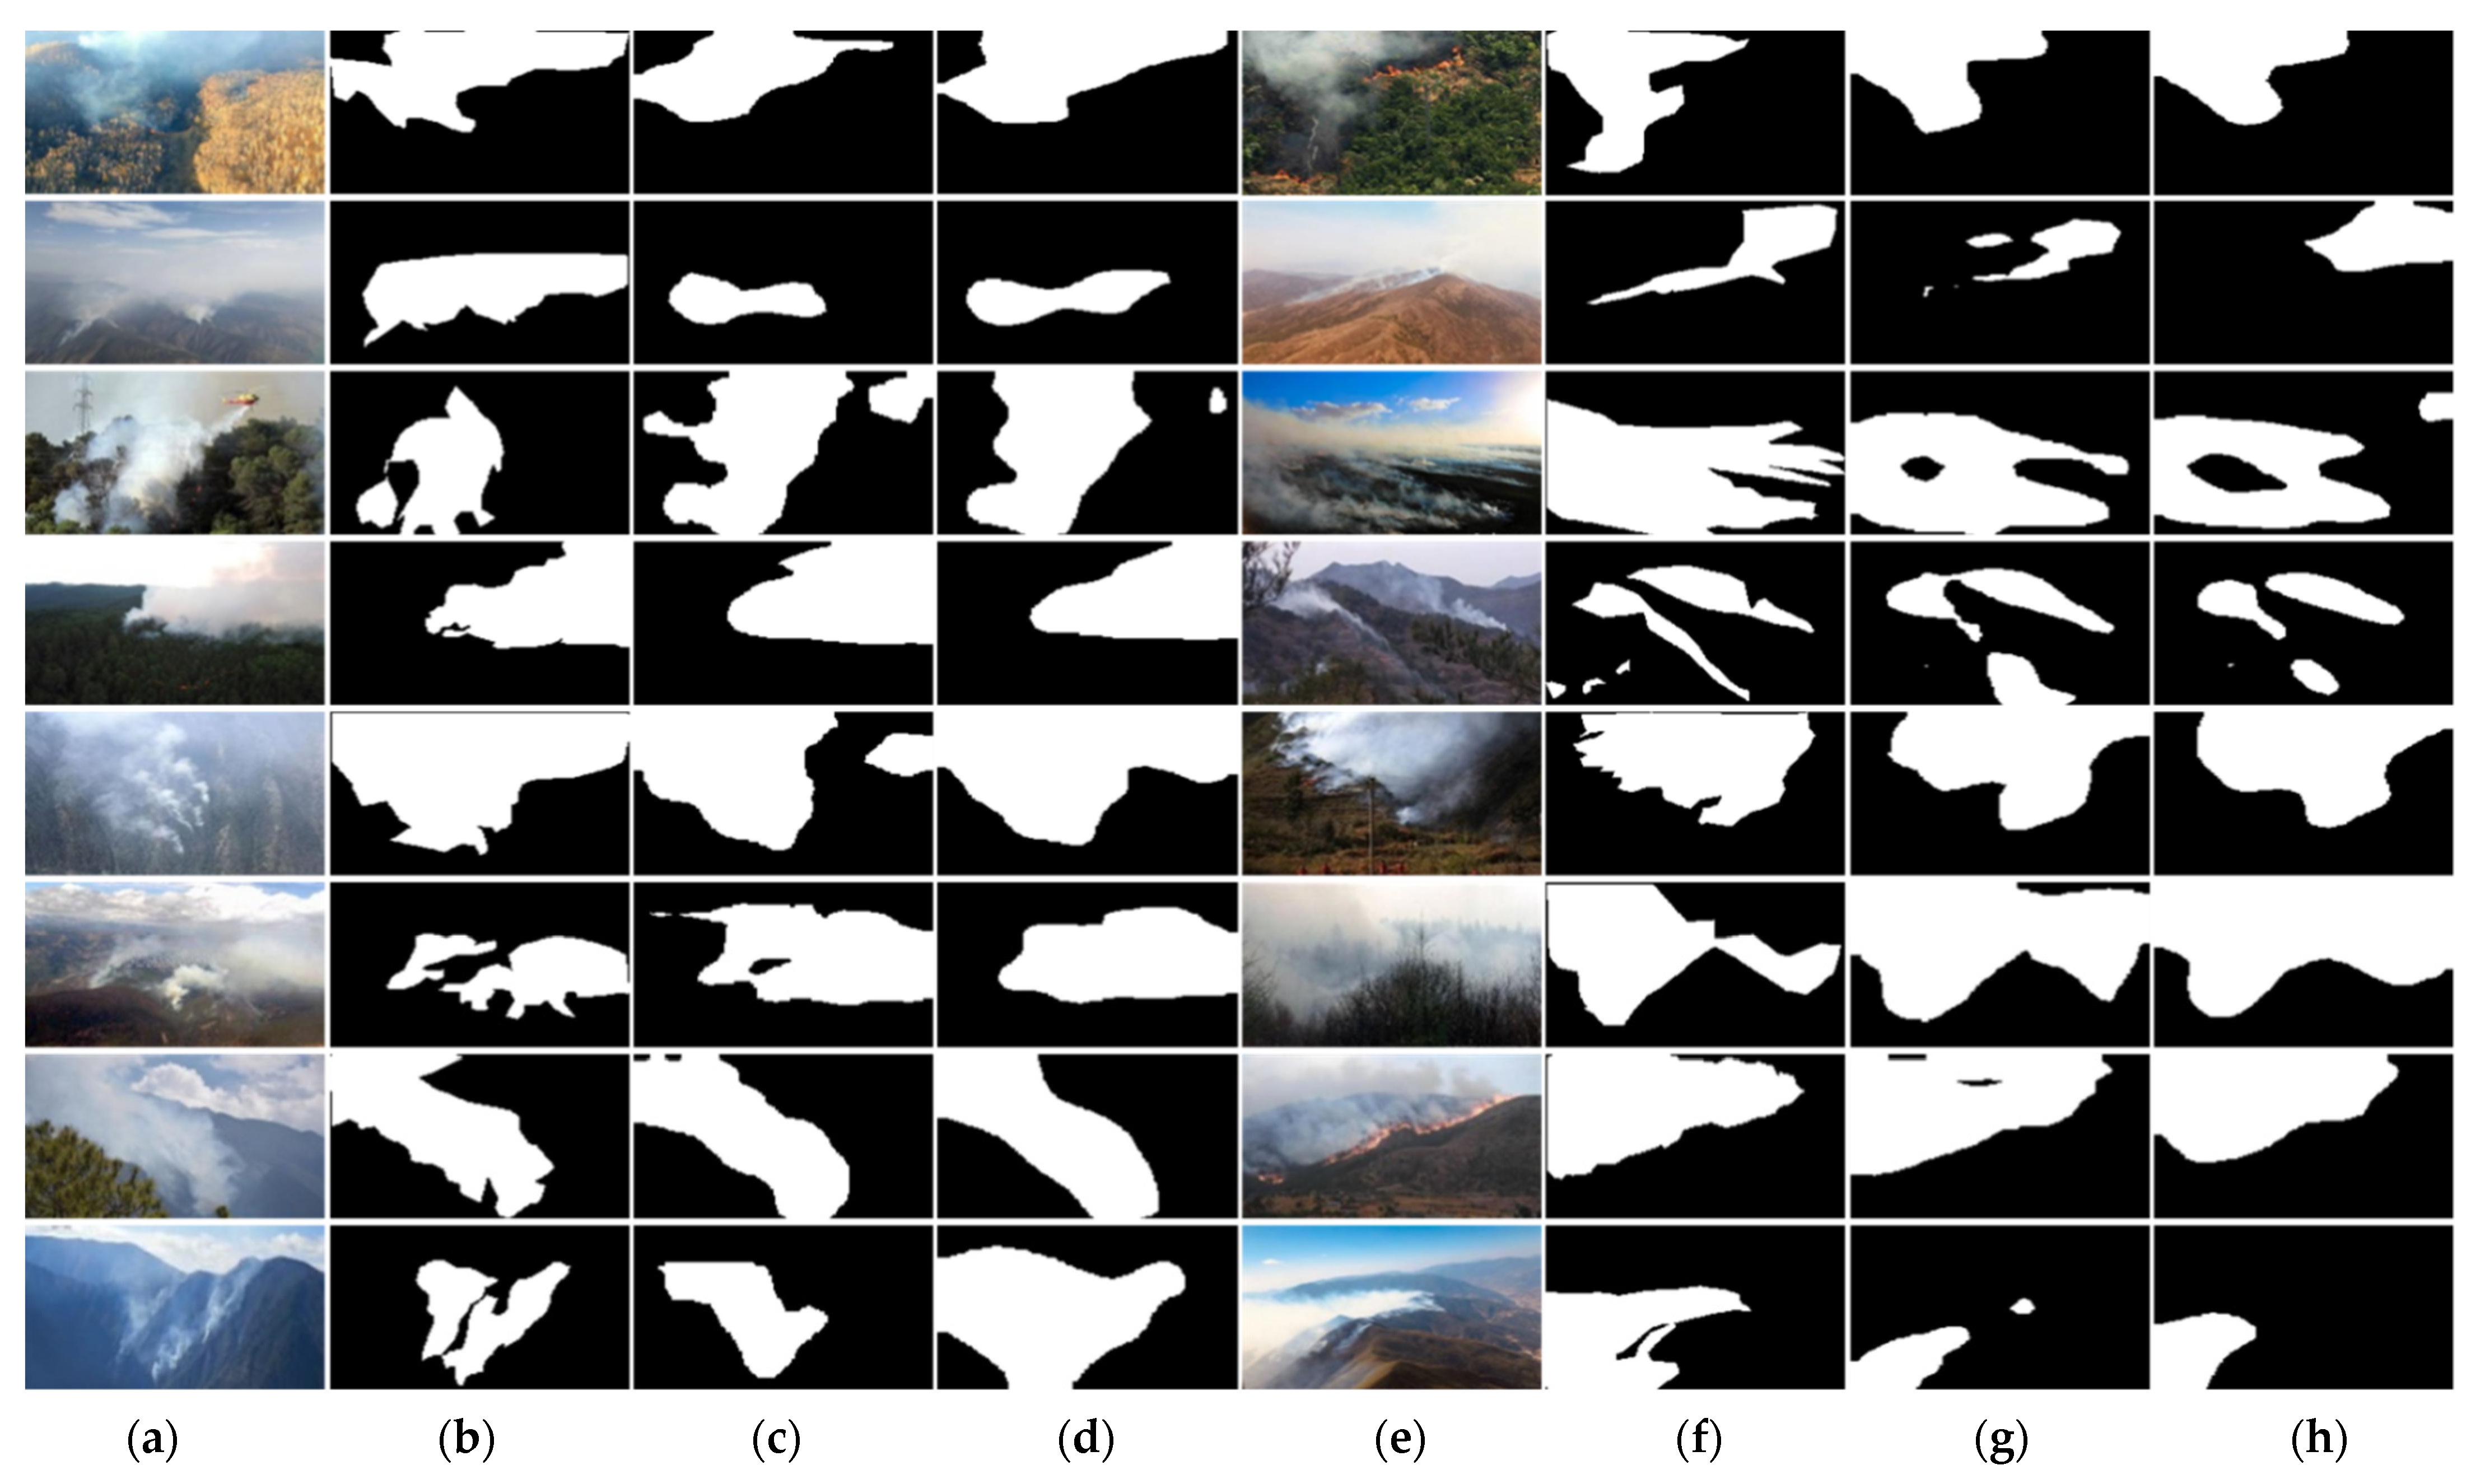
As shown in
Table 6, for each semantic segmentation network, mIoU of the weighted method has been improved than the unweighted method to some degree. The experimental results showed that the optimal type of weighted loss function and control coefficient of each segmentation method may be different. For a specific dataset, the three optimal parameters of the weighted method, including the pixel-concentration relationship, the type of loss function and the control coefficient, would be verified by experiments.
The above experiments show that the amount of data is an important factor that affects the weighted method. If the amount of data is too small, the performance of the network will fluctuate greatly, which can be proved by the standard deviation of the weighted method under 10-fold cross-validation becoming larger when the data is insufficient. The amount of data will be further expanded in the following research. In addition, as a multi-objective optimization problem, the selection for specific parameters of the weighted method will be made a further research focus.


