1. Introduction
Traffic accidents or the appearance of unpredictable dynamic objects on the road are a major threat to safe driving. They can cause traffic accidents if a driver does not see them, is not aware of them, or does not have enough time to take corrective action. High-speed vehicles on highways may not have enough time to respond when they arrive at accident scenes, and this can lead to secondary and tertiary collisions [
1]. A system that informs drivers of accidental situations ahead is needed to prevent these problems. However, the detection range of roadside units and CCTVs have a limited ability to collect real-time road information. Therefore, it is difficult to detect and share dynamic situations that occur randomly in large road networks. Collecting the road environment data continuously using a connected car is more efficient than installing new road sensing equipment [
2]. Recently, more vehicles are equipped with sensors such as cameras, radar, light and detection and ranging (LiDAR) sensors, and global positioning systems (GPS). These vehicles can be connected to an external network using internet-of-things (IoT) technology. This allows the development of connected systems that can provide services through bidirectional data communications. These elements of advanced telematics technology are important for connected cars and are essential for fully autonomous driving. The core of telematics technology involves a series of processes, including sensing, processing, transmitting, analyzing, and sharing the surrounding information of a moving vehicles. Various mobility services for moving vehicles can then be developed based on these factors. Such large-scale IoT-based data processing requires the application of various technologies such as connected cars, sensors, networks, big data processing, data engineering, and service provisions. Unfortunately, owing to its scale and complexity, the pace of development of these technologies in the automotive field is slow compared to the development of new roads and vehicles. Another issue is that the technology for displaying moving objects on maps in real time has not yet been commercialized. As a result, multi-source information merging is needed, but the available platforms and methods are very limited.
This study proposed and implemented a method for efficiently constructing dynamic maps of large areas using a low-cost connectivity system. Several other researchers have created roadmaps that process raw data from sensors. However, their information, which was collected at each coordinate system using multiple vehicles, could not be integrated into a single map. To solve this problem, we propose an edge-fog-cloud computing-based road dynamic object-mapping system. Our method processes the data from each connected car using a standardized form and manages the dynamic information with grid-based maps. This makes it possible to efficiently integrate data from heterogeneous sources. Because the dynamic map is managed within a database (DB), it supports fast sharing to various IoT devices through already developed DB connector APIs. Therefore, our system can be used to prepare for unpredictable objects, identify congested road sections, and plan autonomous driving routes. We use a type of distributed computing called fog computing that performs much of the processing at the local sources of the sensor data, which are called edges. The fog computing system then collects the connected cars’ sensor and GPS data, stores the data using a big data platform, and returns updated results to the drivers’ maps. This system deals with transient and highly dynamic object information corresponding to layers 3 and 4 of a local dynamic map (LDM). From a computing system perspective, the vehicles, infrastructure, etc., that collect actual data are called edges. Dynamic object information on the road is acquired by processing sensor data from the moving vehicles. The moving edges transmit data in real time to a fog system consisting of a big data platform based on Hadoop. Then, the object information needed for a dynamic map update is extracted and stored in the database. Dynamic maps are stored in two databases. The fog database manages map data that is located within a specific area, and the cloud database integrates map data that are transmitted from numerous fog databases. Dynamic map information stored in the fog database is transmitted to connected cars located in the same area so that multiple drivers can be updated in advance with road environment information that can enhance safe driving and the ability to respond to changes in road conditions. A grid-based information mapping method is proposed to display dynamic objects collected from a heterogeneous vehicle into a single map. A visualization test shows that the constructed dynamic map can completely cover the most important use cases among the LDM use cases in the intelligent transport systems (ITS) environment proposed by ETSI [
3]. These include Stationary vehicle—accident, stationary vehicle—vehicle problem, and Vulnerable road user Warning, corresponding, respectively, to the use case road hazard warning, UC_RHW_03, 04, and 13. Moreover, quantitative evaluation results show that the proposed system is effective for supplying services in realistic environments.
The rest of this paper is organized as follows.
Section 2 introduces background knowledge and related research.
Section 3 details the process of dynamic mapping system based on edge-fog-cloud computing.
Section 4 describes the overall edge computing platform. Subsequently,
Section 5 describes our fog computing platform.
Section 6 presents the actual implementation results of the mapping system proposed in
Section 4 and
Section 5. Additionally, the usability of the system was verified. Finally, in
Section 7, we conclude our paper and signpost future research directions.
2. Related Works and Background
2.1. Related Works
A high-definition (HD) map is a highly accurate digital map that provides information such as lane-level information, traffic lights, and signs so that drivers can drive safely. It can compensate for the technical limitations of vehicle sensors in autonomous driving. As such, different companies have built and maintained various types of maps based on their accumulation of vast driving data [
4]. For example, there is an experimental proposal to achieve real-time HD map changes by crowdsourcing updates based on mid-to-high-end sensors [
5]. Moreover, HERE Technologies, which produces navigation maps for automobiles, is developing a location-based cloud map real-time update technology to collect and handle road changes [
6].
Several works that have collected point cloud data from sensors to obtain surrounding environmental information. A point cloud is a collection of data points, with each point representing the 3D coordinates of a point on an object or a portion of an area. Junwon et at. [
7] created an HD map by updating point cloud data obtained from LiDAR on an edge-fog-cloud platform. The sensor used in that study was a high-priced LiDAR, and the presence and label of dynamic objects could not be obtained by the onboard processing. In addition, the normal distribution transform (NDT) mapping method used in that study could not construct a dynamic map with an algorithm that creates a static map by eliminating changing points. The following studies are related to real time dynamic object location recognition. Wenjun (2018) created an algorithm that updates the map by eliminating dynamic peripheral trails in the point cloud through object tracking [
8]. By distinguishing between a static background and moving object, only the static environment was reconstructed in three dimensions which could be applied to the simultaneous localization and mapping (SLAM) system. However, the method of finding the update point by comparing the correspondence between raw data was less utilized, because the collected spatial information differed according to the perspective of each local data source. In other words, recognizing continuous changes in multiple frames collected by heterogeneous devices resulted in complex operations and data loss.
A related problem arises in controlling moving robots. In robotics, the surrounding environment is often modeled with an occupancy grid map that maps the physical location of an object to each cell divided into a grid and stores the occupied state [
9]. The underlying assumption of an occupancy grid map is to map a fixed environment. However, there are additional studies that suggest a method for distinguishing multiple dynamic obstacles. These methods for mapping a dynamic environment include parallel particle filters [
10] and deep learning algorithms [
11,
12]. However, these methods separately distinguish dynamic objects after updating all the data, so the cost of map drawing is high. In the future, static HD maps will be provided in autonomous driving environments, so it is inefficient to continuously rewrite them. In robotics, there are few efforts to create a single map by integrating dynamic object information collected at each coordinate system. Sasha (2018) collected the posture of dynamic objects based on a bird’s eye view (BEV) map and updated it to a dynamic map [
13]. However, it is difficult to obtain a BEV map using general sensor data and onboard processing. In addition, as information other than posture is difficult to obtain, it is inefficient, because a separate model must be configured to extract information such as labels of dynamic objects.
In the field of geographic information system (GIS), research is being conducted to efficiently integrate traffic information by stacking information collected from various sources in the grid space. Jing (2020) proposed a method for layering various environmental information related to the power systems on a grid map [
14]. Jing’s study showed that multi-source information could be integrated into a single grid map. Kyusoo (2020) proposed a grid index technique for mapping vehicle sensor data and public data to a map [
15]. Their map was divided into contiguous cells, each of which were assigned unique identifiers, i.e., ID that can be used for spatial indexing purposes. Their method showed practical applicability because it was faster than link-unit mapping. However, it layered only publicly available data such as weather and geographic information. Moreover, they only suggest the possibility that the collected vehicle data could be layered.
2.2. Background Knowledge
2.2.1. Object Location Estimation
For safe driving, self-driving systems and drivers must accurately grasp the existence and location of objects on the road. Therefore, research is underway on sensor data processing to identify objects and estimate locations. In particular, technology is being developed that can obtain real location information with only a camera without using an expensive active sensor. Stereo and RGB-D cameras can easily obtain accurate depth maps and point clouds, unlike mono-cameras, which require complex algorithms to extract depth information from the collected images. Therefore, various methods are being developed to estimate the location of objects. There are several methods for applying a 3D detector to point clouds generated through image disparity correction and geometric volume extraction of 2D objects using deep learning models [
16]. Moreover, Jiaming (2020) predicted the pixel in which an object can be located using a pre-learned model and estimated depth-only data for pixels of interest [
17]. This method makes real-time location estimation possible with onboard systems because this approach is simple compared to fusing LiDAR camera data.
2.2.2. Edge-Fog-Cloud Computing
Cloud technology, which is used to manage a vast amount of data collected from multiple devices [
18], has recently advanced to incorporate edge and fog computing technologies, although there are latency and security issues. Real-time responses can be realized when edge and fog computing infrastructures are included, because they are physically closer to data sources than the cloud data centers. This integrated technology is called edge-fog-cloud computing [
19]. Various methods have been proposed for the IoT era to efficiently process data by properly delineating edge, fog, and cloud platforms.
2.2.3. Big Data Platform
A road information management system should be able to efficiently process and store big data generated simultaneously from multiple systems. Hadoop, a representative framework for big data processing, is open-source software that can efficiently distribute large amounts of data at a low cost [
20]. The Hadoop eco-system helps users process, store, analyze, and visualize data easily. Kafka is a distributed messaging system that manages data streams in real time. This was developed for processing large-capacity events and is used for data communication between systems. When running multiple Kafka simultaneously, Kafka brokers are managed by a zookeeper, a Hadoop ecosystem. Spark, a data processing module, is widely used because it has the advantage of being able to process various data source more quickly (such as DB, CSV, and JSON), than MapReduce, a major component of Hadoop. The Hadoop-based big data platform uses the Hadoop distributed file system (HDFS) to store data. It is aimed at fast processing and is used in the form of a data lake due to a relatively weak interest in data access latency. A dynamic map that manages the collection data of a heterogeneous vehicle platforms should have a standard format. Therefore, a database management system (DBMS) is used for map storage to maintain data integrity based on strict rules. The API supported by the DBMS can be easily linked with the Hadoop system.
2.2.4. Local Dynamic Map
The LDM manage static and dynamic traffic conditions in real time using a tiered or layered methodology [
21]. Conceptual standards have been established in ETSI 302 895 [
3] and ISO 18750 [
22], and systems are built to share real-time changing road/traffic/environmental information with surrounding vehicles and infrastructure in the cooperative-intelligent transport systems (C-ITS) environment. The LDM consists of four data-handling layers, which it deploys depending on the nature of the communicated driving threat. Permanent or transient static data, such as landmarks and traffic signs, are stored in layers 1 and 2, while transient or highly dynamic data, such as signal phase, pedestrians, and cars, are managed in layers 3 and 4.
3. Road Dynamic Object Mapping System Based on Edge-Fog-Cloud Computing
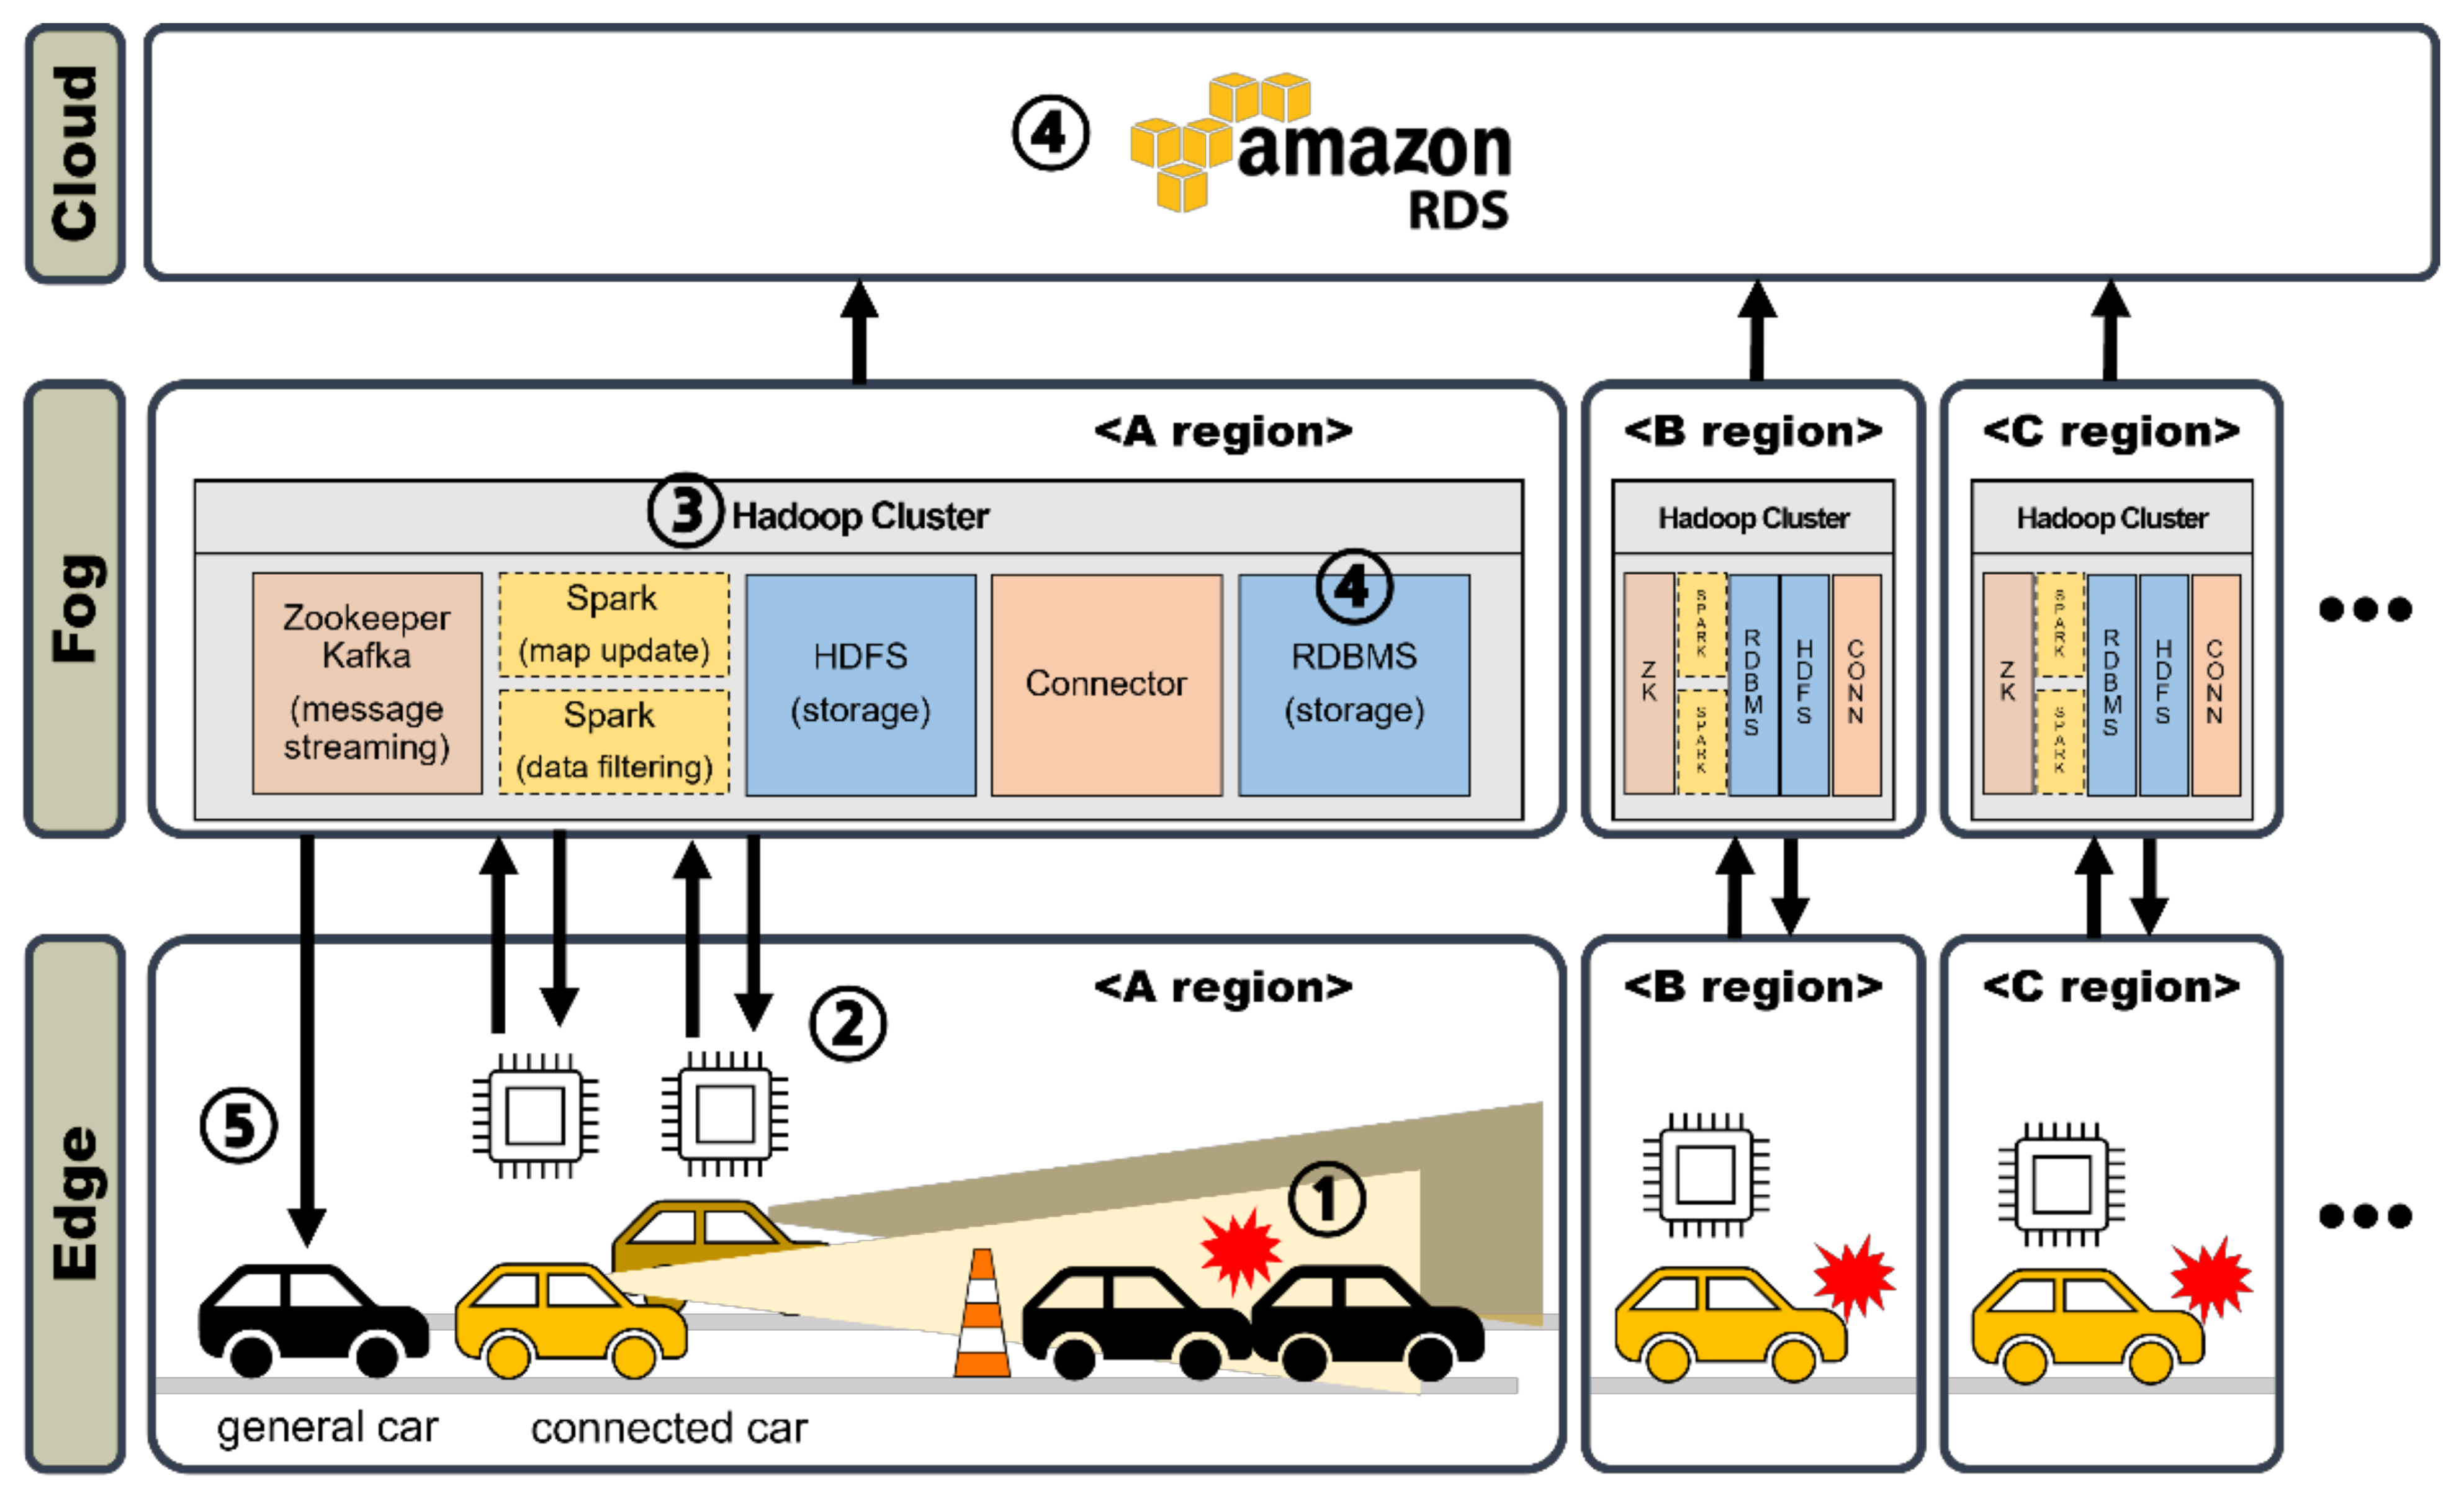
In this section, we describe the entire mapping procedure, which is illustrated in
Figure 1.
Sensors mounted on connected cars detect events such as dynamic objects or vehicle accidents on the road.
The position of the object is expressed in 3D space using a 3D position estimation algorithm. In this case, because the object appears based on the sensor frame of the vehicle, it is converted into coordinates on the map frame. Finally, the label, probability, and spatial coordinate information of the object extracted through edge computing are transmitted to the fog system in real time.
Fog, which consists of a Hadoop-based big data platform, receives data simultaneously from multiple vehicles in the same area. Among the collected information, only the data used for the map update are extracted after comparison with the existing map.
The processed dynamic object data are stored in each DB that is installed in the fog and cloud systems, depending on the purpose of use.
The stored dynamic map is shared with various IoT devices, and drivers on the road are enabled to grasp dynamic object information on the route or path in advance.
As described above, the edge system combines a variety of IoT devices that collect and process road information, such as vehicle and communication infrastructures. Fog is a big data processing system installed in each region to create a dynamic map based on real-time streaming data from nearby edge systems. Finally, the cloud is a system that collects multiple fog data installed nationwide, and in a C-ITS environment, an integrated control center can be used.
4. Edge Computing
This section introduces the edge computing process of collecting dynamic object information and transmitting it to a big data platform. First, the road environment is captured and collected from a stereo camera and GPS system mounted on a vehicle or connected car. The label, probability, and 3D position of objects are obtained through 2D detection and 3D pose estimation using the vehicle’s computer. Second, because the location of an object acquired by algorithm processing was collected from the perspective of sensors in each vehicle, the object must be displayed in the map coordinate system to map the data collected from individual vehicles to a single map. Accordingly, the object is indicated on the map coordinate system by performing earth, north, up (ENU) conversion based on a preset reference point [
23]. In addition, to compare data at low cost and to integrate maps, the coordinates of the object are matched to the grid and expressed as a cell index. Finally, a message containing information on the subject (ego) vehicles and the dynamic message (object) is delivered to the fog system in real time through the network system.
4.1. Object Detection
As shown in
Figure 2, a vehicle data collection system was designed. The system consists of only two sensors: a stereo camera for environmental recognition and a GPS for localization of the ego vehicle. This configuration minimizes system complexity for easy application to lower-priced ordinary vehicles without active sensors, such as LiDAR and radar. The edge computing operation was based upon the specifications for the GTX 1650 Ti graphics card and wireless network equipment. The in-vehicle network only needs to be connected to a commercial network regardless of whether wired, wireless, or fixed IP is used.
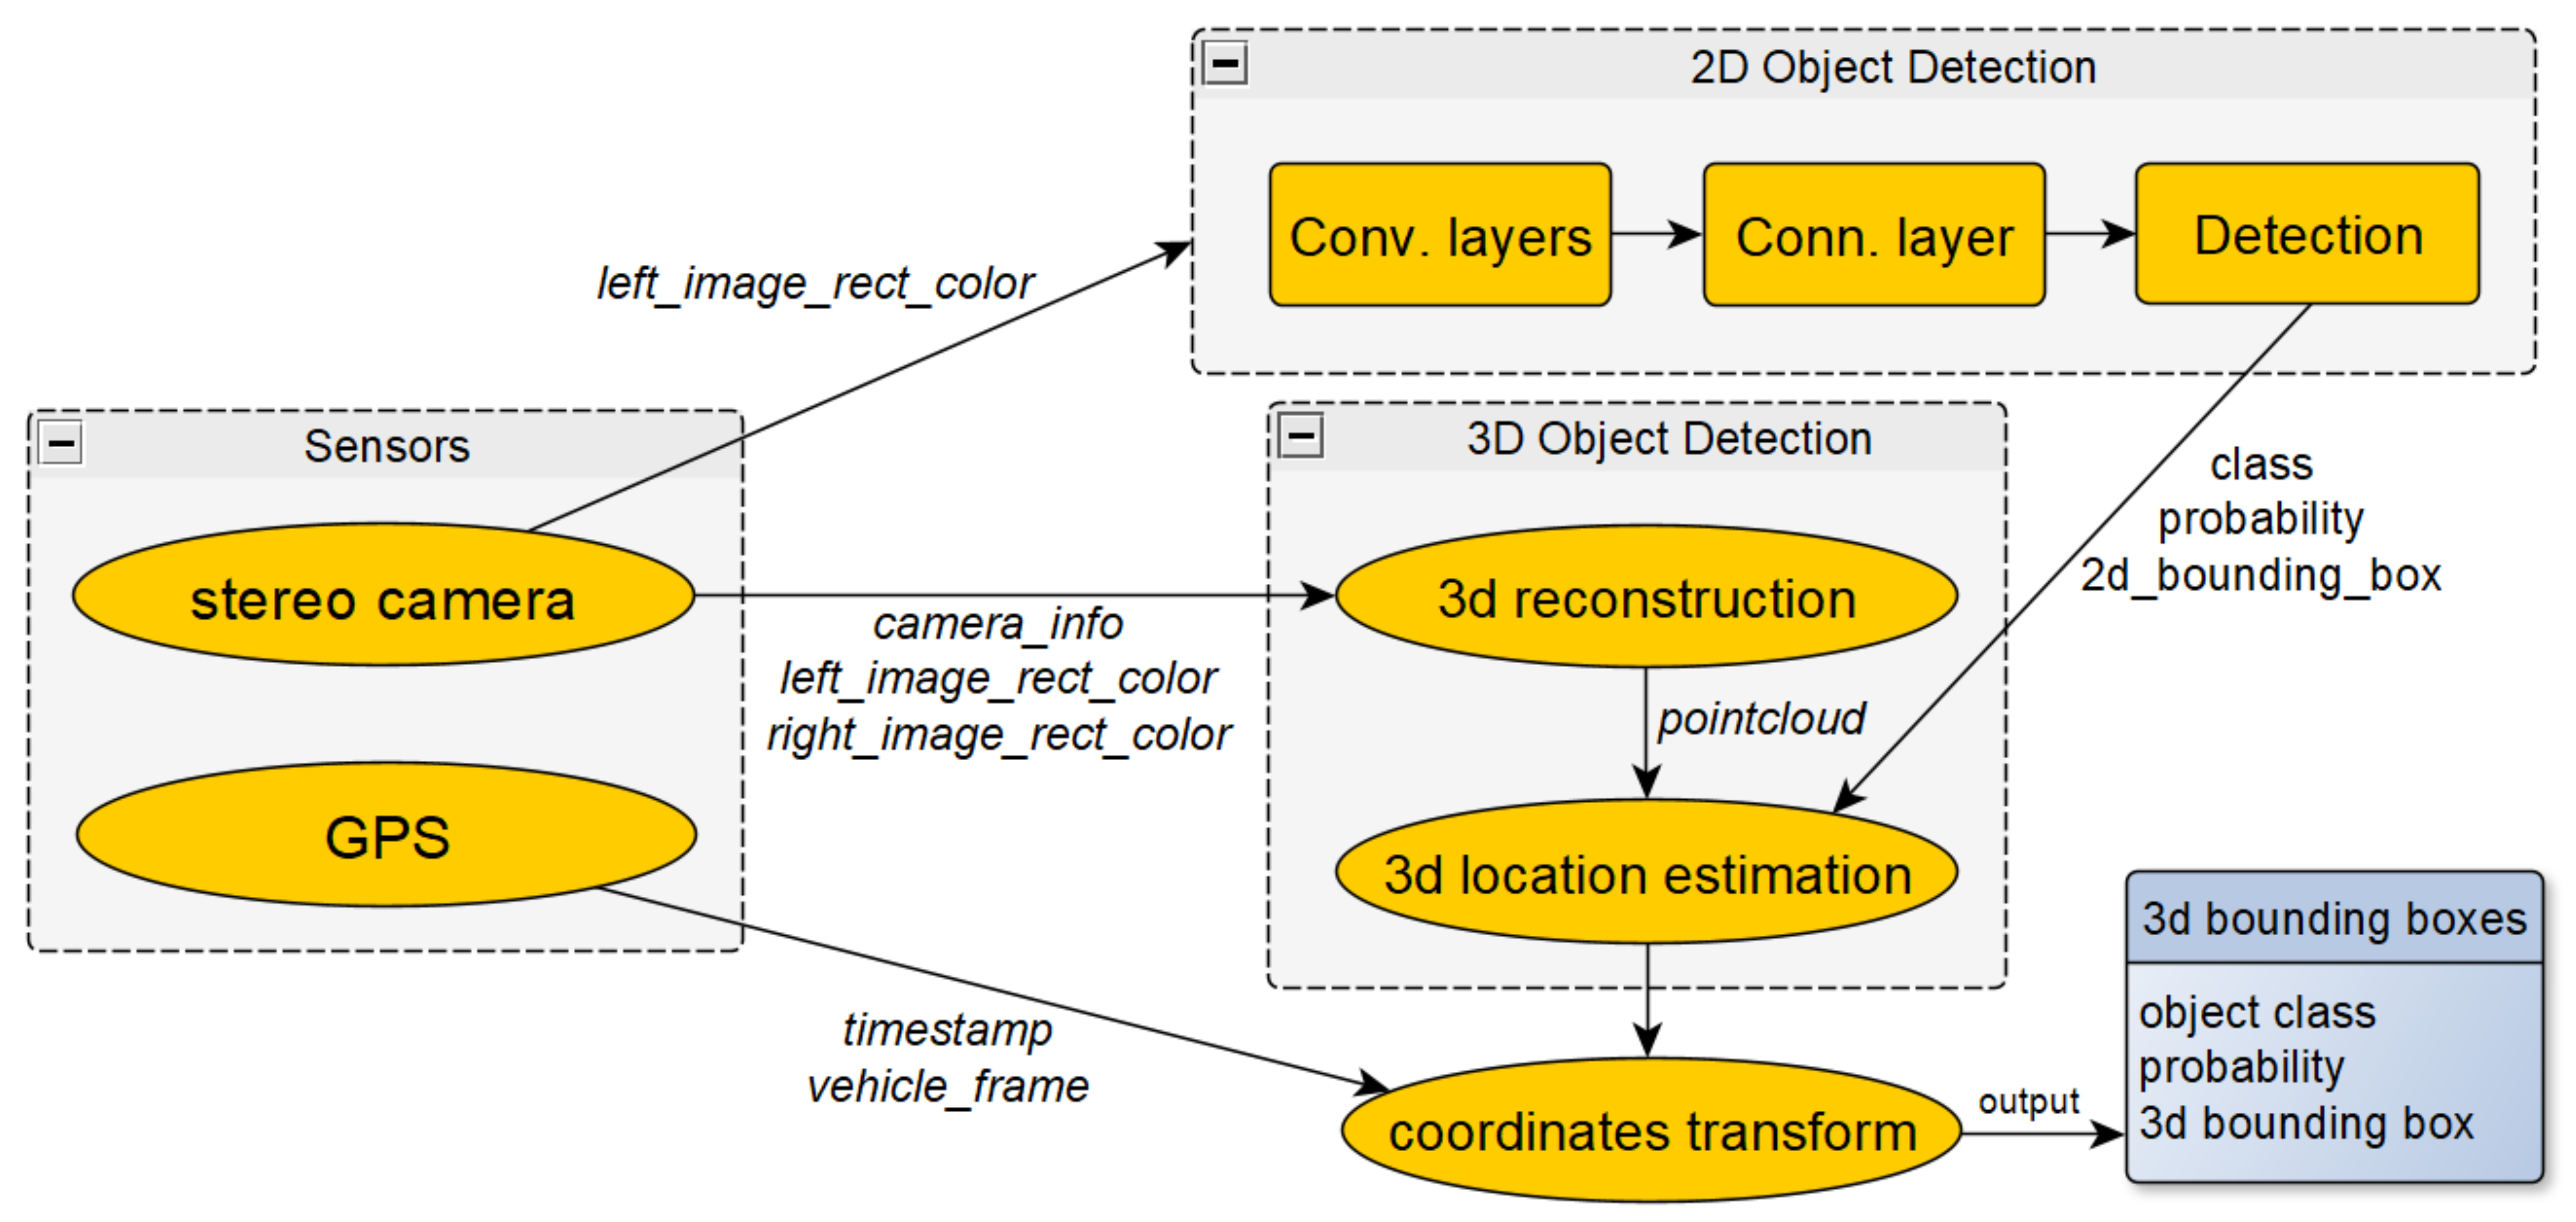
The entire data workflow for 3D object detection is shown in detail in
Figure 3. The following paragraph describes the process of data collection and 2D object recognition. First, the image_rect_color data are obtained by correcting the distortion of the camera images to reduce the error between the images and real environments. Next, a 2D object recognition algorithm is applied to obtain the types of dynamic objects and locations within the image array. In this study, the 2D objects were detected using YOLO [
24]. The information processing determined the class, probability, and 2D bounding box for the dynamic objects.
Subsequently, the spatial pose of an object shown in the 3D object detection of
Figure 3 is determined to allow for location-based dynamic mapping. First, the calibrated left and right images are aligned horizontally. The image could be restored in the form of a 3D point cloud through disparity correction between the two aligned image pairs. Subsequently, the 3D detector finds objects in the point cloud and estimates the spatial location [
25]. Then, the 2D image and the 3D point cloud are matched to make the pixel and the spatial coordinates symmetrical. The previously acquired 2D bounding box and spatial information are combined, and a 3D bounding box is created. The 3D bounding box contains information of the class, probability, and 3D position of objects on the road. However, the position of the object is represented based on the camera coordinate system, which is the frame of the base link. Therefore, a coordinate transformation is required.
4.2. Coordinate Transformation and Grid Matching
The object location obtained through the processes described in
Section 4.1 is an estimate based on the camera view, which is a vehicle sensor. Accordingly, it is necessary to unify the coordinate system representing each vehicle and object for data integration. As shown in
Figure 4, there are a total of four coordinate systems: camera frame, vehicle frame, map frame, and global frame. However, all information should be expressed based on the map frame. The map frame in
Figure 4 is defined by setting a specific point of the World Geodetic System 1984 (WGS84) coordinate system to zero. Various types of information were collected based on the vehicle frame. However, as the vehicle continues to move, the coordinate system is estimated at each moment by processing the longitude, latitude, and antenna-heading data. Subsequently, through a local tangent plane (ENU) conversion, all information collected from the vehicle is displayed as map-frame-based relative coordinates. This process establishes a transformation relationship between the map and the vehicle frame. However, to precisely display road object information on a map, a transformation relationship between the camera and map frames is required rather than the vehicle frame. Since the camera frame depends on the vehicle frame and the GPS antenna and the camera coordinate system are located on the same line, the frame relationship can be easily derived by setting only the translation parameter. Using this transformation relationship, the position of an object can be shown in the spatial coordinate system of the map.
The grid mapping method is adopted to accurately compare and integrate heterogeneous collection data at a low cost. Considering the mapping method, coordinate–grid matching is required because the edge collects the coordinates of the object, and the map is composed of grids. In addition, as shown in
Figure 5, the map is divided into appropriate grid sizes [
26]. Because the coordinates of the object are necessarily matched to one cell, the position of the object is indicated by a grid cell index.
4.3. Message Transmission
Figure 5 shows the message format defined to transmit information to the big data platform. Messages commonly include the object position in the local and global coordinate systems and a header containing time and vehicle license plate numbers. The classification label and probability of the object are additionally contained in the dynamic object message. Then, messages collected in the format shown in
Figure 5 are converted to the JSON type and delivered to the fog server through a real-time streaming platform.
5. Fog Computing
This section describes a big data platform-based fog computing system that manages road dynamic information collected from multiple-edge devices. On the road, an edge system, such as a connected car, transmits object and vehicle information. The fog system then collects large amounts of data from heterogeneous edges and uses it for dynamic mapping. To this end, the fog system is designed to serve as a backbone for high-speed calculation processing, storage, and real-time communication. Maps of certain areas generated by the fog are transmitted to the cloud, and a wide range of road maps can be quickly obtained. Therefore, the fog is the core platform that performs dynamic mapping by distributing large amounts of data. It was designed based on a big data platform, because dynamic maps must be created and shared quickly and accurately.
The following descriptions explain the process for constructing a fog platform and creating dynamic maps. First, Apache Hadoop was installed on multiple servers to configure a distributed parallel processing environment. In addition, several Hadoop ecosystems for processing were installed as dockers on each node of the constructed Hadoop cluster. Second, through docker port forwarding, a big data platform could communicate with external systems. Then, many data streams transmitted from the edge devices are collected in real time. Third, the collected data were managed in two ways. One was to constantly load all road conditions and drive logs into the HDFS for further analysis. The other was to perform map updates using rule-based algorithms and to store these results in a standardized form in the fog and cloud databases. Finally, dynamic maps were shared with the approaching vehicles. As a result, each vehicle may set an appropriate driving path and system by identifying the presence of a dynamic object in advance.
5.1. Constructing the Big Data Platform
This section introduces a big data-processing platform consisting of docker containers. As shown in
Figure 6, each Hadoop node was installed on five servers and connected to the Hadoop network for big data distributed processing. The configured Hadoop cluster is a suitable tool for an integrated management platform owing to its excellent horizontal scalability. Therefore, it allows the addition of equipment without interruption of the system. Even if an error occurs on a particular node, the entire system is not paralyzed. The module of each Hadoop node, shown in
Figure 6, was composed of a docker container. The docker container is a way to run multiple systems on a limited physical server, efficiently and quickly. For the design of big data platforms, we referred to the work of Aelee (2020), which established a system for managing multi-vehicle collection data in a C-ITS environment [
27].
Figure 6 describes the Hadoop ecosystem installed on each node. The zookeeper and Kafka modules act as distributed event streaming platforms. The streaming platform communicates with various sub-modules through connection tools and distributes streamed data to multiple modules. As shown in
Figure 6, multiple Kafka modules can be installed, and the zookeeper distributes work to these modules. The spark module is a distributed processing system that is characterized by fast data processing rates. In this study, the spark module compares streaming data with existing maps to perform dynamic map management such as addition, change, and deletion. The spark module supports streaming batch processing and is very suitable for quickly creating dynamic maps. Due to its horizontal scalability, the processing performance can be easily improved. HDFS modules are used to load all the collected data for post-processing and analysis. Finally, RDBMS, a non-Hadoop element, is used to manage the processed dynamic map information in a standardized form. In this study, MariaDB was used as a DBMS to process large-scale data safely and quickly.
5.2. Real-Time Communication
To collect edge information, a docker connected to a private network must be able to communicate with the external environment. Therefore, port forwarding is performed to allocate a specific port of the server to the local host of a communication docker. As a result, the edge device connected to the network can access the fog platform using public IP and port and thus transmit data in real time. Additionally, since the data streaming platform exchanges JSON type of data, it is necessary to respond robustly to various source formats occurring on heterogeneous edge devices through a preprocessor capable of parsing and converting.
5.3. Processing and Storing Dynamic Map
This section describes the processing procedure of big data platforms for creating dynamic maps, which is illustrated in
Figure 7.
Multiple edge data is transmitted to the big data platform through a Kafka broker, which allows external communication. If the amount of streamed data is large, the zookeeper distributes it to each server and manages it.
The spark module parses and filters JSON format data collected from edges. Through preprocessing, dynamic object information is organized in the data frame format.
The spark module updates the map by comparing the data frame and dynamic map stored in DB. Grid-based mapping is applied to merge dynamic objects information from heterogeneous sources. First, it checks whether the information already exists in the grid index. If the information already exists on the map, the grid descriptors (such as detected distance and source, the number of objects) are updated. When the new information is unchanged from the earlier information, the update is determined by comparing the data reliability with the existing descriptor. Finally, the updated information is configured with SQL commands and sent to DBMS.
The dynamic map stored in the Fog DB shares the information with a of variety devices using the DB connector tool already in service.
The fog acquires the dynamic map in specific area through the previous sequence of operations. When maps of multiple fogs are integrated into one cloud, wide dynamic information can be efficiently obtained at the national or metropolitan level.
The DBMS maintains the integrity of data, so it is useful to accurately manage the dynamic map while communicating with multiple sparks. The fog DB integrates multiple edge information into a single dynamic map, so that drivers can prepare for risks by acquiring dynamic information located on their driving path. The cloud DB can gather the regional or nationwide road status in the form of integrating several fog databases. Additional data analysis can identify congestion sections and use them for global path planning or recommending driving routes. This can reduce road congestion in autonomous cooperative driving and improve future driving. Meanwhile, regardless of the dynamic map, all information collected from the edges is uploaded to the HDFS. Loaded data can be used for future analysis, such as checking the driving status and surrounding environment before and after an accident.
6. Implementation and Evaluation
6.1. Implementation
In this study, the information on parked/stopped vehicles and pedestrians on roads is included in the dynamic map corresponding to LDM layers 3 and 4.
Figure 8 shows the results of estimating dynamic object information. In the upper pictures in
Figure 8a,b, the label and 2D bounding boxes of the objects detected by the 2D detector are shown. Figure below shows the results of estimating the spatial position of the objects by combining the point cloud and the 2D detection results. The yellow 3D bounding box is emphasized in a red box.
The object location in
Figure 8 was estimated from the perspective of the vehicle sensor. Therefore, the coordinate transformation of objects is performed to integrate the object information collected from multiple vehicles. Each object is then mapped to the grid of the map configured based on the map coordinate system.
Figure 9 shows the output result of a grid map that include objects and map coordinate systems. The green dots shown in
Figure 9 are localized vehicle positions using GPS data, and the converted object data based on the grid map coordinate systems are displayed as red dots. As shown in the vehicle localization results, the object data collected while driving along the lake were mapped.
The results of the calculation of the edge device derived from the above processes are transmitted in real time to the fog platform. The devices that are connected to a commercial network can transmit data even if only the IP of the fog platform and the ports allocated for communication are known. In the future, when multiple fog platforms in a large area are built, IPs may be managed simultaneously by creating a routing table.
The data streamed to the fog platform move to the processing module after pre-processing. The processing module exchanges different types of data topics with the edge during data transmission and reception. First, the edge-to-fog process (indicated by the blue arrow in
Figure 10) collects information on ego vehicles and road objects expressed in 2D Cartesian coordinates based on the map frame. Then, the map update command is posted by comparing the collected data with information stored in the same index of the existing dynamic map. Conversely, the fog-to-edge process (indicated by the orange arrow in
Figure 10) is sent back to the vehicle after selecting only dynamic information that may affect the vehicle's driving based on the current location. Consequently, as in the terminal in
Figure 10, the Kafka in the fog has objects, vehicles, and license plate numbers in a topic list and exchanges the data with the edges.
The processed data were transmitted to the local DB and the cloud. The cloud computing environment was implemented as a MariaDB instance using the Amazon Web Service (AWS) RDS console. Afterward, fog accessed the cloud database using the MySQL command line tool and forwarded the information.
Table 1 shows a dynamic map table uploaded to the cloud using the MySQL workbench. The data in
Figure 11 are road object information collected from vehicles 53A1234 and 17S7269 and are stored with the object_IDs in chronological order.
Finally, a dynamic map is shared with various IoT devices on road.
Figure 11 shows the result of visualizing the dynamic map stored in the fog DB in real time by sharing it with the ‘53A12324’ vehicle. The displayed markers are the same as the information shown in
Table 1. The red mark in
Figure 11 indicates the reference point of the map, and the blue marks are dynamic objects on the road. In addition, the grid index, object classification, accuracy, and collected sources are additionally displayed through a tag. As shown in the tag of
Figure 11, the vehicle ‘53A1234’ can obtain information recognized by the vehicle ‘17S7269’ through a dynamic map. Thus, the LDM stored in the DB can be used in applications through the connector API and can be easily linked to existing system including, vehicle navigation, public data portals, etc.
6.2. Quantitative Evaluation
The dynamic maps must be prepared quickly so that they can be shared with the following vehicles. To evaluate the speed performance of the proposed mapping platform, testbeds were configured to test the communication speeds between the edge fog. In the entire test, the data latency was set at a time interval until the transmitted data received an ACK signal. An ACK signal is returned when the data reach the destination safely.
First, the performance of data latency between edge and fog was evaluated. For evaluation, the average latency when sending 1000 pieces of data at 100 Hz was measured. As shown in
Table 2, an experimental environment for delay evaluation in LAN, external networks, and wireless networks was prepared. In particular, the data latency with the external network appears to be 24.25 ms and 53.99 ms, depending on the fixed IP and wireless. It indicates that the dynamic object discovered by the preceding vehicle could be received in the rear vehicle after about 0.107 s (53.79 ms × 2). For example, a high-speed vehicle driving at 100 km/h, i.e., 27.7 m per second, can receive all the dynamic information generated within the fog while traveling 2.96 m (0.107 s × 27.7 m/s). It will be possible to respond in advance to all obstacles that occur about more than 3 m ahead. In addition, these is a result as based on current commercial networks, and lower latency can be expected depending on the network environment.
Second, the stress processing performance of the fog platform, which collects data simultaneously from multiple edges, was quantitatively evaluated. The multi-edge execution environment was established that repeatedly generated dynamic object data. Each edge transmitted 1000 pieces of data at 100 Hz continuously. In addition, all edges were connected to an external wireless cellular network. Moreover, to ensure correct latency measurements, we used a single Kafka broker [
28]. In order to increase the reliability of the evaluation results, data were secured after each edge was executed for more than 1 min. The number of edges increased in units of teens and averaged the latency of 100 data generated at each edge (100× numbers of edges). These experiments were conducted 10 times, and
Figure 12 shows the average value.
Figure 12 shows the latency and CPU usage that change as the number of edges increases. The latency and CPU usage increase almost linearly when a single messaging system processes multiple edge data. When collecting data from 100 edges, the latency reached approximately 1 ms, and CPU usage was found to be about 30% higher. This performance can be improved by increasing the number of Kafka modules in parallel. This is due to Kafka’s characteristics of distribution and scalability [
29], and other studies have shown the same results. For example, in Paul’s study, the throughput and latency performance increased considerably with the number of nodes in Kafka [
30]. Particularly, when the number of nodes increases from one to two, the performance difference is more than 30%. Although the value is not linear thereafter, it gradually increases depending on the number of nodes. In addition, the CPU specifications used in the experiment were 8 cores and a 16 GB hard disk drive (HDD), but better performance can be expected by changing the disk to a solid-state drive (SSD) and increasing the number of cores [
29].
7. Conclusions
This study proposes a system for managing dynamic object information on roads based on the edge-fog-cloud computing platform was proposed. Accurate dynamic maps were obtained by collecting information on connected cars that sense changes in the road environment in real time and then performing grid-based mapping. To process large-scale data, a fog computer system was built as a big data processing platform. In terms of managing maps in the form of grids, information collected from various sources was accurately fused. Finally, we demonstrated that the entire process of performing dynamic mapping is feasible. For example, as the dynamic map in DB is shared with various IoT devices and visualized, drivers and auto systems can grasp road conditions over a wider distance range than would be directly visible and detectable. In addition, data integration in the cloud enables efficient acquisition of a wide range of road information.
The scope of future work could extend this dynamic mapping system to other applications. Because dynamic information was stored in the DB in a standardized form, it is easy to integrate with database-based GIS and location-based services (LBMs), which are being actively studied. Through the analysis of the data accumulated in the HDFS, more detailed information such as congestion sections and accidents on specific roads can be identified in real time, and global path planning can be provided. In addition, it can be used to automatically identify casual factors in accidents and road congestion. Forensic applications could include post-accident analysis, congestion analysis, and predictive traffic management. This might be useful for the police, insurance agents, and traffic planners. As such, the added value obtained through the dynamic environment mapping is significant.
Additional studies can be conducted based on this study. To improve the accuracy of the dynamic map, we can optimize the grid cell size of the map using active sensors, e.g., LiDAR or developing precise object location estimation algorithms. In addition, it may be possible to develop an algorithm that selects only information that directly affects the driving, such as an object located in the same lane, and provides it to the vehicle.
Author Contributions
Conceptualization, S.S. and C.M.; methodology, S.S.; software, S.S. and J.K.; validation, S.S., J.K. and C.M.; formal analysis, S.S. and C.M.; investigation, S.S.; data curation, S.S. and J.K.; writing—original draft preparation, S.S.; writing—review and editing, S.S., J.K. and C.M.; visualization, S.S.; supervision, C.M.; project administration, S.S. and C.M. All authors have read and agreed to the published version of the manuscript.
Funding
This study was supported by Korea Institute for Advancement of Technology (KIAT) grant funded by the Korea Government (MOTIE) (N0002428, The Competency Development Program for Industry Specialist).
Conflicts of Interest
The authors declare no conflict of interest.
References
- Boudette, N.E. Tesla’s Autopilot Technology Faces Fresh Scrutiny. New York Times. Available online: https://www.nytimes.com/2021/03/23/business/teslas-autopilot-safety-investigations.html (accessed on 17 November 2021).
- Strickland, G.; McNelis, J. Autonomous Vehicle Reporting Data is Driving AV Innovation Right off the Road. TechCrunch. Available online: https://techcrunch.com/2020/08/04/autonomous-vehicle-reporting-data-is-driving-av-innovation-right-off-the-road/ (accessed on 17 November 2021).
- ETSI. Intelligent Transport Systems (ITS); Vehicular Communications; Basic Set of Applications; Local Dynamic Map (LDM); Rationale for and Guidance on Standardization; ETSI TR 102 863, V1.1.1; ETSI: Sophia-Antipolis, France, 2011. [Google Scholar]
- Ha, S.T. Trends in High-Definition Map Technology to Support Self-Driving. J. TTA 2017, 173, 23–28. [Google Scholar]
- Zhang, P.; Zhang, M.; Liu, J. Real-Time HD Map Change Detection for Crowdsourcing Update Based on Mid-to-High-End Sensors. Sensors 2021, 21, 2477. [Google Scholar] [CrossRef] [PubMed]
- Kurme, S. Here Launches Advanced Real-Time Traffic Service. GlobeNewswire. Available online: https://www.here.com/company/press-releases/en/here-launches-advanced-real-time-traffic-service (accessed on 11 October 2021).
- Lee, J.; Lee, K.; Yoo, A.; Moon, C. Design and Implementation of Edge-Fog-Cloud System through HD Map Generation from LiDAR Data of Autonomous Vehicles. Electronics 2020, 9, 2084. [Google Scholar] [CrossRef]
- Shi, W.; Li, J.; Liu, Y.; Zhu, D.; Yang, D.; Zhang, X. Dynamic Obstacles Rejection for 3D Map Simultaneous Updating. IEEE Access 2018, 6, 37715–37724. [Google Scholar] [CrossRef]
- Saeedi, S.; Trentini, M.; Seto, M.; Li, H. Multiple-Robot Simultaneous Localization and Mapping: A Review. J. Field Robot. 2016, 33, 3–46. [Google Scholar] [CrossRef]
- Nuss, D.; Yuan, T.; Krehl, G.; Maile, M.; Gern, A.; Reuter, S.; Thom, M.; Dietmayer, K. A random finite set approach for dynamic occupancy grid maps with real-time application. Int. J. Robot. Res. 2018, 37, 841–866. [Google Scholar] [CrossRef]
- Hoermann, S.; Henzler, P.; Bach, M.; Dietmayer, K. Object Detection on Dynamic Occupancy Grid Maps Using Deep Learning and Automatic Label Generation. In Proceedings of the IEEE Intelligent Vehicles Symposium, Changshu, China, 26–30 June 2018; p. 18167952. [Google Scholar]
- Piewak, F.; Rehfeld, T.; Weber, M.; Zollner, J.M. Fully convolutional neural networks for dynamic object detection in grid maps. In Proceedings of the IEEE Intelligent Vehicles Symposium (IV), Los Angeles, CA, USA, 11–14 June 2017; p. 17066412. [Google Scholar]
- Wirges, S.; Fischer, T.; Stiller, C. Object Detection and Classification in Occupancy Grid Maps Using Deep Convolutional Networks. In Proceedings of the International Conference on Intelligent Transportation Systems, Maui, HI, USA, 4–7 November 2018; p. 18308969. [Google Scholar]
- Yu, J.; Shang, X.; Zhang, L.; Li, Y.; Wang, Z.; Shen, G. Design of Panoramic Grid Map Incorporating Multi-Source Information. In Proceedings of the IEEE 4th Conference on Energy Internet and Energy System Integration (E12), Wuhan, China, 30 October–1 November 2020; p. 20449877. [Google Scholar]
- Chong, K.S.; Sung, H.K. A Study on Traffic Big Data Mapping Using the Grid Index Method. J. Korean Inst. Intell. Transp. Syst. 2020, 19, 107–117. [Google Scholar] [CrossRef]
- Chen, Y.; Liu, S.; Shen, X.; Jia, J. DSGN: Deep Stereo Geometry Network for 3D Object Detection. In Proceedings of the IEEE/CVF Conference on Computer Vision and Pattern Recognition (CVPR), Seattle, WA, USA, 13–19 June 2020; p. 19874780. [Google Scholar]
- Sun, J.; Chen, L.; Xie, Y.; Zhang, S.; Jiang, Q.; Zhou, X.; Bao, H. Disp R-CNN: Stereo 3D Object Detection via Shape Prior Guided Instance Disparity Estimation. In Proceedings of the IEEE/CVF Conference on Computer Vision and Pattern Recognition (CVPR), Seattle, WA, USA, 13–19 June 2020; p. 19874352. [Google Scholar]
- Li, J. The Real Estate Big Data Analysis System Based on Cloud Computing. In Proceedings of the International Conference on Measuring Technology and Mechatronics Automation (ICMTMA), Beihai, China, 16–17 January 2021; p. 20651274. [Google Scholar]
- Mohan, N.; Kangasharju, J. Edge-Fog Cloud: A Distributed Cloud for Internet of Things Computations. In Proceedings of the IEEE 2nd Conference on Cloudification of Internet of Things (CIoT), Paris, France, 23–25 November 2016. [Google Scholar]
- Hadoop. Available online: https://www.sas.com/en_us/insights/big-data/hadoop.html (accessed on 24 September 2021).
- Autonomous Cooperative Driving. Available online: http://www.ways1.com/sub3/sub1.html (accessed on 24 September 2021).
- ISO/TS/TS 18750:2015. Intelligent Transport Systems—Cooperative Systems—Definition of a Global Concept for Local Dynamic Maps. Available online: https://www.iso.org/standard/63273.html (accessed on 24 September 2021).
- Jo, K.; Lee, M.; Sunwoo, M. Faster GPS-DR Sensor Fusion Framework: Removing the Geodetic Coordinate Conversion Process. IEEE Trans. Intell. Transp. Syst. 2016, 17, 2008–2013. [Google Scholar] [CrossRef]
- Redmon, J.; Divvala, S.; Girshick, R.; Farhadi, A. You Only Look Once: Unified, Real-Time Object Detection. In Proceedings of the IEEE Conference on Computer and Pattern Recognition (CVPR), Las Vegas, NV, USA, 27–30 June 2016; p. 16526932. [Google Scholar]
- Darknet_ros_3d. Available online: https://github.com/IntelligentRoboticsLabs/gb_visual_detection_3d (accessed on 24 September 2021).
- Liu, Y.; Chen, J.; Bai, X. An Approach for Multi-Objective Obstacle Avoidance Using Dynamic Occupancy Grid Map. In Proceedings of the IEEE International Conference on Mechatronics and Automation (ICMA), Beijing, China, 13–16 October 2020; p. 20113055. [Google Scholar]
- Yoo, A.; Shin, S.; Lee, J.; Moon, C. Implementation of a Sensor Big Data Processing System for Autonomous Vehicles in the C-ITS Environment. Appl. Sci. 2020, 10, 7858. [Google Scholar] [CrossRef]
- van Dongen, G.; Van den Poel, D. Evaluation of Stream Processing Frameworks. IEEE Trans. Parallel Distrib. Syst. 2020, 31, 1845–1858. [Google Scholar] [CrossRef]
- Apache Spark. Available online: https://kafka.apache.org/documentation/ (accessed on 30 October 2021).
- Noac’h, P.L.; Costan, A.; Bouge, L. A Performance Evaluation of Apache Kafka in Support of Big Data Streaming Applications. IEEE Int. Conf. Big Data 2017, 4803–4806. [Google Scholar]
| Publisher’s Note: MDPI stays neutral with regard to jurisdictional claims in published maps and institutional affiliations. |
© 2021 by the authors. Licensee MDPI, Basel, Switzerland. This article is an open access article distributed under the terms and conditions of the Creative Commons Attribution (CC BY) license (https://creativecommons.org/licenses/by/4.0/).


