Economic Design of Hybrid Pico-Hydraulic/Photovoltaic Generation System: A Case Study in Egypt
Abstract
1. Introduction
1.1. Saved Power Literature Overview
1.2. Related Works Overview
- The RE can reduce the exhausts to provide a clean environment through studies [17].
- There is a need to produce additional electrical power from RE to satisfy the unsupplied loads throughout the world,
- The generation of Hybrid RE is a very effective electrical production system w.r.t traditional and single method,
- Most research scope about the advanced methodologies that may be cannot be applied in practical especially the developing countries and with popular human houses.
2. Egypt Renewable Energy Scenario
3. Methodology
4. The Hydraulic Electrical Power Generation System
4.1. Electric Power Computation
4.2. Hydraulic Turbine Classifications
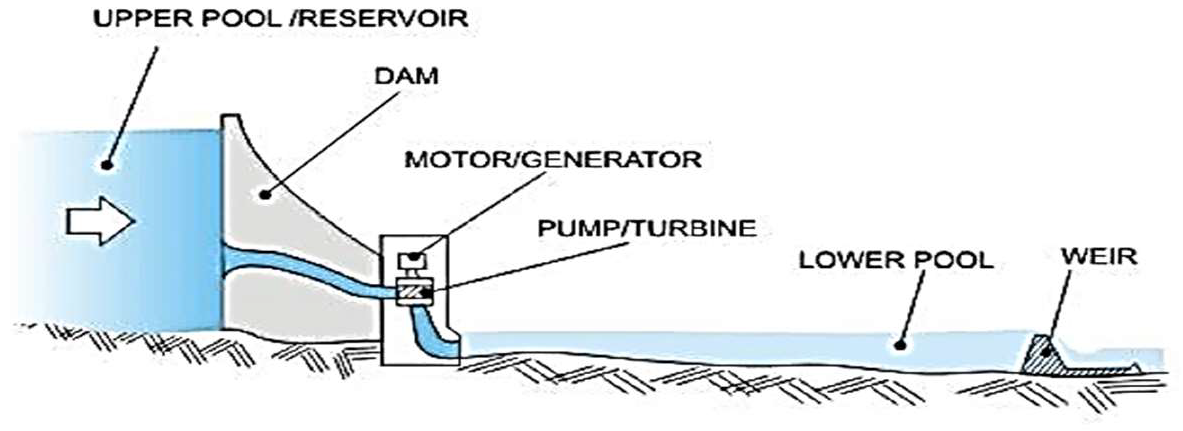
4.3. Pumped Storage
5. PV System
6. Proposed System
- Decides the powers needed from PV and hydraulic systems (hybrid system) to limit the consumed monthly house bill to certain economical money paid,
- Illustrates the steps, with the mathematical controlled equations and procedures, to verify this goal, and
- Confirms the proposed technique with the actual model.
6.1. Pico-Hydro Generation System
6.1.1. Power Determination
- The daily consumed power for each family home person is denoted by (, W/day),
- The number of family persons is (n),
- The actual total family persons daily consumed power is (, W/day),
- The consumed water/person is denoted by (, L/day),
- The total consumed water for all family persons is (, L/day), and
- The total consumed power for all family persons must be limited to economic value denoted by (, W/day).
6.1.2. The Used Equation Parameters
6.2. Solar Energy System
6.3. The Proposed Integrated System
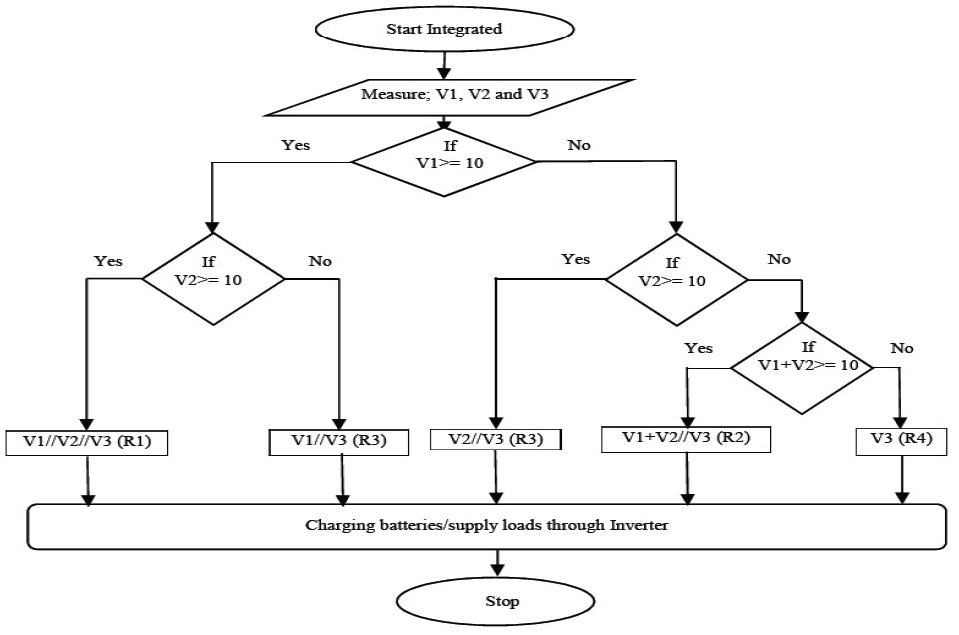
- The flowchart in Figure 1 shows the proposed technique integrated procedures programming), which indicates the maintained supply outputs voltages and power to charge the battery/selected loads under various circumstances,
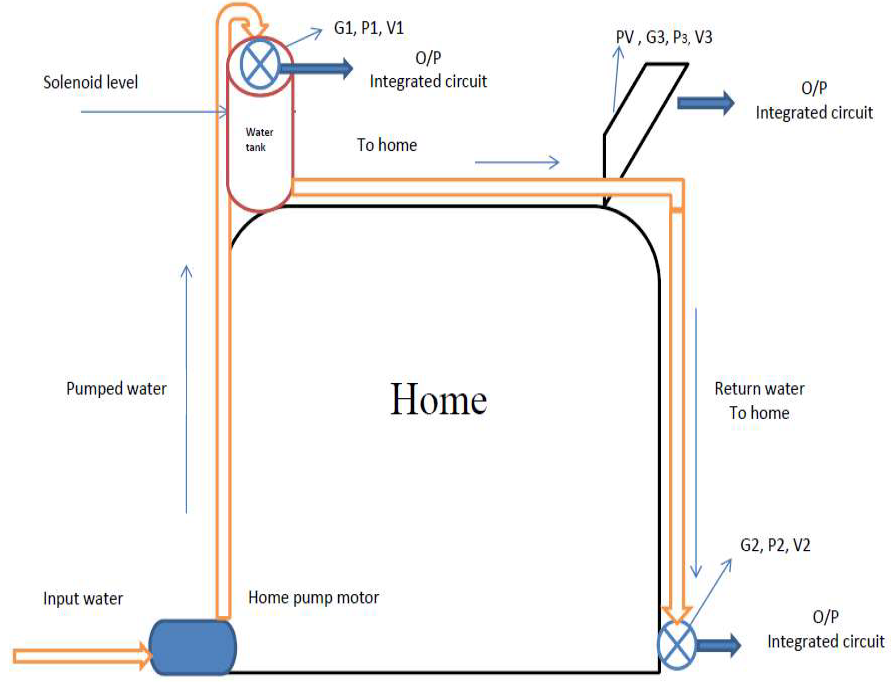
- The proposed pico-hydraulic and PV model is displayed in Figure 2; the compound system contains two pico-hydraulic and one PV generation unit to supply the required power (), and
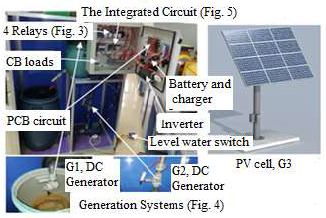
- The integrated system shown in Figure 3 contains three-generation outputs units (P1, P2, and P3/Ps), the Arduino program circuits, different relays operations (R1, R2, R3, and R4), charging circuit to storage energy battery/s, inverter to convert DC/AC voltage and selected loads contractors, this system is responsible for maintaining the supply voltage/power to batteries/loads under different cases.
- Explaining the benefits by using the daily natural resources for generating electrical energy;
- Applying the proposed integrated circuit (Figure 2 and Figure 13);
- Limiting the consumed electrical energy bill to a certain acceptable economic strip level by hybrid generation system;
- Executing high savings in energy and money and helping the environment to get rid of toxic exhausts such as CO2; and
- Verifying the proposed system by actual case study in Egypt.
7. Design the Proposed System with Actual Case Study
- The annual consumed energy for each Egyptian person is 2016 kWh/Y “the average person daily consumed energy is 5.5232 kWh, Figure 6”.
- Based on the report in [74], the average person daily consumed water is 300 Liters.
7.1. Consumed Energy
- The total power consumed ( ) is (5.523 × 5 = 27.616 kWh/D and 828.48 kWh/M),
- The total consumed water/day is (300 × 5 = 1500 L “1.5 m3”),
- The economic strip is up to 650 kWh/M, which means the monthly needed generation power from the proposed system will be 828.68 − 650 = 178.68 kWh/M,
- The proposed technique should generate the remainder value (27.616 − 21.66 = 5.956 kWh/D).
7.2. The Required Generation
7.2.1. The First Generation Turbine
- The total high is 7 m (1 m = 3.38 ft)
- According to [78], one gallon per minute = 5.45099 m3/day (0.227124 m3/h = 3.7854 × 10⁻³ m3/min):
- = 0.000493 × 9.81 × 1000 × 0.8 × 0.704 × 72.5189 = 197.528 W, or
- = 0.00633 × 9.81 × 1000 × 0.8 × 0.704 × 72.5189 × 0.06578 = 166.92 W.
7.2.2. The Second Generation Turbine
- = 0.000493 ∗ 9.81 ∗ 1000 ∗ 0.8 ∗ 7= 27.083 W, or
- = 0.00633 ∗ 9.81 ∗ 1000 ∗ 0.8 ∗ 7 ∗ 0.06578 = 22.89 W.
7.2.3. The Third Generation Turbine
- The home water motor will fill the tank by 3.157 min,
- The first generation unit () will give from 167 to 198 W during motor (3.94 min) operations (average = 182.5 W),
- The second-generation unit () will give from 23 to 27 W during serviced water homework times (average = 25 w), and
- The total average generation by pico-hydraulic units are 207.5 W/D, and the PV system should supply the remaining required power (5956 − 207.5 = 5.7485 kW/D).
- The pico-hydraulic proposed system will give a very low percentage (≈4%) of the required power;
- PV system will supply a huge amount of daily-required power (≈96%);
- The daily consumed power −5 persons- is 27,616 W, which means that; the average consumed power through one hour = 27,616/24 = 1150.66 W (pico-hydraulic generation units give 18 % of total consumed home power through one hour);
- The advantages of using the pico-hydraulic generation system are:
- Supply the emergency loads;
- High benefits usage of the home waters (supplied and wasted);
- Give green energy without any exhaust;
- It is a basic theory to be used in large wide in the high and extended buildings to give more supplied power;
- Applies for irrigation and sewage pumps systems (very high capacity pumped waters) to give high power.
- Egypt has a high ability to generate energy with solar systems, and
- The generated solar energy is very low related to the total generation energies from various generation stations (does not reach 0.28%).
7.3. Costs Analysis
7.3.1. PV System
- The needed power from PV is 5.7485 kW/D, and
- The minimum times of daily brightness of the sun range 6–8 h/day (average 7 h).
7.3.2. Pico-Hydraulic System
7.3.3. Economic Analysis of Project
- The guarantee for PV cells is not less than 20 years;
- The guarantee for the inverter is not less than ten years;
- The guarantee for batteries is about two years; and
- The guarantee for the DC generation units is from 8–12 years and other accessories.
7.4. Project for Residential Loads
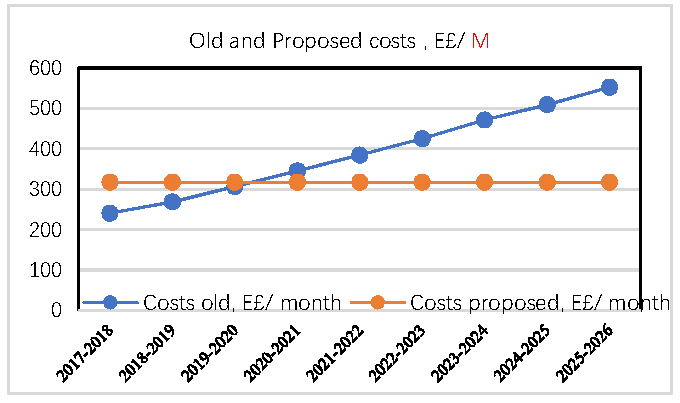
- Reference [74] has reported up to 2017–2018,
- The required energy from a hybrid system according to the above sections is 178.493 kWh/M to limit the strip within the economic level,
- This value will be calculated by; using the Egyptian tariff (strip 651–1000) and by the hybrid system to explain its savings,
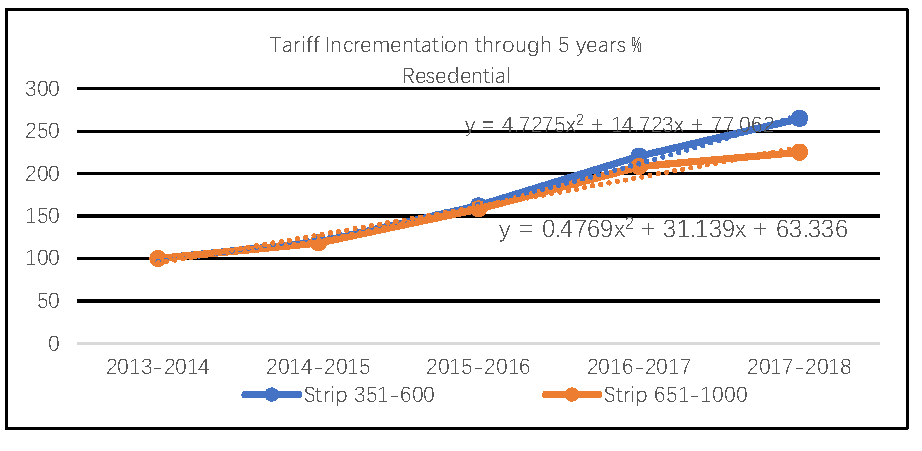
- is the percentage incrementations and x is the number of year/s (e.g., x = 5 for 2017–2018, x = 6 for 2018–2019...etc.),
- Using Table 6 and Equation (18):
- Table 7 values are derived from Equation (19) after multiplying Equation (18) by 0.94 (error of 0.06):
Contributions of the Hybrid System
- The proposed system gives (27.616–21.66 = 5.956 kWh/D), which equals 21.567 % of the total residential loads (family with five persons);
- This system will succeed to give the same percentage for all the residential application loads (from Table 8 = 66,809 GWh); then
- The given generated energy from the proposed hybrid system is 14408.83 GWh/years) (0.21567 × 66089 GWh).
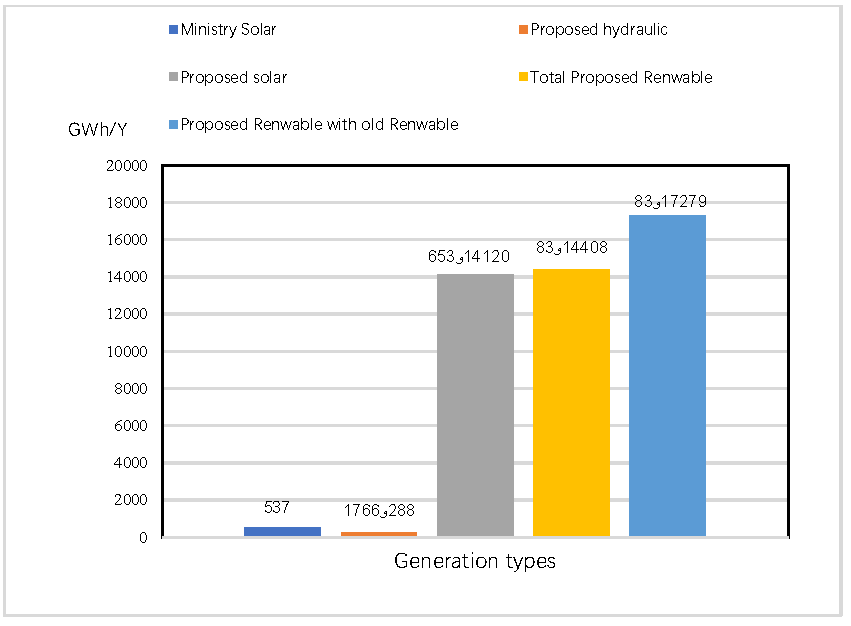
- The renewable ministry systems solar generation contributes only 537 GWh/Y, which equals 0.2729% of the total developed generated energies;
- The proposed hybrid system will raise the contribution of the renewable (proposed + old solar) to be 14,945.83 (537 + 14,408.83), which equals 7.5959% of the total developed generated energies and leads to reduce the generations of other sources (e.g., steam by the same 7.5959% values, decreasing in CO2 exhausts);
- The proposed and wind energies will share 8.782 % (17,279.83 GWh/Y) of the total developed generation energies.
- According to Table 3 and Table 7, the proposed hybrid system has two generations systems (Figure 12):
- Pic-hydraulic system: it contributes by 288.1766 GWh/Y (2 % of 14,408.83), which has a percentage of 0.14646 % of the total developed generated energies “half the sharing percentage of the traditional solar system”, and
- The solar system contributes by 14,120.653 GWh/Y (98% of 14,408.83), which has a percentage of 7.1765 from the total developed generated energies (26.29 times the sharing percentage of the traditional solar system of the ministry).
- The generation stations can reduce the total outputs to be 182,351.17 GWh/Y, which is 92.677% of the old total developed generated energies (7.323% reduction);
- By using the savings from Table 6, the percentage saving money by the hybrid proposed system is 29.03% related to the traditional system (return to subscribes);
- From Table 8, the proposed system gives 14,408.83 GWh/Y, by using Table 7 for tariff cost from 2017–2027 (ten years) E£/kWh:
- The total costs of 14,408.83 GWh through 10 years equal 14,408.83 × (1.35 + 1.057 + 1.718 + 1.934 + 2.155 + 2.382 + 2.614 + 2.852 + 3.094 + 3.343) = 330,668.2397 million E£/10Ys (20,666.76 million $ with rate of change $ = 16 E£)
- The return residential subscribes savings in money through ten years = 330,668.2397 × 0.2903 = 95,992.9899 million E£/10Ys (5999.5618 million $)
- The proposed system will reduce the exhaust from steam stations’ (CO2) by 7.3%, which leads to a higher clean environment.
- Figure 12 explains the effectiveness of the proposed hybrid system on the renewable generation Egyptian systems (2017–2018).
8. The Hybrid Generation System
Applicable Model
9. Conclusions and Policy Implications
- Continuous supply allowable charging voltages to inverter/batteries by this intelligent circuit (whether the outputs voltages from water/solar in its ranges/levels or not).
- Emergency supply system home loads can be supplied.
- Increase the contribution of renewable energy by the solar system from 0.273% to 7.595% of the total different installed generation stations in Egypt.
- Saves a lot of money for residential users (subscribers); each family can save 11,073 E£/10 Y ($296.06) through service lifetimes of application of this proposed system related to supplying the same loads by the government system.
- On a large scale, according to Table 9, the savings in money in the residential subscriptions sector (through ten years) ranged from 9599.298 million E£/10Ys (lowest percentage, 10%) up to 86,393.68 million E£/10Ys = 5399.6 million $ (percentage 90%).
- Uses the daily human usage water in the home to give 288.1766 GWh/Y (2% of 14,408.83), which has a percentage of 0.14646% of the total developed generated energies (half the sharing percentage of the total updated traditional solar system in Egypt through 2017–2018).
- Uses solar energy (nature resource) to give 14,120.653 GWh/Y (98% of 14,408.83), which has a percentage of 7.1765% of the total developed generated energies (26.29 times the sharing percentage of the traditional solar system in Egypt through 2017–2018).
- Help the Egyptian electrical ministry to reduce the energy outputs from its generation stations to be 182,351.17 GWh/Y. This reduction is 7.323% of the total developed supplied energy, which increases the service lifetime of ministry generation stations (decreasing their maximum loads) and gives the government a chance to install new projects to use this extra generation energy.
- Increase the system power quality.
- For environmental impact, it reduces the exhaust from steam stations’ (CO2 (by 7.3%), which equals the added by the proposed system), which leads to a higher clean environment.
- Some of the houses are individuals (e.g., Villa), which has its green land around it. This green land takes about half the quantity of water house; this means the generation of pico-hydraulic may share with another percentage value added to the previous percentage.
- It can be applied to all residential and commercial buildings to save users and the government more.
- This proposed study must be supported by governments by giving bonuses on the bill, and reducing the cost by not applying tax and customs on the products used in the application to consumers in a residential and commercial building, and
- Try to apply this model for large scales (e.g., irrigation projects).
Author Contributions
Funding
Acknowledgments
Conflicts of Interest
Nomenclature
| Abbreviations | |
| ACHE | Adaptive control of the home environment |
| PV. | Photo-voltaic |
| PVT | Photovoltaic thermal |
| PVT-CR | Photothermic–radiative cooling |
| CPV | Concentrator Photovoltaic |
| RE | Renewable Energy |
| Symbols | |
| Theoretical mechanical horsepower | |
| Q | The flow rate in cubic feet per second |
| V | The velocity of flow, m/s |
| P | Pressure, N/m2 |
| Ρ | The density of water, kg/m3 |
| The output from the turbine, W | |
| Q | The flow rate in the pipe (m3/s) |
| G | Acceleration of gravity (for water = 9.81 m/s2) |
| The net height, m | |
| Gross vertical head, m | |
| Head loss, m | |
| Turbine efficiency | |
| The net output from the generator, W | |
| Generator efficiency | |
| The specific speed of the turbine, rpm | |
| Turbine’s rotation speed (rpm) | |
| Daily consumed power for each family home person is denoted by, KWh | |
| N | Number of family persons |
| The actual total family persons daily consumed power, KWh | |
| Consumed water/family person, m3 | |
| Total consumed water for all family persons, m3 | |
| Total consumed power for all family persons must be Limited to economic value, and it is denoted by, KWh | |
| The pressure, psi | |
| Total dynamic head, feet | |
| Pumping rate in gallons per minute | |
| Additional solar generation power, KW h | |
| E£ | Egyptian pound |
References
- Mehta, V.K.; Mehta, R. Principles of Power Systems; Chand: New Delhi, India, 2005; p. 15. [Google Scholar]
- Fang, Y.; Wei, W.; Mei, S.; Chen, L.; Zhang, X.; Huang, S. Promoting electric vehicle charging infrastructure considering policy incentives and user preferences: An evolutionary game model in a small-world network. J. Clean. Prod. 2020, 258, 120753. [Google Scholar] [CrossRef]
- Pérez-Lombard, L.; Ortiz, J.; Pout, C. A review on buildings energy consumption information. Energy Build. 2008, 40, 394–398. [Google Scholar] [CrossRef]
- Zazzini, P.; Romano, A.; Di Lorenzo, A.; Portaluri, V.; Di Crescenzo, A. Experimental Analysis of the Performance of Light Shelves in Different Geometrical Configurations Through the Scale Model Approach. J. Daylighting 2020, 7, 37–56. [Google Scholar] [CrossRef][Green Version]
- Ricquebourg, V.; Menga, D.; Durand, D.; Marhic, B.; Delahoche, L.; Loge, C. The Smart Home Concept: Our immediate future. In Proceedings of the 2006 1ST IEEE International Conference on E-Learning in Industrial Electronics, Hammamet, Tunisia, 18–20 December 2006; pp. 23–28. [Google Scholar]
- Sripan, M.; Lin, X.; Petchlorlean, P.; Ketcham, M. Research and thinking of smart home technology. In Proceedings of the International Conference on Systems and Electronic Engineering (ICSEE’2012), Phuket, Thailand, 18–19 November 2012; pp. 61–64. [Google Scholar]
- Alam, M.R.; Reaz, M.B.I.; Ali, M.A.M. A Review of Smart Homes—Past, Present, and Future. IEEE Trans. Syst. Man Cybern. Part C 2012, 42, 1190–1203. [Google Scholar] [CrossRef]
- Rehman, A.U.; Wadud, Z.; Elavarasan, R.M.; Hafeez, G.; Khan, I.; Shafiq, Z.; Alhelou, H.H. An Optimal Power Usage Scheduling in Smart Grid Integrated With Renewable Energy Sources for Energy Management. IEEE Access 2021, 9, 84619–84638. [Google Scholar] [CrossRef]
- The Lighting Handbook; Zumtobel Lighting GmbH: Dornbirn, Austria, 2016; Available online: https://www.zumtobel.com/PDB/teaser/SV/Lichthandbuch.pdf (accessed on 10 September 2021).
- Selim, F.; Abdelwanis, M.I. Advance low-cost smart power savings system for public buildings. In Proceedings of the 11th ICEENG Conference, Cairo, Egypt, 3–5 April 2018. [Google Scholar] [CrossRef]
- Li, Z.; Li, J.; Li, X.; Yang, Y.; Xiao, J.; Xu, B. Design of Office Intelligent Lighting System Based on Arduino. Procedia Comput. Sci. 2020, 166, 134–138. [Google Scholar] [CrossRef]
- Ergüzel, A.T. A study on the implementation of dimmable street lighting according to vehicle traffic density. Optik 2019, 184, 142–152. [Google Scholar] [CrossRef]
- Li, D.H.W.; Li, S.; Chen, W. Estimating the switching frequency and energy saving for daylight-linked lighting on-off controls. Energy Procedia 2019, 158, 2878–2883. [Google Scholar] [CrossRef]
- Chraibi, S.; Creemers, P.; Rosenkötter, C.; Van Loenen, E.; Aries, M.; Rosemann, A. Dimming strategies for open office lighting: User experience and acceptance. Light. Res. Technol. 2019, 51, 513–529. [Google Scholar] [CrossRef]
- Wagiman, K.R.; Abdullah, M.N.; Hassan, M.Y.; Radzi, N.H.M.; Abu Bakar, A.H.; Kwang, T.C. Lighting system control techniques in commercial buildings: Current trends and future directions. J. Build. Eng. 2020, 31, 101342. [Google Scholar] [CrossRef]
- Elavarasan, R.M.; Shafiullah, G.; Padmanaban, S.; Kumar, N.M.; Annam, A.; Vetrichelvan, A.M.; Mihet-Popa, L.; Holm-Nielsen, J.B. A Comprehensive Review on Renewable Energy Development, Challenges, and Policies of Leading Indian States With an International Perspective. IEEE Access 2020, 8, 74432–74457. [Google Scholar] [CrossRef]
- Elavarasan, R.; Shafiullah, G.; Kumar, N.M.; Padmanaban, S. A State-of-the-Art Review on the Drive of Renewables in Gujarat, State of India: Present Situation, Barriers and Future Initiatives. Energies 2019, 13, 40. [Google Scholar] [CrossRef]
- Hassan, T.-U.; Abbassi, R.; Jerbi, H.; Mehmood, K.; Tahir, M.; Cheema, K.; Elavarasan, R.; Ali, F.; Khan, I. A Novel Algorithm for MPPT of an Isolated PV System Using Push Pull Converter with Fuzzy Logic Controller. Energies 2020, 13, 4007. [Google Scholar] [CrossRef]
- Kiani, A.T.; Nadeem, M.F.; Ahmed, A.; Khan, I.; Elavarasan, R.M.; Das, N. Optimal PV Parameter Estimation via Double Exponential Function-Based Dynamic Inertia Weight Particle Swarm Optimization. Energies 2020, 13, 4037. [Google Scholar] [CrossRef]
- Kumar, S.; Sarita, K.; Vardhan, A.; Elavarasan, R.; Saket, R.; Das, N. Reliability Assessment of Wind-Solar Pv Integrated Distribution System Using Electrical Loss Minimization Technique. Energies 2020, 13, 5631. [Google Scholar] [CrossRef]
- Elavarasan, R.M.; Leoponraj, S.; Dheeraj, A.; Irfan, M.; Sundar, G.G.; Mahesh, G. PV-Diesel-Hydrogen fuel cell based grid connected configurations for an institutional building using BWM framework and cost optimization algorithm. Sustain. Energy Technol. Assess. 2021, 43, 100934. [Google Scholar] [CrossRef]
- Shafiullah, G.; Masola, T.; Samu, R.; Elavarasan, R.M.; Begum, S.; Subramaniam, U.; Romlie, M.F.; Chowdhury, M.; Arif, M.T. Prospects of Hybrid Renewable Energy-Based Power System: A Case Study, Post Analysis of Chipendeke Micro-Hydro, Zimbabwe. IEEE Access 2021, 9, 73433–73452. [Google Scholar] [CrossRef]
- Al-Sakaf, O.H. Application possibilities of solar thermal power plants in Arab countries. Renew. Energy 1998, 14, 1–9. [Google Scholar] [CrossRef]
- Egypt Consumer Protection Agency. Available online: http://www.egyptera.org/ (accessed on 10 September 2021).
- Soliman, K.H. Rainfall over Egypt. Q. J. R. Meteorol. Soc. 1953, 79, 389–397. [Google Scholar] [CrossRef]
- WMO. The Climatological Norm for the Period 1961–1990 WMO/OMM. No. 847. Available online: https://library.wmo.int/index.php?lvl=categ_see&id=10986 (accessed on 10 September 2021).
- Shaltout, M.A. Egyptian solar radiation atlas. In New and Renewable Authority; Ministry of Electricity and Energy: Cairo, Egypt, 1991; Available online: http://www.worldcat.org/title/egyptian-solar-radiation-atlas/oclc/25011751 (accessed on 10 September 2021).
- Tadros, M. Uses of sunshine duration to estimate the global solar radiation over eight meteorological stations in Egypt. Renew. Energy 2000, 21, 231–246. [Google Scholar] [CrossRef]
- Robaa, S. Evaluation of sunshine duration from cloud data in Egypt. Energy 2008, 33, 785–795. [Google Scholar] [CrossRef]
- Angstrom, A. Solar and terrestrial radiation. Report to the international commission for solar research on actinometric investigations of solar and atmospheric radiation. Q. J. R. Meteorol. Soc. 1924, 50, 121–126. [Google Scholar] [CrossRef]
- Liu, B.Y.; Jordan, R.C. The interrelationship and characteristic distribution of direct, diffuse and total solar radiation. Sol. Energy 1960, 4, 1–19. [Google Scholar] [CrossRef]
- Kabeel, A.; Abdelgaied, M.; Sathyamurthy, R. A comprehensive investigation of the optimization cooling technique for improving the performance of PV module with reflectors under Egyptian conditions. Sol. Energy 2019, 186, 257–263. [Google Scholar] [CrossRef]
- Elkholy, A. Harmonics assessment and mathematical modeling of power quality parameters for low voltage grid connected photovoltaic systems. Sol. Energy 2019, 183, 315–326. [Google Scholar] [CrossRef]
- Hemeida, A.; El-Ahmar, M.; El-Sayed, A.; Hasanien, H.M.; Alkhalaf, S.; Esmail, M.; Senjyu, T. Optimum design of hybrid wind/PV energy system for remote area. Ain Shams Eng. J. 2020, 11, 11–23. [Google Scholar] [CrossRef]
- Swief, R.; El-Amary, N.H. Optimal probabilistic reliable hybrid allocation for system reconfiguration applying WT/PV and reclosures. Ain Shams Eng. J. 2020, 11, 109–118. [Google Scholar] [CrossRef]
- Bureau of Reclamation. Hydroelectric Power; US Department of Interior. Available online: https://www.usbr.gov/power/ (accessed on 10 September 2021).
- Al-juboori, S.S. Hydroelectric Power. Energy Science & Technology: Opportunities and Challenges. Available online: https://www.researchgate.net/publication/315493188 (accessed on 10 September 2021).
- Singh, V.K.; Chauhan, N.S.; Kushwaha, D. An overview of hydroelectric power plant. ISST J. Mech. Eng. 2015, 6, 59–62. [Google Scholar]
- Lajqi, S.; Lajqi, N.; Hamidi, B. Design and construction of mini hydropower plant with propeller turbine. Int. J. Contemp. Energy 2016, 2, 1–13. [Google Scholar] [CrossRef]
- Li, J.; Saw, M.M.M.; Chen, S.; Yu, H. Short-Term Optimal Operation of Baluchaung II Hydropower Plant in Myanmar. Water 2020, 12, 504. [Google Scholar] [CrossRef]
- Uddin, W.; Ayesha, Z.K.; Haider, A.; Khan, B.; Islam, S.U.; Ishfaq, M.; Khan, I.; Adil, M.; Kim, H.J. Current and future prospects of small hydro power in Pakistan: A survey. Energy Strat. Rev. 2019, 24, 166–177. [Google Scholar] [CrossRef]
- Hatata, A.; El-Saadawi, M.; Saad, S. A feasibility study of small hydro power for selected locations in Egypt. Energy Strat. Rev. 2019, 24, 300–313. [Google Scholar] [CrossRef]
- Ribeiro, A.C.A. Mathematical Problems of Hydroelectric Power Stations Management. Ph.D Thesis, University of Porto, Porto, Portugal, 2014. [Google Scholar]
- Moniruzzaman, E. Hydroelectric Power Generation System. Master Thesis, Dhaka University of Engineering & Technology, Gazipur City, Bangladesh, 2019. Available online: https://www.researchgate.net/publication/332170877 (accessed on 8 September 2021).
- Hydro Electric Power (Hydel Power). Available online: https://www.studentenergy.org/topics/hydro-power (accessed on 8 September 2021).
- Anaza, S.O.; Abdulazeez, M.S.; Yisah, Y.A.; Yusuf, Y.O.; Salawu, B.U.; Momoh, S.U. Micro hydroelectric energy generation- an overview. Am. J. Eng. Res. 2017, 6, 5–12. [Google Scholar]
- How Much Hydropower Power Could I Generate from a Hydro Turbine? Renewable: The Hydro and Wind Co. Available online: https://www.renewablesfirst.co.uk/hydropower/hydropower-learning-centre/how-much-power-could-i-generate-from-a-hydro-turbine/ (accessed on 1 September 2021).
- Aqel, M.O.A.; Issa, A.; Qasem, E.; El-Khatib, W. Hydroelectric Generation from Water Pipelines of Buildings. In Proceedings of the 2018 International Conference on Promising Electronic Technologies (ICPET), Deir El-Balah, Palestine, 3–4 October 2018; pp. 63–68. [Google Scholar]
- Kougias, I.; Aggidis, G.; Avellan, F.; Deniz, S.; Lundin, U.; Moro, A.; Muntean, S.; Novara, D.; Pérez-Díaz, J.I.; Quaranta, E.; et al. Analysis of emerging technologies in the hydropower sector. Renew. Sustain. Energy Rev. 2019, 113, 109257. [Google Scholar] [CrossRef]
- Raja, A.K.; Srivastava, A.P.; Dwivedi, M. Power Plant Engineering; New Age International Ltd.: Delhi, India, 2006. [Google Scholar]
- Abdulkareem, M.A. Hydro-water power plant. Power Plant Lecture Notes; Al-Mustansiriya University Chapter 7. , 2017. Available online: https://www.researchgate.net/publication/304396387 (accessed on 1 September 2021).
- Brekke, H. Hydraulic Turbines Design, Erection and Operation; Norwegian University of Science and Technology: Trondheim, Norway, 2001. [Google Scholar]
- Gabriel, C.D.; Odhiambo, P.; Odhach, J. Designing a Small Hydro Power Plant Capable of Producing 10 MW of Electricity at Webuye Along River Nzoia. First Year Project, Nairobi University. 2015. Available online: https://pdfcoffee.com/design-of-a-small-hydro-power-plantpdf-pdf-free.html (accessed on 1 August 2021).
- Zaman, A.; Khan, T. Design of a water wheel for a low head micro hydro power system. J. Basic Sci. Technol. 2012, 1, 1–6. [Google Scholar]
- Abdel-Aziz, T.M.; Salam, N.M.A. Characteristic Equations for Hydropower Stations of Main Barrages in Egypt. In Proceedings of the Eleventh International Water Technology Conference IWTC11, Sharm El-Sheikh, Egypt, 1 January 2007; Available online: https://www.researchgate.net/publication/270750891_CHARACTERISTIC_EQUATIONS_FOR_HYDROPOWER_STATIONS_OF_MAIN_BARRAGES_IN_EGYPT (accessed on 1 August 2021).
- Module 5 Hydropower Engineering. Version 2 CE IIT, Kharagpur. Available online: https://www.yumpu.com/en/document/view/15174084/module-5-nptel (accessed on 1 August 2021).
- Pali, B.S.; Vadhera, S. An Innovative Continuous Power Generation System Comprising of Wind Energy Along With Pumped-Hydro Storage and Open Well. IEEE Trans. Sustain. Energy 2020, 11, 145–153. [Google Scholar] [CrossRef]
- Zainuddin, H.; Yahaya, M.S.; Lazi, J.M.; Basar, M.M.F.; Ibrahim, Z. Design and development of pico-hydro generation system for energy storage using consuming water distributed to houses. Int. J. Electr. Comput. Energetic Electron. Commun. Eng. 2009, 3, 1928–1932. Available online: https://www.researchgate.net/publication/280688181 (accessed on 1 August 2021).
- Fipps, G. Calculating Horsepower Requirements and Sizing Irrigation Supply Pipelines; Texas Agricultural Extension Service, Texas A&M University System: College Station, TX, USA, 2019; Available online: https://cdn-ext.agnet.tamu.edu/wp-content/uploads/2019/03/EB-6011-calculating-horsepower-requirements-and-sizing-supply-pipelines-for-irrigation.pdf (accessed on 11 June 2021).
- Li, P.; Zhou, K.; Lu, X.; Yang, S. A hybrid deep learning model for short-term PV power forecasting. Appl. Energy 2020, 259, 114216. [Google Scholar] [CrossRef]
- Shen, L.; Li, Z.; Ma, T. Analysis of the power loss and quantification of the energy distribution in PV module. Appl. Energy 2020, 260, 114333. [Google Scholar] [CrossRef]
- Jordehi, A.R. Enhanced leader particle swarm optimisation (ELPSO): An efficient algorithm for parameter estimation of photovoltaic (PV) cells and modules. Sol. Energy 2018, 159, 78–87. [Google Scholar] [CrossRef]
- Chen, Y.; Sun, Y.; Meng, Z. An improved explicit double-diode model of solar cells: Fitness verification and parameter extraction. Energy Convers. Manag. 2018, 169, 345–358. [Google Scholar] [CrossRef]
- Rezk, H.; Fathy, A. A novel optimal parameters identification of triple-junction solar cell based on a recently meta-heuristic water cycle algorithm. Sol. Energy 2017, 157, 778–791. [Google Scholar] [CrossRef]
- Mostafa, M.R.; Saad, N.H.; El-Sattar, A.A. Tracking the maximum power point of PV array by sliding mode control method. Ain Shams Eng. J. 2020, 11, 119–131. [Google Scholar] [CrossRef]
- Rahmanian, S.; Hamzavi, A. Effects of pump power on performance analysis of photovoltaic thermal system using CNT nanofluid. Sol. Energy 2020, 201, 787–797. [Google Scholar] [CrossRef]
- Esfe, M.H.; Kamyab, M.H.; Valadkhani, M. Application of nanofluids and fluids in photovoltaic thermal system: An updated review. Sol. Energy 2020, 199, 796–818. [Google Scholar] [CrossRef]
- Müller, J.; Trutnevyte, E. Spatial projections of solar PV installations at subnational level: Accuracy testing of regression models. Appl. Energy 2020, 265, 114747. [Google Scholar] [CrossRef]
- Hu, M.; Zhao, B.; Ao, X.; Ren, X.; Cao, J.; Wang, Q.; Su, Y.; Pei, G. Performance assessment of a trifunctional system integrating solar PV, solar thermal, and radiative sky cooling. Appl. Energy 2020, 260, 114167. [Google Scholar] [CrossRef]
- Awad, M.; Radwan, A.; Abdelrehim, O.; Emam, M.; Shmroukh, A.N.; Ahmed, M. Performance evaluation of concentrator photovoltaic systems integrated with a new jet impingement-microchannel heat sink and heat spreader. Sol. Energy 2020, 199, 852–863. [Google Scholar] [CrossRef]
- Stainsby, W.; Zimmerle, D.; Duggan, G.P. A method to estimate residential PV generation from net-metered load data and system install date. Appl. Energy 2020, 267, 114895. [Google Scholar] [CrossRef]
- The Annual Report for Consumed Energy in Egypt. Available online: http://www.moee.gov.eg/test_new/ST_consumption.aspx (accessed on 1 August 2021).
- Egypt Electric Power Tariff. Available online: https://www.eehc.gov.eg/eehcportal/eng/YearlyReport/finalEnglish.pdf or http://egyptera.org/ar/Tarrif2017.aspx#; (accessed on 1 August 2021).
- The Consumed Water in Egypt. Available online: https://www.shorouknews.com/news/view.aspx?cdate=23092018&id=7637589e-6c70-4060-acf8-ad420dd7a838 (accessed on 1 August 2021).
- The Relation between Psi and Bar. Available online: https://www.differencebetween.com/difference-between-psi-and-bar (accessed on 13 June 2021).
- Psi to Bar Conversion. Available online: https://www.asknumbers.com/psi-to-bar.aspx (accessed on 13 June 2021).
- The Turbine-Generator Efficiency. Available online: http://www.orient-hose.com/project/pvc-garden-hose/?gclid=CjwKCAiA66_xBRBhEiwAhrMuLa3rkrJIiXuE8zZMG-fQ09yMuIWopQ0VXZ29HjyD_HzGzvafcKd1YBoCAAgQAvD_BwE (accessed on 13 June 2021).
- The Conversion between Gallon to Cubic Metre. Available online: https://www.convertunits.com/from/gallons+per+minute/to/cubic+meters+per+day (accessed on 15 June 2021).
- The Prices of Inverters. Available online: https://www.made-in-china.com/products-search/hot-china-products/DC_To_AC_Inverter.html (accessed on 18 June 2021).
- The Prices of PV. Available online: https://www.google.com/search?q=solar+ell+price+lis+dollar&tbm=isch&ved=2ahUKEwjXoYzdt9voAhUTO-wKHTjeBjEQ2-cCegQIABAA&oq=solar+ell+price+lis+dollar&gs_lcp=CgNpbWcQAzoECCMQJzoCCAA6BAgAEEM6BAgAEB46BAgAEBM6CAgAEAgQHhATUIWCAlidzwJgxtICaABwAHgAgAHOAogBrC2SAQgwLjcuMTcuMpgBAKABAaoBC2d3cy13aXotaW1n&sclient=img&ei=JyGPXpfyFpP2sAe4vJuIAw&bih=708&biw=1440&rlz=1C1SQJL_enSA867SA868&safe=strict#imgrc=n6wyL-JxQHwOjM (accessed on 19 June 2021).
- PV Products and Prices. Available online: https://www.amazon.com/SAVEMORE4U18/b/ref=bl_dp_s_web_17348805011?ie=UTF8&node=17348805011&field-lbr_brands_browse-bin=SAVEMORE4U18 (accessed on 19 June 2021).
- DC Generators Types and Prices. Available online: https://www.alibaba.com/product-detail/Germany-Free-Ship-Lithium-ion-20Ah_62003155567.html?spm=a2700.pcdrm.normalList.10.2e53rTdbrTdbeu&s=p&fullFirstScreen=truehttps://www.qoo10.sg/g/544768068?source=ig102cc4da3c06559e5d1c405d9cf0283pte7p3f-000M00h0&jaehuid=2026298010 (accessed on 19 June 2021).
- Walubita, L.F.; Djebou, D.C.S.; Faruk, A.N.M.; Lee, S.I.; Dessouky, S.; Hu, X. Prospective of Societal and Environmental Benefits of Piezoelectric Technology in Road Energy Harvesting. Sustainability 2018, 10, 383. [Google Scholar] [CrossRef]





| Category | Capacity | Application |
|---|---|---|
| Large | 50–1000 MW | Large cities |
| Small | 1–50 MW | Small cities to towers |
| Mini | 100–1000 kW | Towers |
| Micro | <100 kW | Rural community |
| Pico | <5 kW | Individual home |
| Type of Turbine | Range of Head | Specific Speed in Metric Units |
|---|---|---|
| Pelton (1 nozzle) Pelton (2 nozzle) Pelton (4 nozzle) | 200 m to 2000 m | 10–20 20–40 40–50 |
| Turgo impulse turbine | as above | 50–100 |
| Francis (low speed) Francis (medium speed) Francis (high speed) Francis (express) | 15 m to 300 m | 80–120 120–220 220–350 350–420 |
| Propeller | 5–30 m | 310–1000 |
| Item | Value | Item | Value |
|---|---|---|---|
| Water motor, hp | 0.75 | /day, kW | 5.956 |
| Net head, , m | 7 | /day, W | 207.5 |
| Q/day, m3 | 1.5 | /day, W | 5748.5 |
| Person power/day, kW | 5.523 | %Pico-hydraulic shared/day | 4 % |
| 5 Persons power/day, Kw | 27.616 | %Pico-hydraulic shared/one hour | 18 % |
| Generation Type/Years | 2012–2013 | 2013–2014 | 2014–2015 | 2015–2016 | 2016–2017 | 2017–2018 | |
|---|---|---|---|---|---|---|---|
| Total, GWh | 164,628 | 168,050 | 174,875 | 186,320 | 189,550 | 196,760 | |
| Renewable | Total | 1497 | 1446 | 1558 | 2225.5 | 2780 | 2871 |
| % | 0.909 | 0.860 | 0.890 | 1.194 | 1.466 | 1.459 | |
| Solar | 237 | 114 | 0 | 167.5 | 580 | 537 | |
| % | 0.1439 | 0.067 | 0 | 0.089 | 0.305 | 0.2729 | |
| Wind, | 1260 | 1332 | 1558 | 2058 | 2200 | 2334 | |
| Hydraulic | Gen. | 13,121 | 13,352 | 13,822 | 13,545 | 12,850 | 12,726 |
| % | 7.97 | 7.945 | 7.90 | 7.269 | 6.779 | 6.467 | |
| Types | Costs, $/Gen | PV | Hydraulic |
|---|---|---|---|
| Solar cell | Price, $/W | 0.28 | |
| Costs 1000 W, $ | 280 | ||
| DC generator | Price (190 W), $ | 245 | |
| Price (20 W), $ | 25.8 | ||
| Arduino | Price, $ | 33 | |
| PCB | Price, $ | 25 | |
| Relays | Price, $ | 3 | |
| Price (5), $ | 15 | ||
| Voltage sensors | Price, $ | 3 | |
| Price (2), $ | 6 | ||
| Batteries | Price(1200 W), $ | 289 | |
| Inverter | Price(2000 W), $ | 109 | |
| Accessories and labor | Price, $ | 200 | |
| Total costs, $ | 1227.8 | ||
| Years | 2013–2014 | 2014–2015 | 2015–2016 | 2016–2017 | 2017–2018 | ||||||
|---|---|---|---|---|---|---|---|---|---|---|---|
| Buildings | Strips | Resid. | Comm. | Resid. | Comm. | Resid. | Comm. | Resid. | Comm. | Resid. | Comm. |
| Resid. | 351–650 | 0.34 | - | 0.405 | - | 0.55 | - | 0.75 | - | 0.9 | - |
| % Increasing | 100 | - | 119.117 | - | 161.76 | - | 220.588 | - | 264.705 | ||
| 651–1000 | 0.6 | - | 0.71 | - | 0.95 | - | 1.25 | - | 1.35 | - | |
| % Increasing | 100 | - | 118.33 | 158.33 | - | 208.333 | - | 225 | - | ||
| Commercial | 251–600 | - | 0.59 | - | 0.61 | - | 0.69 | - | 0.96 | - | 1.15 |
| % Increasing | - | 100 | - | 103.389 | - | 116.949 | - | 162.711 | - | 194.915 | |
| 601–1000 | - | 0.78 | - | 0.81 | - | 0.96 | - | 1.35 | - | 1.45 | |
| % Increasing | - | 100 | - | 103.845 | - | 123.076 | - | 173.076 | - | 185.897 | |
| Years | 2017–2018 x = 5 | 2018–2019 x = 6 | 2019–2020 x = 7 | 2020–2021 x = 8 | 2021–2022, x = 9 | 2022–2023 x = 10 | 2023–2024 x = 11 | 2024–2025 x = 12 | 2025–2026 x = 13 | 2026–2027 x = 14 |
|---|---|---|---|---|---|---|---|---|---|---|
| % Incremen. | 225 | 251.298 | 286.396 | 322.391 | 359.28 | 397.07 | 435.755 | 475.33 | 515.81 | 557.189 |
| Tariff, 0.6 E£ (basic) | 1.35 | 1.507 | 1.718 | 1.934 | 2.155 | 2.382 | 2.614 | 2.852 | 3.094 | 3.343 |
| Cost, 78.493 E£/M | 240.965 | 268.988 | 306.65 | 345.205 | 384.65 | 425.170 | 471.507 | 509.06 | 552.257 | 596.702 |
| Costs, E£/10Y”Old sys.” | 2891.58 | 3227.85 | 3679.8 | 4142.46 | 4615.8 | 5102.04 | 5658.08 | 6108.72 | 6627.08 | 7160.42 |
| Total costs, E£/10Y “Old sys.” 49,213.855 | ||||||||||
| Total costs, E£/10Y “Proposed sys.” 38,140.8 | ||||||||||
| % Total money-saving, E£/10Y | 29.03%, = 11,073.055 E£/10 years | |||||||||
| % Savings w.r.t 814.08/Y | −24.186 | −15.369 | −3.52 | 8.60 | 21.02 | 33.708 | 48.347 | 60.162 | 73.75 | 87.73 |
| System Types/Items | Traditional System | Proposed Hybrid System | ||||||||||
|---|---|---|---|---|---|---|---|---|---|---|---|---|
| Generation Systems | Total Generations, GWh | Residential Loads, GWh | Renewable, GWh (Solar) | Total Generations, GWh | Residential Loads, GWh | Renewable, GWh | ||||||
| Generation Types | By Minis. | By Prop. | By Minis. | By Prop. | By Minis. | By Prop. | By Minist. | By Prop. | By Minis. | By Prop. | By Minis. | By Prop. |
| Energy values, GWh | 196,760 | - | 66,809 | - | 537 | - | 182,351.17 | 14,408.83 | 52,400.16 | 14,408.83 | 537 | 14,408.83 |
| Energy Percentages, % | 100 | - | 33.954 | - | 0.2729 | - | 92.676 | 7.323 | 78.432 | 21.5671 | 0.2729 | 7.323 |
| Total percentage without wind, % | 0.2729 | 7.5959 | ||||||||||
| Total percentage with wind, % | 1.4591 | 8.782 | ||||||||||
| Percentages % | Generations, GWh | Ct = Costs for 10 Years Million E£/$ × 22.949 (Table 8) | Saving Money Million E£/$, Ct × 0.2903 |
|---|---|---|---|
| 10 | 1440.883 | 33,066.82/2066.676 | 9599.298/599.956 |
| 20 | 2881.766 | 66,133.64/4133.35 | 19,198.595/1199.91 |
| 30 | 4322.649 | 99,200.46/6200.02 | 28,797.89/1799.868 |
| 40 | 5763.532 | 132,267.28/8266.705 | 38,397.19/2399.8244 |
| 50 | 7204.415 | 165,334.1/10,333.38 | 47,996.489/2999.78 |
| 60 | 8645.298 | 198,400.9/12,400.05 | 57,595.78/3599.73 |
| 70 | 10,086.181 | 231,467.74/14,466.73 | 67,195.08/4199.69 |
| 80 | 11,527.06 | 264,534.56/16,533.41 | 76,794.38/4799.64 |
| 90 | 12,967.947 | 297,601/18,600 | 86,393.68/5399.6 |
| Cases | Pump 1 * | Pump 2 * | PV ** | Total O/P | ||||||||
|---|---|---|---|---|---|---|---|---|---|---|---|---|
| V, V | I, A | P1, W | V, V | I, A | P2, W | V, V | I, A | P3, W | V, V | I, A | PT W | |
| 1 | 12 | 0.83 | 10 | - | - | - | - | - | - | 12 | 0.83 | 10 |
| 2 | - | - | - | 10 | 0.8 | 8 | - | - | - | 10 | 0.8 | 8 |
| 3 | - | - | - | - | - | - | 12 | 8.3 | 100 | 12 | 8.3 | 100 |
| 4 | 12 | 0.83 | 10 | - | - | - | 12 | 8.3 | 100 | 12 | 9.1 | 109.95 |
| 5 | - | - | - | 10 | 0.8 | 8 | 12 | 8.3 | 100 | 11 | 9.1 | 108 |
| 6 | 12 | 0.83 | 10 | 5.6 | 0.44 | 2.46 | - | - | - | 12 | 0.83 | 10 |
| 7 | 8 | 0.66 | 5.28 | 4.2 | 0.336 | 1.4 | - | - | - | 12.2 | 0.996 | 6.6 |
Publisher’s Note: MDPI stays neutral with regard to jurisdictional claims in published maps and institutional affiliations. |
© 2021 by the authors. Licensee MDPI, Basel, Switzerland. This article is an open access article distributed under the terms and conditions of the Creative Commons Attribution (CC BY) license (https://creativecommons.org/licenses/by/4.0/).
Share and Cite
Selim, F.F.; Abdelaziz, A.; Taha, I.B.M. Economic Design of Hybrid Pico-Hydraulic/Photovoltaic Generation System: A Case Study in Egypt. Electronics 2021, 10, 2947. https://doi.org/10.3390/electronics10232947
Selim FF, Abdelaziz A, Taha IBM. Economic Design of Hybrid Pico-Hydraulic/Photovoltaic Generation System: A Case Study in Egypt. Electronics. 2021; 10(23):2947. https://doi.org/10.3390/electronics10232947
Chicago/Turabian StyleSelim, Fathalla F., Almoataz Abdelaziz, and Ibrahim B. M. Taha. 2021. "Economic Design of Hybrid Pico-Hydraulic/Photovoltaic Generation System: A Case Study in Egypt" Electronics 10, no. 23: 2947. https://doi.org/10.3390/electronics10232947
APA StyleSelim, F. F., Abdelaziz, A., & Taha, I. B. M. (2021). Economic Design of Hybrid Pico-Hydraulic/Photovoltaic Generation System: A Case Study in Egypt. Electronics, 10(23), 2947. https://doi.org/10.3390/electronics10232947


