Article

Mapping Discrete Emotions in the Dimensional Space: An Acoustic Approach

1
Institute of Informatics of the Slovak Academy of Sciences, 845 07 Bratislava, Slovakia
2
Institute of Flight Guidance, German Aerospace Center, 38108 Braunschweig, Germany
*
Authors to whom correspondence should be addressed.
Electronics 2021, 10(23), 2950; https://doi.org/10.3390/electronics10232950
Submission received: 30 September 2021 / Revised: 19 November 2021 / Accepted: 25 November 2021 / Published: 27 November 2021
(This article belongs to the Special Issue Human Computer Interaction for Intelligent Systems)

Abstract

:
A frequently used procedure to examine the relationship between categorical and dimensional descriptions of emotions is to ask subjects to place verbal expressions representing emotions in a continuous multidimensional emotional space. This work chooses a different approach. It aims at creating a system predicting the values of Activation and Valence (AV) directly from the sound of emotional speech utterances without the use of its semantic content or any other additional information. The system uses X-vectors to represent sound characteristics of the utterance and Support Vector Regressor for the estimation the AV values. The system is trained on a pool of three publicly available databases with dimensional annotation of emotions. The quality of regression is evaluated on the test sets of the same databases. Mapping of categorical emotions to the dimensional space is tested on another pool of eight categorically annotated databases. The aim of the work was to test whether in each unseen database the predicted values of Valence and Activation will place emotion-tagged utterances in the AV space in accordance with expectations based on Russell’s circumplex model of affective space. Due to the great variability of speech data, clusters of emotions create overlapping clouds. Their average location can be represented by centroids. A hypothesis on the position of these centroids is formulated and evaluated. The system’s ability to separate the emotions is evaluated by measuring the distance of the centroids. It can be concluded that the system works as expected and the positions of the clusters follow the hypothesized rules. Although the variance in individual measurements is still very high and the overlap of emotion clusters is large, it can be stated that the AV coordinates predicted by the system lead to an observable separation of the emotions in accordance with the hypothesis. Knowledge from training databases can therefore be used to predict AV coordinates of unseen data of various origins. This could be used to detect high levels of stress or depression. With the appearance of more dimensionally annotated training data, the systems predicting emotional dimensions from speech sound will become more robust and usable in practical applications in call-centers, avatars, robots, information-providing systems, security applications, and the like.

1. Introduction

According to Scherer’s component process definition of emotion [1], vocal expression is one of the components of emotion fulfilling the function of communication of reaction and behavioral intention. It is therefore reasonable to assume that some information on the speaker’s emotion can be extracted from the speech signal.
We dared to call our article “Mapping discrete emotions into the dimensional space: An acoustic approach”, paraphrasing the title of the work [2], to draw attention to the fact that many authors attempt to identify the relationship between categorical and dimensional descriptions of emotions by trying to place a verbal term (label) expressing emotion, (i.e., the name of the category) in the dimensional space ([2,3], and others). This could be wrongly automatically taken for a typical position also for the vocal (acoustic) realizations of utterances of speech under the particular emotion. Evaluation of word terms designating emotions is a different task than evaluation of emotion contained in the sound of speech utterances; nevertheless, the correlation between the placement of emotion labels and the placement of the respective emotional utterances can intuitively be assumed. This work presents a system capable of predicting continuous values of Activation and Valence from the acoustic signal of an utterance and thus finding a position of the emotion presented vocally in the particular segment of speech in the AV space.
Affect, in psychology, refers to the underlying experience of feeling, emotion or mood [4]. AV space can be used to represent affective properties not only of emotional but also stressful, insisting, warning, or calming speech, vocal manifestations of a physical condition, such as pain, or a mental condition, such as depression. Coordinates in AV space can be used to map and compare different types of affective manifestations. For example, one can try to use emotional databases to train a speech stress indicator or an anxiety and depression detect. This work offers a system for predicting such coordinates from the sound of emotional utterance. However, it must always be kept in mind that representation in two-dimensional space greatly reduces affective (and acoustic) information, and the functionality of such indicative mapping must always be well verified with respect to the needs of the application.

2. Discrete (Categorical) versus Dimensional (Continuous) Characterization of Emotions

The properties of emotions are usually described either categorically, by assigning the emotion to one of the predefined categories or classes, or dimensionally, by defining the coordinates of the emotion in a continuum of multidimensional emotional space [5]. Affective states (i.e., emotion, mood, and feeling) are structured in two fundamental dimensions: Valence and Arousal [6]. Russell has proposed a circumplex model of affect ad has categorized verbal expressions in English language in the two-dimensional space of Arousal–Valence (AV) [3]. The degree-of-arousal dimension is also called activation–deactivation [7], or engagement–disengagement. In this work, we adopt this two-dimensional approach.
As all the three dimensionally annotated databases have the dimensions called Activation and Valence, from now on we use this terminology and difference between terms Arousal and Activation is neglected. The term Arousal will be used when referring to the Russell’s work.
In many application scenarios, such as automatic information via voice, using avatars, customer services, etc., it would be useful to have an estimate available of the emotion or stress in the speaker’s voice. The system could take the affective state of the customer into account and adapt the mode of communication.

2.1. Issues in Predicting Emotional Dimensions from the Sound of an Utterance

The possibilities of human’s articulation system are physiologically limited. The acoustic cues of emotions are highly non-specific; the vocal realization of the utterance can be very similar in the presence of different emotions. Affective states form a continuum and dividing emotions into disjoint classes is an extreme oversimplification. The real emotions are complex; they almost never appear “in mixtures”. The meaning of terms describing emotions is ambiguous and culturally and linguistically dependent. Projections of various utterances into the AV space cannot be expected to be well separable with respect to emotion category. However, certain trends in their placement can be expected.
As noted by Gunes and Schuller [5], Activation is known to be well accessible in particular by acoustic features and Valence or positivity is known to be well accessible by linguistic features. Estimating Valence from the sound itself can therefore be particularly challenging. Oflazoglu and Yildirim [8] even claim that the regression performance for the Valence dimension of their system is low and that “This result indicates that acoustic information alone is not enough to discriminate emotions in Valence dimension” ([8], page 9 of 11).
A special issue is that very little is known about the mutual dependency of the dimensions of the emotional space [9,10]. The authors of this research have noticed that it is very hard for the annotators to evaluate Valence independently of Activation when the semantic information is unavailable. The emotions with low activation are often assigned Valence values in the center of the range.
Activation and Dominance show even higher interdependencies. In the analysis of their Turkish emotional database, Oflazoglu and Yildrim [8] show in Figure 8 of their paper the distribution of Activation and Dominance, which appears as a narrow cloud lying on the diagonal, which indicates a strong dependence between the ratings of Activation and Dominance dimensions. Nevertheless, extending the representation of space to three-dimensional (Activation, Valence, Dominance) can help to differentiate emotions (for example, to distinguish Anger from Fear). In this work, Dominance is not addressed.
Ekman argued that emotion is fundamentally genetically determined so that facial expressions of discrete emotions are interpreted in the same way across most cultures or nations [11,12]. However, the inner image of emotion in a person’s mind and the idea of how it is to be presented in speech depends to a large extent on his experience, education, and to a large extent on the culture in which he lives. Lim argues that culture constrains how emotions are felt and expressed and that cross-cultural differences in emotional arousal level have consistently been found. “Western culture is related to high-arousal emotions, whereas Eastern culture is related to low-arousal emotions” [12]. In this work, we examine the vocal manifestations of emotions in four Western languages (English, German, Italian, and Serbian) and in the first approximation we consider the task of automatic prediction of Activation and Valence from sound to be culture independent. One of the results of this work may be the information, whether the proposed approach works also on languages other than the one it was trained on.
The biggest problem is that there is no ground truth information available. One has to rely on the values estimated by annotators and consider them as ground truth. However, the number of annotators is often small and the reliability of the evaluation is debatable.
The available emotional speech databases were designed for various purposes, which also means they differ in methodology and annotation convention, instructions to annotators, choice of emotional categories, or even language. Moreover, the annotation of emotions was often done with a help of video, face and body gestures, text or semantic information. This information may be absent (not reflected) in the sound modality. The sound-based predictor then misses this information in the training process.
Other problem is the small volume and representativeness of the data available for emotional training. To achieve as large amount of data as possible for regressor training, to cover more variability, three publicly available databases with annotated Activation and Valence (AV) dimensions were combined in one pool.
Different emotional databases contain different choice of emotions. In this work, only the emotions that occur in the majority of the available emotional databases are addressed, namely, Angry, Happy, Neutral, and Sad.
The differences in definitions, methodology, and conditions of creation of individual databases have to be taken into account when evaluating the reliability and informative value of the obtained results.

2.2. Hypothesis

Emotional space is a multidimensional continuum. The cues of emotions in the voice are highly non-specific. Emotions are often present in mixtures, the meaning (inner representation) of the emotional terms in both speakers and raters are culture dependent. So, the areas into which the individual realizations of emotions are projected in the dimensional space largely overlap. Nevertheless, we assume that the centroids of the clusters of points to which the utterances are projected in the AV space, should meet certain basic expectations considering their emotion category.
In order to illustrate the expected distribution of emotions in the AV space, we present in Figure 1 the placement of the stimulus words Anger, Happy, and Sad in the space of pleasure–displeasure and degree of arousal according to Russell [3]. Neutral emotion was not addressed in his work. For simplicity, it can be assumed that Neutral emotion should be located at the origin of the coordinate system.
Due to the various sources of uncertainty in dimension prediction and the early phase of research, the hypothesis can only be formulated very vaguely. Our working hypothesis is that when predicting the values of Activation and Valence, the centroid of Angry emotion utterances cluster should have a higher Activation value and a lower Valence value than the centroid of Neutral utterances. The centroid of Happy emotion utterances cluster should have a higher Activation value and a higher Valence value than the centroid of Neutral utterances. Sad emotion is less pronounced, and the centroid may lie close to the Neutral utterances; anyway, it should have observably overall lower Valence than Neutral and considerably lower Arousal than the Angry emotion.

3. The Data Used in the Experiments

3.1. Training Databases

Three databases were available to the authors, in which values of Activation and Valence were annotated. Each of these three “training databases” was randomly divided into its training set (90% of data) and test set (remaining 10%). This ratio was chosen to preserve as much training data as possible.
IEMOCAP [13]. The Interactive Emotional Dyadic Motion Capture database is an acted, multimodal and multispeaker database in English (10 speakers, 10,000 utterances). It contains 12 h of audiovisual data. The actors perform improvisations or scripted scenarios. IEMOCAP database is annotated by multiple annotators into categorical labels, such as anger, happiness, sadness, neutrality, as well as dimensional labels: Valence, Activation, and Dominance.
MSP IMPROV [14]. MSP-IMPROV corpus is a multimodal emotional database in English (12 speakers, 8500 utterances). Pairs of actors improvised the emotion-specific situations. Categorical labels, such as anger, happiness, sadness, and neutrality, as well as dimensional labels—Valence, Activation, and Dominance—are provided.
VaM [15]. The database consists of 12 h of audio-visual recordings of the German TV talk show Vera am Mittag (47 speakers, 1000 utterances). This corpus contains spontaneous and emotional speech in German recorded from unscripted, authentic discussions. The emotion labels are given on a continuous valued scale for three emotion primitives: Valence, Activation, and Dominance.
Recognizing emotions from facial expressions is a common research topic nowadays (see e.g., [16,17]) and the categorical annotation is often based on facial expressions. A part of VaM database, the “VaM Faces”, includes such a categorical annotation of emotion based on the facial expression, that can be linked to the corresponding speech utterance. However, this information is available only for very small number of utterances and the emotion information contained in the facial expression may not be present in the vocal presentation. Therefore, this categorical annotation of VaM was not used in this work.
The AV dimensions in all three databases were annotated using a five-point self-assessment manikins [18] scale. The final rating is the mean of the ratings of all raters. The values on the AV axes were mapped to the range from 1 to 5 in this work.
In addition to training on individual databases, we also trained on a mixture of all three databases, which we will refer to as MIX3, and on a mixture of two larger databases, IEMOCAP and MSP-IMPROV, which we will call MIX2.

3.2. Testing Databases

The ability of the regressor to differentiate between emotions resp. place the emotions in the AV space was tested on ten publicly available databases: EmoDB [19], EMOVO [20], RAVDESS [21], CREMA-D [22], SAVEE [23], VESUS [24], eNTERFACE [25], JL Corpus [26], TESS [27], and GEES [28]. These databases are categorically annotated and do not include information on AV values.
Their content used in this work is briefly listed in Table 1 (Abbreviations used in the table are: Ang—angry; bor—bored; anx—anxious; hap—happy; sad—sad; disg—disgusted; neu—neutral; fear—feared; surp—surprised; calm—calm; exc—excited; Au—audio; Vi—video)

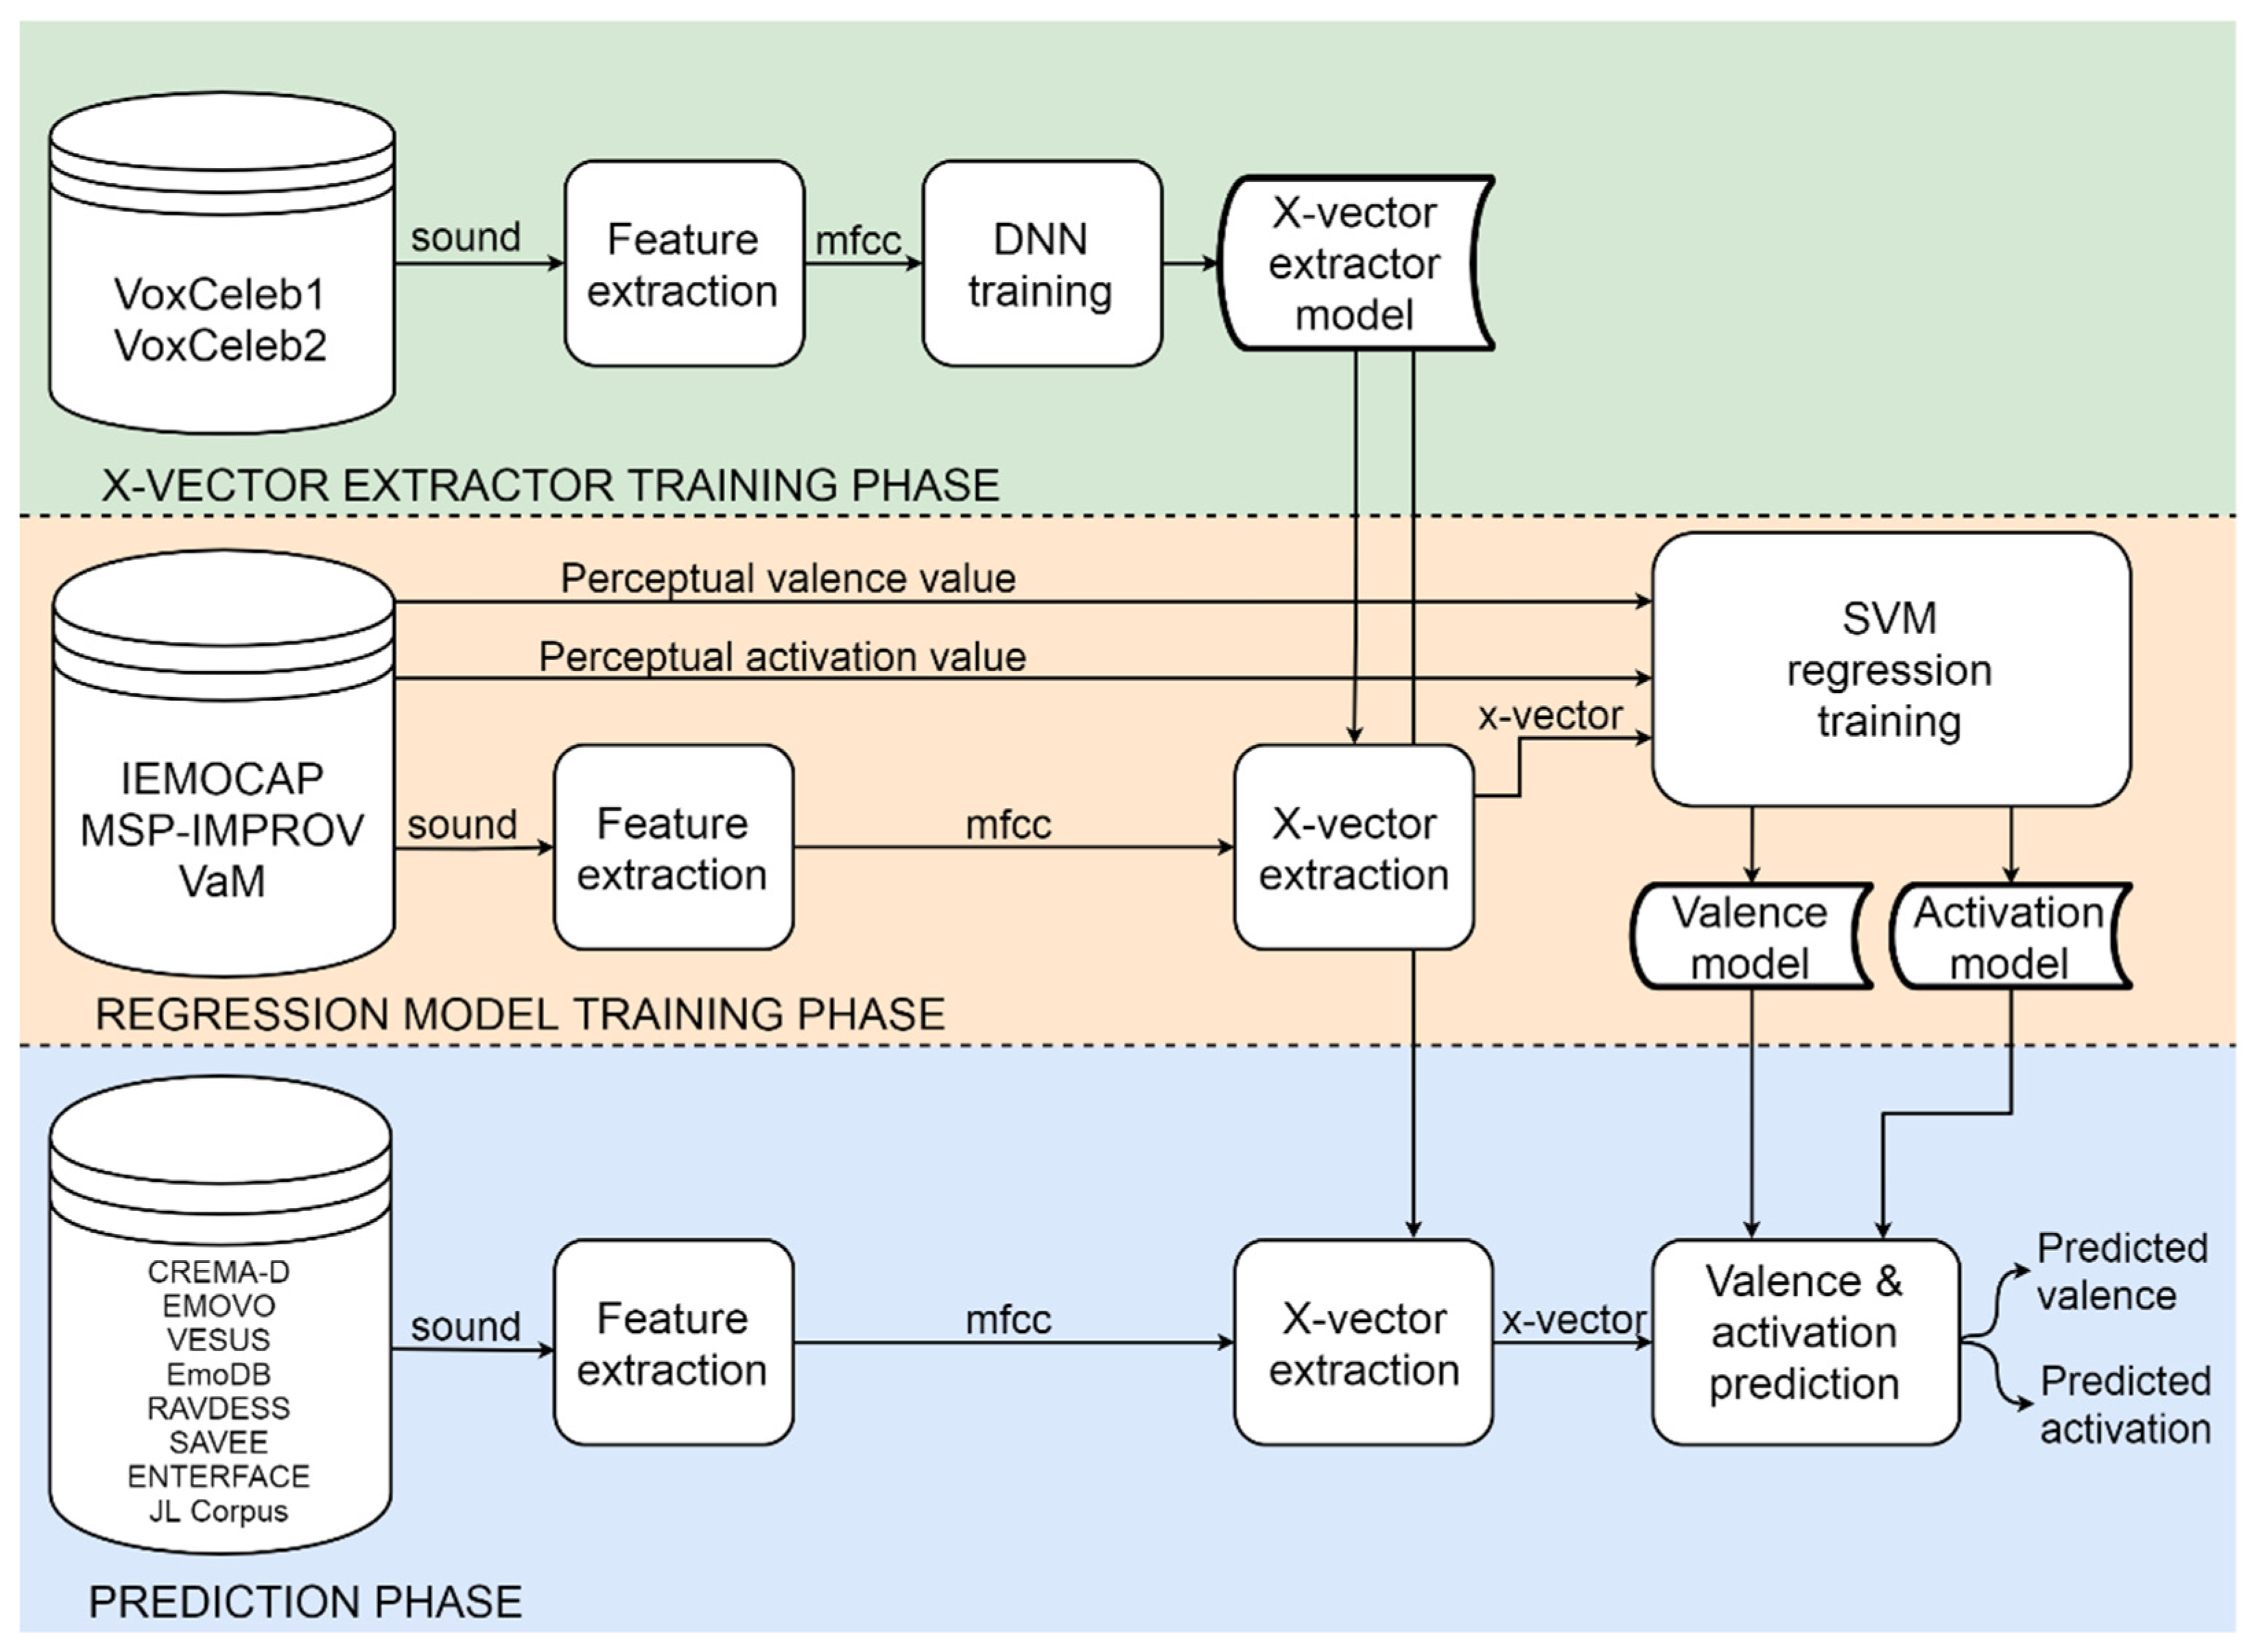
4. System Architecture

In the areas of applied machine learning, such as text or vision, embeddings extracted from discriminatively trained neural networks are the state-of-the-art. They are now also used in speaker recognition [29]. The approaches that have been successfully applied in speaker recognition are often adopted in emotion recognition (see e.g., [30,31,32]).

4.1. X-Vector Approach to Signal Representation

The approach used in this work is based on neural network embeddings called X-vectors [29]. The X-vector extractor is based on Deep Neural Networks (DNN) and its training requires large amounts of training data. Ideally, training data should also include information describing emotions. However, to the knowledge of the authors of this work, any extra-large training database with emotions annotated that would be suitable for training emotion-focused extractor from scratch, is not available.

4.1.1. X-Vector Extractor Training Phase

The X-vectors generated by extractor trained on speaker verification datasets provide primarily the information on speaker identity. However, it was shown they can also serve as a source of information on age, sex, language, and affective state of the speaker [33]. Therefore, the X-vector extractor was trained on the speaker-verification databases: VoxCeleb [34], having 1250 speakers and 150,000 utterances, and VoxCeleb2 [35] having 6000 speakers and 1.1 million utterances. The volume of training data was further augmented using reverberation and noising [36]. The feature extraction module transforms sound into representative features-30-dimensional Mel Frequency Cepstral Coefficients (MFCCs) with a frame-length of 25 ms, mean-normalized over a sliding window of up to 3 s [29]. The energy-based Voice Activity Detector (VAD) was used to filter out silence frames. The result of the training is DNN (X-vector extractor model). In the X-vector extraction process, an MFCC features matrix is fed to the input of this DNN, and an X-vector with a size of 512 is output.

4.1.2. Regression Model Training Phase

The training and test sets for regression are organized in pairs of features representing particular utterances–an X-vector, and the corresponding value of the perceived Valence (for Valence regressor) or Activation (for Activation regressor). The Scikit-learn library was used for training of the Support Vector Regressor (SVR) [37]. Default settings were used for the SVR.
The regression models trained in this phase are able to predict the value of Valence resp. Activation from the input X-vector representing the incoming utterance.
Various types of regressors were tested: AdaBoost regressor, Random Forest regressor, Gradient Boosting regressor, Bagging regressor, Decision Tree regressor, K-neighbors regressor, and Multi-layer Perceptron regressor, but none of them gave consistently better results than Support Vector Regressor.

4.1.3. Prediction Phase

In the prediction phase, the utterances from the pool of test-databases undergo the process of X-vector extraction and prediction values of Valence and Activation. The result is a pair of values indicating the coordinates in the AV space of each utterance.

4.2. Overall Architecture

The overall architecture of the system is shown in Figure 2.
As we have shown in Section 4.1, the whole process has three phases. In the first phase, we trained the X-vector extractor (or X-vector model) on large speaker verification databases. In the second phase, we trained regressors for Valence and Activation on dimensionally annotated databases. In the third phase, the prediction of AV dimension values for the addressed emotion categories in the categorically annotated test databases was performed. In real-world application operation, the test databases in the prediction phase will be replaced by a speech signal audio input.

5. Results

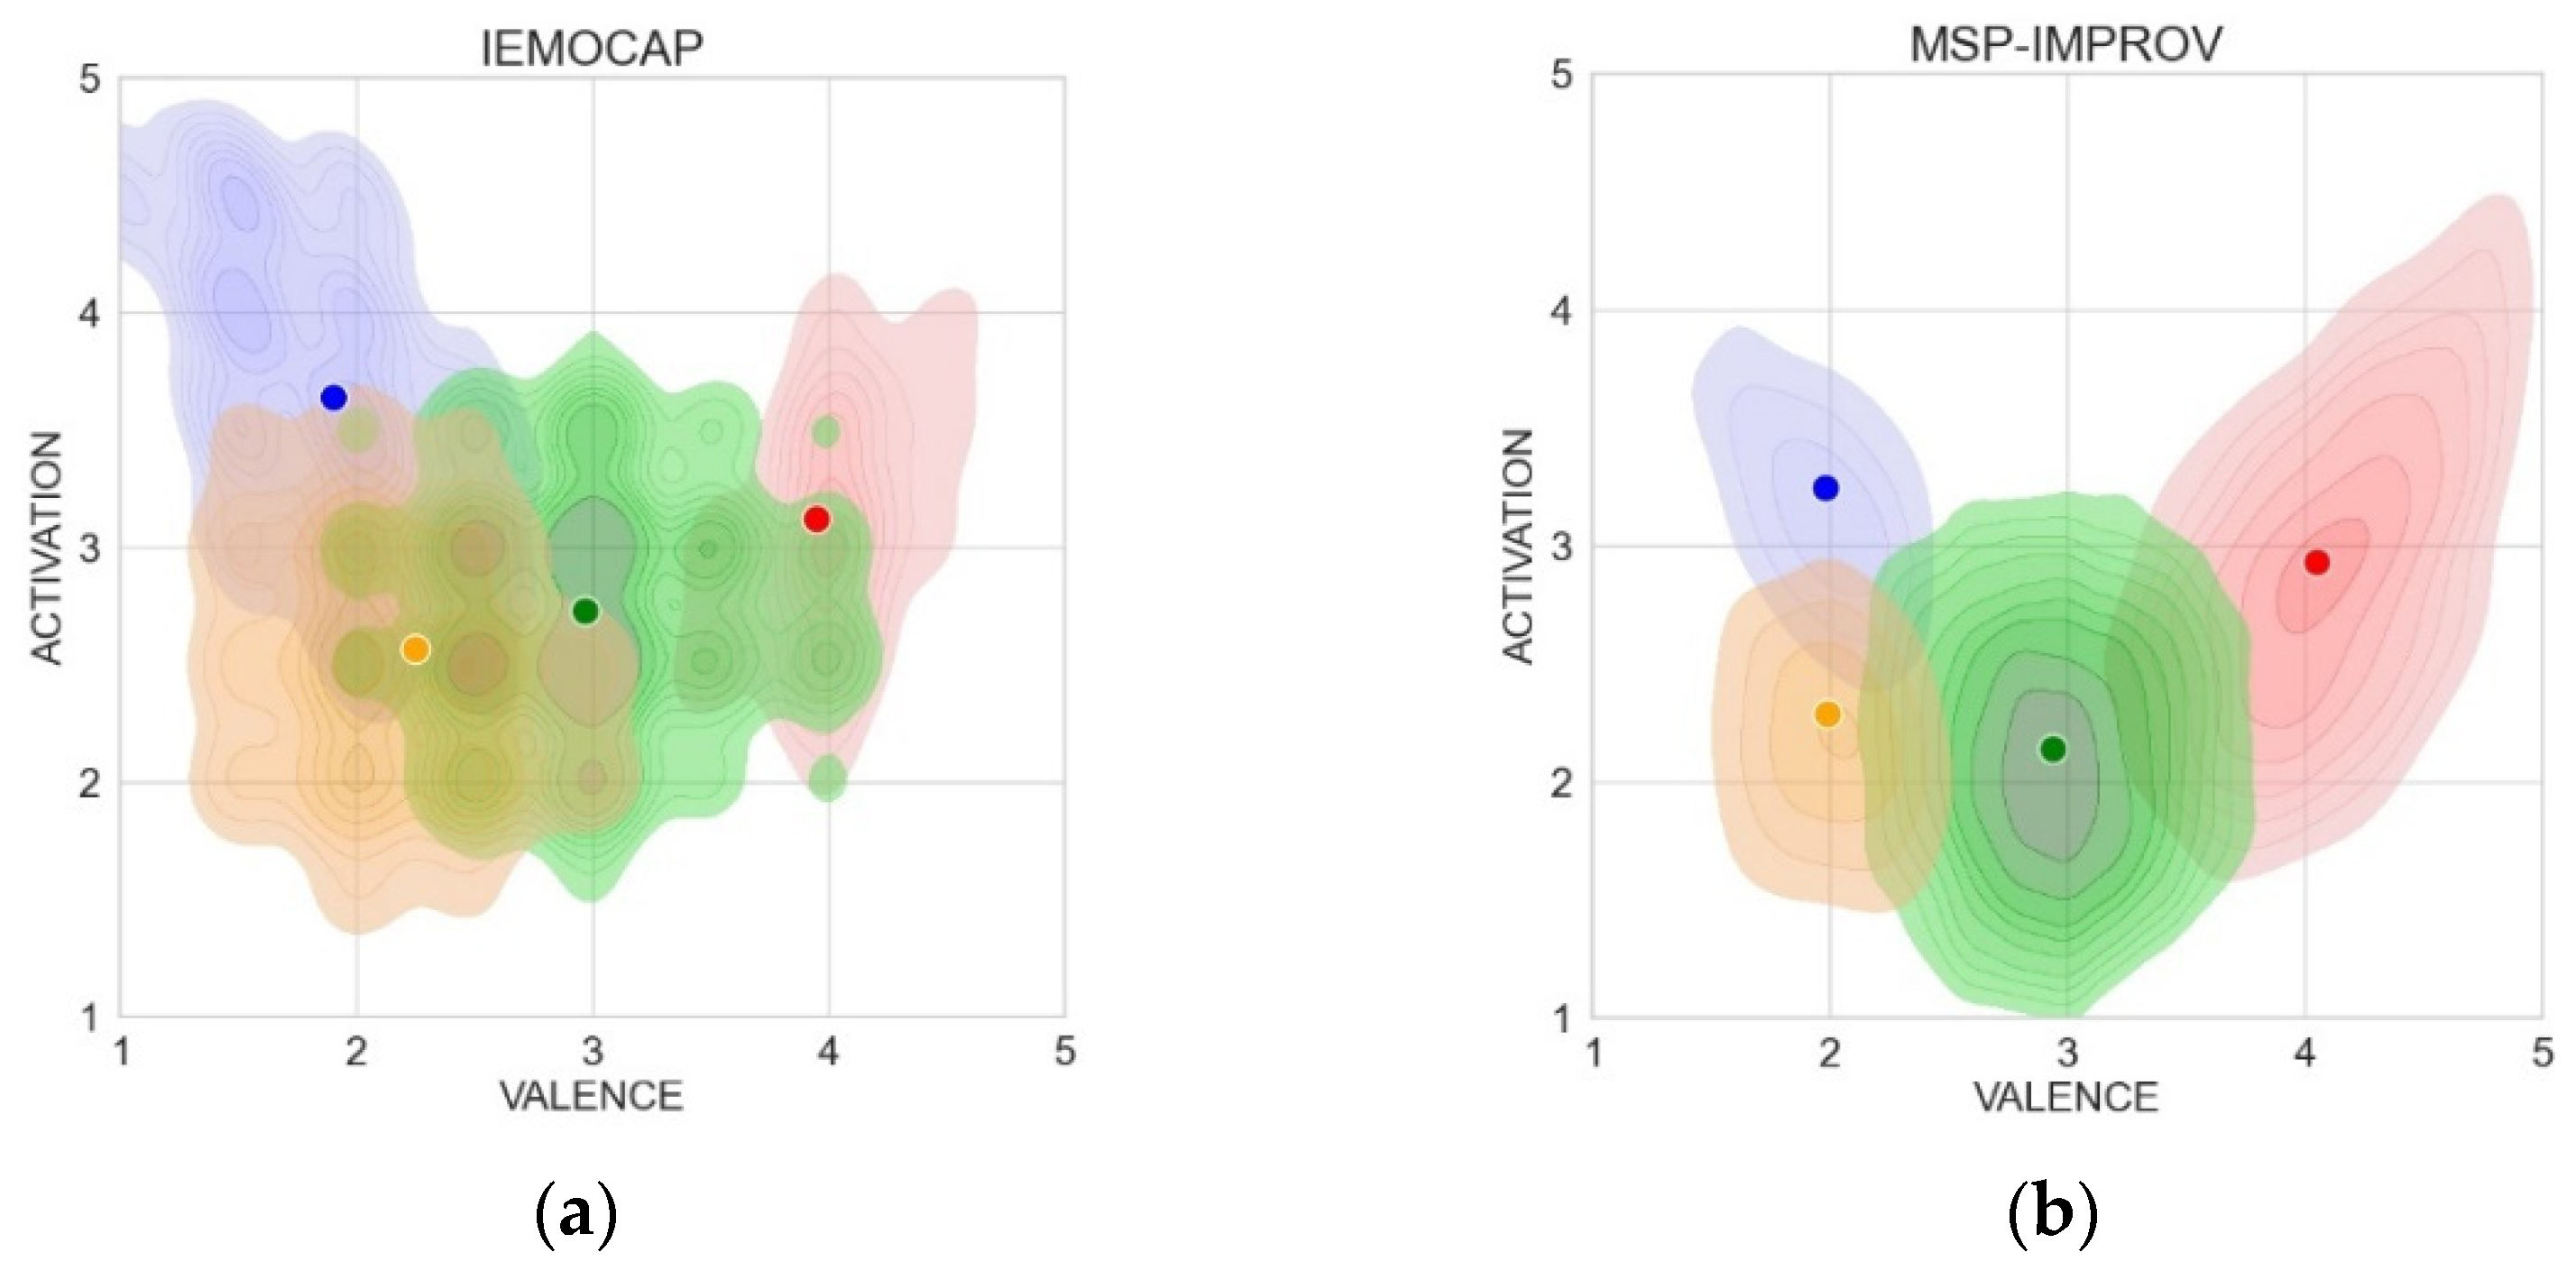
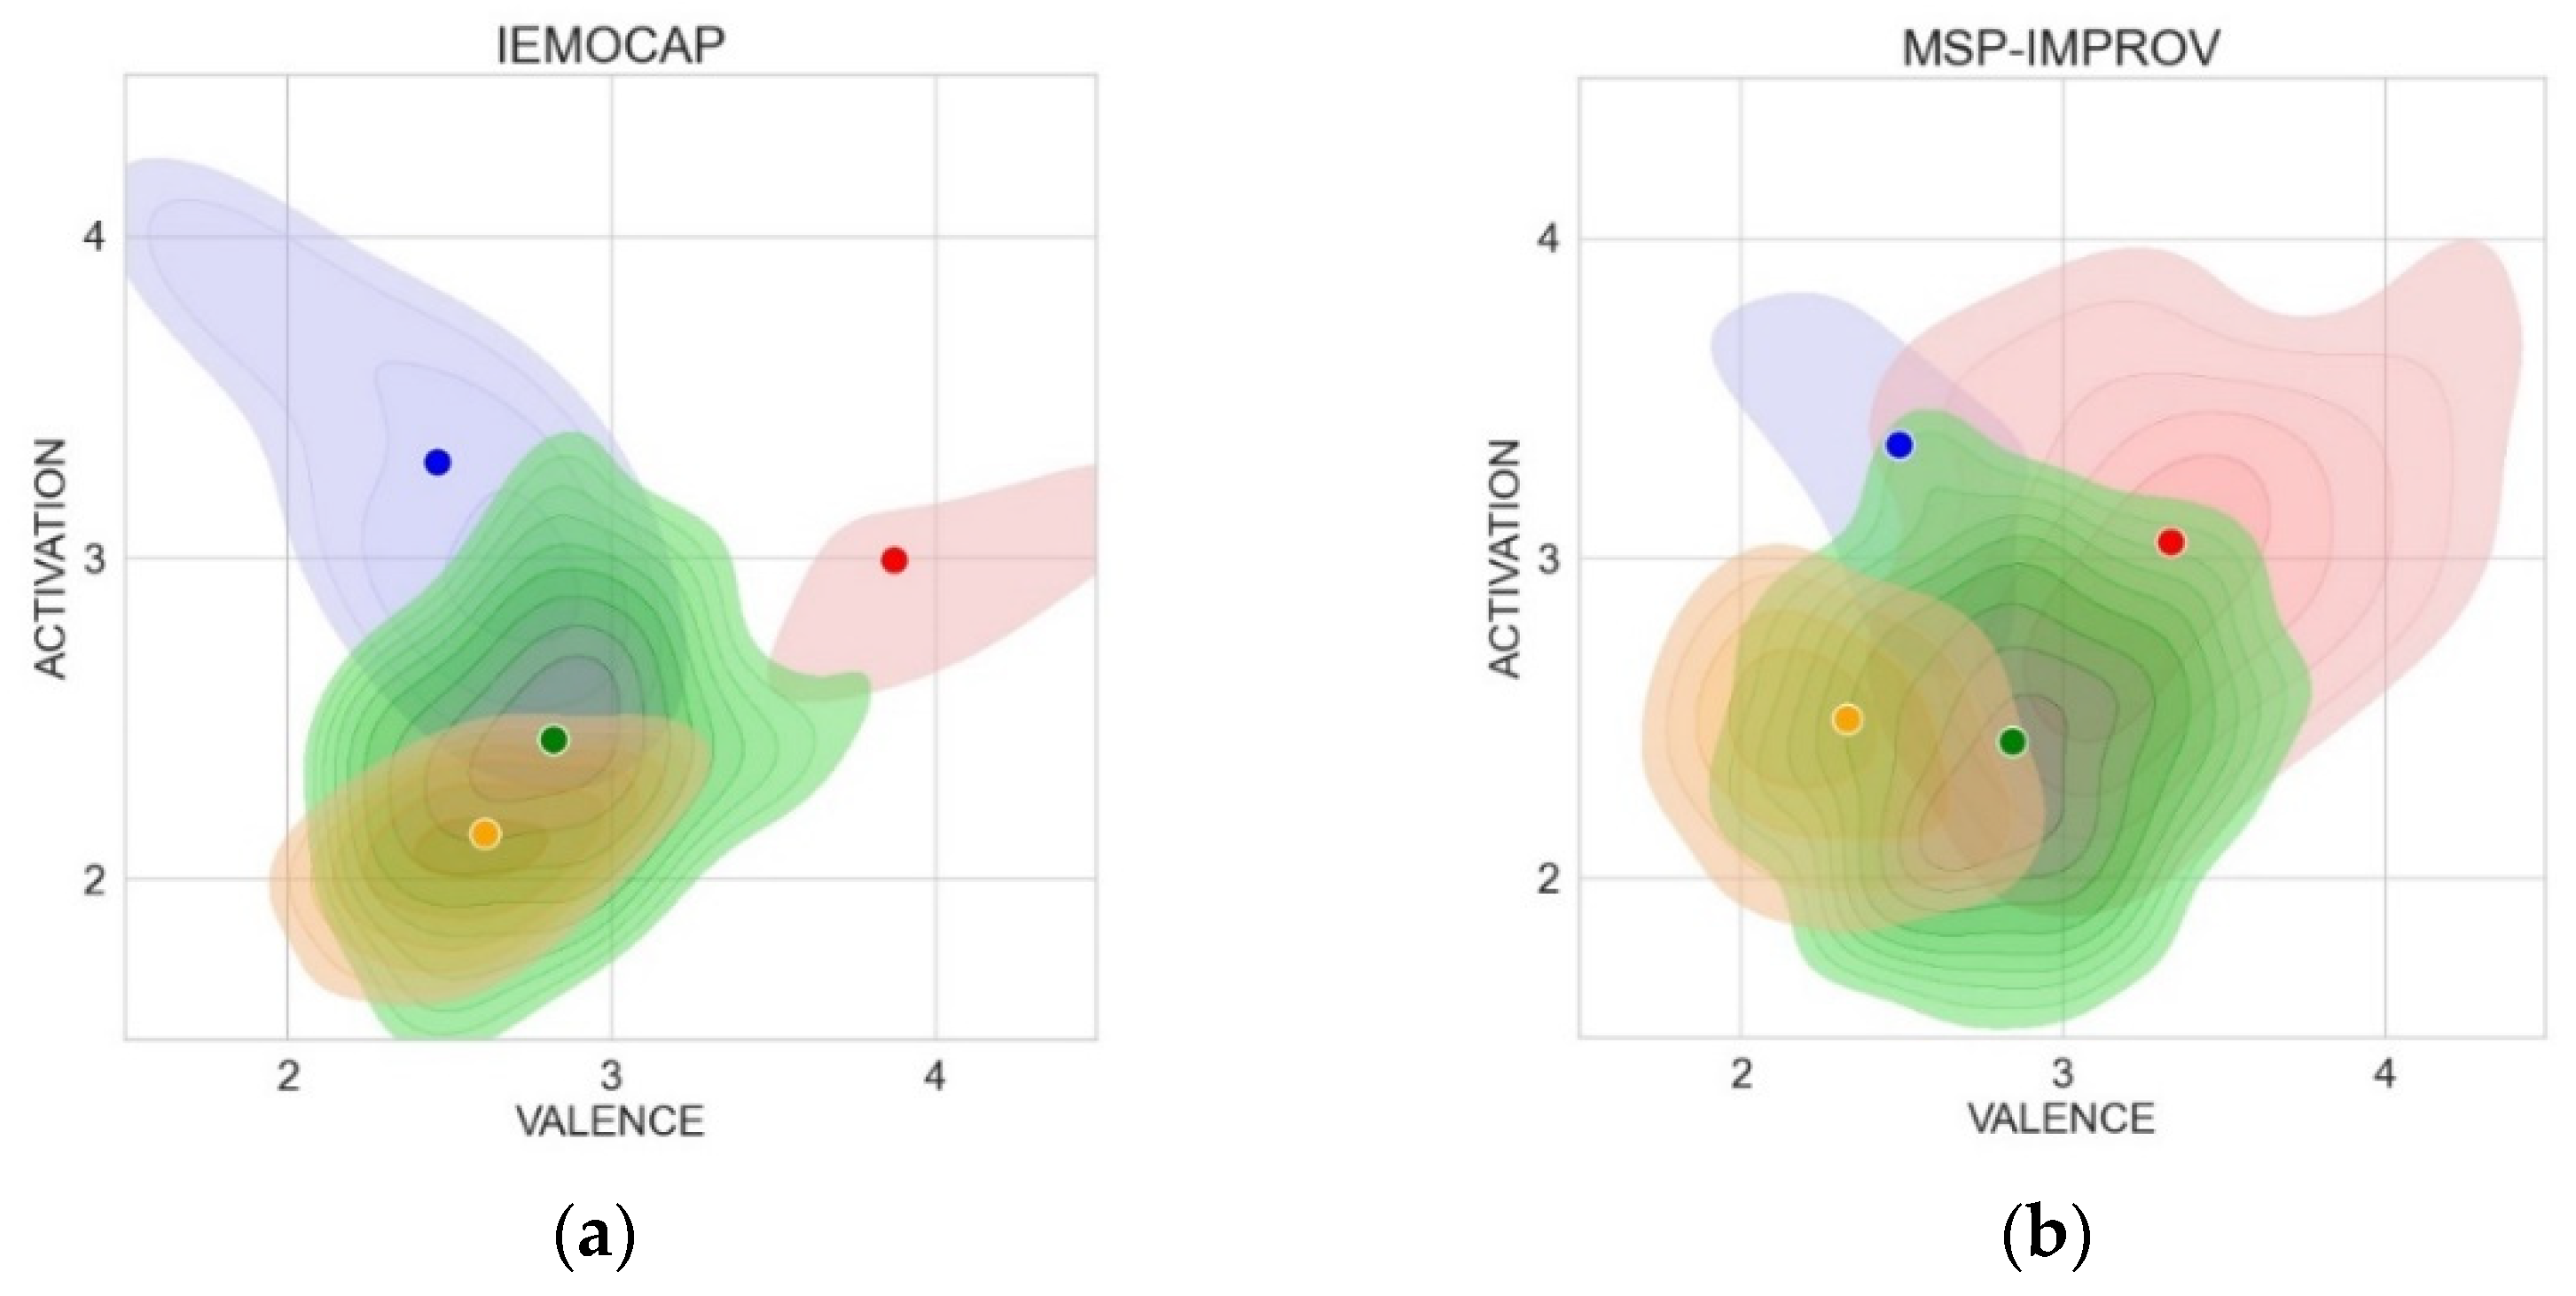
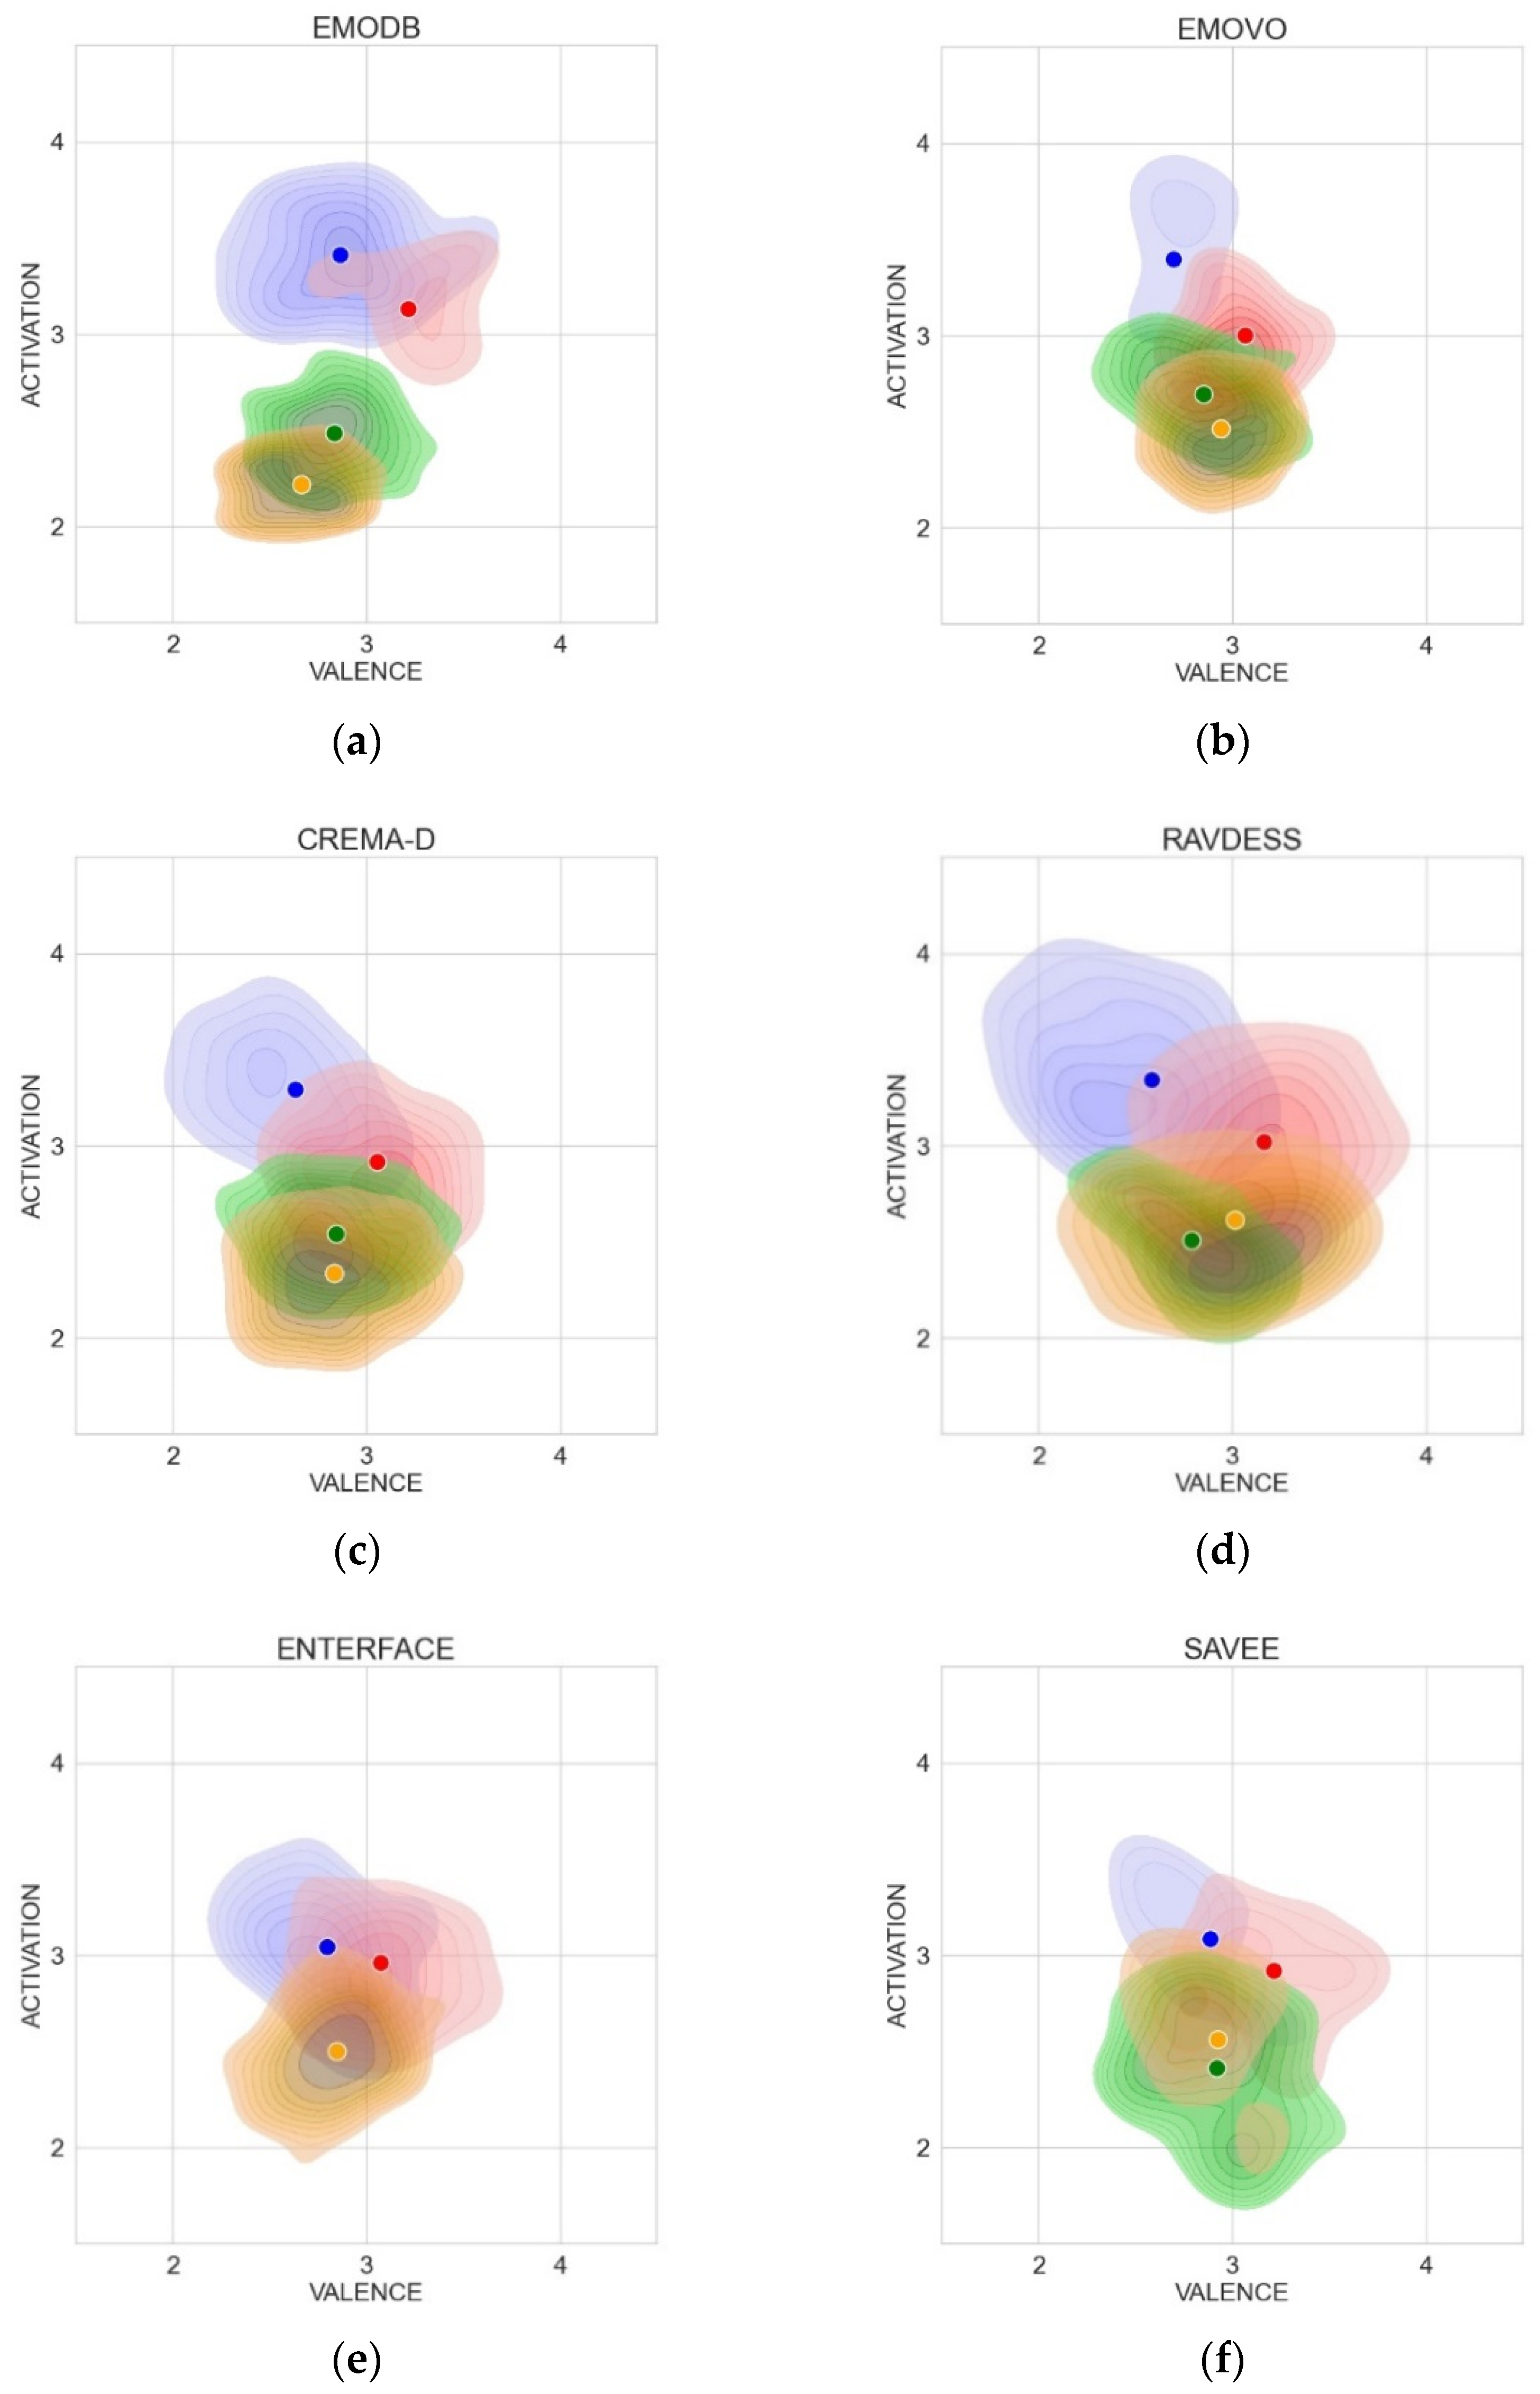
5.1. Visualization of Results

The results are presented in the form of figures and tables. The figures show the position of utterances in the AV plane. Seaborn statistical data visualization library [38] was used for visualization. Due to variability the utterances belonging to one emotion in a certain database create clouds or clusters in the AV space. The center of gravity of each cluster is a centroid, marked with a small circle of the corresponding color. The clusters were depicted in a form of a cloud with contour lines representing iso-proportion levels. The graphs were plotted using the kdeplot function with the lowest iso-proportion level at which to draw the contour line set to 0.3 [39].

5.2. Ground Truth—Original AV Values Indicated by Annotators

The original AV values indicated by annotators (perceptual Activation and perceptual Valence values) are considered in our work as ground truth. Figure 3 presents the emotions, how they were rated in original annotations. As various corpora contain different sets of emotions, only four emotions were chosen for comparison, that were present in all databases—Angry, Happy, Neutral, and Sad.
The granularity of IEMOCAP data is caused by the fact that there were very few annotators. It can be seen that the layout of centroids of emotion clusters is similar for IEMOCAP and MSP-IMPROV. The graph for VaM original annotation is absent as VaM does not include annotation of emotion categories for vocal modality.

5.3. Regression Evaluation—AV Values Estimated on Combinations of the Test Sets

Figure 4 presents clusters of emotions, estimated by regressor, trained on the mixture of the IEMOCAP-train and MSP-IMPROV-train (MIX2-train), and tested on of IEMOCAP-test and MSP-IMPROV-test sets.
Comparing the figures, it can be seen how the knowledge from the annotated values in the datasets (Figure 3) is reflected to the predicted values on the test set (Figure 4).
It can be seen that the distances of the centroids are considerably reduced. Either the scales are transformed, or the resolution resp. ability to separate the emotions was influenced by the regression. This can be caused by the fact that the training set does not include samples representing the whole AV plane; for some values, it has many realizations, for the others, they are completely missing—it is not representative, nor balanced.
As it is not sufficient to validate the regressor just from the figures, the Congruence Correlation Coefficient (CCC) and Mean Absolute Error (MAE) were used as regression quality measures to compare annotated and predicted values of Activation and Valence.
CCC is a correlation measure that was used for instance in the OMG-Emotion Challenge at the IEEE World Congress on Computational Intelligence in 2018 [39].
Let N be the number of testing samples, { y i } i = 1 N be the true Valence (Arousal) levels, and { y ^ i } i = 1 N be the estimated Valence (Arousal) levels. Let μ and σ be the mean and standard deviation of { y i } , respectively; μ ^ and σ ^ be the mean and standard deviation of { y ^ i } , respectively; and ρ be the Pearson correlation coefficient between { y i } and { y ^ i } . Then, the CCC is computed as:
C C C = 2 ρ σ σ ^ σ 2 + σ ^ 2 + ( μ μ ^ ) 2
CCC is still being used by many authors together with traditional error measure MAE.
M A E = i = 1 n | y i y ^ i | n
where y i is true value; y ^ i is predicted value; and n stands for total number of datapoints. The results of further experiments, evaluation of regression quality with various training and test sets by means of CCC and MAE are presented in Table 2.
SVR trained on MIX2 give general slightly better results than with MIX3 trained on all the three datasets. This may indicate that vocal manifestation of emotions in VaM may be less pronounced and less prototypical; the data and the annotation may be more different from other two databases. Moreover, VaM is in German and IEMOCAP and MSP-IMPROV contain English speech.
The results also show that the model obtained by training on a mixture of databases is more universal and achieves better results on the mixed test set. In some cases, it also achieves better results for individual databases than a model trained on their own training set.
Both CCC and MAE show that the quality of prediction is better for Activation than for Valence, which is in line with the observation of Oflazoglu and Yildirim [8].

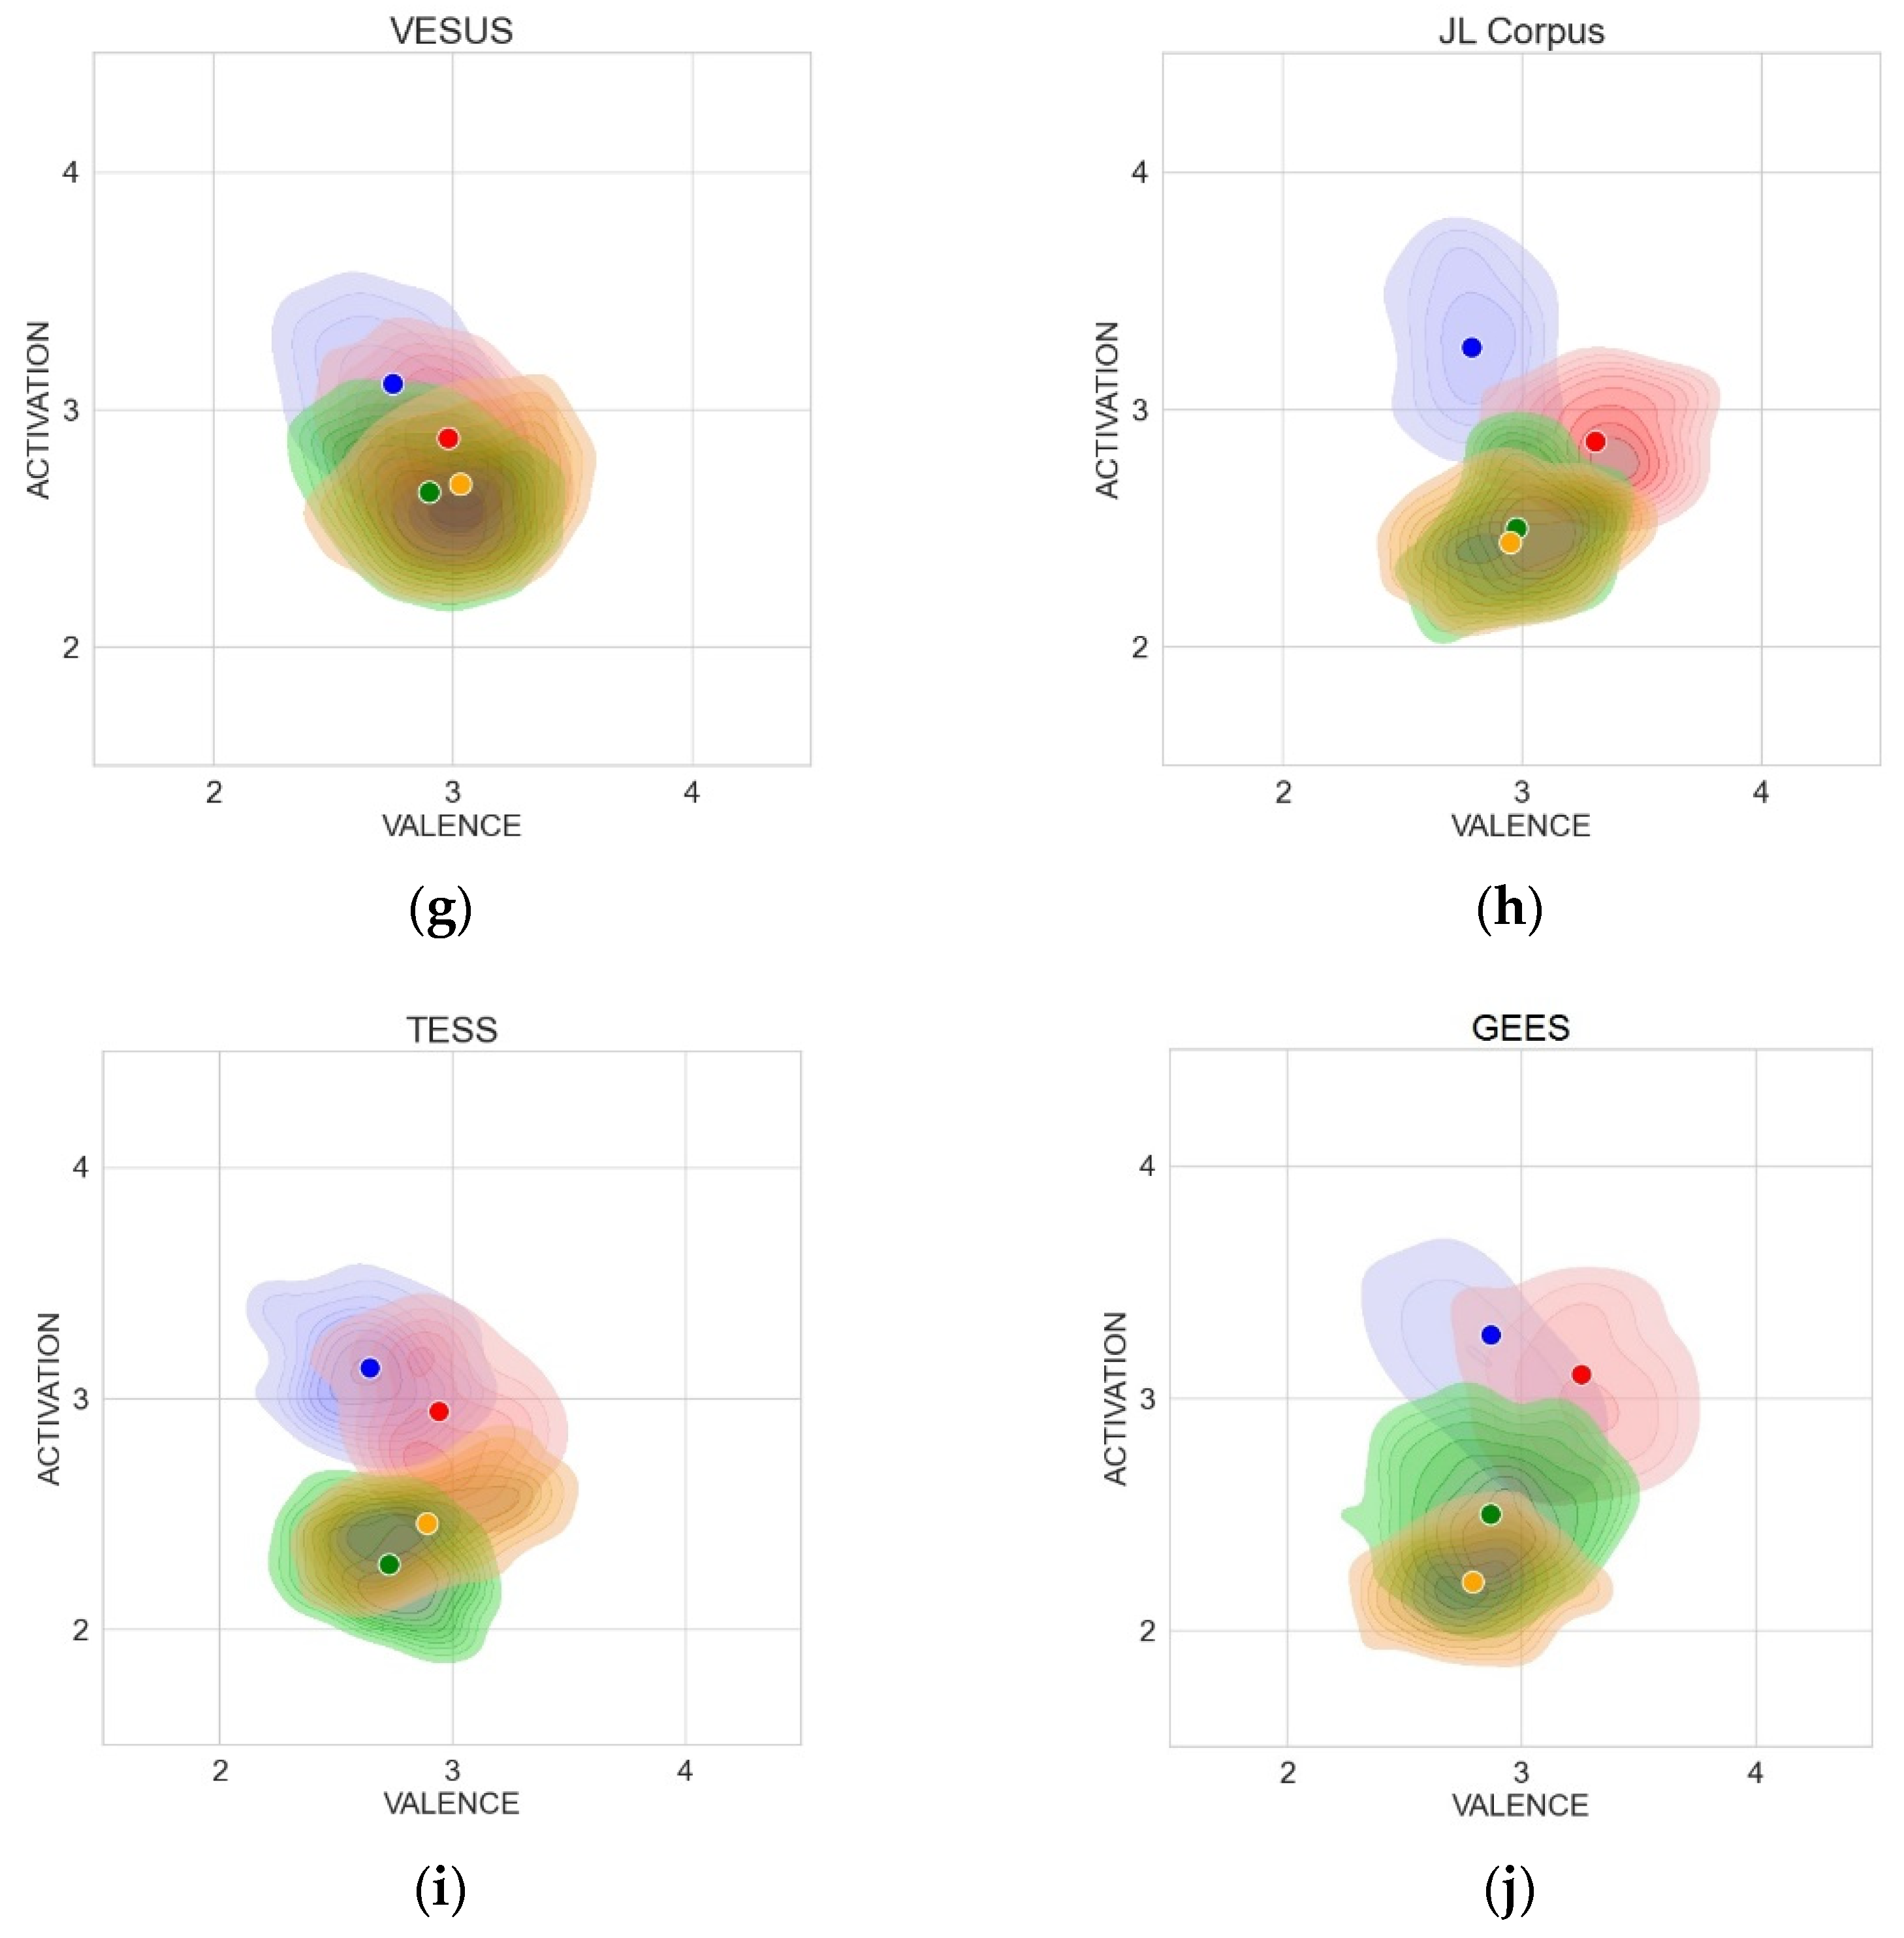
5.4. Cross-Corpus Experiments, AV Values Estimated by Regression on “Unseen” Corpora

In these experiments, the utterances from the categorically annotated emotional speech corpora are input to the AV predictor. The result is represented by predicted values of Activity and Valence for each utterance.
Cross-corpus emotion recognition has been addressed by many works, but most of them focus on a categorical approach or they try to identify to which quadrant of the AV space the utterance belongs (see e.g., [40]). Our approach tries to predict continuous values of the AV dimensions. Figure 5 presents clusters of emotions, estimated by the regressor trained on MIX2 and tested on different unseen emotional corpora. Experiments were also performed with MIX3, but the regressor using MIX2 performed better (Table 3).
Based on the figures, it is now possible to try to interpret the results obtained by the regressor on the corpora with annotated emotion categories:
The results of the EmoDB database confirm the observation that it contains strongly prototypical emotions [41]. The overlap of emotion clusters is smaller compared to other corpora. The clusters are significantly more differentiated, especially on the axis of Activation, which suggests that the actors performed full-blown emotions with a large range of arousal.
The results of the EMOVO database suggest a possible fact, which is also confirmed by observations in other databases, that Valence for Sad does not reach such low values as expected. The Sad cluster is located on the Valence axis even more towards higher values than the Neutral emotion cluster. According to the predicted AV values, the sound realization of Sad utterances seems to be hardly recognizable from that of Neutral ones in this database. It can be speculated that one of the possible sources of variance may be the inter-cultural difference, as the regressor was trained on English databases and EMOVO is Italian, but this possibility would need more extensive research.
The CREMA-D, RAVDESS, eNTERFACE, and JL Corpus databases give roughly the results as expected (see Section 2.2), although cluster differentiation is relatively small. The centroid of Sad in CREMA-D and JL Corpus have similar position on Valence axis as that of Neutral. The eNTERFACE database does not contain Neutral emotion, therefore the other three emotions cannot be compared to it.
Although the differentiation of clusters is not marked for the SAVEE database, it basically meets the expected trends. The exception is again the Sad emotion, which has higher mean value of Activation than one might expect and has approximately the same mean value of Valence as Neutral emotion.
The Canadian TESS database has the mutual placement of Angry, Happy, and Neutral emotions fully in line with the hypothesis. However, the centroid of the Sad cluster again achieves a higher value of Activation and Valence than expected.
GEES is a Serbian database meant for speech synthesis, which means that the prototypical emotions are presented very clearly and with high intensity. Therefore, the emotion centroids are placed on the expected positions. It is not any surprise that these positions are practically identical to other highly prototypical database, such as German EMO-DB.

5.5. Centroid Distance as a Measure of Regression Quality

In the following experiment, the distance of centroids of Angry and Happy emotion clusters on the Valence axis (for Valence regression) and the distance of centroids of Angry and Sad emotion clusters on the Activation axis (for Activation regression) were taken for an ad hoc objective measure of the ability of the regressor to differentiate between emotions. The evaluation of the regression quality using distances between centroids is presented in Table 3.
The two regressors have similar results, but in 15 of 20 cases the one trained on MIX2 (without VaM) has better resolution, and in two cases the results were the same. So, the conclusion could be that adding VaM data to the training set does not improve the universality of regression models and slightly degrades the performance of the regressors.
As was said in Section 3.1, due to the small amount of data in the corpora, we have only allocated 10% of the data for regression quality testing. To evaluate the possible impact of test data selection, we performed a 10-fold regression test on the “wining” mixture MIX2. The results of the individual folds showed only negligible differences with very low standard deviations both for Valence and Activation (see Table 4) and confirmed that 10% of the data is in this case a sufficiently representative sample for testing.

5.6. Overall Picture of Emotion Positions in the AV Space

We displayed emotion centroids for each database in one figure to assess whether the same emotion category from different databases has a similar location in the AV space, and whether that location corresponds to the hypothesized positions (Figure 6).
Centroids of Angry, Happy, and Neutral emotion clusters form well-distinguishable groups located in the AV space in an expected manner. This fact confirms that the system can evaluate the position of the perceived emotion in the AV space from the sound of utterances.
However, the group of Sad emotion shows considerable variance and largely overlaps with the Neutral emotion. Sad utterances from some of the databases also achieve higher Valence values than expected.

6. Discussion and Conclusions

Due to the small volume and small number of training databases, the “ground truth” data is very sparse and unreliable. They cover only a small fraction of the variety of possible manifestations of emotions in speech. Moreover, the training data are not available for all the parts of the AV plane, and the frequencies of occurrence of training samples representing different points of the AV space are far from being balanced. A substantial part of the data belongs to the less intensely expressed emotions, and they hardly differ from neutral speech. Examples of intense emotions, with extremely low or high Valence and Activation values, are rare. This also leads to certain narrowing of the range of predicted AV values, which is well observable when comparing the positions of emotional category centroids from annotator ratings in Figure 3 with the positions of the respective centroids estimated by regressor in Figure 4.
It is not possible to make general statements about the absolute position of individual emotions in the AV space, but it is reasonable to evaluate their relative position.
From the results obtained by the proposed system, it can be seen that in general Anger has higher Activation and lower Valence, and Happy has higher Activation and higher Valence, than the Neutral emotion. Valence predicted by the proposed system for Sad utterances does not reach such low values as could be expected with respect to the values in original annotations (Figure 3) of the training databases and with respect to Russell’s circumplex model. A valuable observation is that, despite the fact that the training data were in English, the emotions from the German, Serbian, and Italian databases were also placed in accordance with the hypothesis.
Due to the variety of sources of uncertainty in speech data and non-specificity of vocal cues of emotion, the clusters of emotions acquired by regression are close to each other and they overlap considerably. However, centroids of corresponding emotion clusters from various unseen databases form observable groups, which are well separable for Angry–Happy–Sad and Angry–Happy–Neutral triplets of emotions. The locations of these groups in the AV space correspond to hypothesized expectations for Angry, Happy, and Neutral emotions.
Some models (e.g., LSTM model as presented by Parry et al. [42] in Figure 2a of their paper) seem to be more successful in determining the affiliation of utterances to individual databases than in identifying emotions. This only confirms the fact that the utterances reflect various technical and methodological aspects of the design of databases, cultural and linguistic differences, and the like. It is therefore difficult to identify emotions from acoustic characteristics of voice. However, we have proven in our experiments that measurement of coordinates of speech utterances in emotional space is in principle feasible, but the resolution and the ability to differentiate various emotions is better for high-activity emotions (Angry–Happy), than for low-activity ones (Sad–Neutral). This may be caused by technical aspects of the solution, but also by the lack of reliable training data, inconsistencies in annotation, diversity of inner psychological interpretation of emotional categories, cultural and linguistic differences, and differences in methodology. At the same time, however, it is highly probable that the sound of speech expressing low-activity emotions contains much less marked distinctive features and is very similar to neutral speech.
In the meantime, the authors have obtained access to the additional dimensionally annotated database, OMG-Emotion Behavior Dataset [39], so one of the future steps will be an analysis, processing, and incorporating this dataset in the training database pool. The other areas of possible improvement are: finetuning of the X-vector extractor for the emotion recognition task, experimenting with combinations of different analysis timeframes, experimenting with various representative features, as well as experiments with new machine learning algorithms and architectures of regressors. Axes scales normalization and finding the position of the origin (center) of the AV space need to be implemented.
The research on the measurement of AV dimensions from speech sound is in its infancy, where the predicted values have high variance and the ranges and units of the dimension-axes are not well defined. However, with new databases, increasing volume of training data, more precise and representative annotation, and improved regression techniques, it will certainly be possible to achieve significantly higher accuracy and better applicability of AV dimensions estimation. Such a system could be used in practical applications in call-centers, avatars, robots, information-providing systems, security applications, and many more.
The designed regressor is currently utilized for a Valence prediction in stress detector from speech in the Air Traffic Management security tools developed in European project SATIE (Horizon 2020, No. 832969), and in a depression detection module developed in Slovak VEGA project No. 2/0165/21.

Author Contributions

Conceptualization, M.R. (Milan Rusko) and T.H.S.-K.; methodology, M.R. (Milan Rusko); software, M.T., M.R. (Marian Ritomský) and S.D.; validation, R.S. and M.S.; formal analysis, T.H.S.-K.; investigation, M.T., S.D., and M.R. (Milan Rusko); resources, R.S. and M.S.; data curation, R.S. and M.S.; writing—original draft preparation, M.R. (Milan Rusko); writing—review and editing, M.R. (Milan Rusko) and T.H.S.-K.; visualization, M.T., S.D. and M.R. (Marian Ritomský); supervision, M.R. (Milan Rusko); project administration, M.R. (Milan Rusko) and T.H.S.-K.; funding acquisition, T.H.S.-K. All authors have read and agreed to the published version of the manuscript.

Funding

This project has received funding from the European Union’s Horizon 2020 research and innovation programme under grant agreement No. 832969. This output reflects the views only of the authors, and the European Union cannot be held responsible for any use which may be made of the information contained therein. For more information on the project, see: http://satie-h2020.eu/. The work was also funded by the Slovak Scientific Grant Agency VEGA, project No. 2/0165/21.

Data Availability Statement

Only publicly available databases VoxCeleb, Voxceleb2, IEMOCAP, MSP IMPROV, VaM, EmoDB, EMOVO, CREMA-D, RAVDESS, eNTERFACE, SAVEE, VESUS, JL Corpus, TESS, and GEES were used in this research.

Conflicts of Interest

The authors declare no conflict of interest.

References

  1. Scherer, K.R. What are emotions? And how can they be measured? Soc. Sci. Inf. 2005, 44, 695–729. [Google Scholar] [CrossRef]
  2. Hoffmann, H.; Scheck, A.; Schuster, T.; Walter, S.; Limbrecht, K.; Traue, H.C.; Kessler, H. Mapping discrete emotions into the dimensional space: An empirical approach. In Proceedings of the 2012 IEEE International Conference on Systems, Man, and Cybernetics (SMC), Seoul, Korea, 14–17 October 2012; pp. 3316–3320. [Google Scholar]
  3. Russell, J.A. A circumplex model of affect. J. Personal. Soc. Psychol. 1980, 39, 1161–1178. [Google Scholar] [CrossRef]
  4. Hogg, M.A.; Abrams, D.; Martin, G.N. Social cognition and attitudes. In Psychology; Pearson Education: London, UK, 2010; pp. 646–677. [Google Scholar]
  5. Gunes, H.; Schuller, B. Categorical and dimensional affect analysis in continuous input: Current trends and future directions. Image Vis. Comput. 2013, 31, 120–136. [Google Scholar] [CrossRef]
  6. Watson, D.; Wiese, D.; Vaidya, J.; Tellegen, A. The two general activation systems of affect: Structural findings, evolutionary considerations, and psychobiological evidence. J. Personal. Soc. Psychol. 1999, 76, 820–838. [Google Scholar] [CrossRef]
  7. Russell, J.A. Core affect and the psychological construction of emotion. Psychol. Rev. 2003, 110, 145–172. [Google Scholar] [CrossRef] [PubMed]
  8. Oflazoglu, C.; Yildirim, S. Recognizing emotion from Turkish speech using acoustic features. EURASIP J. Audio Speech Music Process. 2013, 2013, 26. [Google Scholar] [CrossRef] [Green Version]
  9. Teilegen, A. Structures of Mood and Personality and Their Relevance to Assessing Anxiety, with an Emphasis on Self-Report. In Anxiety and the Anxiety Disorders; Routledge: London, UK, 2019; pp. 681–706. [Google Scholar]
  10. Bradley, M.M.; Lang, P.J. Affective reactions to acoustic stimuli. Psychophysiology 2000, 37, 204–215. [Google Scholar] [CrossRef] [PubMed]
  11. Ekman, P. Universals and cultural differences in facial expressions of emotion. In Nebraska Symposium on Motivation; Cole, J., Ed.; University of Nebraska Press: Lincoln, NE, USA, 1972; Volume 19, pp. 207–282. [Google Scholar]
  12. Lim, N. Cultural differences in emotion: Differences in emotional arousal level between the East and the West. Integr. Med. Res. 2016, 5, 105–109. [Google Scholar] [CrossRef] [PubMed] [Green Version]
  13. Busso, C.; Bulut, M.; Lee, C.-C.; Kazemzadeh, A.; Mower, E.; Kim, S.; Chang, J.N.; Lee, S.; Narayanan, S.S. IEMOCAP: Interactive emotional dyadic motion capture database. Lang. Resour. Eval. 2008, 42, 335–359. [Google Scholar] [CrossRef]
  14. Busso, C.; Parthasarathy, S.; Burmania, A.; Abdel-Wahab, M.; Sadoughi, N.; Provost, E. MSP-IMPROV: An Acted Corpus of Dyadic Interactions to Study Emotion Perception. IEEE Trans. Affect. Comput. 2017, 8, 67–80. [Google Scholar] [CrossRef]
  15. Grimm, M.; Kroschel, K.; Narayanan, S. The Vera am Mittag German audio-visual emotional speech database. In Proceedings of the 2008 IEEE International Conference on Multimedia and Expo, Hannover, Germany, 23 June–26 April 2008; pp. 865–868. [Google Scholar]
  16. Turabzadeh, S.; Meng, H.; Swash, R.M.; Pleva, M.; Juhar, J. Facial Expression Emotion Detection for Real-Time Embedded Systems. Technologies 2018, 6, 17. [Google Scholar] [CrossRef] [Green Version]
  17. Albanie, S.; Nagrani, A.; Vedaldi, A.; Zisserman, A. Emotion Recognition in Speech using Cross-Modal Transfer in the Wild. In Proceedings of the 26th ACM International Conference on Multimedia, Seattle, WA, USA, 22–26 October 2018; pp. 292–301. [Google Scholar]
  18. Bradley, M.M.; Lang, P.J. Measuring emotion: The self-assessment manikin and the semantic differential. J. Behav. Ther. Exp. Psychiatry 1994, 25, 49–59. [Google Scholar] [CrossRef]
  19. Burkhardt, F.; Paeschke, A.; Rolfes, M.; Sendlmeier, W.F.; Weiss, B. A database of German emotional speech. In Proceedings of the Interspeech 2005, Lisbon, Portugal, 4–8 September 2005. [Google Scholar]
  20. Costantini, G.; Iaderola, J.; Paoloni, A.; Todisco, M. EMOVO Corpus: An Italian Emotional Speech Database. In Proceedings of the International Conference on Language Resources and Evaluation (LREC), Reykjavik, Iceland, 26–31 May 2014. [Google Scholar]
  21. Livingstone, S.R.; Russo, F.A. The Ryerson Audio-Visual Database of Emotional Speech and Song (RAVDESS): A dynamic, multimodal set of facial and vocal expressions in North American English. PLoS ONE 2018, 13, e0196391. [Google Scholar] [CrossRef] [PubMed] [Green Version]
  22. Cao, H.; Cooper, D.G.; Keutmann, M.K.; Gur, R.C.; Nenkova, A.; Verma, R. CREMA-D: Crowd-sourced Emotional Multimodal Actors Dataset. IEEE Trans. Affect. Comput. 2014, 5, 377–390. [Google Scholar] [CrossRef] [PubMed] [Green Version]
  23. University of Surrey. Surrey Audio-Visual Expressed Emotion (SAVEE) Database. Available online: http://kahlan.eps.surrey.ac.uk/savee/ (accessed on 12 October 2021).
  24. Sager, J.; Shankar, R.; Reinhold, J.; Venkataraman, A. VESUS: A Crowd-Annotated Database to Study Emotion Production and Perception in Spoken English. In Proceedings of the Interspeech 2019, Graz, Austria, 15–19 September 2019. [Google Scholar]
  25. Martin, O.; Kotsia, I.; Macq, B.; Pitas, I. The eNTERFACE’05 Audio-Visual Emotion Database. In Proceedings of the 22nd International Conference on Data Engineering Workshops (ICDEW’06), Atlanta, GA, USA, 3–7 April 2006; p. 8. [Google Scholar]
  26. James, J.; Tian, L.; Watson, C.I. An Open Source Emotional Speech Corpus for Human Robot Interaction Applications. In Proceedings of the Interspeech 2018, Hyderabad, India, 2–6 September 2018. [Google Scholar]
  27. Pichora-Fuller, M.K.; Dupuis, K. Toronto Emotional Speech Set (TESS); University of Toronto: Toronto, ON, Canada, 2020. [Google Scholar]
  28. Jovičić, T.S.; Kašić, Z.; Đorđević, M.; Rajković, M. Serbian emotional speech database: Design, processing and evaluation. In Proceedings of the SPECOM 2004: 9th Conference Speech and Computer, Saint-Peterburg, Russia, 20–22 September 2004. [Google Scholar]
  29. Snyder, D.; Garcia-Romero, D.; Sell, G.; Povey, D.; Khudanpur, S. X-vectors: Robust DNN embeddings for speaker recognition. In Proceedings of the 2018 IEEE International Conference on Acoustic, Speech and Signal Processing (ICASSP), Calgary, AB, Canada, 15–20 April 2018; pp. 5329–5333. [Google Scholar]
  30. Mackova, L.; Cizmar, A.; Juhar, J. Emotion recognition in i-vector space. In Proceedings of the 2016 26th International Conference Radioelektronika (RADIOELEKTRONIKA), Košice, Slovakia, 19–20 April 2016; pp. 372–375. [Google Scholar]
  31. Abbaschian, B.; Sierra-Sosa, D.; Elmaghraby, A. Deep Learning Techniques for Speech Emotion Recognition, from Databases to Models. Sensors 2021, 21, 1249. [Google Scholar] [CrossRef] [PubMed]
  32. Lieskovská, E.; Jakubec, M.; Jarina, R.; Chmulík, M. A Review on Speech Emotion Recognition Using Deep Learning and Attention Mechanism. Electronics 2021, 10, 1163. [Google Scholar] [CrossRef]
  33. Raj, D.; Snyder, D.; Povey, D.; Khudanpur, S. Probing the Information Encoded in X-Vectors. 2019. Available online: https://arxiv.org/abs/1909.06351 (accessed on 12 October 2021).
  34. Nagrani, A.; Chung, J.S.; Zisserman, A.V. VoxCeleb: A large-scale speaker identification dataset. In Proceedings of the Interspeech, Stockholm, Sweden, 20–24 August 2017; pp. 2616–2620. [Google Scholar]
  35. Chung, J.S.; Nagrani, A.; Zisserman, A. VoxCeleb2: Deep Speaker Recognition. In Proceedings of the Interspeech 2018, Hyderabad, India, 2–6 September 2018. [Google Scholar]
  36. Ko, T.; Peddinti, V.; Povey, D.; Khudanpur, S. Audio augmentation for speech recognition. In Proceedings of the Interspeech 2015, Dresden, Germany, 6–10 September 2015. [Google Scholar]
  37. Scikit. Epsilon-Support Vector Regression. Available online: https://scikit-learn.org/stable/modules/generated/sklearn.svm.SVR.html (accessed on 12 October 2021).
  38. Waskom, M.L. Seaborn: Statistical data visualization. J. Open Source Softw. 2021, 6, 3021. [Google Scholar] [CrossRef]
  39. Barros, P.; Churamani, N.; Lakomkin, E.; Siqueira, H.; Sutherland, A.; Wermter, S. The OMG-Emotion Behavior Dataset. In Proceedings of the 2018 International Joint Conference on Neural Networks (IJCNN), Rio de Janeiro, Brazil, 8–13 July 2018. [Google Scholar]
  40. Schuller, B.; Vlasenko, B.; Eyben, F.; Wollmer, M.; Stuhlsatz, A.; Wendemuth, A.; Rigoll, G. Cross-Corpus Acoustic Emotion Recognition: Variances and Strategies. IEEE Trans. Affect. Comput. 2010, 1, 119–131. [Google Scholar] [CrossRef]
  41. Schuller, B.; Zhang, Z.; Weninger, F.; Rigoll, G. Selecting training data for cross-corpus speech emotion recognition: Prototypicality vs. generalization. In Proceedings of the Afeka-AVIOS Speech Processing Conference, Tel Aviv, Israel, 22 June 2011. [Google Scholar]
  42. Parry, J.; Palaz, D.; Clarke, G.; Lecomte, P.; Mead, R.; Berger, M.; Hofer, G. Analysis of Deep Learning Architectures for Cross-Corpus Speech Emotion Recognition. In Proceedings of the Interspeech 2019, Graz, Austria, 15–19 September 2019. [Google Scholar]
Figure 1. Placement of the stimulus words Anger, Happy, and Sad in the space of pleasure–displeasure (x-axis) and degree of arousal (y-axis) according to Russell [3].
Electronics 10 02950 g001
Figure 2. Schematic diagram of the system estimating the Activation and Valence values from speech utterances.
Electronics 10 02950 g002
Figure 3. Clusters of emotions, as rated by annotators: (a) IEMOCAP-full (train + test); (b) MSP-IMPROV-full (train + test). Color code: blue—Angry; red—Happy; green—Neutral, orange—Sad.
Electronics 10 02950 g003
Figure 4. Clusters of emotions, estimated by regressor trained on the mix of the IEMOCAP-train and MSP-IMPROV-train sets, and tested on (a) IEMOCAP-test and (b) MSP-IMPROV-test sets. Color code identifying the emotion in the figure are as follows: blue—Angry; red—Happy; green—Neutral, orange—Sad.
Electronics 10 02950 g004
Figure 5. Clusters of emotions, estimated by regressor trained on MIX2 training set and tested on: (a) EmoDB; (b) EMOVO; (c) CREMA-D; (d) RAVDESS; (e) eNTERFACE; (f) SAVEE; (g) VESUS; (h) JL Corpus; (i) TESS and (j) GEES. Color code identifying the emotion in the figure are as follows: blue—Angry; red—Happy; green—Neutral, orange—Sad.
Electronics 10 02950 g005aElectronics 10 02950 g005b
Figure 6. Centroids the emotions contained in the 10 testing databases, obtained by regression (each centroid belongs to the particular emotion in one database). Numeric code identifying the databases in the figure are as follows: 1 CREMA-D, 2 EMO-DB, 3 EMOVO, 4 eNTERFACE, 5 JL Corpus, 6 RAVDESS, 7 SAVEE, 8 VESUS, 9 TESS, 10 GEES.
Electronics 10 02950 g006
Table 1. List of testing databases for cross-corpus experiments.
DatabaseModalityLanguageSpeakers/Total No. of Audio FilesEmotions
EmoDBAuGerman10/535ang, bor, anx, hap, sad, disg, neu.
EMOVOAuItalian6/588disg, fear, ang, joy, surp, sad, neu.
RAVDESSAuViEnglish24/1440calm, hap, sad, ang, fear, surp, disg.
CREMA-DAuViEnglish91/442hap, sad, ang, fear, disg, neu.
SAVEEAuViEnglish4/480ang, disg, fear, hap, sad, surp, neu.
VESUSAuViEnglish10/hap, sad, ang, fear, neu.
eNTERFACEAuViEnglish44/1293hap, sad, surp, ang, disg, fear, neutral is not included.
JL CorpusAuNew Zealand English4/4840neu, hap, sad, ang, exc.
TESSAuCanadian English2/2800ang, disg, fear, hap, pleasant surp, sad, neu.
GEESAuSerbian6/2790neu, hap, ang, sad, fear.
Table 2. Evaluation of regression quality by means of CCC and MAE. (Dim stands for Dimension Val for Valence and Act for Activation. MIX2 is the mixture of IEMOCAP and MSP-IMPROV datasets and MIX3 is the mixture of IEMOCAP, MSP-IMPROV and VaM).
Training SetDimIEMOCAP Test SetMSP-IMPROV Test SetVaM Test SetMIX3 Test SetMIX2 Test Set
CCCMAECCCMAECCCMAECCCMAECCCMAE
IEMOCAP trainVal0.6310.5730.3560.6490.0540.4580.5130.5920.5170.604
Act0.7500.4070.4040.6710.0590.5980.5320.5570.5470.557
MSP-IMPROV trainVal0.3750.7130.6100.510−0.0310.7230.4410.6230.4600.616
Act0.4840.6510.6960.3930.0050.7560.6000.4940.6310.477
VaM trainVal−0.0240.737−0.0050.8600.0630.315−0.0290.784−0.0250.814
Act0.0960.6040.0230.7260.0440.5440.0240.6760.0220.686
MIX3 train Val0.6460.5550.5540.5390.0290.4840.6390.5160.6370.527
Act0.6780.4580.6570.430−0.0140.6480.7290.4020.7500.391
MIX2 trainVal0.6460.5580.5610.5340.0250.5240.6320.5200.6410.525
Act0.6730.4660.6670.424−0.0140.6610.7260.4040.7530.390
Table 3. Evaluation of the regression quality using distances between centroids.
Tested
Corpus
DimensionEmotion ClustersMIX3
Train Set
MIX2
Train Set
EMO DBvalenceangry-happy0.350.36
activationangry-sad1.191.20
CREMA-Dvalenceangry-happy0.420.42
activationangry-sad0.960.98
RAVDESSvalenceangry-happy0.580.58
activationangry-sad0.730.75
eNTERFACEvalenceangry-happy0.280.28
activationangry-sad0.540.55
SAVEEvalenceangry-happy0.330.36
activationangry-sad0.520.51
VESUSvalenceangry-happy0.230.24
activationangry-sad0.420.44
EMOVOvalenceangry-happy0.370.35
activationangry-sad0.880.90
JL Corpusvalenceangry-happy0.480.52
activationangry-sad0.770.82
TESSvalenceangry-happy0.330.30
activationangry-sad0.620.67
GEESvalenceangry-happy0.380.39
activationangry-sad1.021.06
Mean distancevalenceangry-happy0.3750.380
Mean distanceactivationangry-sad0.7650.788
Table 4. Results the 10-fold regression on MIX2.
CCCMAE
Valencemean0.6370.519
stdev0.0150.009
Activationmean0.7630.385
stdev0.0100.009
Publisher’s Note: MDPI stays neutral with regard to jurisdictional claims in published maps and institutional affiliations.

