Article

LI-Care: A LabVIEW and IoT Based eHealth Monitoring System

1
Department of Electrical and Electronics Engineering, National Institute of Science and Technology, Berhampur 761008, India
2
School of Electronics Engineering, Kalinga Institute of Industrial Technology, Bhubaneswar 751024, India
3
Faculty of Electronics, Communication and Computers, University of Pitesti, 110040 Pitesti, Romania
4
Doctoral School, Polytechnic University of Bucharest, 313 Splaiul Independentei, 060042 Bucharest, Romania
*
Author to whom correspondence should be addressed.
Electronics 2021, 10(24), 3137; https://doi.org/10.3390/electronics10243137
Submission received: 20 October 2021 / Revised: 8 December 2021 / Accepted: 13 December 2021 / Published: 16 December 2021
(This article belongs to the Special Issue Wearable Electronic Devices for Health Monitoring)

Abstract

:
This paper presents a Laboratory Virtual Instrument Engineering Workbench (LabVIEW) and Internet of Things (IoT)-based eHealth monitoring system called LI-Care to facilitate the diagnosis of the health condition cost-effectively. The system measures the heart rate, body temperature, blood pressure, oxygen level, and breathing rate, and provides an electrocardiogram (ECG). The required sensors are integrated on a web-based application that keeps track of the essential parameters and gives an alarm indication if one or more physiological parameters go beyond the safe level. It also employs a webcam to obtain the patient view at any time. LabVIEW enables the effortless interfacing of various biomedical sensors with the computer and provides high-speed data acquisition and interactive visualizations. It also provides a web publishing tool to access the interactive window remotely through a web browser. The web-based application is accessible to doctors who are experts in that particular field. They can obtain the real-time reading and directly perform a diagnosis. The parameters measured by the proposed system were validated using the traditional measurement systems, and the Root Mean Square (RMS) errors were obtained for the various parameters. The maximum RMS error as a percentage was 0.159%, which was found in the temperature measurement, and its power consumption is 1 Watt/h. The other RMS errors were 0.05% in measurement of systolic pressure, 0.029% in measurement of diastolic pressure, 0.059% in measurement of breathing rate, 0.002% in measurement of heart rate, 0.076% in measurement of oxygen level, and 0.015% in measurement of ECG. The low RMS errors and ease of deployment make it an attractive alternative for traditional monitoring systems. The proposed system has potential applications in hospitals, nursing homes, remote monitoring of the elderly, non-contact monitoring, etc.

1. Introduction

Electronic health (eHealth) monitoring systems are receiving increasing interest from the research community, particularly due to the COVID-19 pandemic. These systems can be easily developed using Internet of Things (IoT) technology, a rapidly developing field with myriad applications. IoT technology connects the physical sensors to the Internet using wireless technologies, such as Wi-Fi, Bluetooth, ZigBee, and sensor networks [1]. It is used for effective traffic management, smart city management, waste management, industrial control, smart homes, etc. [2]. In addition to IoT, cloud computing and edge computing have revolutionized traditional healthcare system and have provided an opportunity to substitute in-hospital medical systems with Internet-connected electronic health (eHealth) care systems. Thus, many medical applications, such as remote patient monitoring, fitness regimens, chronic illnesses, and elder care, can be facilitated using the IoT [3,4]. Such eHealth care services are inexpensive, improve the quality of life, and enhance the user experience [5]. Researchers have proposed several IoT-based eHealth monitoring applications [6]. IoT nodes can be used to monitor essential medical parameters, such as blood pressure, heart rate, body temperature, and ECG [5]. IoT wearable devices can also be used as biosensors to monitor health and physical activities [6,7,8]. Most of these sensors are flexible and non-invasive, and continuously monitor the patient’s physiological parameters by establishing a wireless network termed the wireless body area network (WBAN) to collect physiological data from the human body for monitoring [9,10]. Antennas play a vital role in transmitting the wireless data from the patient to the caretaker and the doctor. Various types of antennas are used for different applications [11,12,13]. Smartphone-based applications are developed to visualize the data sent by these devices through the antennas. It makes information more accessible to patients, caregivers, and healthcare professionals, improving health and social care quality. However, integrating these sensors is a challenging task [14]. The increasing use of wearable devices and mobile-based applications in eHealth care can assist in collecting enormous amounts of data from various patients, therefore bearing realistic variations and possible outliers. This is required for systematic and relevant interpretations. With the support from IoT, machine learning (ML) algorithms are expected to learn domain insights more reliably, which leads to faster analysis, but without requiring significant time to prepare a database [15,16]. ML-assisted monitoring can provide cost-effective and potent solutions to the world’s rapidly aging population. Often aging people avoid or are unable to pay a visit to hospitals due to mobility issues. The capability of embedding artificial intelligence and ML into a smartphone application helps in providing timely attention, leveraging personal care, and providing better diagnoses. These techniques also provide a framework for analyzing clinical data and diagnosing disorders in the absence of experts. The conventional diagnosis methods have several flaws, including long computation time and poor detection accuracy [17,18].
LabVIEW is an excellent software package for developing virtual instruments. Its capability to facilitate quick measurements is beneficial for real-time monitoring. The dataflow nature of LabVIEW enables parallel processing, allowing multiple physiological sensors to be integrated simultaneously. LabVIEW makes it easier to employ an FPGA processor (NI-myRIO) for real-time applications, allowing efficient medical measurements. The LabVIEW front panel object provides interactive visualizations for the acquired data, making the parameters readable and understandable for physicians and patients. Combining IoT and LabVIEW can provide efficient means for eHealth monitoring. It provides an excellent graphical user interface that can be used to monitor several parameters simultaneously, which is not usually possible with a mobile-based application. Although several works have reported health monitoring using IoT, few have used LabVIEW for visualization. This can be corroborated by the publication statistics obtained from the Scopus database shown in Figure 1.
In the literature, there are only eight articles that have used LabVIEW for visualization, with IoT, of which only three articles were published in journals. A health monitoring system is presented in [19] based on LabVIEW that monitors body temperature, heart rate, and oxygen level. The breathing rate and the ECG are not monitored, and the visual representation is also poor. It is challenging for the doctors to read the parameters as the results are not provided in a single window. An NI-myRIO-based patient monitoring system is presented in [20] to monitor heart rate, blood pressure, and body surface temperature using the ESP8266 Wi-Fi module. The ESP module has disadvantages. It has only one analog-to-digital converter (ADC), and its Wi-Fi module requires several computations for processing the biomedical parameters. Therefore, for reliable long-term operation, it is not suitable. Moreover, the graphical user interface (GUI) is not sufficiently interactive for the doctors to find all the readings. Thus, this paper presents a real-time patient monitoring system (referred to as the LI-care system) that combines IoT and LabVIEW for practical online health monitoring. It employs a real-time high-speed data acquisition module (5 × 10⁵ samples per second) and necessary sensors to obtain the physiological parameters. The LabVIEW tool efficiently accesses these parameters generated by the IoT devices and provides an interactive visual interpretation that assists the doctors to easily and quickly comprehend the findings, thereby reducing the response time and improving the quality of treatment. Furthermore, the interactive window can be accessed through any computer connected to the Internet through its Internet protocol (IP) address using a web-based application.
The organization of this paper is as follows: the following section describes the experimental setup of the proposed real-time framework, its main components, and the integration of the various biomedical sensors. The third section presents the results obtained from the proposed framework, and, finally, the last section presents the conclusion of the proposed work.

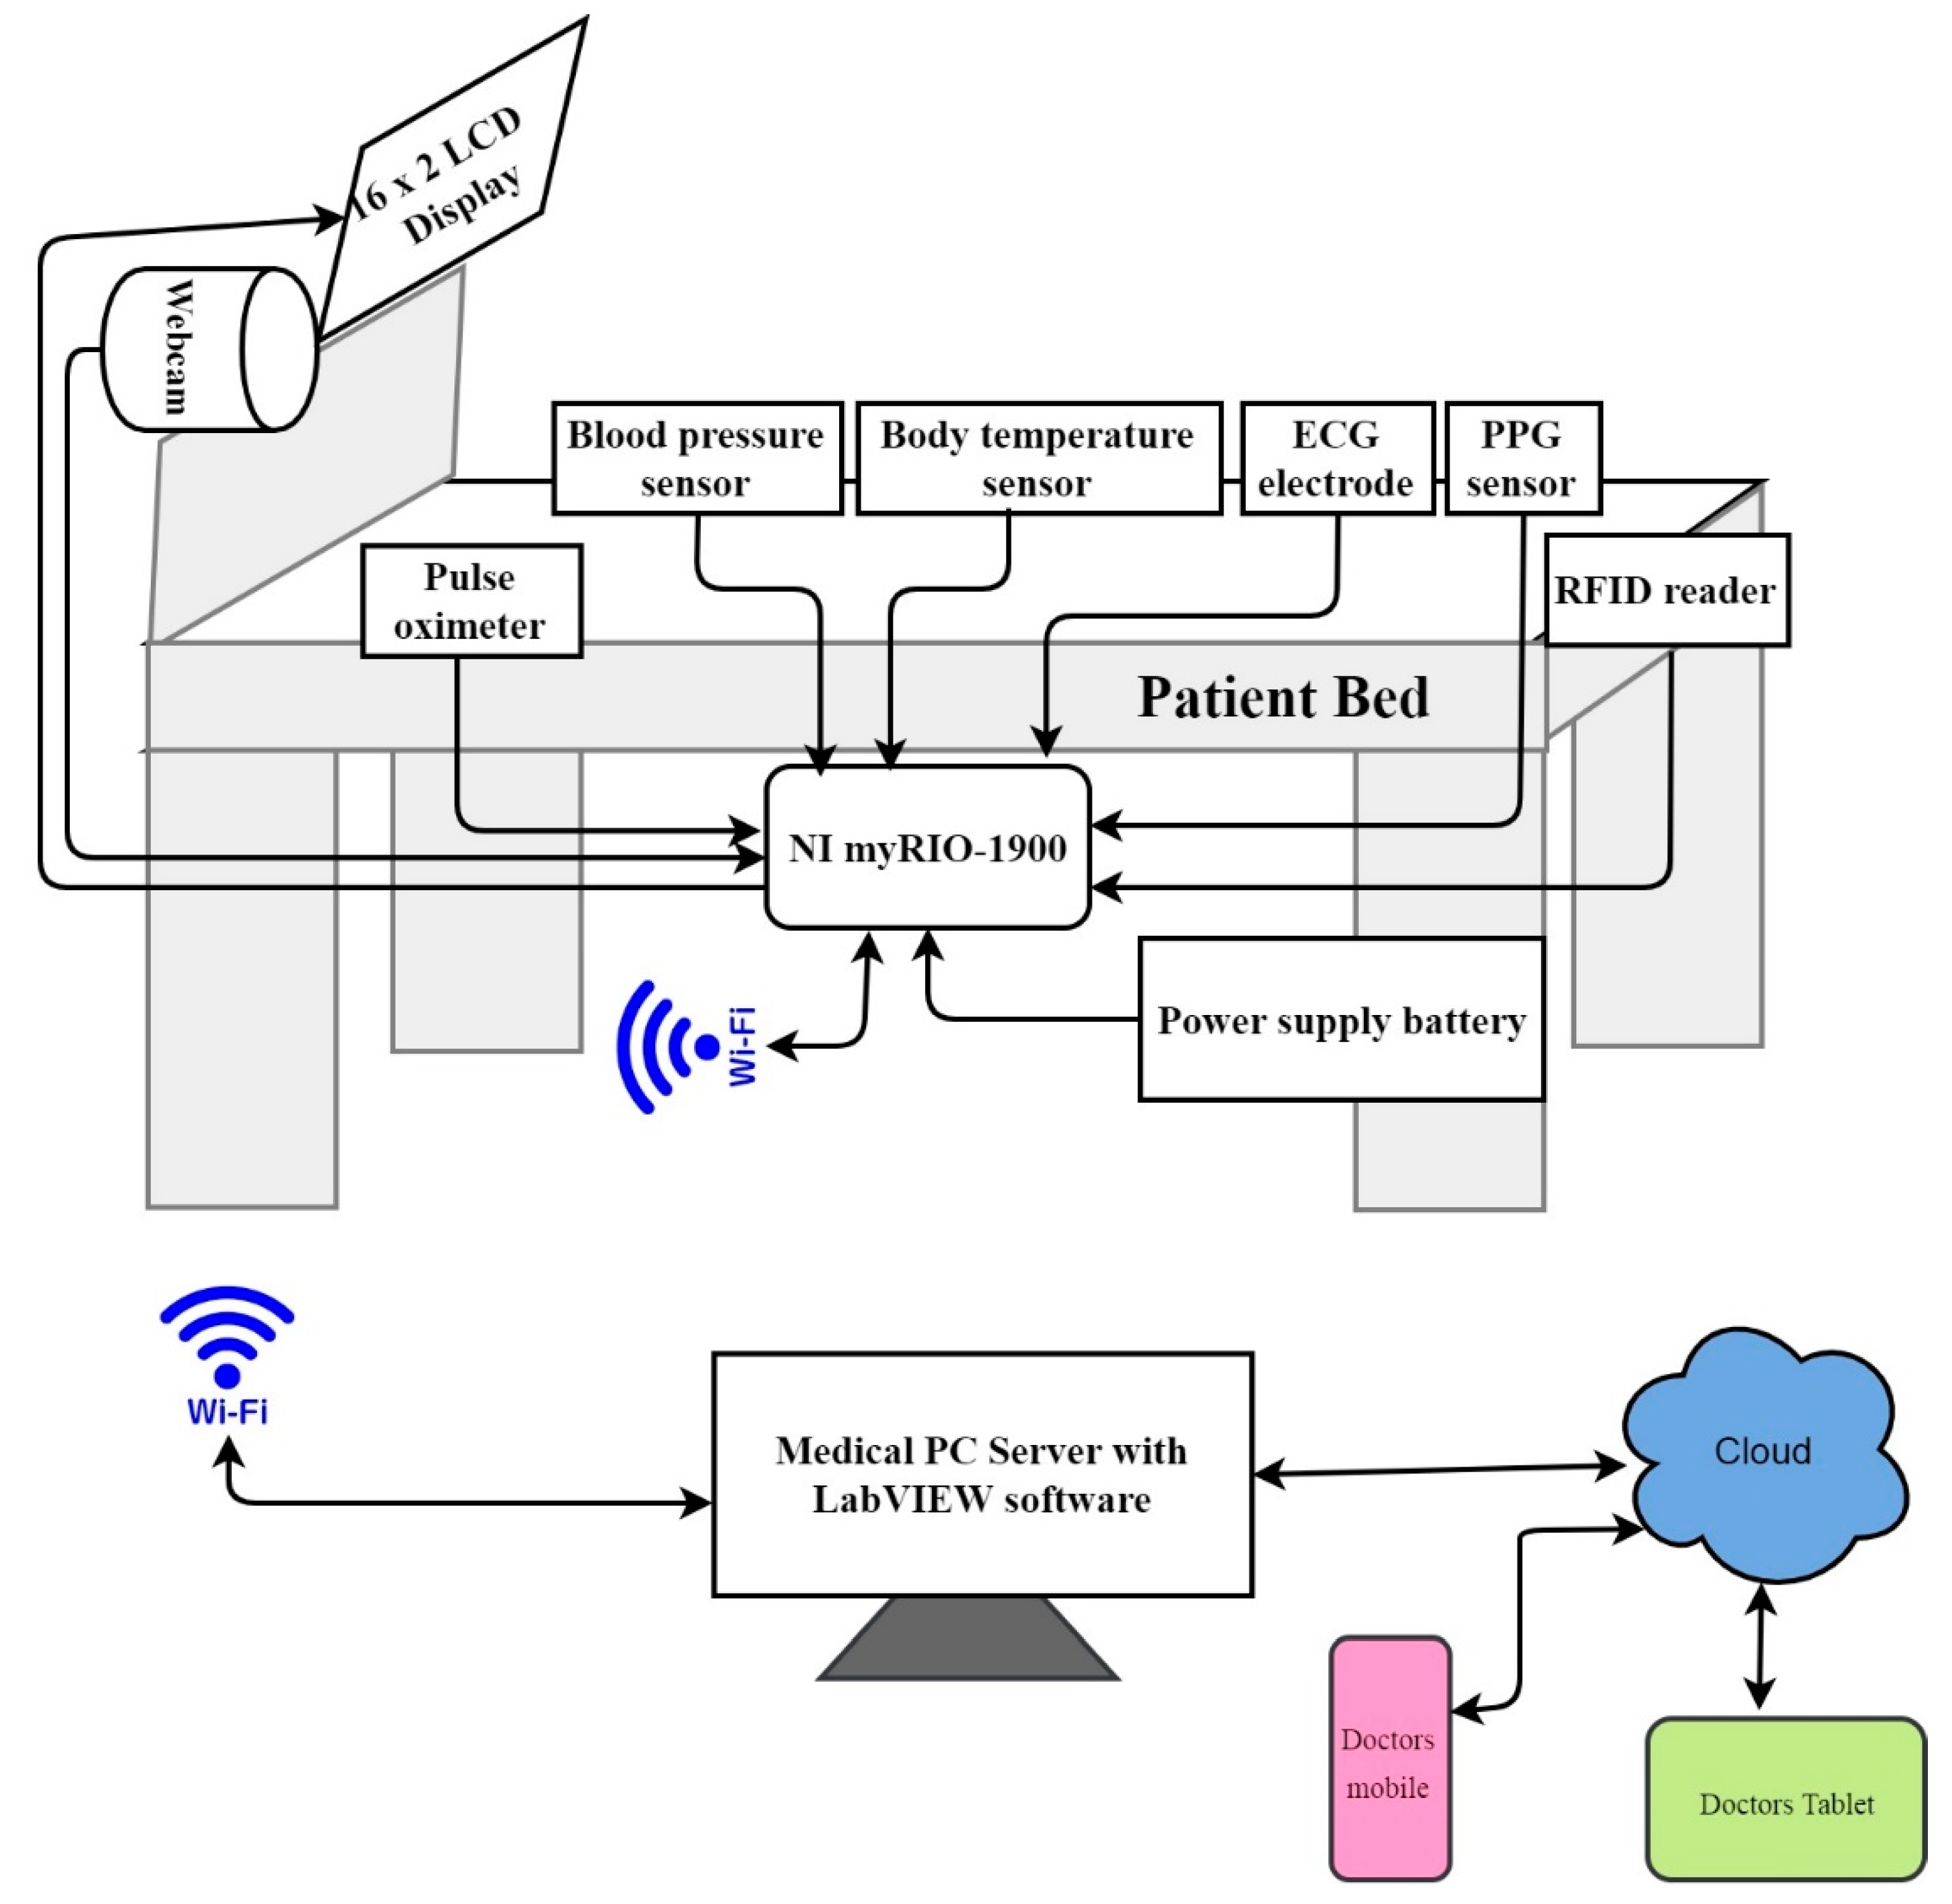
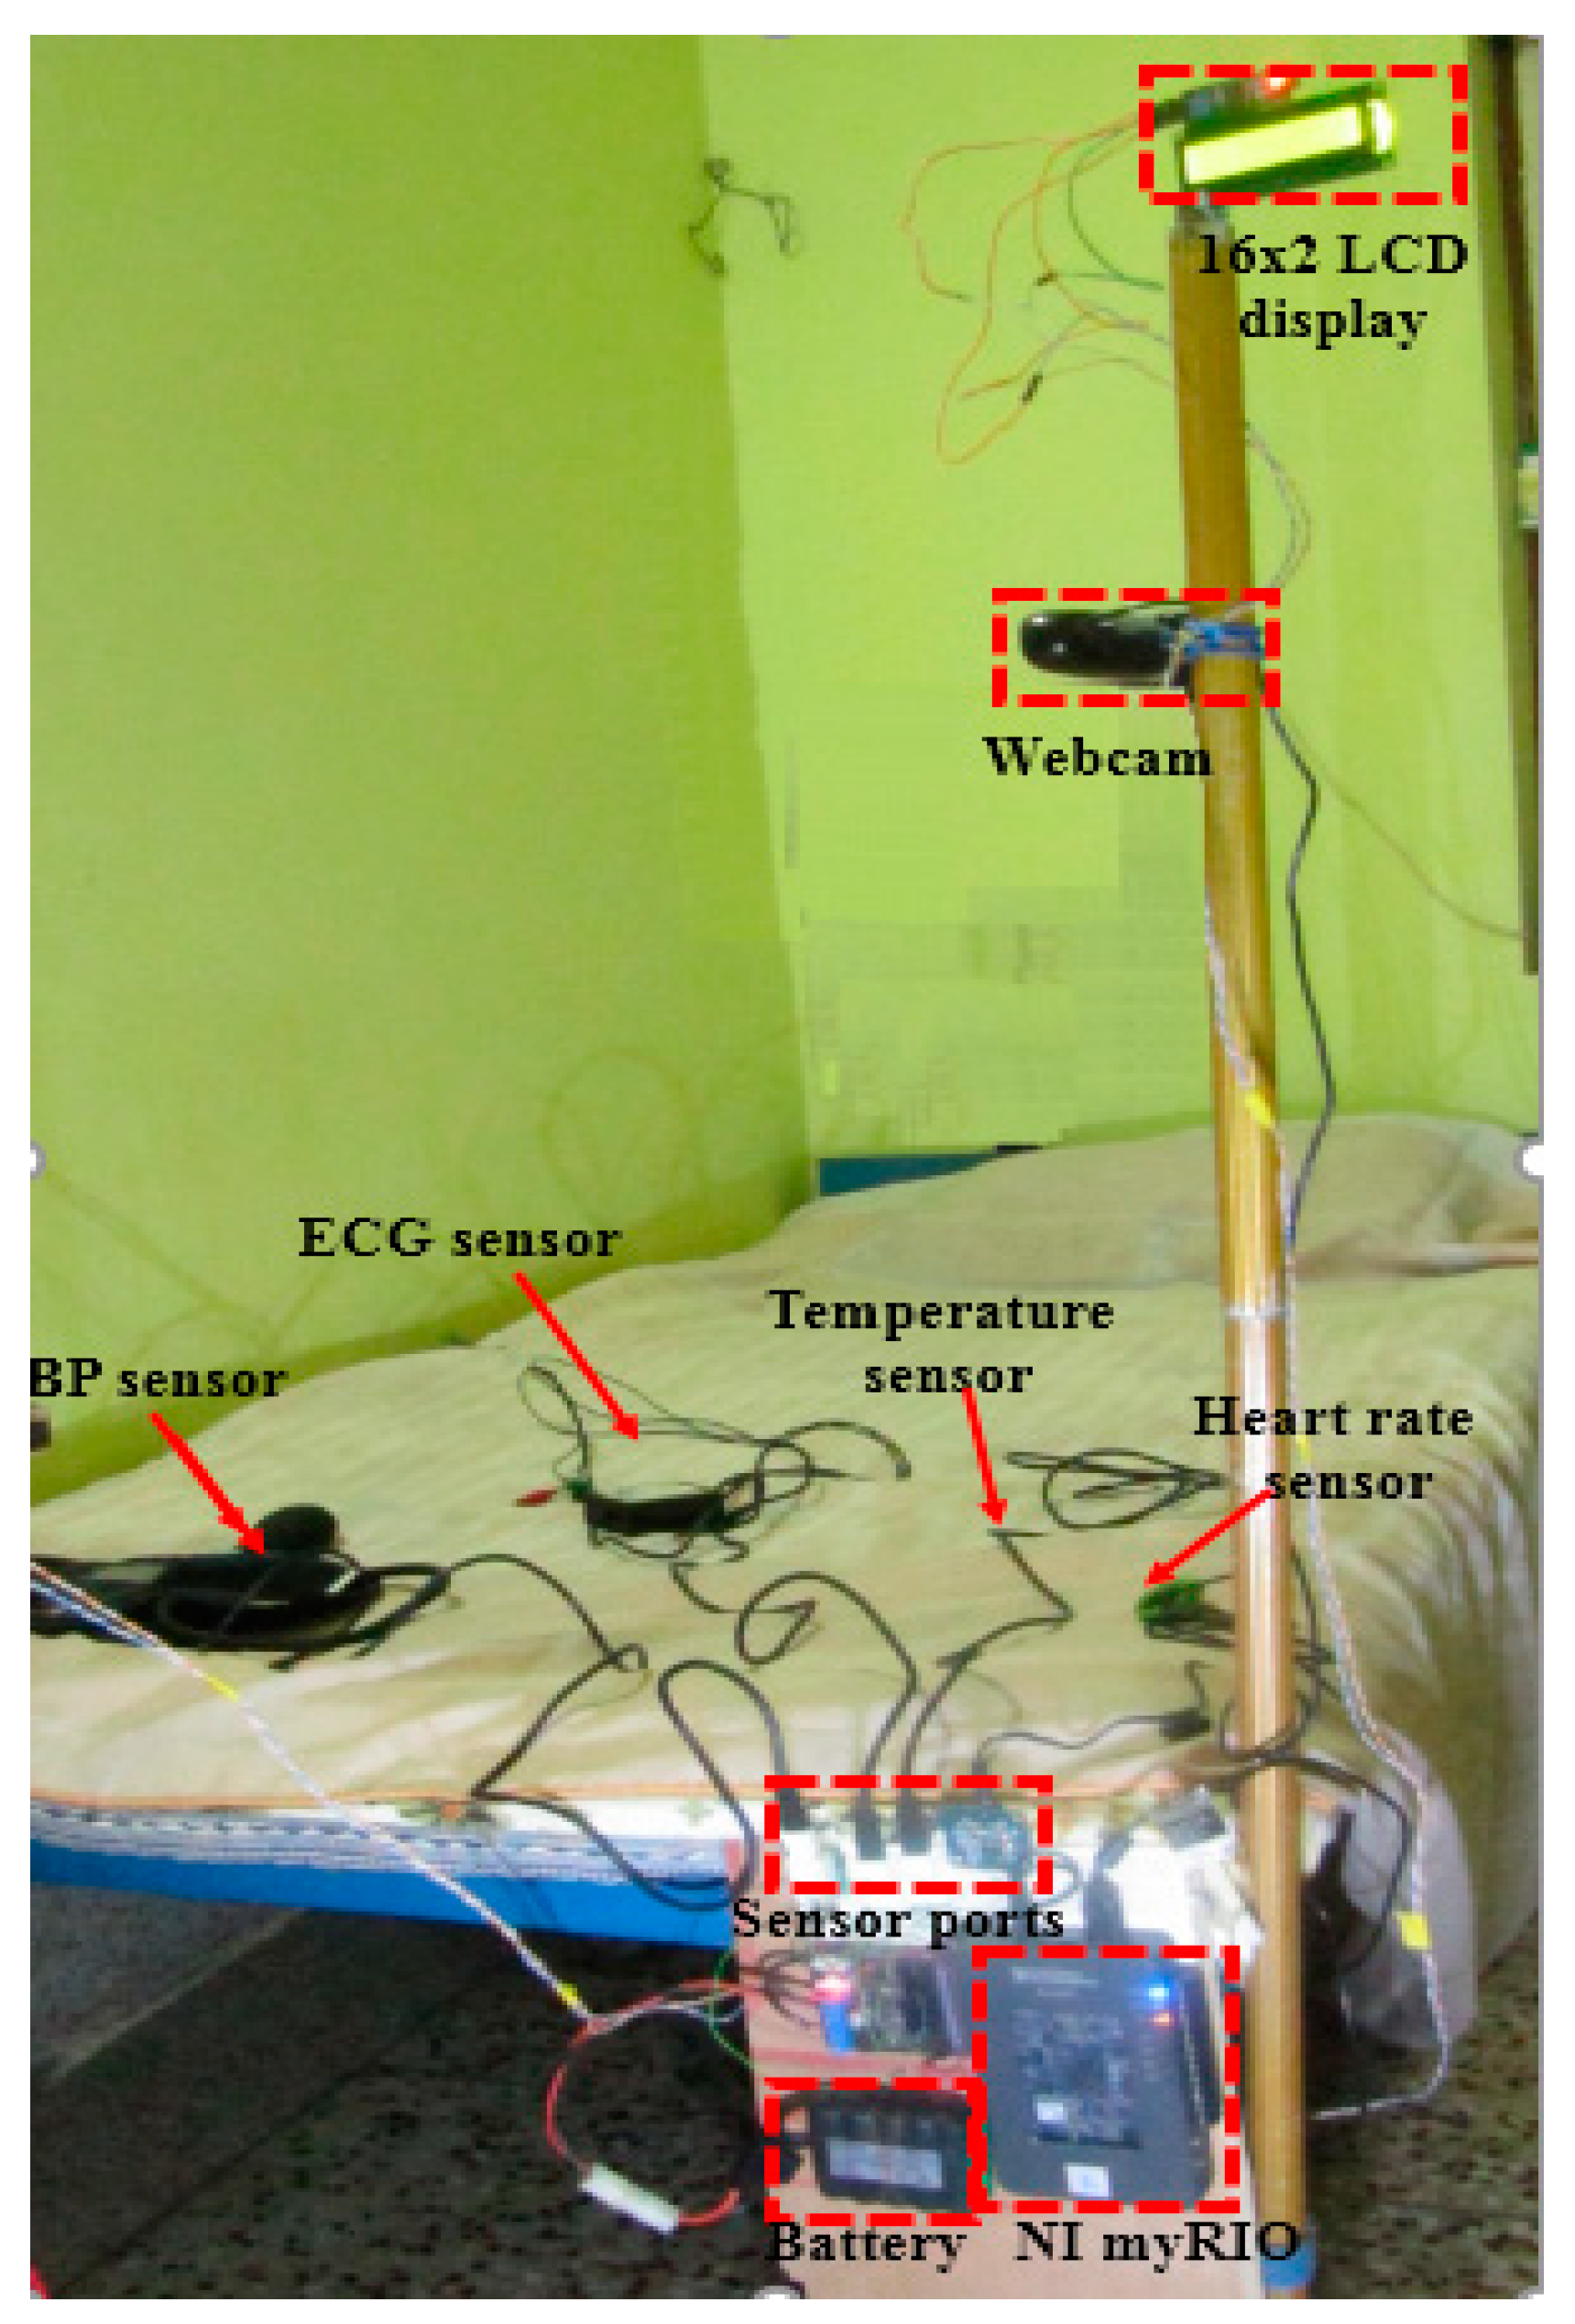
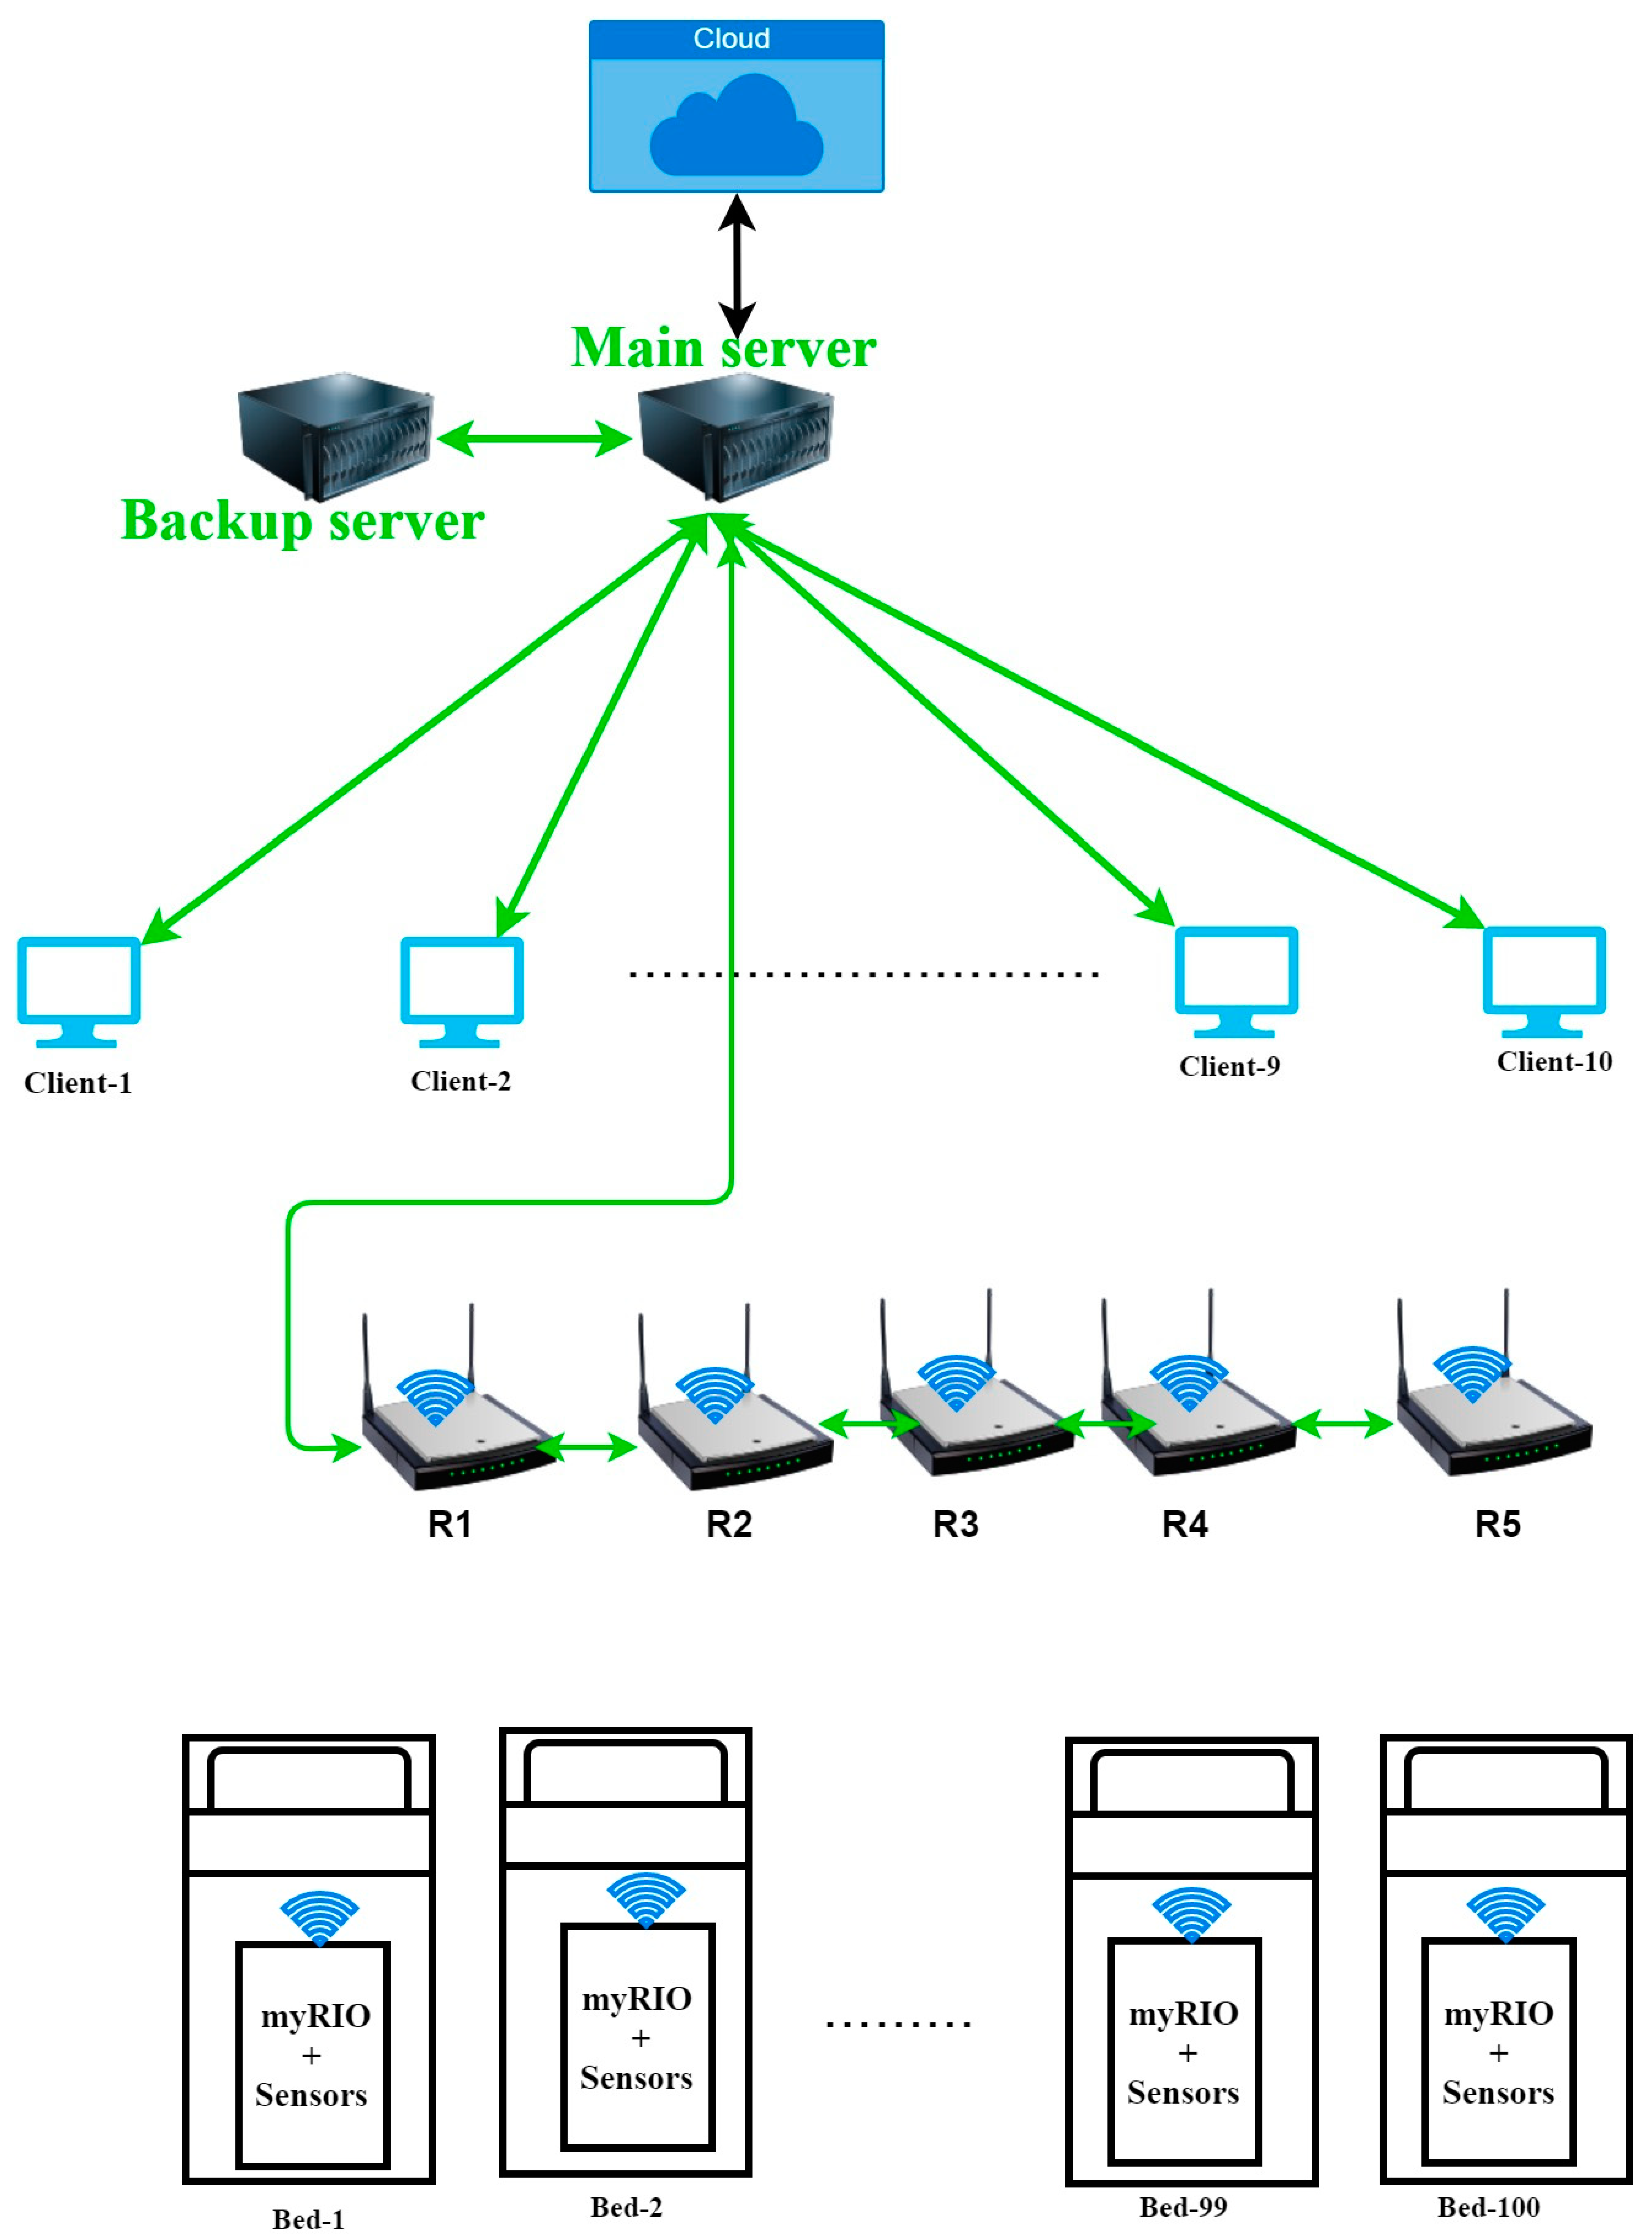
2. Setup of the LI-Care System

The physiological parameters provide essential information about the health condition of a patient. The online monitoring of these parameters is essential for prompt diagnosis. The LI-care system presented in this paper combines IoT with LabVIEW for improved health monitoring. The block diagram of the proposed LI-care system is shown in Figure 2. It consists of different physiological transducers to capture the patient body parameters such as blood pressure, body temperature, electrocardiogram (ECG), heart rate, breathing rate, and blood oxygen content. All physiological sensors are placed on the patient’s body and connected to an NI myRIO-1900. The blood pressure measurement sensor is placed over the upper arm. The body temperature measurement is taken using thermistor placed in the patient’s armpit. The ECG measurement electrodes are placed on both arms. Heart rate and blood oxygen levels are measured by placing the PPG and oximeter on the index finger. A webcam is also connected to allow viewing of the patient’s condition through live video. A radio frequency identification (RFID) is provided to identify the patient. A 16 × 2 LCD is also provided for offline monitoring. All the parameters are displayed sequentially, two at a time, using the 16 × 2 LCD. All the sensors, the RFID reader, and the webcam are connected with the NI-myRIO-1900 controller, which is mounted on the patient’s bed. The myRIO-1900 has inbuilt Wi-Fi, which sends the parameters captured from the patient to the server. All the transducers are connected with the myRIO-1900 through its analog input channels, and the RFID reader is connected through the serial port of the myRIO-1900. A LabVIEW-based visual interface is designed to monitor and analyze the patient’s health condition based on the information stored in the server. The server is also connected to the Internet for uploading the patient’s information to the cloud. The patient information can also be accessed by other people, such as the doctors and the caretakers, using their mobiles, tablets, computers, etc., connected to the cloud through the Internet.

Sensor Interfacing with myRIO-1900

This sensor was developed using a National Instrument (NI) device to build a stand-alone application. It is a reconfigurable embedded device that can be used for developing various real-time applications. It has three ports, i.e., port A, port B, and port C. Port A and port B can each support four analog input channels, two analog output channels, and sixteen digital input-output channels. In contrast, port C supports two analog input channels, two analog output channels, eight digital input-output channels, one audio input, and an audio output channel. Port A and port B can each support an asynchronous receiver-transformer (UART), an inter-integrated circuit (I2C) serial port, and a serial peripheral interface (SPI) serial. The device also has a universal serial bus (USB) device port and a USB host port. The physiological sensors, namely, the blood pressure sensor, the body temperature sensor, the ECG sensor, and the photo-plethysmography (PPG) heart rate sensor, are connected through the four analog channels of port A. The webcam is connected through a USB host connector. The NI-myRIO-1900 is connected to the server through Wi-Fi [21]. The connectivity range can be increased by using additional Wi-Fi routers. A proper Wi-Fi antenna must be used for better connectivity [22,23]. The interfacing of the sensors with the myRIO-1900 is shown in Figure 3, and the pin diagram is shown in Figure 4. The pin diagram for the interconnections between myRIO-1900 and the sensors was obtained from the myRIO-1900 manual [21]. A BSP-BTA Vernier non-invasive blood pressure sensor is connected through AI0 of port A to measure the patient’s blood pressure. A body surface thermistor temperature sensor is used to measure the patient’s body temperature and is connected through AI1 of port A. An EKG-BTA Vernier ECG sensor is connected to the AI2 of the port A to capture the ECG signal of the patient. A max30102 pulse oximeter is connected through the I2C of port A to measure the oxygen content in the blood. A PPG heart rate sensor is connected through the AI3 of port A to measure the heart rate of the patient. An RFID is connected through the UART of port A to identify the patient using the RFID tag assigned to them. A 16 × 2 LCD is provided near the patient’s bed to monitor the parameters in minimal form. A webcam is also provided through the USB host port to send the live video of the patient to enable monitoring of the patient in emergency cases. The myRIO is connected to the PC through Wi-Fi. The LabVIEW tool is installed on the PC. All the sensors are sampled by the myRIO-1900 with the same sampling rate, to ensure that all the physiological parameters monitored by the system are time correlated.
A 12 V, 2000 mAh nickel-metal hybrid battery is used to supply the required power to operate the NI myRIO-1900 and the other sensors. The various sensors used in this work are reported in Table 1, and they are also shown in Figure 5. The electrodes are attached to the patient’s body using electrolyte gel and an adhesive patch to ensure that they are not detached due to regular movements.

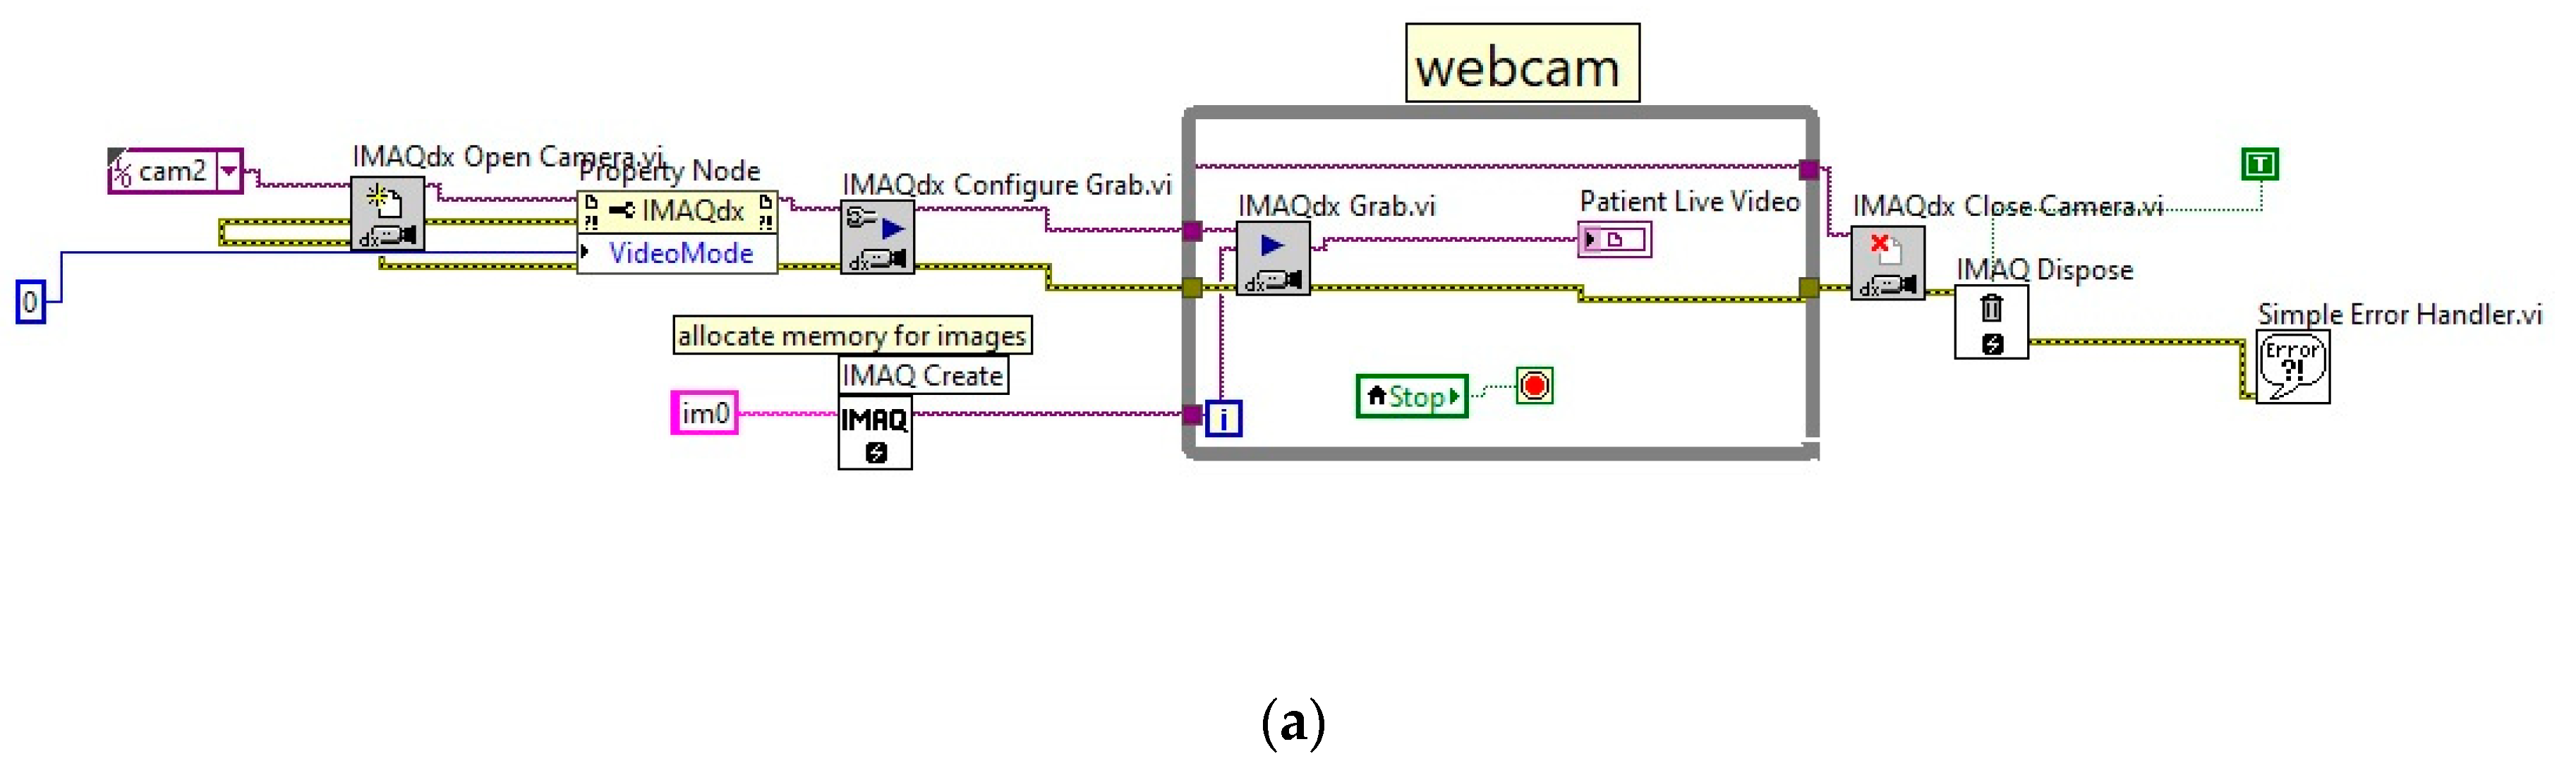
3. Real-Time Implementation and Discussion of Results

An RFID tag is assigned to every patient to uniquely identify them. Physiological sensors are placed at the appropriate place on the patient’s body to obtain an accurate reading. Figure 5 shows the various sensors attached to the body of the patient. These sensors are interfaced with the myRIO-1900, which sends the data to the server. The LabVIEW application in the server processed the data and sends it to the cloud. The data can be accessed in any other system using a web application developed using the LabVIEW’s web publishing tool from the cloud. This provides an excellent graphical interface for viewing all the patient’s physiological parameters. Additionally, the video of the patient can be viewed for continuous monitoring.
The graphical user interface developed using LabVIEW is shown in Figure 6. In this work, the application runs on two HP Proliant DL380G6 servers. One server is used as the main server and the second is used as a backup server. Both servers are configured in a cluster technique to reduce downtime and outages by allowing another server to take over in an outage event. Each server has an Intel Xeon processor and eight redundant arrays of independent disks (RAID) comprising hard disk drives of 300 GB. The servers can handle 400 concurrent clients. In the GUI, the top of the interface indicates the RFID tag and the patient’s name. The first image on the left of the interface shows the live video of the patient, which can be helpful for continuous monitoring. This will help the attendant to monitor all the patients from one central place and attend to a patient in an emergency. The body temperature is shown using the thermometer. Such a graphical presentation can quickly attract the caretaker’s attention and minimize the time needed for analysis. Additionally, digital values are provided to indicate the current temperature, the maximum temperature, the minimum temperature, and the median temperature of the patient. The second graph on the left side of Figure 6 shows the variation in the signal captured by the PPG to calculate the heart rate in real time. An LED on the top of the graph blinks continuously to indicate real-time measurement. In the third graph on the left side of the GUI, the breathing rate is plotted. The breathing rate is obtained by measuring the temperature variation of the thermistor sensor placed near the patient’s nostrils. The blood pressure is depicted in the top right figure. However, unlike the other measurements, this is taken only when necessary. When the BP button provided on the top right is pressed, it takes around one minute to determine the systolic and diastolic pressure. The systolic and diastolic measurement is based on [24]. The yellow and red bars on the plot indicate the systolic and diastolic pressure. The systolic and diastolic pressures are also digitalized at the top portion of the blood pressure graph. This also indicates whether the patient’s blood pressure is normal or indicates hypertension or hypotension. The ECG signal is shown in the graph below the blood pressure plot. Below the graph, the heart rate variability information is indicated in digital form, which shows the mean heart rate, the QRS mean, the QRS time mean, the PR interval mean, the QT interval mean, and the ST level mean. Additionally, the breath rate, heart rate, and oxygen level are displayed in digital form. These parameters are stored in the database using the LabVIEW database connectivity toolkit. In LabVIEW, the programs are in the form of graphical blocks that are connected together. These programs are called block diagram codes. The LabVIEW block diagram code for sensing each parameter is shown in Figure 7. The block codes are all run in parallel, ensuring that physiological parameters are time correlated. Figure 7a shows the webcam interface block diagram using the vision acquisition driver in LabVIEW. It selects the camera from the list of available cameras, then configures and acquires the most recent frame into the image. The ‘grab.vi’ is placed in a while loop to capture the video continuously. The patient’s physical condition is continuously captured and sent to the PC. This provides live monitoring of the patient. Once the program is stopped, the program comes out of the while loop and stops the image acquisition.
Figure 7b shows the body temperature measurement. It uses a thermistor temperature sensor connected at the AI1 analog pin of port A of the NI myRIO. This acquires the body temperature in terms of analog voltage. The change in the body temperature leads to the change in the thermistor’s resistance. The change in resistance is converted into an analog voltage, which is then converted internally to a temperature value using Equation (1).
T = 1 / [ a + ln R t × ( b + c × ( ln R T 2 ) ) ]  
where ln R T = ln ( V l r t ) , a, b, and c are constants having values 1.0211 × 10⁻³, 2.22468 × 10⁻⁴, and 1.3342 × 10⁻⁷ respectively.
The minimum and maximum temperatures are calculated using the statistical block of LabVIEW. Figure 7c shows the block diagram for monitoring the heart rate using a PPG sensor connected to the analog input channel AI3 of port A of the myRIO. The working of the PPG is based on the emission of infrared light by an LED. The infrared light penetrates the skin and blood vessels and is captured by the detector on the opposite of the index finger. This is proportional to the heart rate and is acquired as an analog signal. From that analog signal, the number of peaks is counted using detect-peak ‘subvi’. Then the number of peak counts per minute are calculated and expressed as the heart rate. Figure 7d shows the breathing rate obtained with the help of another thermistor placed at the patient’s nostrils, and the variation in the temperature is calculated every minute as the breathing rate. Figure 7e shows the LabVIEW block diagram for the blood pressure sensor connected with analog input channel AI0 of the myRIO’s port A. This is a non-invasive oscillometric method for measuring blood pressure. It consists of a cuff containing a sensor, placed around the upper arm, which is inflated and then slowly deflated at a constant rate. The arterial pressure pulse forms are recorded, from which the pressure pulse systolic and diastolic pressure are calculated. Figure 7f shows the LabVIEW block diagram of ECG measurement, connected through the analog input channel AI2 of the myRIO’s port A. This captures the heart’s electrical signal through the ECG electrode placed on both the arms (black and green electrodes on the right arm and a red electrode on the left arm, as shown in Figure 5c). The QRS waves are detected and the features are extracted from the ECG signal. Figure 7g shows the 16 × 2 LCD interface LabVIEW block diagram, which is connected through the Serial Peripheral Interface (SPI) port of the myRIO, as shown in Figure 4. As it can only display 32 letters, the parameters are displayed sequentially one after another in cyclic order. First, it displays the body temperature (current temperature, maximum temperature, and the minimum of the patient) for fifteen seconds (which can be changed programmatically). Next, the heart rate is displayed for fifteen seconds, and so on. These parameters are displayed cyclically.
To analyze the cost needed to set up such a monitoring system for a hospital consisting of 100 beds, 10 thin clients were considered, which are needed by the caretakers for local visualization. These thin clients will be connected to the hospital servers where the LabVIEW application is running. Two servers are considered for meeting the needs of the hospital. The network architecture for building this monitoring facility is shown in Figure 8, and the cost of the individual components needed to build up this facility is shown in Table 2. For security reasons, the wireless routers are configured with the MAC (Media Access Control) ID of each myRIO. The parameters collected by each myRIO are sent to the server through the wireless router. In order to enhance security and minimize data loss, the routers are connected to the server through Ethernet cables. The total cost is around $151,786.95, which is much less compared to the cost of the equipment needed to monitor 100 patients.
Moreover, the monitoring data can be collected and used for future data analysis. In addition, patients’ relatives can have real-time updates about the patient’s health without being physically present at the hospital using the web application that connects to the hospital server.
To validate the accuracy of the results displayed by the LabVIEW GUI, an error analysis was carried out by calculating the Root Mean Square (RMS) error for every parameter. The error analysis was carried out by taking 54 temperature and pressure readings using a standard medical thermometer, blood pressure measurement device, standard pulse oximeter device, and standard medical PPG device. Similarly, an ECG signal was obtained using a standard cardio-graph. These parameters were obtained from 54 different patients using the same prototype. As all the sensors are approved by the NI, they are reliable and their measurements are reproducible. The RMS values of the errors for these parameters are reported in Table 3.
The results shown in Table 4 highlight that the parameters measured by the LI-Care system are highly accurate, and the errors are mainly due to the analog-to-digital conversion process. The RMS error as a percentage is less than that for all the parameters. Thus, the proposed system can be implemented for practical medical applications. It has also been observed that the 12 V, 2000 mAh nickel-metal hybrid battery can power the system for 24 h, and thus, its power consumption is 1 watt/h. A summary of some of the related works that use both IoT and LabVIEW is given in Table 4. In addition, note that none of these works can provide a live video of the patient.
From the comparison shown in Table 4, it is clear that the proposed system provides monitoring functionalities of several parameters and the patient’s live video.

4. Conclusions

Remote health monitoring has gained momentum due to the COVID-19 pandemic. In this paper, LI-Care, a monitoring system based on the rich GUI features provided by LabVIEW and the integration of IoT sensors, is discussed. The system can be easily scaled to provide health monitoring services to hundreds of patients. Using a web application, any authorized person can monitor the patients. The powerful signal acquisition and processing capability of the myRIO-1900 make it an ideal choice for obtaining high-speed signals from IoT sensors. The acquired data are communicated to the wireless server and then viewed using the designed LabVIEW graphical interface, which provides the facilities of a real monitoring tool. The maximum RMS error as a percentage is 0.159%, which was found in the temperature measurement, and its power consumption is 1 watt/h. Moreover, the data collected by the server can be used for data analysis using emerging technologies such as big data and deep learning. These advanced technologies can be further incorporated into the GUI to make accurate predictions, enabling individual preventive healthcare, which the authors intend to develop in their future work. Additional GUI features can be added to indicate the accidental removal of wires and an alarm can be sent to the caretaker. This will be considered in our future work. Data loss or data corruption due to advanced cyber-attacks are important issues that will also be addressed in future work.

Author Contributions

Conceptualization, S.K.M., B.A. and S.P.; methodology, K.S. and M.C.; software, K.S. and M.C.; validation, B.A. and K.S.; investigation, B.A. and M.C.; resources, K.S.; data curation, S.K.M., B.A. and S.P.; writing—original draft preparation, K.S., B.A. and S.P., supervision, N.B.; project administration, B.A.; formal analysis, N.B.; funding acquisition, N.B.; visualization, N.B.; writing—review and editing, N.B.; figure and table, K.S. All authors have read and agreed to the published version of the manuscript.

Funding

There is no funding available for this research.

Institutional Review Board Statement

Not applicable.

Informed Consent Statement

Not applicable.

Data Availability Statement

Not applicable.

Conflicts of Interest

The authors declare no conflict of interest.

References

  1. Miraz, M.H.; Ali, M.; Excell, P.S.; Picking, R. A Review on Internet of Things (IoT): Internet of Everything (IoE) and Internet of Nano Things (IoNT). In Proceedings of the 2015 Internet Technologies and Applications (ITA), Wrexham, UK, 8–11 September 2015; pp. 219–224. [Google Scholar] [CrossRef] [Green Version]
  2. Elkhodr, M.; Shahrestani, S.; Cheung, H. Internet of Things Applications: Current and Future Development. In Innovative Research and Applications in Next-Generation High Performance Computing; IGI Global: Hershey, PA, USA, 2016; pp. 397–427. [Google Scholar]
  3. Mustafa, T.; Varol, A. Review of the Internet of Things for Healthcare Monitoring. In Proceedings of the 8th International Symposium on Digital Forensics and Security (ISDFS), Beirut, Lebanon, 1–2 June 2020; pp. 1–6. [Google Scholar] [CrossRef]
  4. Vedaei, S.S.; Fotovvat, A.; Mohebbian, M.R.; Rahman, G.M.; Wahid, K.A.; Babyn, P.; Marateb, H.R.; Mansourian, M.; Sami, R. COVID-SAFE: An IoT-Based System for Automated Health Monitoring and Surveillance in Post-Pandemic Life. IEEE Access 2020, 8, 188538–188551. [Google Scholar] [CrossRef] [PubMed]
  5. Ko, J.; Lu, C.; Srivastava, M.B.; Stankovic, J.A.; Terzis, A.; Welsh, M. Wireless Sensor Networks for Healthcare. Proc. IEEE 2010, 98, 1947–1960. [Google Scholar] [CrossRef] [Green Version]
  6. Yang, G.; Xie, L.; Mäntysalo, M.; Zhou, X.; Pang, Z.; Da Xu, L.; Kao-Walter, S.; Chen, Q.; Zheng, L.R. A Health-IoT Platform Based on the Integration of Intelligent Packaging, Unobtrusive Bio-Sensor, and Intelligent Medicine Box. IEEE Trans. Ind. Inform. 2014, 10, 2180–2191. [Google Scholar] [CrossRef] [Green Version]
  7. Hussain, A.; Zafar, K.; Baig, A.R. Fog-Centric IoT Based Framework for Healthcare Monitoring, Management and Early Warning System. IEEE Access 2021, 9, 74168–74179. [Google Scholar] [CrossRef]
  8. Escobedo, P.; Bhattacharjee, M.; Nikbakhtnasrabadi, F.; Dahiya, R. Smart Bandage with Wireless Strain and Temperature Sensors and Batteryless NFC Tag. IEEE Internet Things J. 2021, 8, 5093–5100. [Google Scholar] [CrossRef]
  9. Liu, Y.; Wang, H.; Zhao, W.; Zhang, M.; Qin, H.; Xie, Y.F. Stretchable Sensors for Wearable Health Monitoring: Sensing Mechanisms, Materials, Fabrication Strategies and Features. Sensors 2018, 18, 645. [Google Scholar] [CrossRef] [Green Version]
  10. Wang, X.; Liu, Z.; Zhang, T. Flexible Sensing Electronics for Wearable/Attachable Health Monitoring. Small 2017, 13, 1602790. [Google Scholar] [CrossRef] [PubMed]
  11. Alibakhshikenari, M.; Virdee, B.S.; Limiti, E. Wideband Planar Array Antenna Based on SCRLH-TL for Airborne Synthetic Aperture Radar Application. J. Electromagn. Waves Appl. 2018, 32, 1586–1599. [Google Scholar] [CrossRef]
  12. Alibakhshikenari, M.; Virdee, B.S.; Ali, A.; Limiti, E. Extended Aperture Miniature Antenna Based on CRLH Metamaterials for Wireless Communication Systems Operating over UHF to C-band. Radio Sci. 2018, 53, 154–165. [Google Scholar] [CrossRef]
  13. Alibakhshikenari, M. Printed Planar Patch Antennas Based on Metamaterial. Int. J. Electron. Lett. 2013, 2, 37–42. [Google Scholar] [CrossRef]
  14. Castillejo, P.; Martinez, J.; Rodriguez-Molina, J.; Cuerva, A. Integration of Wearable Devices in a Wireless Sensor Network for an E-Health Application. IEEE Wirel. Commun. 2013, 20, 38–49. [Google Scholar] [CrossRef] [Green Version]
  15. Dimitrov, D.V. Medical Internet of Things and Big Data in Healthcare. Healthc. Inform. Res. 2016, 22, 156–163. [Google Scholar] [CrossRef]
  16. Firouzi, F.; Rahmani, A.M.; Mankodiya, K.; Badaroglu, M.; Merrett, G.V.; Wong, P.; Farahani, B. Internet-of-Things and Big Bata for Smarter Healthcare: From Device to Architecture, Applications and Analytics. Future Gener. Comput. Syst. 2018, 78, 583–586. [Google Scholar] [CrossRef] [Green Version]
  17. Haq, A.U.; Li, J.P.; Khan, J.; Memon, M.H.; Nazir, S.; Ahmad, S.; Khan, G.A.; Ali, A. Intelligent Machine Learning Approach for Effective Recognition of Diabetes in E-Healthcare Using Clinical Data. Sensors 2020, 20, 2649. [Google Scholar] [CrossRef] [PubMed]
  18. Jiang, F.; Jiang, Y.; Zhi, H.; Dong, Y.; Li, H.; Ma, S.; Wang, Y.; Dong, Q.; Shen, H.; Wang, Y. Artificial Intelligence in Healthcare: Past, Present and Future. Stroke Vasc. Neurol. 2017, 2, 230–243. [Google Scholar] [CrossRef] [PubMed]
  19. Evangeline, C.S.; Ashmiya, L. Human Health Monitoring Using Wearable. Sens. Rev. 2019, 39, 364–376. [Google Scholar] [CrossRef]
  20. Rathy, G.A.; Sivasankar, P.; Tamara, Z.F. An efficient IoT based biomedical health monitoring and diagnosing system using myRIO. Telecommun. Comput. Electron. Control. 2020, 18, 3050–3057. [Google Scholar]
  21. User Guide. NI myRIO-1900. Available online: https://www.ni.com/pdf/manuals/376047c.pdf (accessed on 10 October 2021).
  22. Alibakhshikenari, M.; Babaeian, F.; Virdee, B.S.; Aïssa, S.; Azpilicueta, L.; See, C.H.; Althuwayb, A.A.; Huynen, I.; Abd-Alhameed, R.A.; Falcone, F.; et al. A Comprehensive Survey on Various Decoupling Mechanisms with Focus on Metamaterial and Metasurface Principles Applicable to SAR and MIMO Antenna Systems. IEEE Access 2020, 8, 192965–193004. [Google Scholar] [CrossRef]
  23. Alibakhshikenari, M.; Virdee, B.S.; Azpilicueta, L.; Naser-Moghadasi, M.; Akinsolu, M.O.; See, C.H.; Liu, B.; Abd-Alhameed, R.A.; Falcone, F.; Huynen, I.; et al. A Comprehensive Survey of Metamaterial Transmission-Line Based Antennas: Design, Challenges, and Applications. IEEE Access 2020, 8, 144778–144808. [Google Scholar] [CrossRef]
  24. Coogan, N.; Marra, A.; Lomonaco, E. Assessing Accurate BP Measurement: Size and Technique Matter! Nursing 2015, 45, 16–18. [Google Scholar] [CrossRef]
  25. Queyam, A.B.; Meena, R.K.; Pahuja, S.K.; Singh, D. An IoT Based Multi-Parameter Data Acquisition System for Efficient Bio-Telemonitoring of Pregnant Women at Home. In Proceedings of the 2018 8th International Conference on Cloud Computing, Data Science & Engineering, Noida, India, 11–12 January 2018; pp. 14–15. [Google Scholar] [CrossRef]
  26. Farooq, A.; Seyedmahmoudian, M.; Stojcevski, A. A Wearable Wireless Sensor System Using Machine Learning Classification to Detect Arrhythmia. IEEE Sens. J. 2021, 21, 11109–11116. [Google Scholar] [CrossRef]
Figure 1. Publications statistics from Scopus database.
Electronics 10 03137 g001
Figure 2. Block diagram of the LI-Care system.
Electronics 10 03137 g002
Figure 3. Interface between myRIO-1900 and the sensors.
Electronics 10 03137 g003
Figure 4. Pin diagram for interconnections between myRIO-1900 and the sensors.
Electronics 10 03137 g004
Figure 5. Sensors: (a) webcam and the 16 × 2 LCD arrangement; (b) blood pressure sensor; (c) ECG electrodes; (d) PPG and oximeter sensor; (e) thermistor temperature sensor probe.
Electronics 10 03137 g005
Figure 6. GUI for the real-time monitoring of the patient.
Electronics 10 03137 g006
Figure 7. LabVIEW block diagram code for (a) webcam interface; (b) body temperature measurement; (c) PPG-based heart rate measurement; (d) thermistor-based breathing rate measurement; (e) blood pressure measurement; (f) ECG measurement; (g) SPI-based LCD interface.
Electronics 10 03137 g007aElectronics 10 03137 g007bElectronics 10 03137 g007c
Figure 8. Networking configuration.
Electronics 10 03137 g008
Table 1. Information pertaining to the various sensors used in this work.
Physiological SensorApplicationData RateResponse Time
BSP-BTAblood pressure120 bytes/s<3 s
EKG-BTAECG10 kilobytes/s<1 s
max30102Pulse oximeter120 bytes/s<3 s
PPGHeart rate2 kilobytes/s<3 s
ThermistorBody temperature, breathing rate120 bytes/s<3 s
Table 2. Cost analysis for monitoring 100 patients using LI-Care.
DescriptionUnit PriceNumber of ItemsTotal
PowerEdge T340 Tower Server$769.002$1538.00
Thin Client$10010$1000.90
NI-myRIO-1900$890.00100$89,000.00
Battery$47.81100$4781.00
16 × 2 LCD display$5.99100$599.00
MAX30100 Heart Rate Oximeter Sensor$10.49100$1049.00
Wi-Fi Router$49.995$249.95
Blood Pressure Sensor$149.00100$14,900.00
Surface Temperature Sensor$32.00200$6400.00
EKG Sensor$215.00100$21,500.00
RFID Reader$29.95100$2995.00
Webcam$36.95100$3695.00
EKG Electrode$0.081000$80.00
LabVIEW software$4000.001$4000.00
Total $151,786.95
Table 3. RMS errors for various parameters obtained by the LI-Care system.
ParameterRMS Error%RMS Error
Temperature0.0298 °F0.159%
Systolic pressure0.613 bpm0.05%
Diastolic pressure0.022 bpm0.029%
Breathing rate0.00136 breaths/min0.059%
Heart rate0.0015 beats/min0.002%
Spo20.002%0.076%
ECG0.0395 mV0.015%
Table 4. Comparison of available techniques for IoT and LabVIEW-based health care system.
Parameters AnalyzedReferencePlatform UsedTechnique UsedCommunicationMaximum RMS ErrorPower ConsumptionRemarks
Heart rate, Bod temperature, Fall detection, SpO2[19]Data acquisition cardBiomedical sensors measure the parameters and view in LabVIEWWi-Fi, SerialNANALimited parameters and poor visual presentation.
Heart rate, Blood pressure, Body temperature[20]NI-myRIO, ESP 8266Biomedical sensors measure the parameters and view in LabVIEW and LCDWi-FiNANAESP 8266 module has a compatible issue due to a single Analog port.
Respiration rate, Heart rate, Body temperature[25]NI-myRIOBiomedical sensors measure the parameters and view in LabVIEW and android applicationWi-FiNANALimited to pregnant women.
Limited visual representation.
ECG[26]NI-myRIOMachine LearningWires Serial portNANAOnly for ECG
Heart Rate, Blood pressure, ECG, Body temperature, SpO2, live videoProposed systemNI-myRIOBiomedical sensors measure the parameters and view in LabVIEWWi-Fi, Ethernet.0.159%1 watt/h
Publisher’s Note: MDPI stays neutral with regard to jurisdictional claims in published maps and institutional affiliations.

