Article

Multi-Monostatic Interferometric Radar for Bridge Monitoring

by
Lapo Miccinesi
,
Alessandra Beni
and
Massimiliano Pieraccini
*
Department of Information Engineering, University of Florence, Via Santa Marta 3, 50139 Firenze, Italy
*
Author to whom correspondence should be addressed.
Electronics 2021, 10(3), 247; https://doi.org/10.3390/electronics10030247
Submission received: 14 December 2020 / Revised: 10 January 2021 / Accepted: 19 January 2021 / Published: 22 January 2021
(This article belongs to the Section Microwave and Wireless Communications)

Abstract

:
In recent years, interferometric radar has been extensively used as a sensor for static and dynamic monitoring of bridges. Generally speaking, a radar can only detect displacement components along the view direction. As the movement of a real bridge or of a large structure can be rather complex, this limitation can be a significant drawback in engineering practice. In order to overcome this limitation, in this article, a multi-monostatic radar for retrieving the displacement vector is proposed. It is basically a multiple input, multiple output (MIMO) interferometric radar, equipped with a transponder that consists of a pair of antennae, with relative amplifiers, connected to the radar with a radiofrequency (RF) cable. This arrangement allows for the simultaneous detection of two independent displacement components. The radar was successfully tested both in a controlled environment and in the field on a real bridge crossing the Arno river in Florence, Italy.

1. Introduction

In recent years, bridge monitoring by terrestrial interferometric radar has become a relatively popular technique [1,2,3,4,5]. In a typical installation, the radar is positioned under the deck and detects the displacement of the scatter points of the bridge that it is imaging. The displacement is retrieved by radar interferometry: a well-known technique used in different contexts [6,7].
Since a radar can only detect displacement components along the range direction, the effective movement is retrieved by supposing the displacement in the vertical direction. This assumption is often reasonable, but is potentially incorrect when the detected scatter point is far from the so-called “neutral axis” of the bridge. Figure 1 shows pictorially how the effective displacement can have a vectorial direction that differs considerably from the vertical one.
Indeed, Dei et al. [8] experimentally showed how the detection of a single component can be misleading. Recently, several authors proposed radar techniques for detecting two or three components. Monti-Guarnieri et al. [9] operated two radars simultaneously to detect the displacement vector of corner reflectors fixed to a pipe. The recent introduction of multiple input, multiple output (MIMO) for spaceborne radar [10], for ground-based radar [11,12,13], and in biomedical contexts [14] has prompted the creation of new solutions.
Deng et al. [15] deployed three ground-based multiple input, multiple output (GB-MIMO) radar systems to measure 3-D deformation of a movable corner reflector. Both these approaches have evident drawbacks in terms of the cost and complexity of the installation. Pieraccini et al. [16,17,18] proposed a radar technique that uses a transponder in a bistatic configuration for detecting a further component of the displacement of a corner reflector. However, this approach can have two possible problems: (1) the bistatic image can differ notably from the monostatic image (so it can be difficult to recognize the same physical targets in the two images); (2) the bistatic angle is half of the angle between radar and transponder, which can lead to geometric configurations that are not deployable in the field. Indeed, just these limitations have prompted the development reported in this article.
Therefore, this article proposes a further radar technique for detecting two components using single radar equipment. The basic idea is depicted in Figure 2. A multiple input, multiple output (MIMO) interferometric radar is equipped with a transponder that consists of a pair of antennae, with relative amplifiers, connected to the radar with a radiofrequency (RF) cable. The radar detects one component and the transponder detects a second independent component. The novelty of this approach lies both in using a MIMO for imaging and in obtaining two monostatic acquisitions from different points of view.

2. Materials and Methods

2.1. Methods

Figure 3 shows the block scheme of the radar. It operates a continuous-wave frequency-modulation (CW-FM). The radar has two transmitting (TX) channels and two receiving (RX) channels, but it transmits in a single channel and receives in a single channel at one time, so during each single acquisition it operates as a single input single output (SISO) modality. Nevertheless, the time between four acquisitions (2 × 2) is short (from 5 ms to 12 ms depending on the setup), so in the context of the structural monitoring they can be considered simultaneous. For this reason, we use the term MIMO for this radar.
The amplitude of the Fourier Transform of the echo shows the position of targets, while the phase can be used for retrieving the movement of the targets. The displacement is detected by measuring the phase difference, Δ ϕ , of the same target between two measurements:
Δ R = λ 4 π Δ ϕ ,
with Δ R , the projection of displacement along the Radar-Target direction, and λ the wavelength of the central frequency.
Each channel of the MIMO radar in Figure 4 can measure the displacement of the same target independently. By using a suitable baseline (the distance between the pairs of antennae), it is possible to retrieve two components of the displacement vector. Figure 4 shows an example of the geometry of the proposed method. The pairs of antennae are in R 1 and R 2 and the target is in R 0 .
Each pair of antennae measures the component of displacement along the unit vectors that can be estimated by the positions of the two pairs of antennae ( R 1 and R 2 ) and the position of the target in the x-y plane using the following equation:
u ^ i = R i R 0 | R i R 0 |
The displacements Δ R 1 and Δ R 2 along u ^ 1 and u ^ 2 are given by
( Δ R 1 Δ R 2 ) = ( e ^ i · u ^ 1 e ^ 2 · u ^ 1 e ^ 1 · u ^ 2 e ^ 2 · u ^ 2 ) ( Δ x Δ y ) = M   Δ s
where e ^ 1 is the unit vector along the x-direction of the Cartesian reference system, e ^ 2 is the unit vector along the y-direction of the Cartesian reference system, and Δ x ,   Δ y are the Cartesian components of the displacement Δ s . Therefore, the displacement vector can be estimated as follows:
Δ s = M 1 ( Δ R 1 Δ R 2 )
The main advantages of this method with respect to the other ones (monostatic, using two radars, and bistatic) are: (1) the two components are sampled by the same equipment without problems of synchronization, resampling, and phase matching; (2) the baseline is the effective distance between the pairs of antennae.

2.2. Radar Equipment

The radar used is a modified version of IBIS-FM MIMO by IDS Company l [12]. Figure 5 shows IBIS-FM MIMO with the four antennae connected. The IBIS-FM MIMO provides a continuous-wave frequency-modulation (CW-FM) signal with f c = 17.2   GHz , B max = 400   MHz . The radar has two TX channels and two RX channels that are acquired sequentially. The acquisition frequency depends on the radar parameters (unambiguous range, range resolution, etc.). All of the considerations and equations in Section 2.1 are also valid for a CW-FM radar.
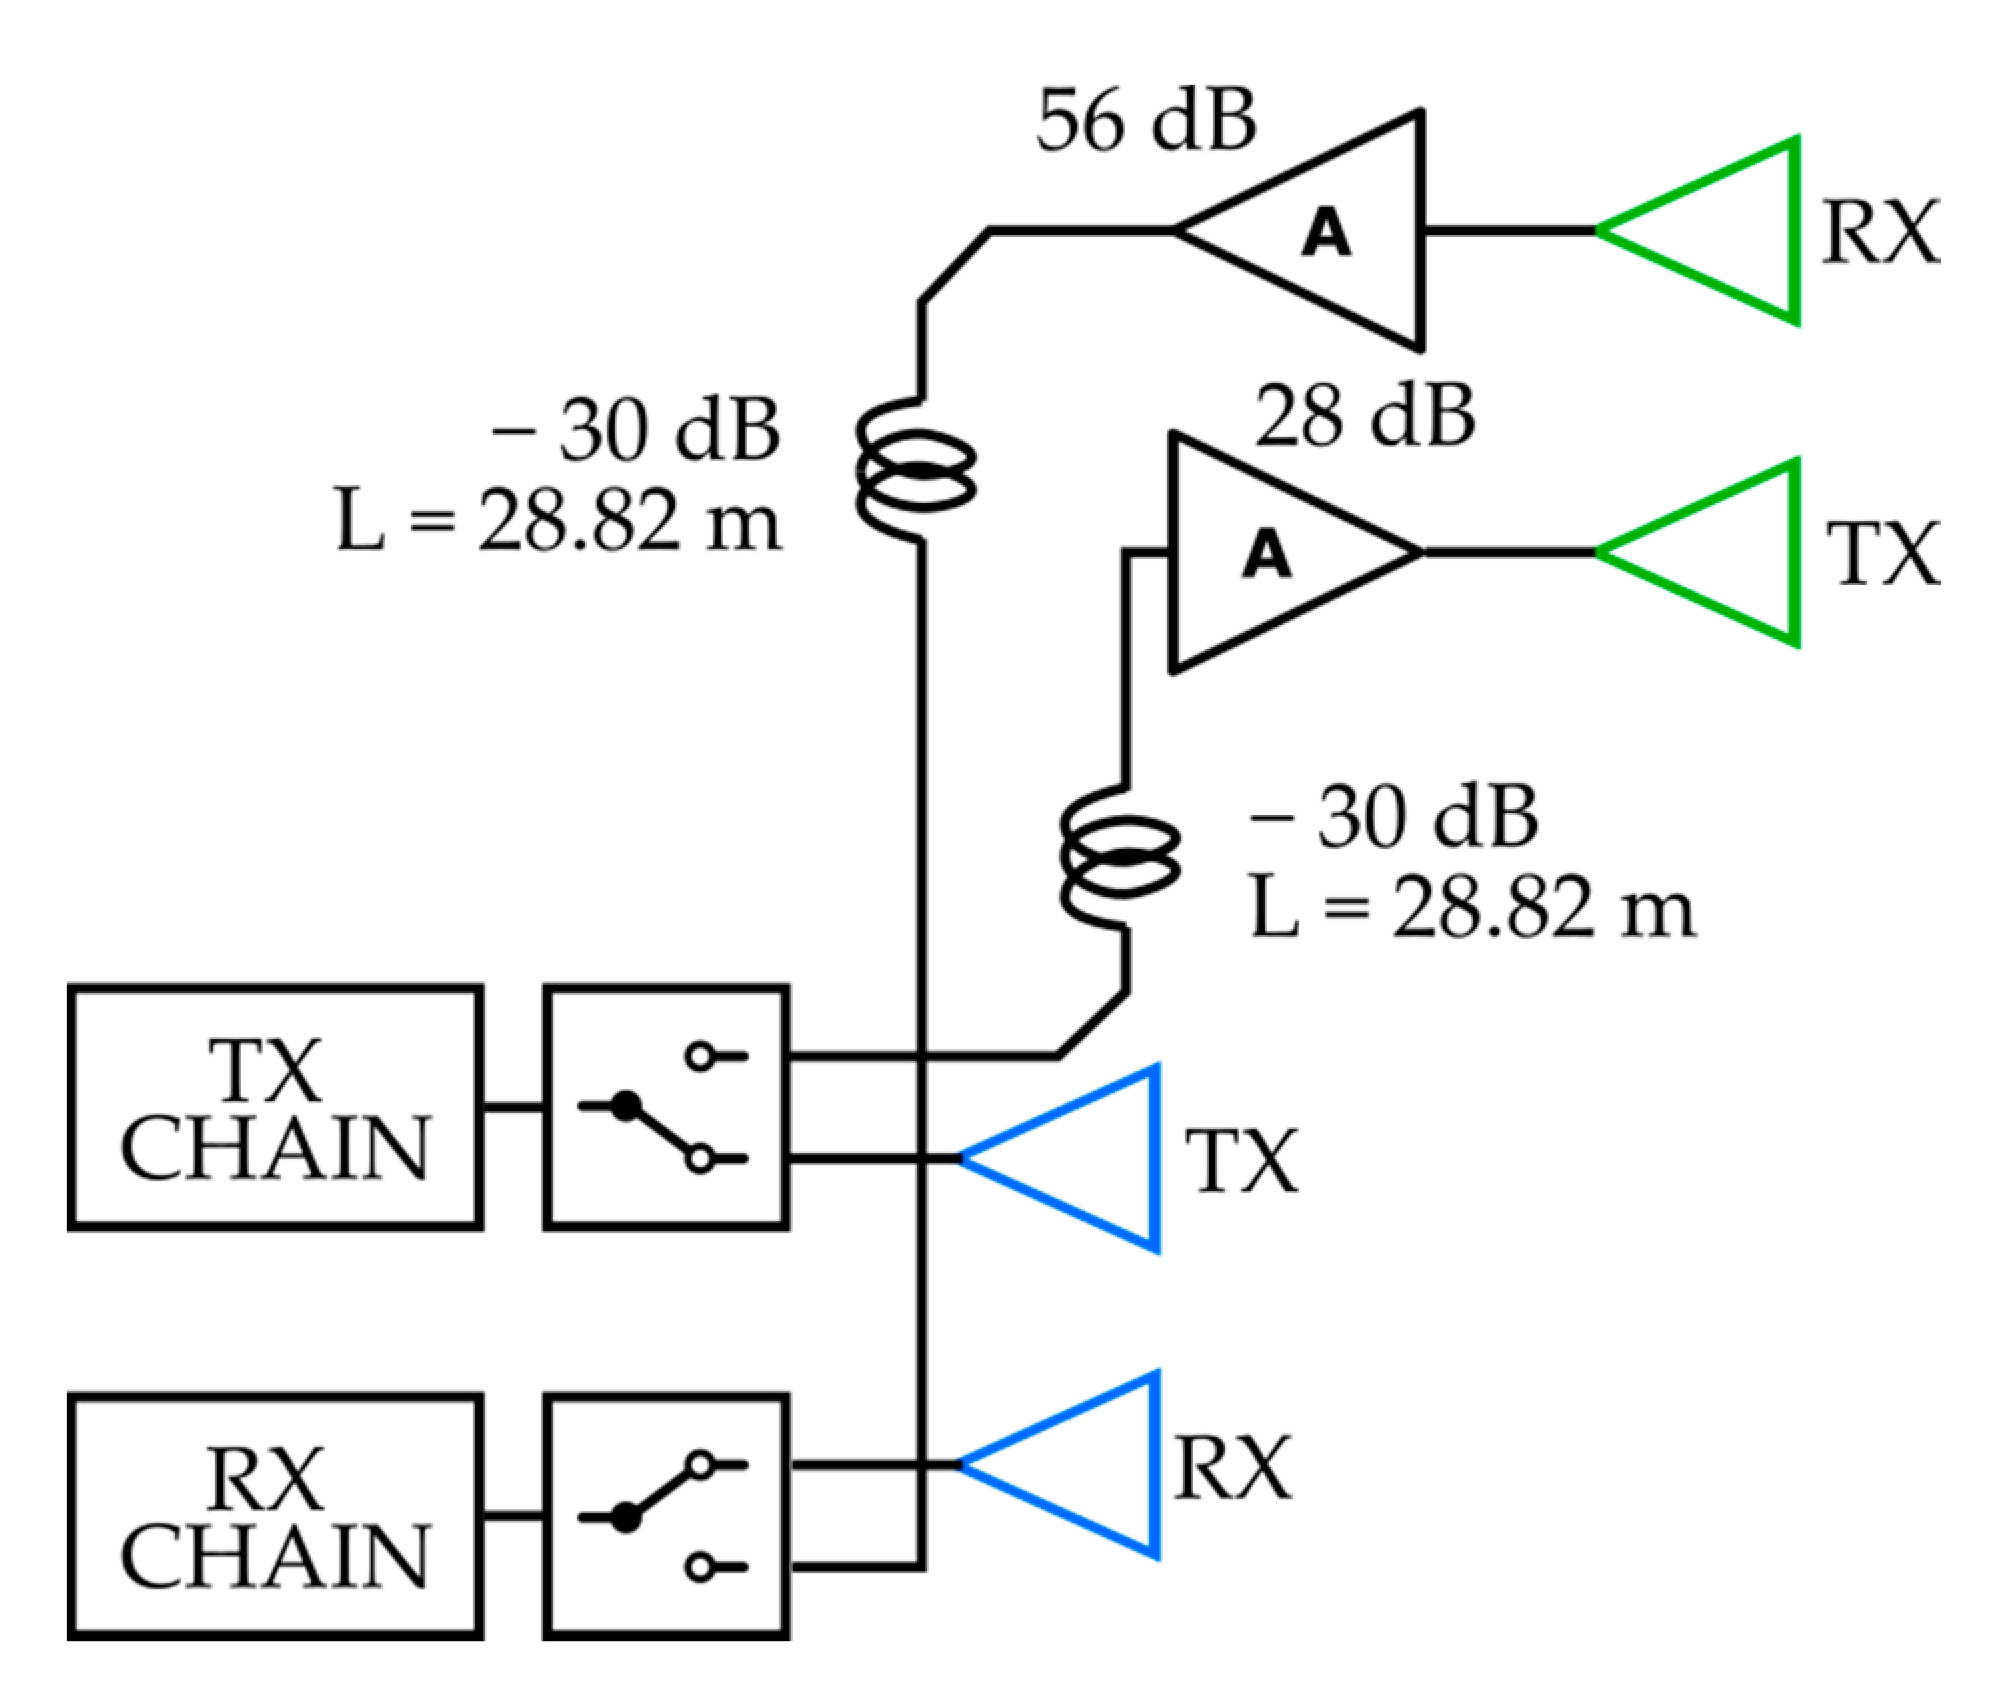
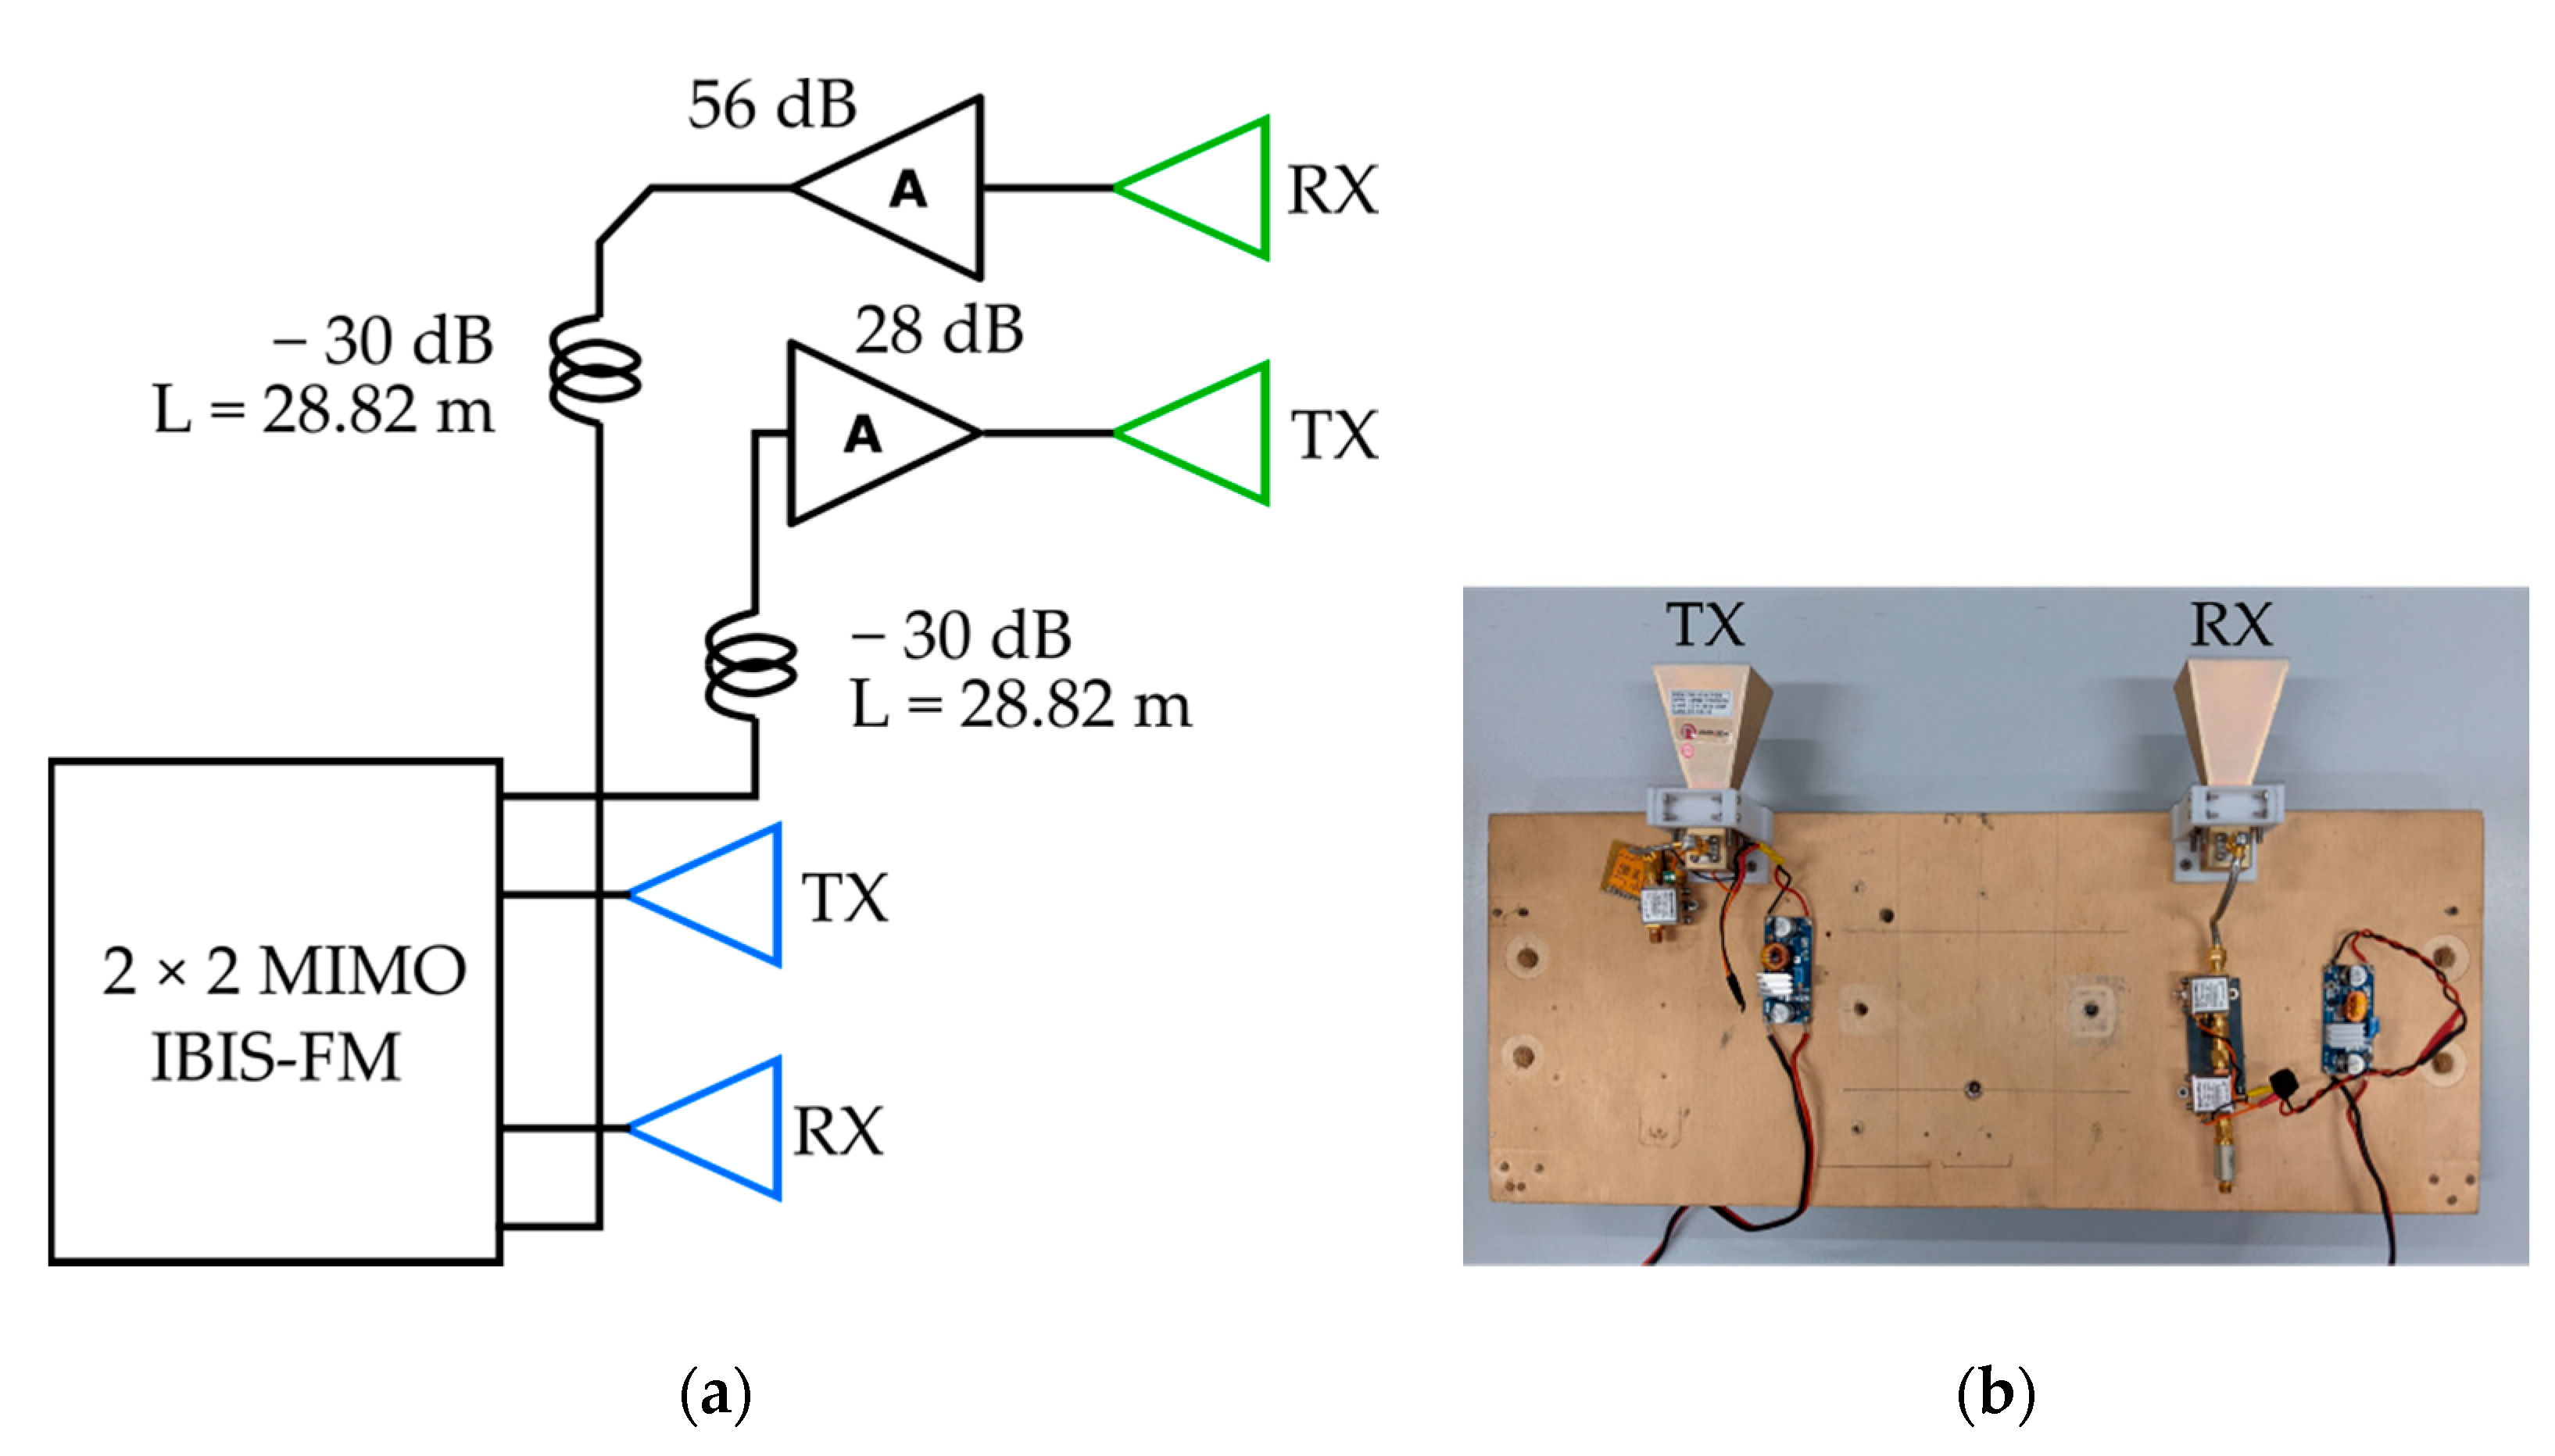
Figure 6a shows the block scheme of the modified radar. The green antennae were connected to the upper channel of the radar through RF cables, 25 m in length (28.82 m equivalent length) and −30 dB attenuation. As two low noise amplifiers (LNA) (28 dB gain in transmission and 50 dB in reception) compensate the cable attenuation, the only effect of these cables on the measurement is a time shift of the radar plot, which has to be taken into account for identifying the targets. The second pair of antennae and amplifiers is shown in the picture in Figure 6b. The second pair of antennae was powered by two 12 V batteries. It should be noted that although this MIMO radar could provide four different measurements, only two measurements are effectively used in this application.

3. Results

3.1. Experimental Results in Controlled Environment

The accuracy and the repeatability of the interferometric radar, used for detecting one single component of the displacement, was already verified by one of the authors during an in-field monitoring of a bridge [19]. Therefore, the aim of the experimental measurements in a controlled environment, reported below in this article, is a test of the capability to retrieve both the displacement vector and the effective value of the vibration frequency.
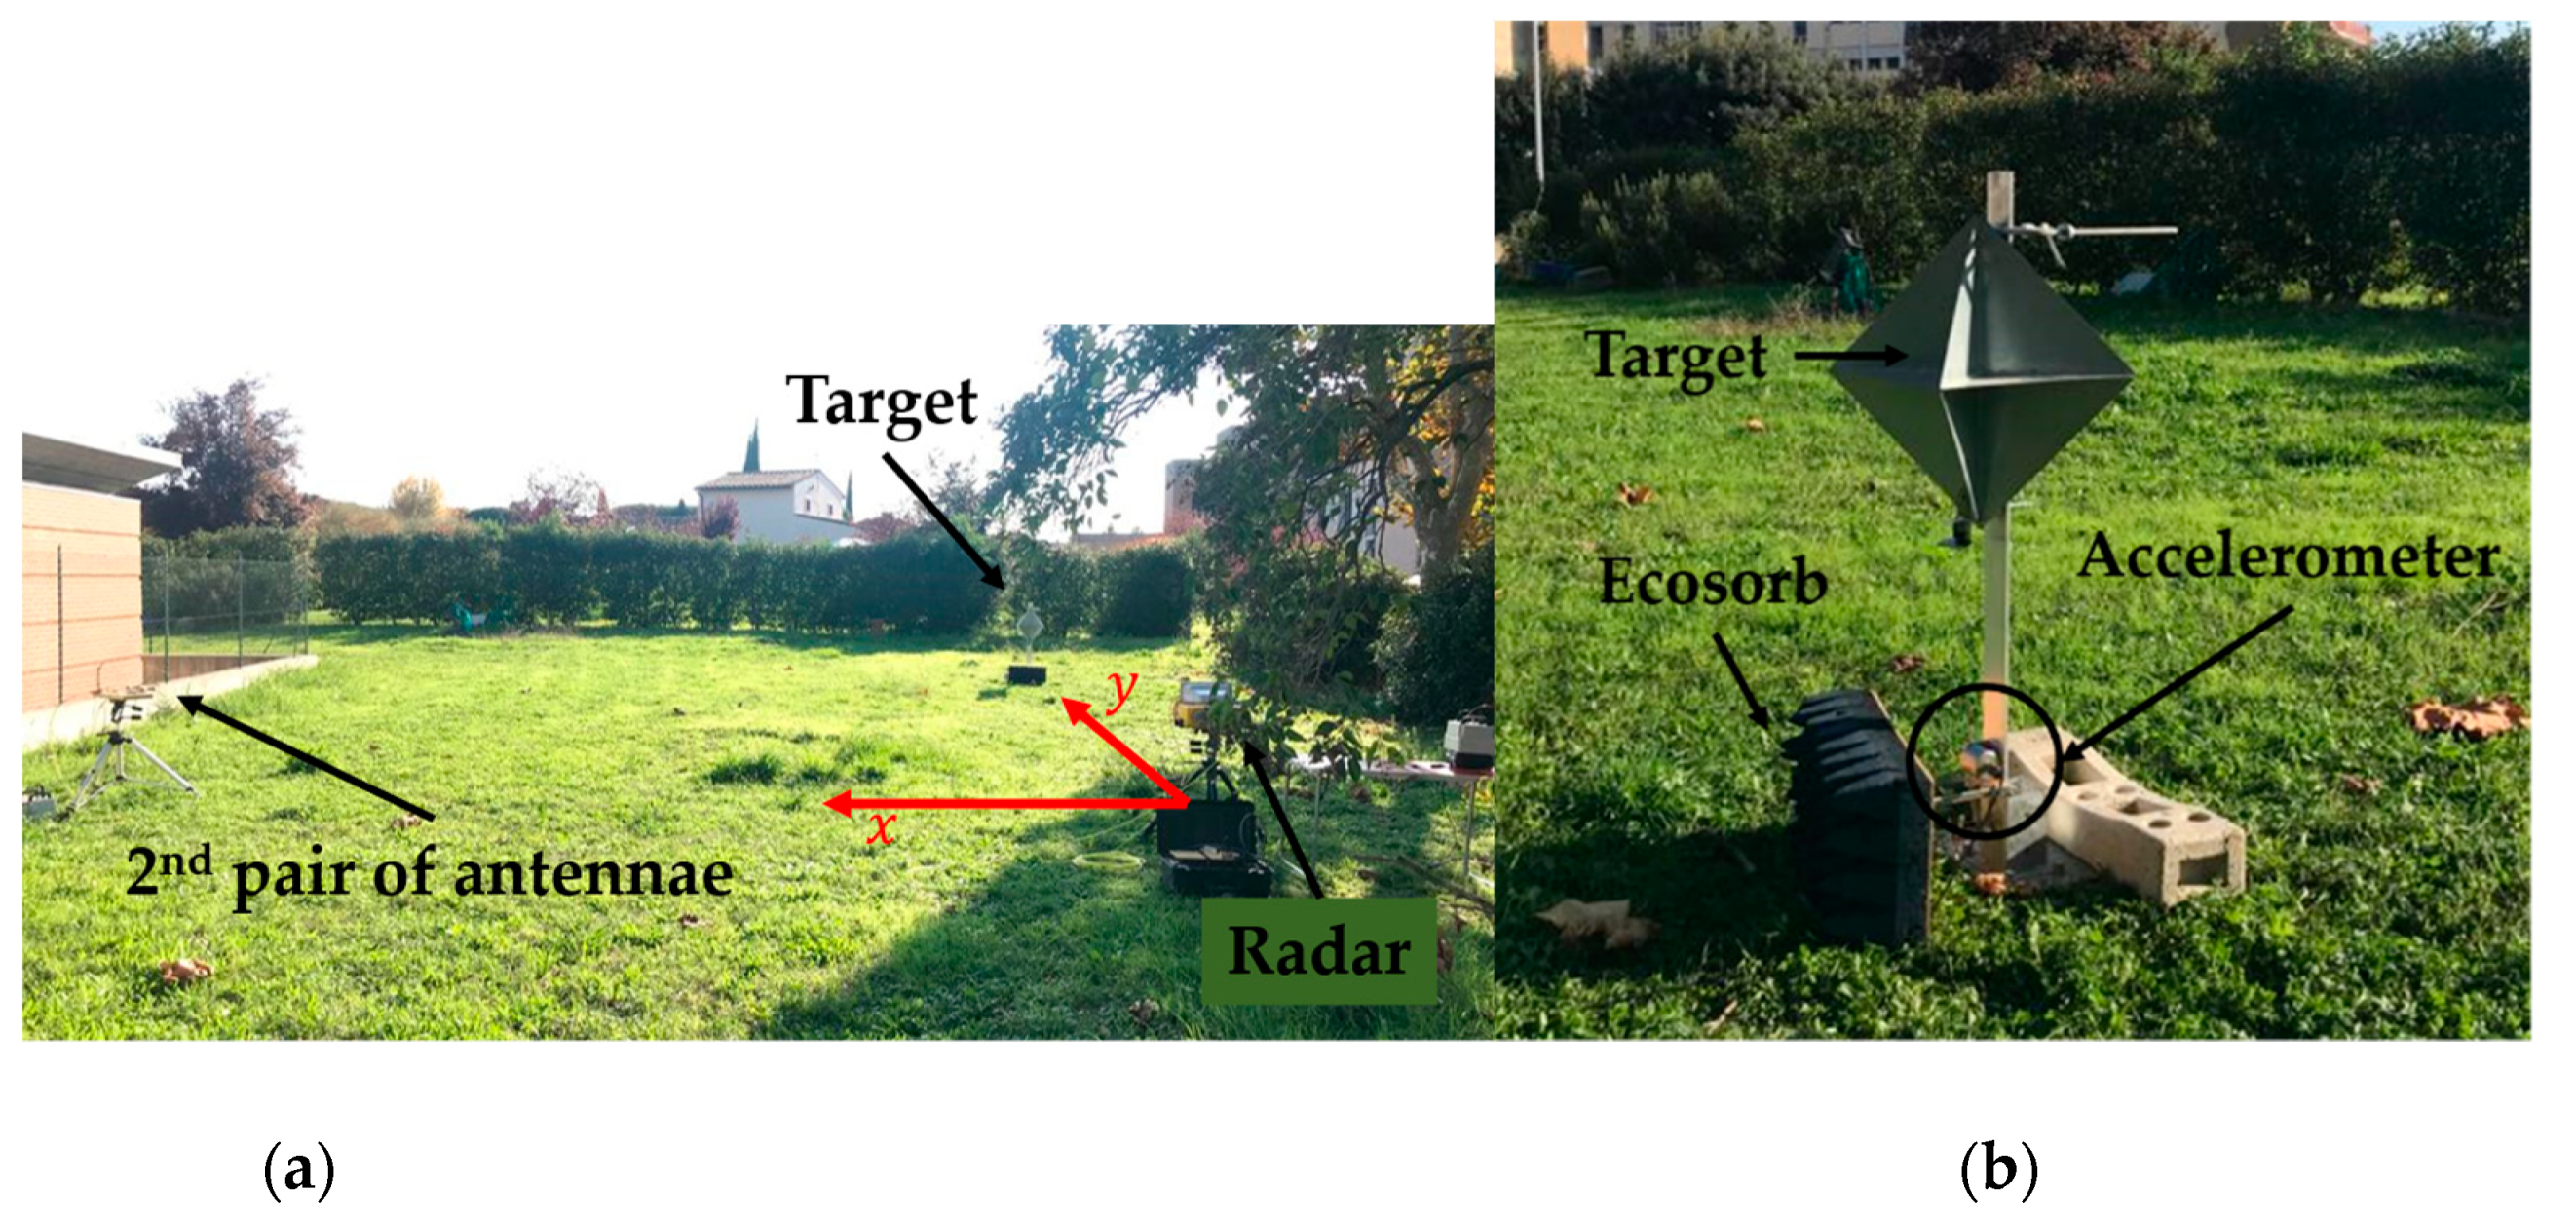
The radar and the method were tested in a controlled environment. The radar was located in front of an oscillating target as shown in Figure 7a. The other pair of antennae was positioned on the left of the radar. The line between the radar and target defines the y-axis while the line between the radar and the second pair of antennae defines the x-axis.
The target was a naval corner reflector fixed on the top of a metallic bar. The metallic bar provided the periodic oscillation of the target. The bar was fixed to a basement, shielded by Ecosorb. The target is shown in Figure 7b.
The position of the radar, the second pair of antennae, and the target are reported in Table 1. The RF cables that connected the radar to the second pair of antennae were about 28.82 m equivalent length.
A seismic monoaxial accelerometer (PCB 393B31 by PCB piezotronics) was connected to the bar. The results of the radar and accelerometer were compared. The accelerometer axis was oriented along the y-direction.
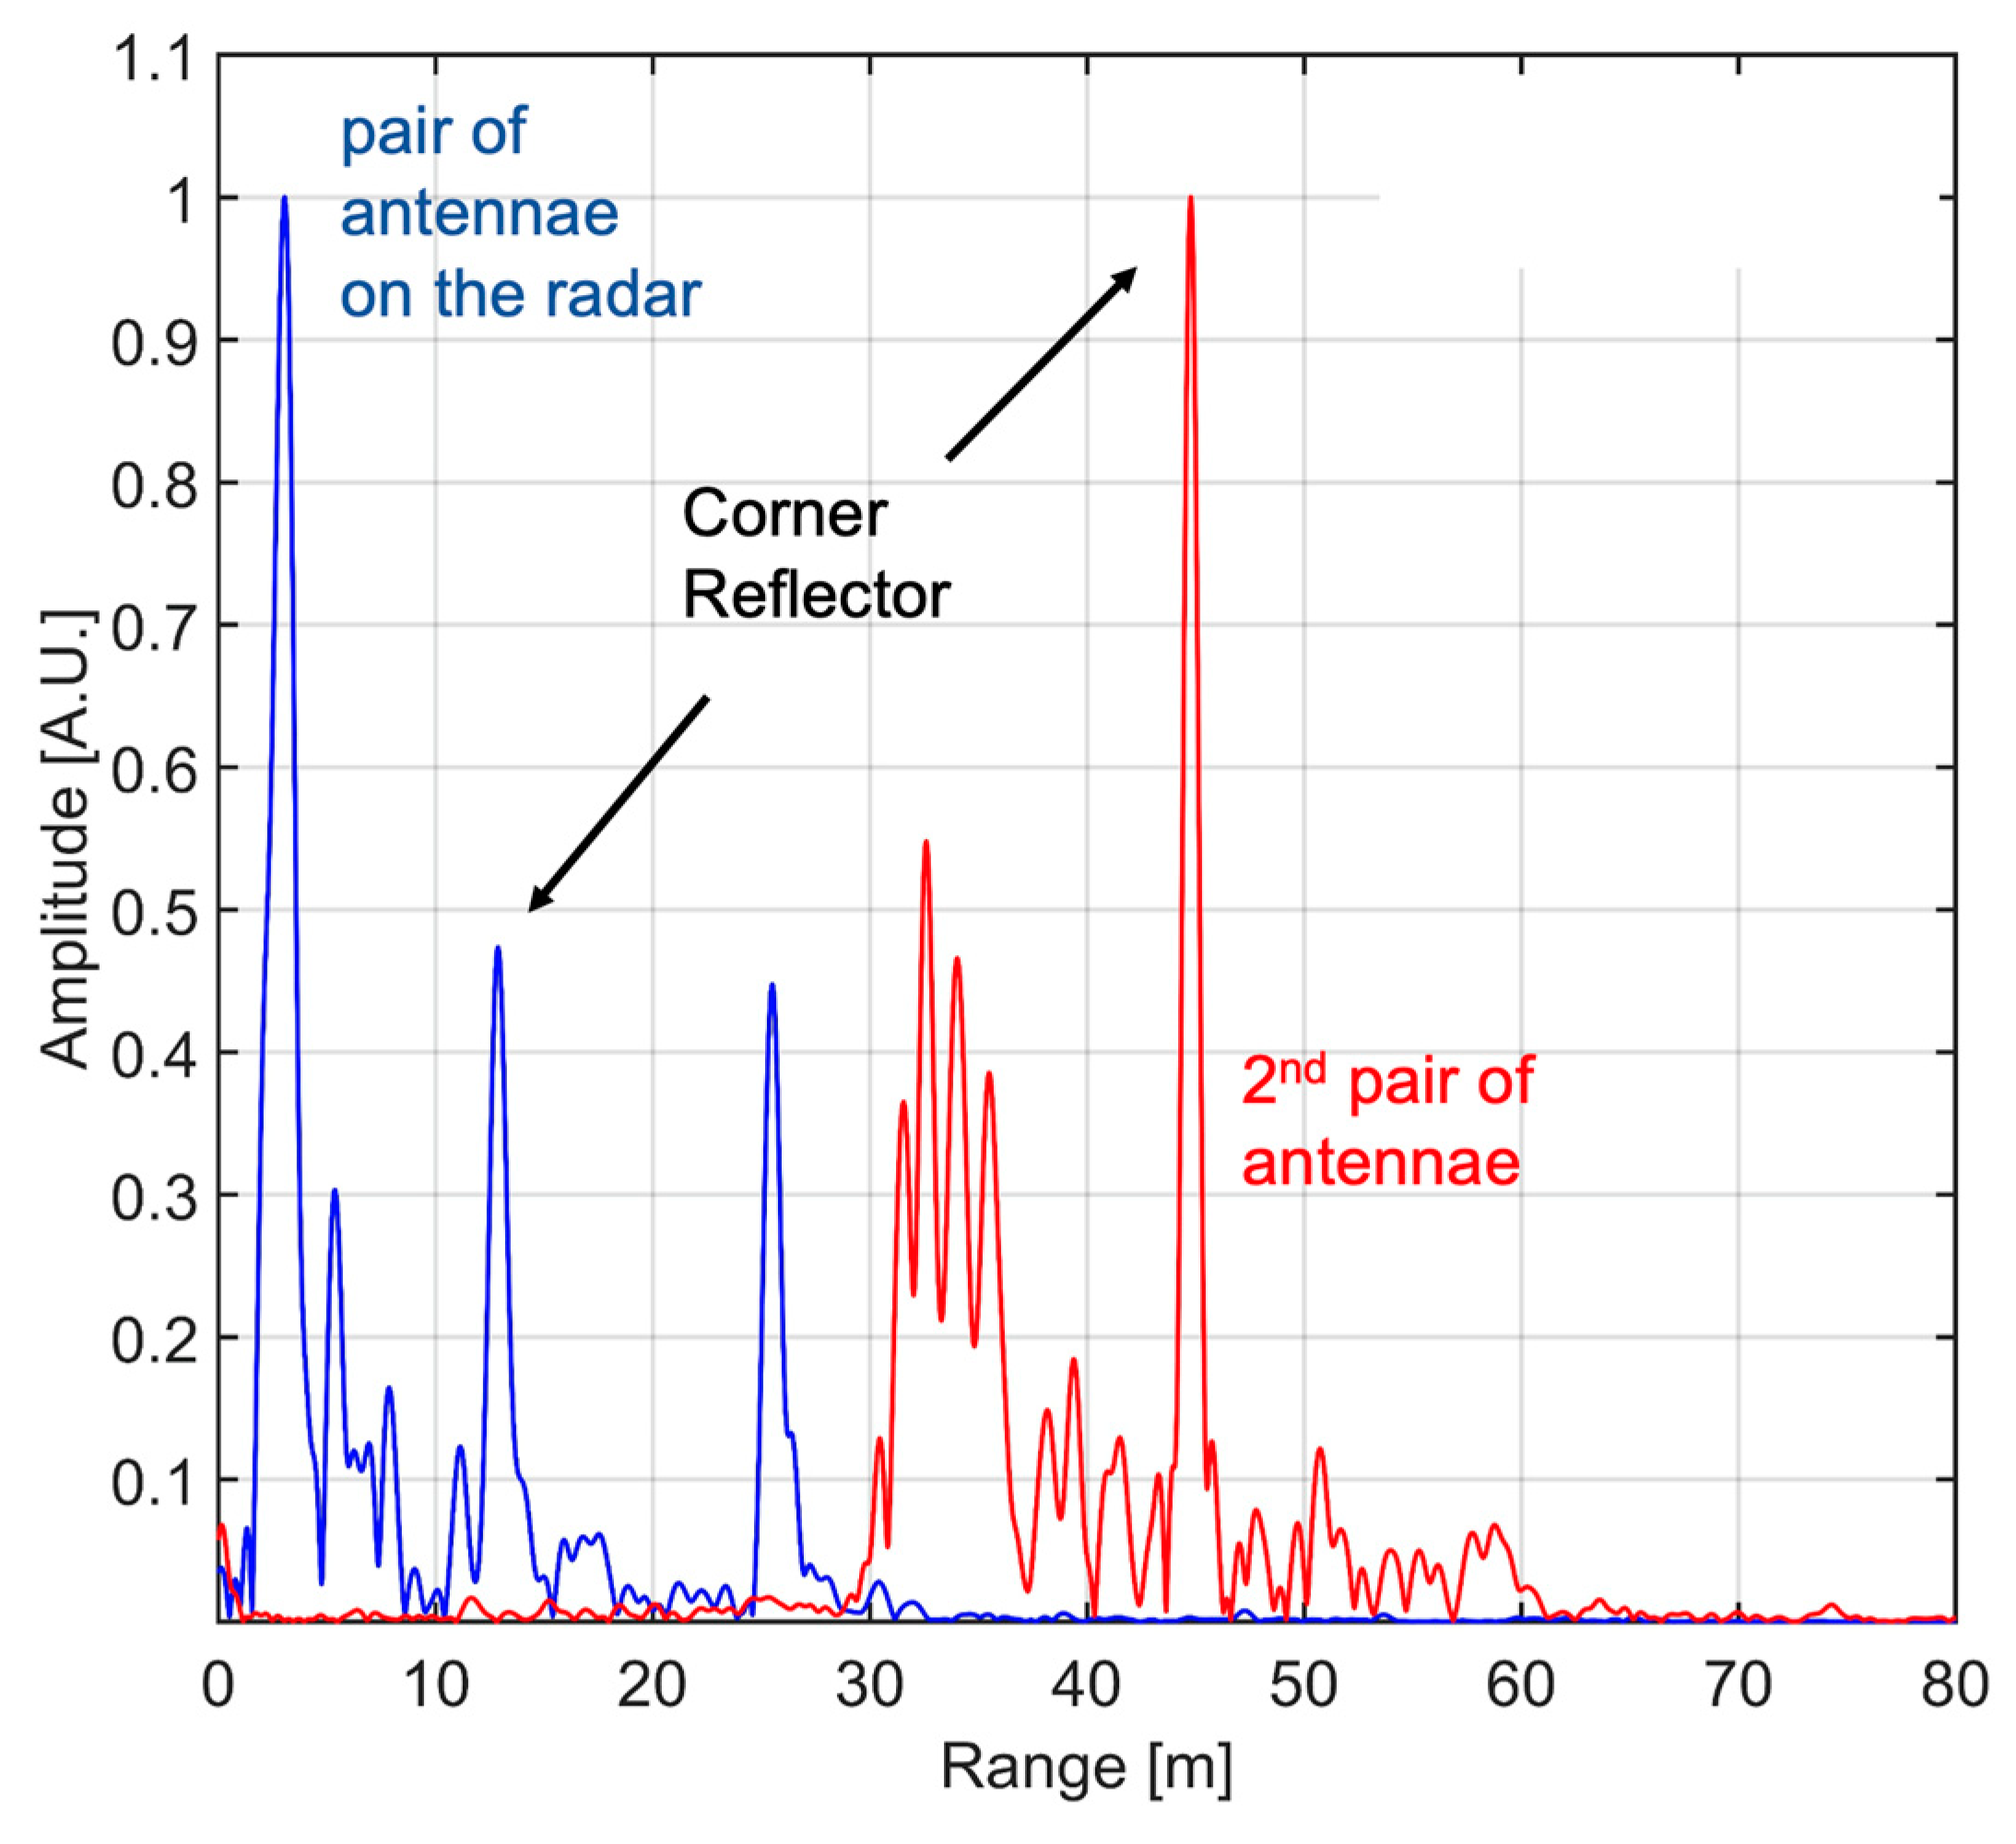
Figure 8 shows the radar plots acquired from the two groups of antennae. In the plot relative to the pair of antennae fixed to the radar case, the peak of the corner reflector appears at 12.88 m (in agreement with data reported in Table 1). In the other plot, the corner reflector appears at a different distance, which can be calculated as the summation of the equivalent length of the cable 28.82 m and the geometrical distance (14.82 m). The resulting distance is 43.64 m.
Figure 9a shows the displacement. The signal from the accelerometer (the light-blue dotted line) was double integrated and filtered between 0.1   Hz and 40   Hz . The red and green lines are the y- and x-components of displacement retrieved by radar using (4) and filtered between 0.1   Hz and 40   Hz .
Figure 9b shows the frequency spectrum obtained by calculating the Fourier transform at an interval of 33 seconds. One can note two main frequencies for the radar and one frequency for the accelerometer. The two distinct frequencies measured by radar may be due to a misalignment or to a physical x-component of the movement.
For this reason, we repeated the measurement by positioning the accelerometer along the x-direction. Figure 10 shows the results of this measurement. Undoubtedly, the x-component was a physical property of the target, even if a misalignment cannot be excluded. Table 2 reports the value of the natural frequency detected.

3.2. Experimental Results of a Bridge

An experimental campaign on a much larger structure was performed with the equipment. The structure under test was the carriageway under the Varlungo Bridge in Florence, Italy. This carriageway is made of steel and reinforced concrete. The carriageway is 127 m long and is supported by two pillars at each end. The span is also connected to the main bridge by steel stays, each measuring 20 m, as can be seen in Figure 11. The stimulus was the vehicular traffic; it was not possible to control or restrict the passage of vehicles.
Figure 11 shows the setup for this measurement. The main radar was installed close to the abutment of the right pillar, while the additional antennae were on the pillar. The radar was in the center of the span. Table 3 shows the position of the radar, of the second pair of antennae, and of the two targets considered for the analysis. The targets are also highlighted with red points in Figure 10. The targets were selected using the method described in [10,11].
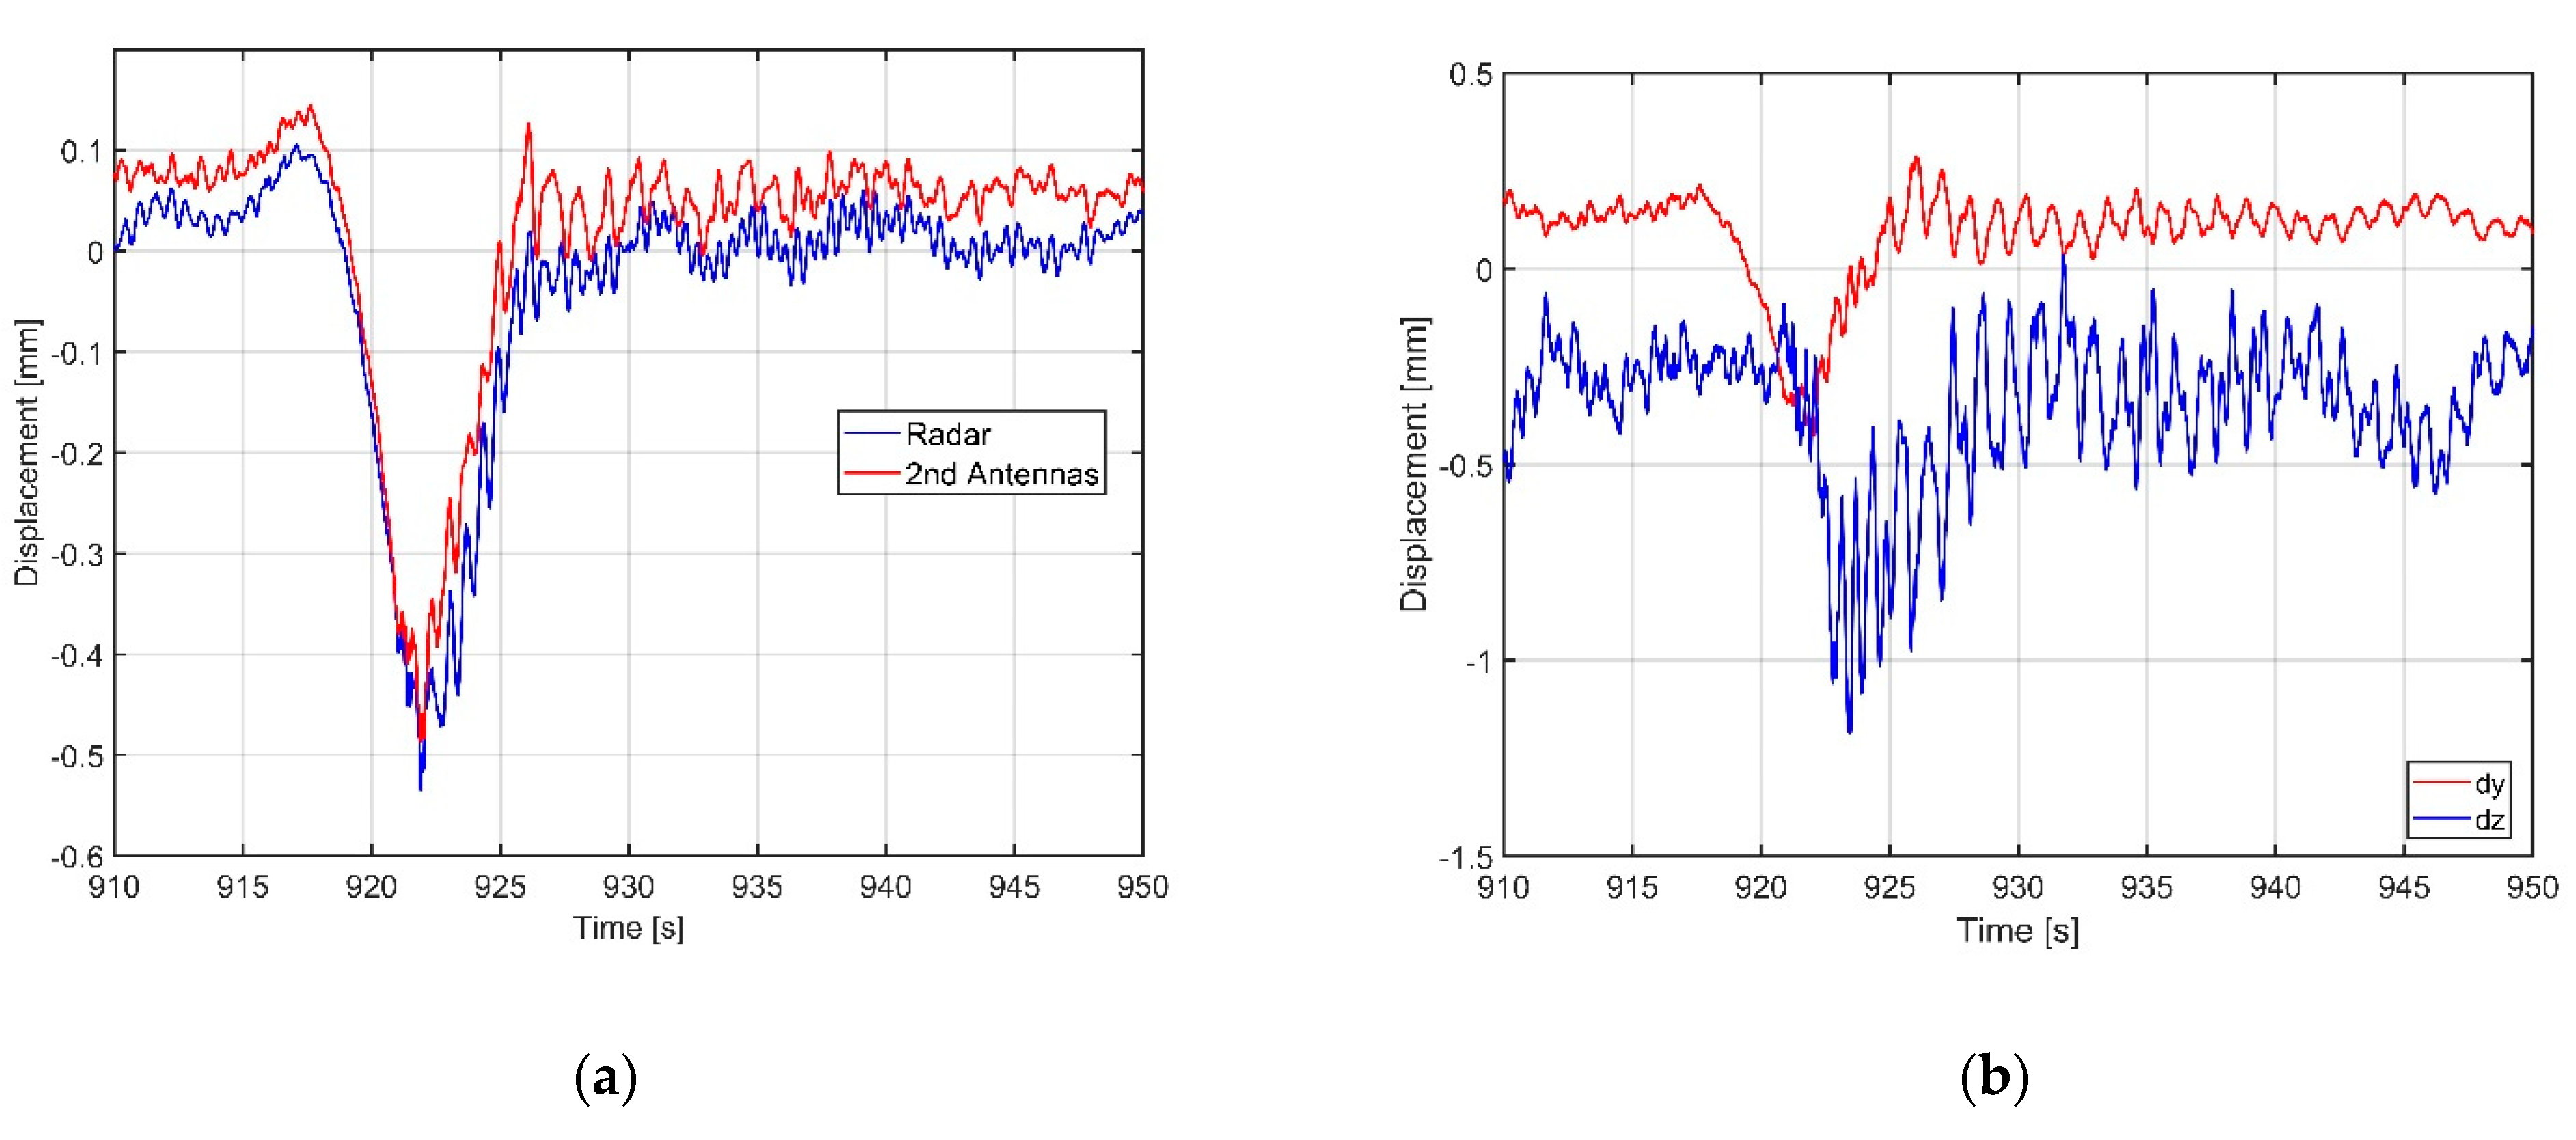
The displacement of the two targets was evaluated using (2) and the y- and z-components were retrieved using (4). The duration of the whole measurement was about 20 minutes. For the analysis, we considered an impulsive stimulus due to a heavy truck, registered within the time interval T imp = [ 910   s ,   950   s ] .
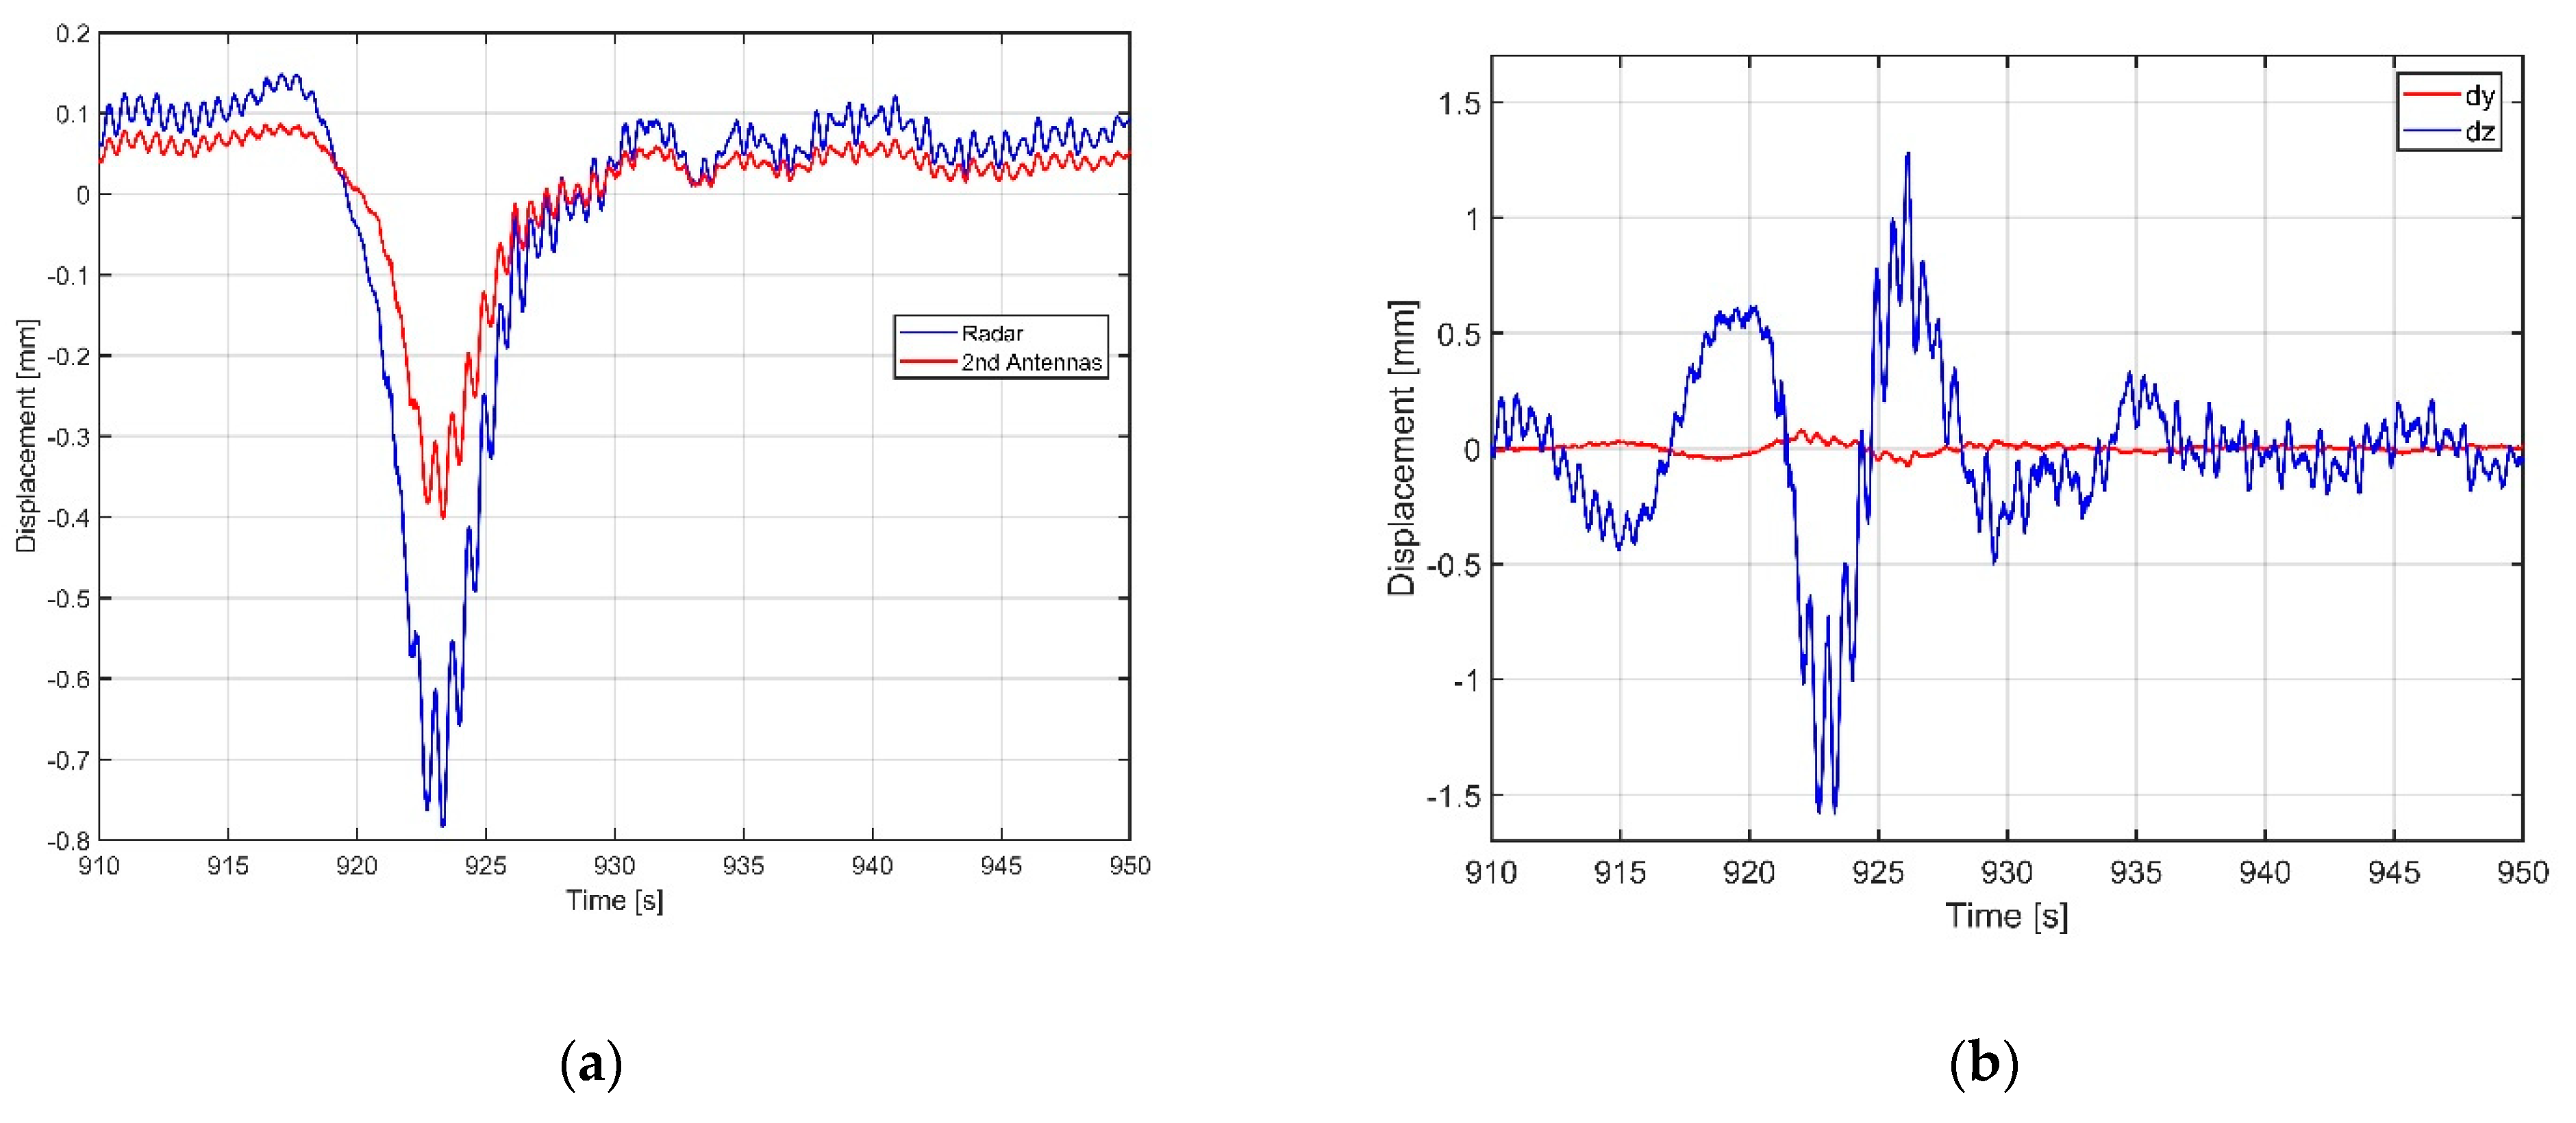
The displacement of each target, within the time interval T imp , is visible in Figure 12a for Target A and Figure 13a for Target B. The y- and z-components, retrieved using (4), are shown in Figure 12b and Figure 13b. The truck approached the bridge from Target B, moving towards Target A.
Target A has components along the y- and z-axis. The y-component anticipates the z-component. Most of the Target B component is along the z-axis.
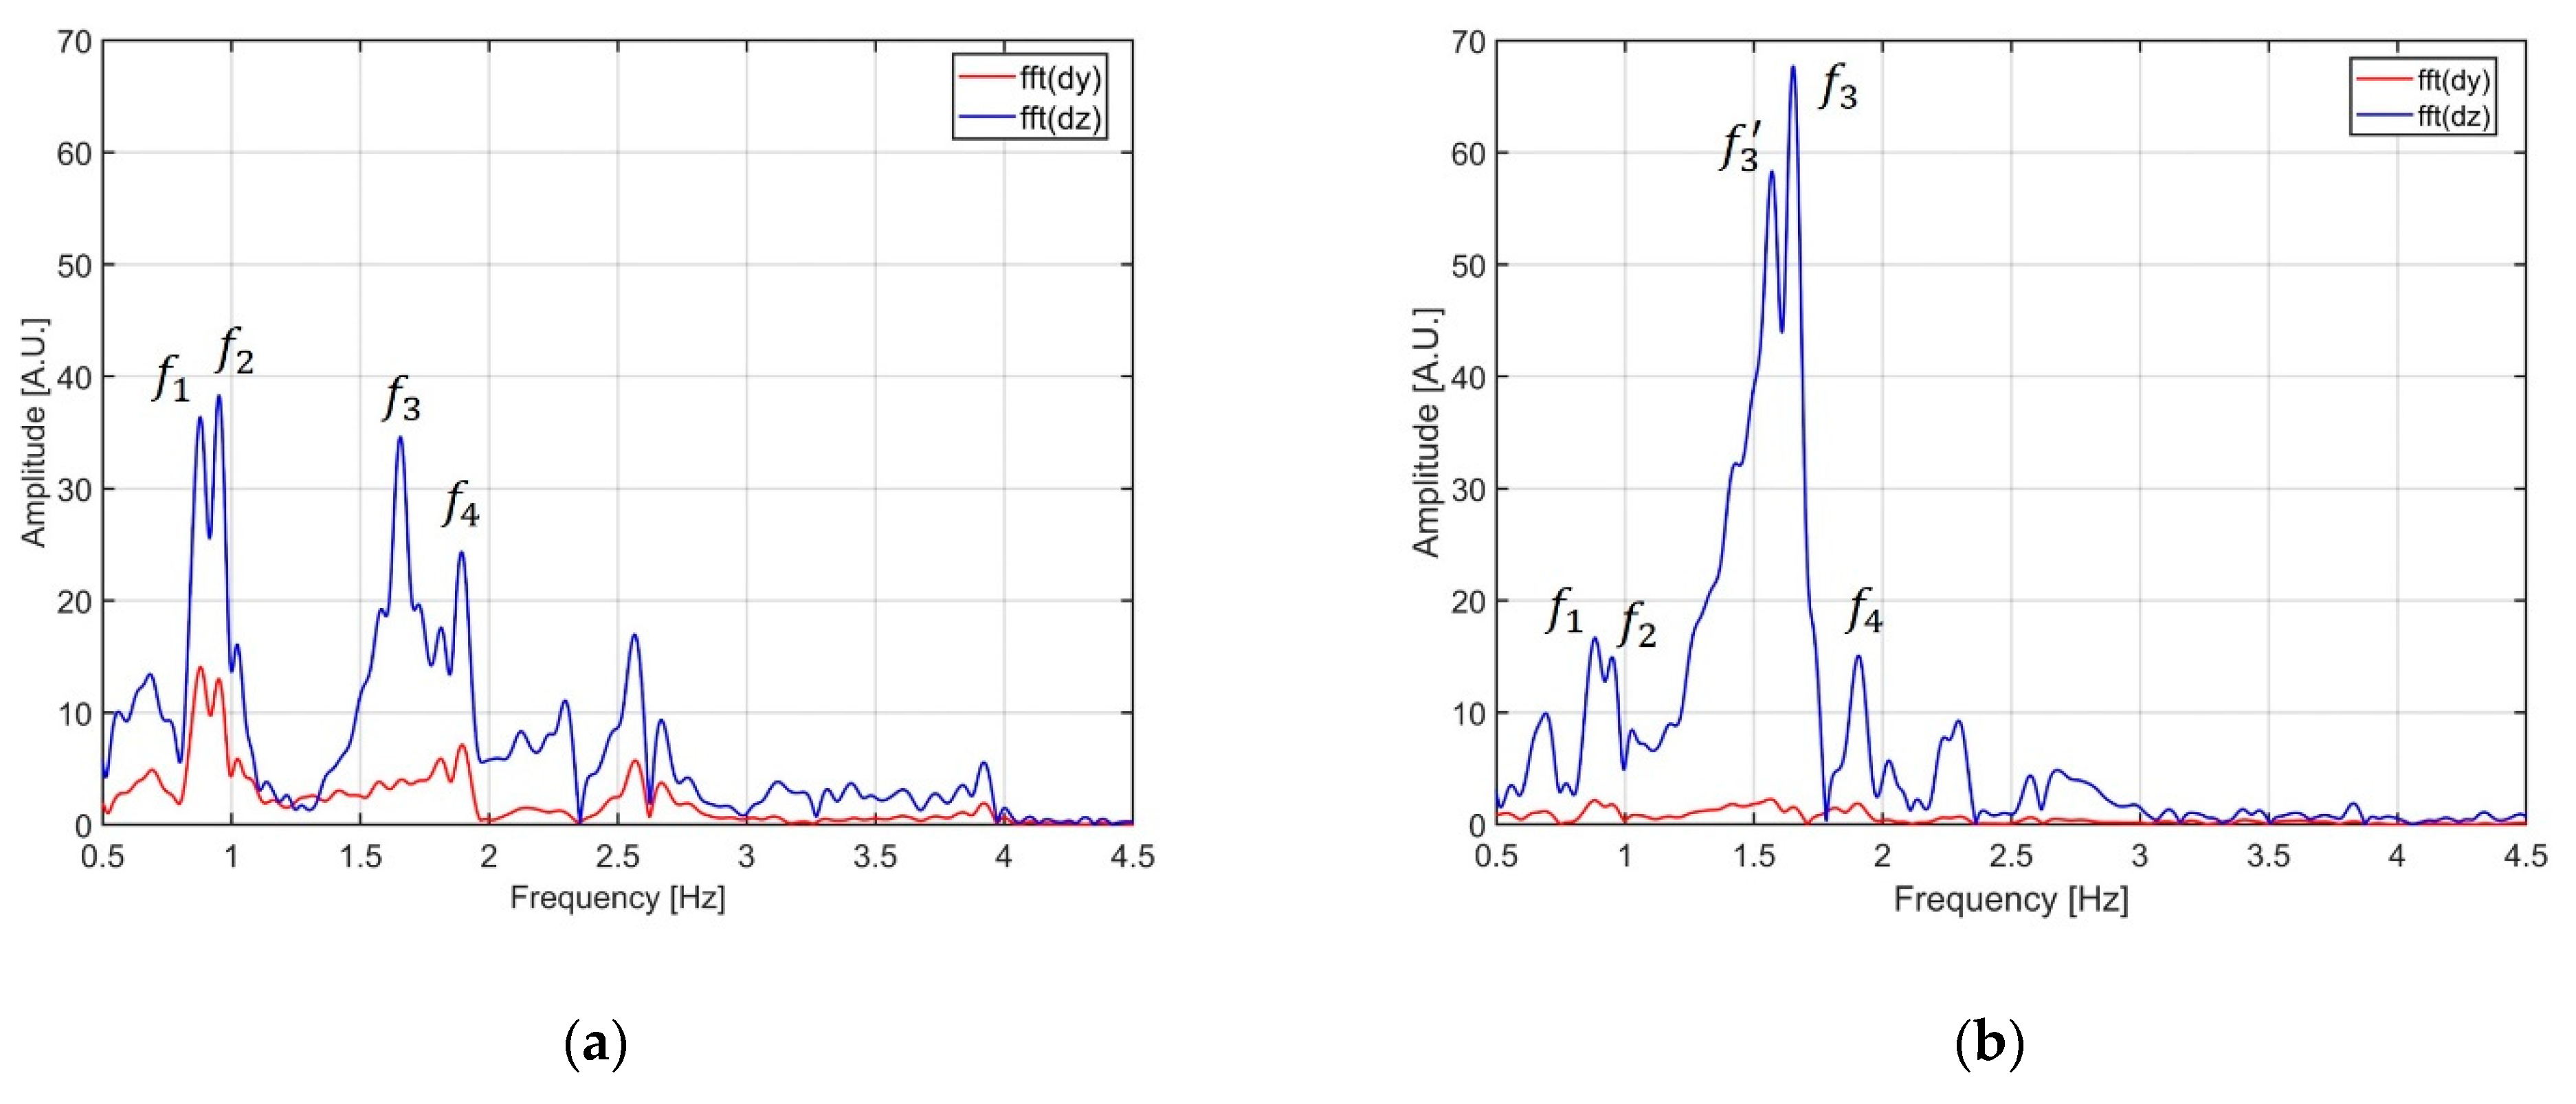
As further verification, the natural frequency spectra were compared for both targets. The natural frequency spectra were retrieved by calculating the Fourier Transform of the y- and z-components of displacements within T imp .
A Kaiser window with β = 3 was also applied to the data to lower the side lobes. The signals were also filtered with a 0.1–40 Hz bandpass filter for cutting off possible drift and high frequency noise.
Figure 14 shows the resulting spectra for Target A (a) and for Target B (b). In the first case, we can single out four frequencies, specified in Figure 13a as f 1 , f 2 , f 3 , f 4 . As for Target B, the spectrum displays several peaks, but only two frequencies, f 3 , f 3 , were clearly detectable. The values of the frequencies are listed in Table 4.
It is worth noting the good correspondence of frequencies f 1 ,   f 2 ,   f 3 ,   f 4 in the spectrum. The peak of frequency f 3 is detectable only for Target B.
The differences between the two spectra can be explained by the steel stays after Target B. However, the bridge is still under study and a discussion of modal analysis will be the topic of future publications. This paper is only reporting the analysis performed for validating and for measuring the performances of the radar.
The frequencies f 1 ,   f 2 are related to the displacement component along the y-z axis. Indeed, the frequency peaks are visible both in z and y spectra, particularly for Target A. The frequency f 3 (and f 3 ) is related to the movement along the z-axis.
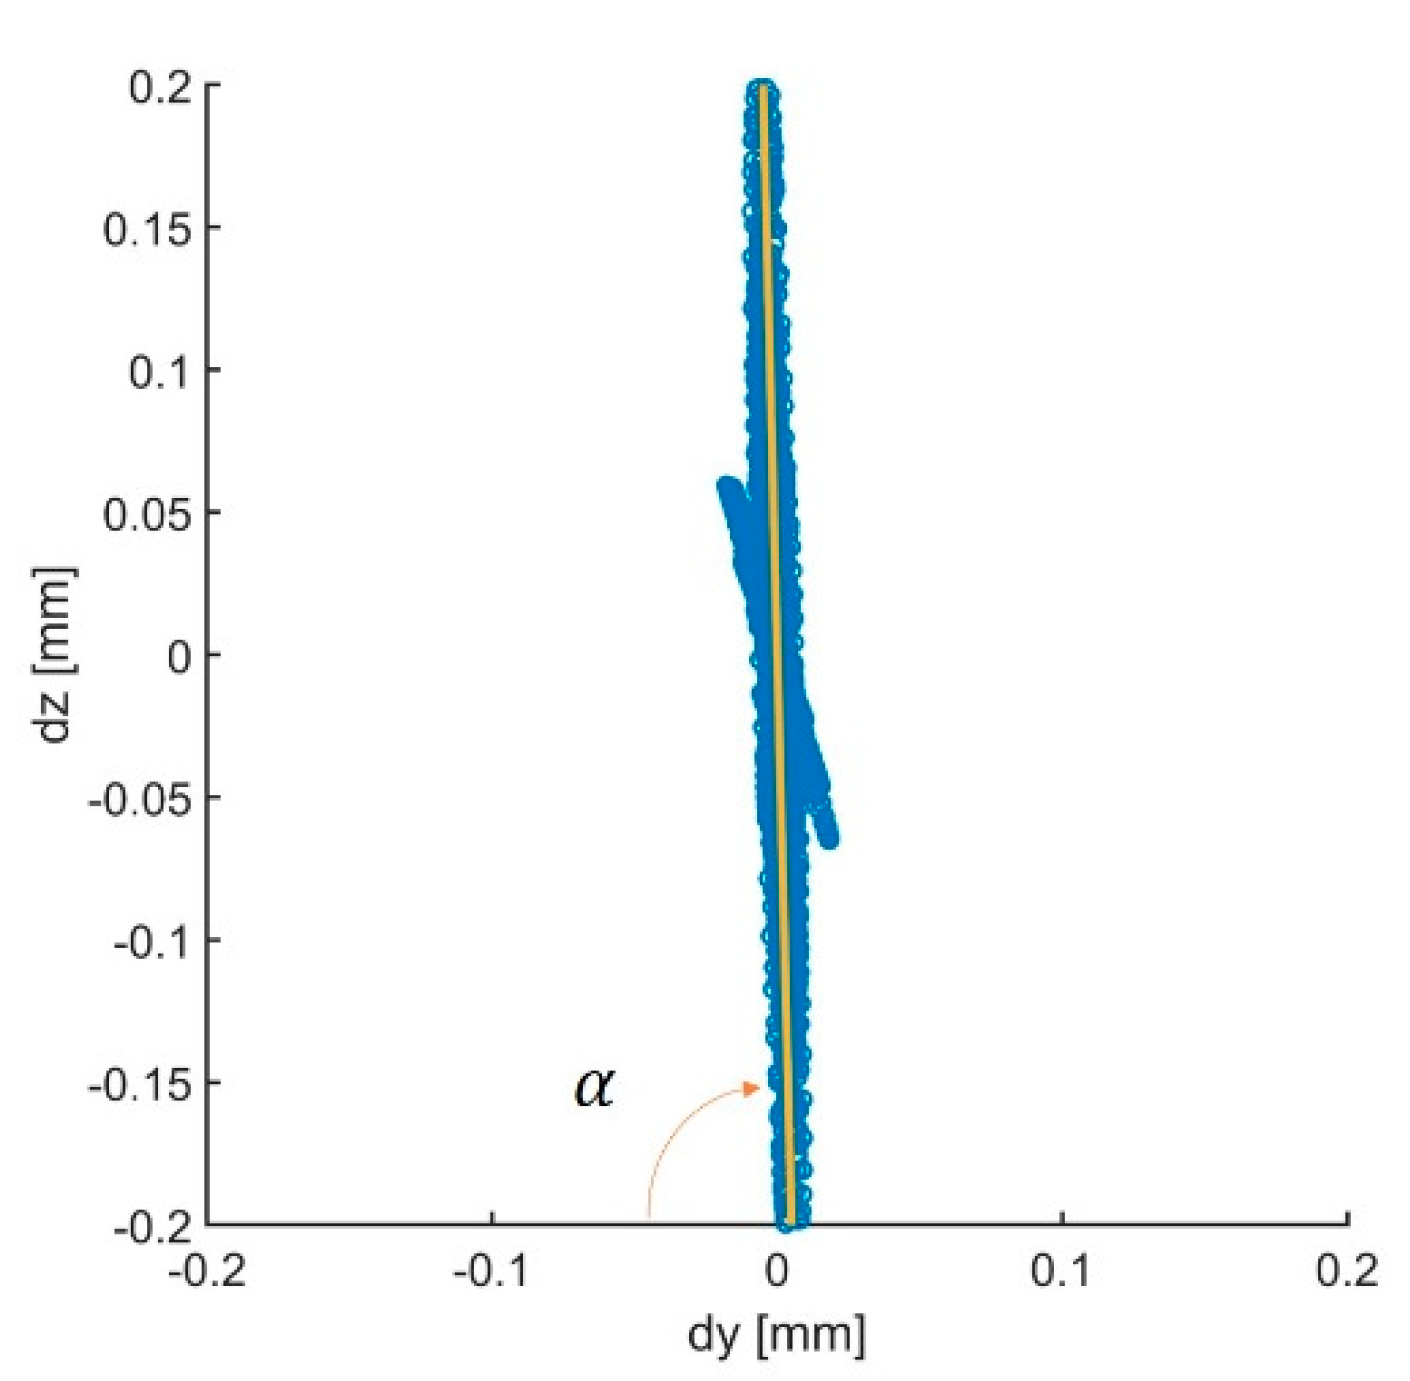
In order to determine the preferential direction of the displacement, the whole measurement was visualized as a scatter plot in the y-z plane (Figure 15 and Figure 16). A linear fit was applied to the scatter plot to estimate the direction.
The main direction of displacement was analyzed by filtering the signal at the natural frequencies. Here, for the sake of clarity, we show the results obtained by filtering at f 2 and f 3 for Target A and at f 3 for Target B.
Figure 15 shows the scatter plots obtained by applying a bandpass Butterworth filter between 0.93 Hz and 0.97 Hz ( f 2 ) (Figure 15a) and between 1.63 Hz and 1.67 Hz ( f 3 ) (Figure 15b) to the y- and z-displacements of Target A. Figure 16 shows the result obtained for the displacements of Target B, filtered between 1.63 Hz and 1.67 Hz ( f 3 ). The points are arranged to form a straight line on the y-z plane, representing the main direction of displacement. Angle α indicates the axis inclination with respect to the line z = cos t .
The main directions were as follows: α 79.44 ° for Target A, frequency f 2 ; α 83.66 ° for Target A, frequency f 3 ; and α 88.57 ° for Target B, frequency f 3 .
Let us compare the scatter plots of Targets A and B filtered at the same frequency f 3 . It is worth noting that the axis inclination is different. The inclination of Target A was estimated α 83.66 ° , while for Target B it is α 88.57 ° , closer to the vertical axis.

4. Discussion

The authors propose a multi-monostatic interferometric radar that can detect the displacement vector of large structures. The method proposed consists of a standard MIMO radar equipped with at least four channels (2TX and 2RX). As the MIMO radar is based on a switching technique, crosstalk between the channels is not a critical problem.
The different pairs of antennae are in two different positions in order to ensure a baseline. The baseline allows for the measurement of two different displacement components. This radar is particularly suitable for structural monitoring where the deployable baseline can be rather short.
The performance of the equipment was tested in a controlled environment using a naval corner reflector fixed on a metallic bar. The metallic bar provides the oscillation movement. The results were compared with a seismic accelerometer. The agreement between radar and accelerometer is good, both for the displacement and natural frequency spectra.
Finally, the equipment was also tested in an experimental campaign at Varlungo Bridge in Firenze, Italy. The method was applied to two targets at different ranges. The y- and z-components of displacement were retrieved for the two targets. The movement axis of the bridge was evaluated for each frequency of both targets.

5. Conclusions

In conclusion, the method was experimentally verified in a controlled environment and in an experimental campaign. The main limit of the method is the baseline, which has to be large enough to correctly retrieve the different components. It is worth noting that, in respect to other methods, the baseline is fully exploited and can be varied on a case-by-case basis.
Another point worth mentioning is that in this article, a MIMO radar with two TX channels and two RX channels is used, but the technique could be extended to a MIMO radar with three TX channels and three RX channels. Such a MIMO radar could acquire three different components and so the complete vectorial displacement could be retrieved.

Author Contributions

Methodology, M.P.; data acquisition L.M.; formal analysis, A.B. and L.M.; writing—original draft preparation, L.M. and A.B.; writing—review and editing, M.P.; visualization, L.M.; supervision, M.P.; project administration, M.P.; funding acquisition, M.P. All authors have read and agreed to the published version of the manuscript.

Funding

This research was co-founded by Cassa di Risparmio Foundation, Firenze, Italy, Project ID 45021 Cod. SIME 2020.1639.

Institutional Review Board Statement

Not applicable.

Informed Consent Statement

Not applicable.

Data Availability Statement

Data available on request.

Conflicts of Interest

The authors declare no conflict of interest.

References

  1. Pieraccini, M.; Parrini, F.; Fratini, M.; Atzeni, C.; Spinelli, P.; Micheloni, M. Static and dynamic testing of bridges through microwave interferometry. NDT E Int. 2007, 40, 208–214. [Google Scholar] [CrossRef]
  2. Stabile, T.A.; Perrone, A.; Gallipoli, M.R.; DiTommaso, R.; Ponzo, F.C. Dynamic Survey of the Musmeci Bridge by Joint Application of Ground-Based Microwave Radar Interferometry and Ambient Noise Standard Spectral Ratio Techniques. IEEE Geosci. Remote Sens. Lett. 2013, 10, 870–874. [Google Scholar] [CrossRef]
  3. Placidi, S.; Meta, A.; Testa, L.; Rodelsperger, S. Monitoring structures with FastGBSAR. In Proceedings of the 2015 IEEE Radar Conference, Johannesburg, South Africa, 27–30 October 2015; pp. 435–439. [Google Scholar]
  4. Luzi, G.; Crosetto, M.; Fernández, E. Radar Interferometry for Monitoring the Vibration Characteristics of Buildings and Civil Structures: Recent Case Studies in Spain. Sensors 2017, 17, 669. [Google Scholar] [CrossRef] [PubMed] [Green Version]
  5. Zhang, B.; Ding, X.; Werner, C.; Tan, K.; Zhang, B.; Jiang, M.; Zhao, J.; Xu, Y. Dynamic displacement monitoring of long-span bridges with a microwave radar interferometer. ISPRS J. Photogramm. Remote Sens. 2018, 138, 252–264. [Google Scholar] [CrossRef]
  6. Cardillo, E.; Caddemi, A. Radar Range-Breathing Separation for the Automatic Detection of Humans in Cluttered Environments. IEEE Sens. J. 2020, 1. [Google Scholar] [CrossRef]
  7. Rodriguez, D.; Li, C. Sensitivity and Distortion Analysis of a 125-GHz Interferometry Radar for Submicrometer Motion Sensing Applications. IEEE Trans. Microw. Theory Tech. 2019, 67, 5384–5395. [Google Scholar] [CrossRef]
  8. Dei, D.; Mecatti, D.; Pieraccini, M. Static Testing of a Bridge Using an Interferometric Radar: The Case Study of “Ponte degli Alpini,” Belluno, Italy. Sci. World J. 2013, 2013, 504958. [Google Scholar] [CrossRef] [PubMed]
  9. Guarnieri, A.M.; Falcone, P.; D’Aria, D.; Giunta, G. 3D Vibration Estimation from Ground-Based Radar. Remote Sens. 2018, 10, 1670. [Google Scholar] [CrossRef] [Green Version]
  10. Wang, J.; Chen, L.; Liang, X.; Ding, C.-B.; Li, K. Implementation of the OFDM Chirp Waveform on MIMO SAR Systems. IEEE Trans. Geosci. Remote Sens. 2015, 53, 5218–5228. [Google Scholar] [CrossRef]
  11. Tarchi, D.; Oliveri, F.; Sammartino, P.F. MIMO Radar and Ground-Based SAR Imaging Systems: Equivalent Approaches for Remote Sensing. IEEE Trans. Geosci. Remote Sens. 2013, 51, 425–435. [Google Scholar] [CrossRef]
  12. Michelini, A.; Coppi, F.; Bicci, A.; Alli, G. SPARX, a MIMO Array for Ground-Based Radar Interferometry. Sensors 2019, 19, 252. [Google Scholar] [CrossRef] [PubMed] [Green Version]
  13. Hu, C.; Wang, J.; Tian, W.; Zeng, T.; Wang, R. Design and Imaging of Ground-Based Multiple-Input Multiple-Output Synthetic Aperture Radar (MIMO SAR) with Non-Collinear Arrays. Sensors 2017, 17, 598. [Google Scholar] [CrossRef] [PubMed]
  14. Cardillo, E.; Caddemi, A. A Review on Biomedical MIMO Radars for Vital Sign Detection and Human Localization. Electronics 2020, 9, 1497. [Google Scholar] [CrossRef]
  15. Deng, Y.; Hu, C.; Tian, W.; Zhao, Z. 3-D Deformation Measurement Based on Three GB-MIMO Radar Systems: Experimental Verification and Accuracy Analysis. IEEE Geosci. Remote Sens. Lett. 2020, 1–5. [Google Scholar] [CrossRef]
  16. Pieraccini, M.; Miccinesi, L.; Rojhani, N. A GBSAR Operating in Monostatic and Bistatic Modalities for Retrieving the Displacement Vector. IEEE Geosci. Remote Sens. Lett. 2017, 14, 1–5. [Google Scholar] [CrossRef]
  17. Miccinesi, L.; Pieraccini, M. Monostatic/Bistatic Interferometric Radar for Monitoring Slander Structures. In Proceedings of the 2019 IEEE Conference on Antenna Measurements & Applications (CAMA), Kuta, Bali, Indonesia, 23–25 October 2019. [Google Scholar]
  18. Miccinesi, L.; Pieraccini, M. Bridge Monitoring by a Monostatic/Bistatic Interferometric Radar Able to Retrieve the Dynamic 3D Displacement Vector. IEEE Access 2020, 8, 210339–210346. [Google Scholar] [CrossRef]
  19. Pieraccini, M.; Fratini, M.; Parrini, F.; Atzeni, C.; Bartoli, G. Interferometric radar vs. accelerometer for dynamic monitoring of large structures: An experimental comparison. NDT E Int. 2008, 41, 258–264. [Google Scholar] [CrossRef]
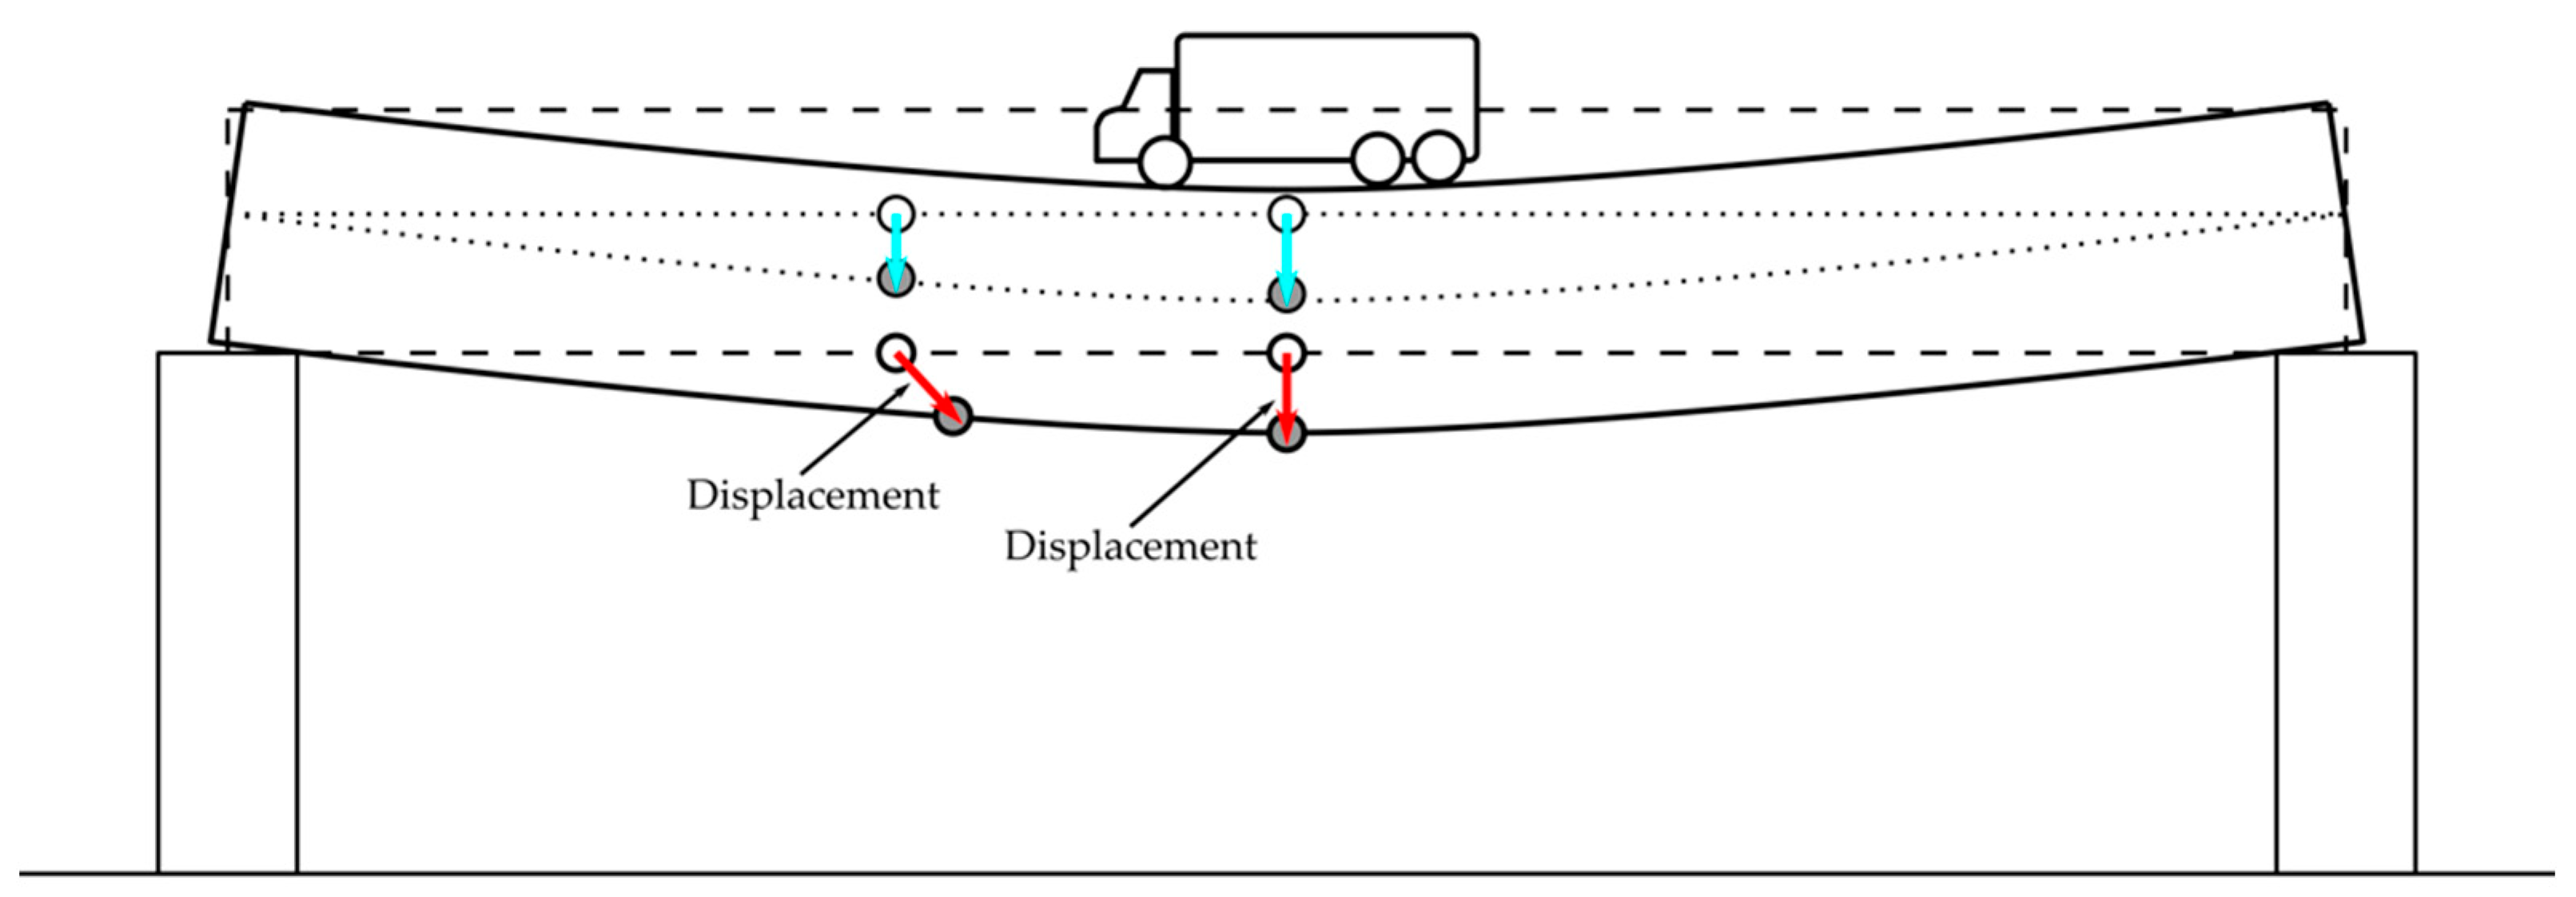
Figure 1. The blue arrows are the displacements of the points of the neutral axis (the dotted line in the figure) of the bridge; the red arrows are the displacements of the points far from the neutral axis (the figure and the displacements are not in scale).
Electronics 10 00247 g001
Figure 2. Working principle of the multi-monostatic interferometric radar (the figure and the displacements are not in scale).
Electronics 10 00247 g002
Figure 3. Block scheme of the interferometric multiple input, multiple output (MIMO) radar for retrieving the displacement vector.
Electronics 10 00247 g003
Figure 4. Block scheme of the interferometric MIMO radar for retrieving the displacement vector.
Electronics 10 00247 g004
Figure 5. IBIS-FM MIMO Radar by IDS Company in the configuration with four antennae connected.
Electronics 10 00247 g005
Figure 6. (a) Block scheme of the modified MIMO radar; (b) second pair of antennae.
Electronics 10 00247 g006
Figure 7. (a) Geometry of the experimental setup in a controlled environment; (b) detail of the target used during the controlled environment experimental session.
Electronics 10 00247 g007
Figure 8. Radar plots acquired from the two groups of antennae.
Electronics 10 00247 g008
Figure 9. (a) Comparison between the displacement measured by accelerometer along the y-axis and by radar using (4); (b) natural frequency spectrum of displacement measured by accelerometer along the y-axis and by radar using (4).
Electronics 10 00247 g009
Figure 10. (a) Comparison between the displacement measured by accelerometer along the x-axis and by radar using (4); (b) natural frequency spectrum of displacement measured by accelerometer along the x-axis and by radar using (4).
Electronics 10 00247 g010
Figure 11. Geometry of the experimental setup during the “Varlungo” monitoring camping. The red dots indicate the targets selected for analysis. The point at 23 m is Target A and the point at 33 m is Target B. The squares indicate the steel stays that connect the bridge to the carriageway.
Electronics 10 00247 g011
Figure 12. (a) Displacement of Target A measured by the two radars; (b) y- and z-components of Target A retrieved using (4).
Electronics 10 00247 g012
Figure 13. (a) Displacement of Target B measured by the two radars; (b) y- and z-components of Target B retrieved using (4).
Electronics 10 00247 g013
Figure 14. Spectrum of the y- and z-components for Target A (a) and Target B (b).
Electronics 10 00247 g014
Figure 15. Scatter plots of the displacement on the y-z plane, filtered at frequency f 2 (a) and at frequency f 3 (b). The orange line represents the preferential direction of displacement. In (a) α 70.44 ° ; in (b) α 83.66 ° .
Electronics 10 00247 g015
Figure 16. Scatter plots of the displacement on the y-z plane, filtered at frequency f 3 . The orange line represents the preferential direction of displacement. Here, α 88.57 ° .
Electronics 10 00247 g016
Table 1. Position of radar, the second pair of antennae, and the target referred to Figure 7.
Position (x, y, z) [m]
Radar(0, 0, 0)
Second pair of antennae(−7.33, 0, 0)
Target(0, 12.88, 0)
Table 2. Natural frequencies detected by the radar and accelerometer.
f 1   [ Hz ] f 2   [ Hz ]
Measurement 1Measurement 2Measurement 1Measurement 2
Radar component x1.7371.7343.4903.517
Radar component y1.7551.7643.4863.518
Accelerometer along y1.766N.D.
Accelerometer along xN.D. 13.556
1 The peak is visible, but in the opinion of the authors, the frequency is not clearly detectable.
Table 3. Position of radar, second group of antennae, and targets referred to in Figure 10.
Position (x, y, z) [m]
Radar(0, 0, 0)
Second group of antennae(0, −2.86, 2.88)
Target A(0, 23.27, 8.20)
Target B(0, 33.16, 8.20)
Table 4. Natural frequencies of the two targets investigated at the Varlungo Bridge.
Target ATarget B
f 1   [ Hz ] 0.879 0.883
f 2   [ Hz ] 0.952 0.950
f 3   [ Hz ] 1.655 1.653
f 3   [ Hz ] N.D.1.570
f 4   [ Hz ] 1.893 1.906
Publisher’s Note: MDPI stays neutral with regard to jurisdictional claims in published maps and institutional affiliations.