Abstract
Future trends in maritime technology include the application of additive technology in spare parts management. Nowadays, 3D printing has become an integral technology in many fields. Maritime industry is one of the fields where 3D printing has become a focus of research. To prepare Electro-technical Officers (ETOs) for the future, it is necessary to investigate parameters which help with deciding whether to use additive technology or to order a spare part. This paper aims to research parameters influencing spare parts printing as a job carried out by ETOs aboard ships. Conclusions about the filament density and quality of the printed parts are derived and presented. Suggestions for future work and possible applications are given.
1. Introduction
At the beginning of the 21st century, huge technological advance involving new materials, new chips, smaller processor dimensions, and new mechatronics have occurred. These changes included new educational techniques [1], which have been taken very seriously in militaries [2]. Such advances are the main reason for the development of 3D printing technology and its uses in maritime applications. Lately, additive printing has been considered for maritime applications such as for ships [3,4], off-shore objects and buildings, lighthouses, etc. It is considered to be a new advanced technology. Some or all changeable parts could be printed and assembled instead of being stockpiled at a warehouse, since the spare parts occupy valuable space that could be used for other purposes. This technology is also considered to be an important part of the future due to its role facilitating green ships [5]. Green energy is within the scope of many papers, and 3D printing technology is used to conduct experiments in this field [6]. Applying additive technologies is a problem in the supply chain and imposes transportation costs [7,8]. For example, spare parts at times need to be delivered to remote and distant areas. Some of these areas are not well-connected islands, which makes delivery costs unacceptably high. Hence, it makes sense to have 3D printers at these sites. It is well known that the Port of Rotterdam plans to implement 3D metal printers in the near future, and it has been reported that the pilot project is already finished [9,10]. The so-called “Fieldlab” will be located in the Innovation Dock at Rotterdam’s port, and it will use 3D printers with a metal wire [9]. A metal wire is important to the maritime industry because it one of the main materials used by fleets, and research in this area enables future progress. Some interesting research in this field are [11,12], where Cu-Al and Al-Zn-Mg alloys were used. While [11] uses wire-arc additive manufacturing, some other methods are powder-based, like selective laser melting and laser metal deposition or cold metal transfer [12]. Reference [9] shows that the maritime sector has accepts initiatives in these areas in the field [13]. Also, AP Möller-Maersk Group has implemented 3D printing on tankers, and feedback from the crew was obtained. Reference [14] examined the 3D printed propeller’s quality to see if it is possible to use it reliably. The printed model’s strengths and weaknesses are shown. The application area of the presented paper is in the design phase of the shipbuilding process. Other materials are also useful in the maritime industry, such as composites, polymers, and silicone due to the diversity of materials necessary to construct a ship. Interesting research was published in [15], which presents 3D printed composite materials and properties in the case of interlaminar fractures, which can also be found on board. Mechanical properties were compared. This was performed using the extrusion technique, which was also used for the current paper. The tensile strength of polymer materials was also researched in [16], where a percentage of specimen mass was related to the stress. Mechanical characteristics were also investigated in [17] for silicon-based materials. However, this article also contains a Weibull analysis of failure and reliability, which is important in maintenance applications and for considering the life cycle.
A few navies have implemented 3D printing technology at sea on several ships since 2014. A scenario of 3D printing near the point of demand is considered in [18], where an impact of 3D spare parts being printed for a supply chain is considered. Acceptance in the maritime industry is studied in [19]. Benefits of such a scenario are presented as better response times, reducing inventory (as there is no need to stockpile spare parts), and transportation cost reductions [19]. The influence of 3D printing on ship systems’ availability has been considered, where the Markov model was used for calculations [20]. The top 10 printing applications for the maritime sector are presented in [21], including printing prototypes, 3D printing of spare parts, 3D printed yachts, navy drones printing, and printing current turbines. Researchers have seriously considered 3D printing for other maritime affairs [22], including for various applications in oceanography [23]. Also, it has to be stated that 3D printing’s influence on spare parts management is considered in [24], where maintenance implications are discussed, as well as reliability and cost outsets, and production structure. This includes the reduction of the assemblies’ number by merging components through AM (Additive Manufacturing). Social implications are covered by [25]. The usage of 3D scanners is considered in [26] to scan and print necessary parts. Two prototype boats were measured using a 3D scanner, and close-range photogrammetry was used for benchmarking purposes. Quantitative analysis results were verified to improve the accuracy of terrestrial laser scanner measurements. The developed calibration method is expected to be valuable for the shipbuilding industry.
A STEM learning environment for mariners is presented in [27], where a 3D printing-centered approach was used to stimulate the innovative thinking of marine engineers, e.g., Electro-technical Officers (ETOs). Additive manufacturing has also been investigated further for applications in maritime areas. For example, additive manufacturing of miniature marine structures for crashworthiness verification is presented in [28]. Mechanical characteristics have been tested such as stress-strain curves of AM stainless steel 316L obtained from specimens with different thicknesses, using high and low strain rate tension tests [28]. Modeling necessary parts has been studied using soft actuators [29] and components for robotics [30]. However, most of these papers can be related to marine engineering or shipbuilding, not to marine electrical engineering.
Work in [31] showed that it is possible to print some specific spare parts from currently available technology. Research in [32] investigated the electrical and thermal properties of 3D printed materials and showed that it is a very interesting research field.
These examples show how close the implementation of additive technology is in the maritime sector. This paper aims to research dependencies between printing time, material lengths, and infill density as a part of the automation engineer’s daily ship maintenance. To our best knowledge, such a research topic has not been published yet. Related, but not the same research is presented in [33]. Researchers investigated the influence of infill density (ID) on the microstructure and flexural behavior of 3D printed parts by conducting the three-pointing test. Other research was provided in [34], where 3D printed part’s strength was a function of infill patterns, rather than of infill density like in our research. By learning about infill density and printing time dependencies, one could estimate functions to calculate what is optimal to do in industry (traffic, maritime) situations. In the case of a ship’s part failure, the main variable is time needed to replace the damaged part. If we choose to 3D print this part, then this is directly related to the printing time. This is considered as a tool in ship’s maintenance used by ETO. The paper investigates the increase of printing time with infill density and material length as a function of one and two variables, which are regression and multiple regression hypotheses. Our research has been conducted on plastic materials as a framework for other materials. In some emergencies, 3D printed plastic replacements could be sufficient for a short period, and they are cost-effective.
The paper is organized as follows. The Introduction section reviews references and motivation for the research. The second section describes the experimental settings and uses mathematical calculations to analyze the results. The third section presents statistical analysis of the results and discussion. Finally, conclusions are given.
2. Methods and Experimental Settings
Once 3D printing becomes standard aboard ships, the mariners will face a trade-off between printing speed and other properties, such as the infill density. So, the task is to test and learn how infill density influences the printing speed. Furthermore, it should be possible to calculate whether there is enough material (length) to print a necessary spare part.
An Ultimaker S5 device model has been chosen as a device that is used in the experiments. The chosen 3D printer can use PLA (Polylactic acid) or ABS (Acrylonitrile Butadiene Styrene) types of filament as working pieces. The characteristics of the Ultimaker S5 device are:
- a satisfactory precision of the print layout,
- a dual extrusion for the filament (two would be better),
- a auto-leveling heated bed (no need for additional heaters),
- a supported standard STL (Standard Tessellation Language) files, and
- a communication to the computer by a USB port, which is standard nowadays.
The CAD (Computer-Aided Design) programs used to draw the model and to export into STL format were Autodesk Inventor Professional 2015 and 123D Design [35], which are free and on-line available programs that are simpler for use and smaller in size on a hard disk.
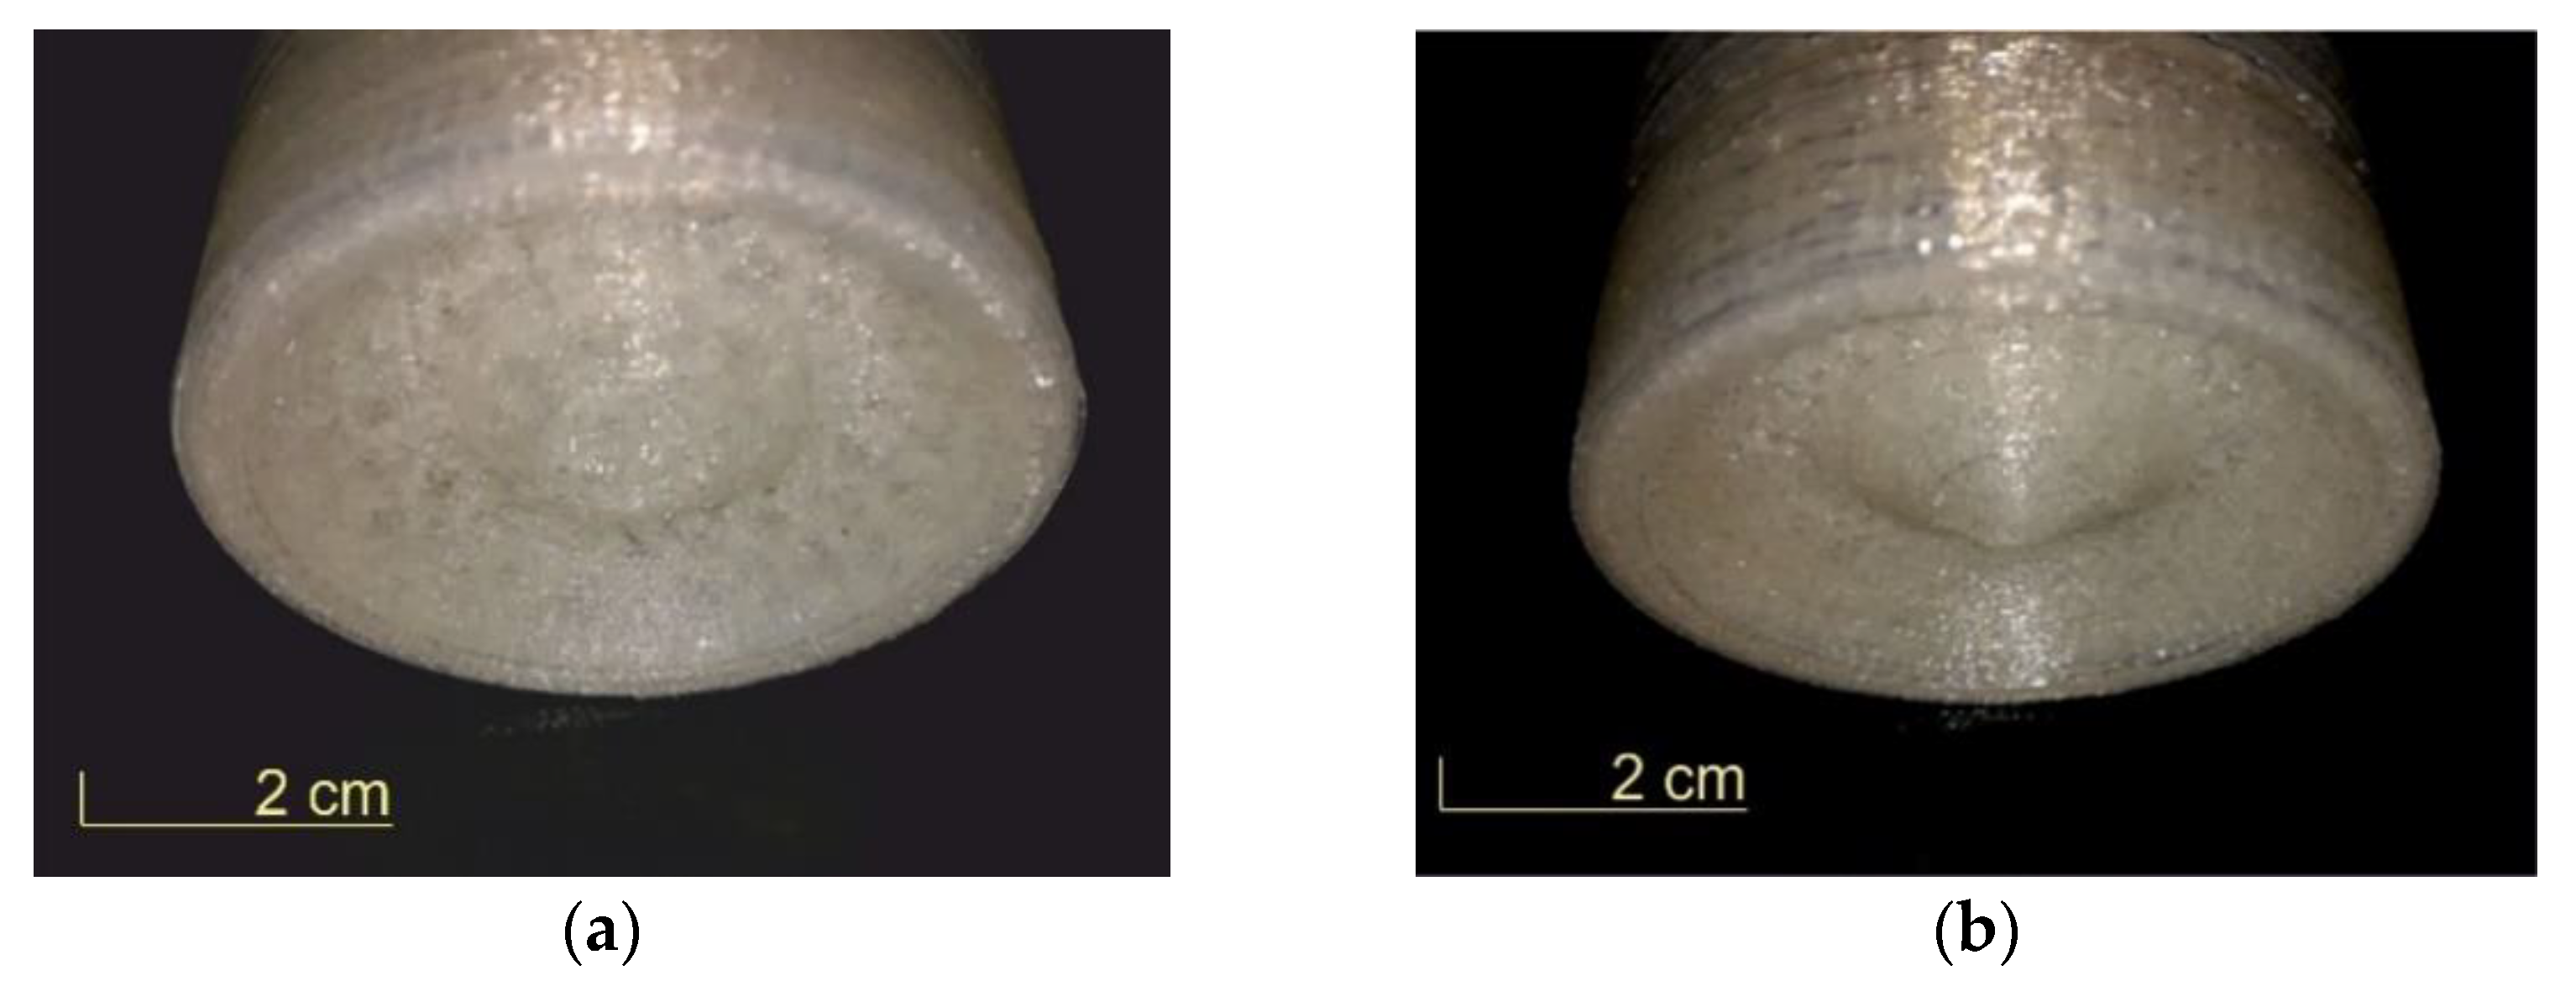
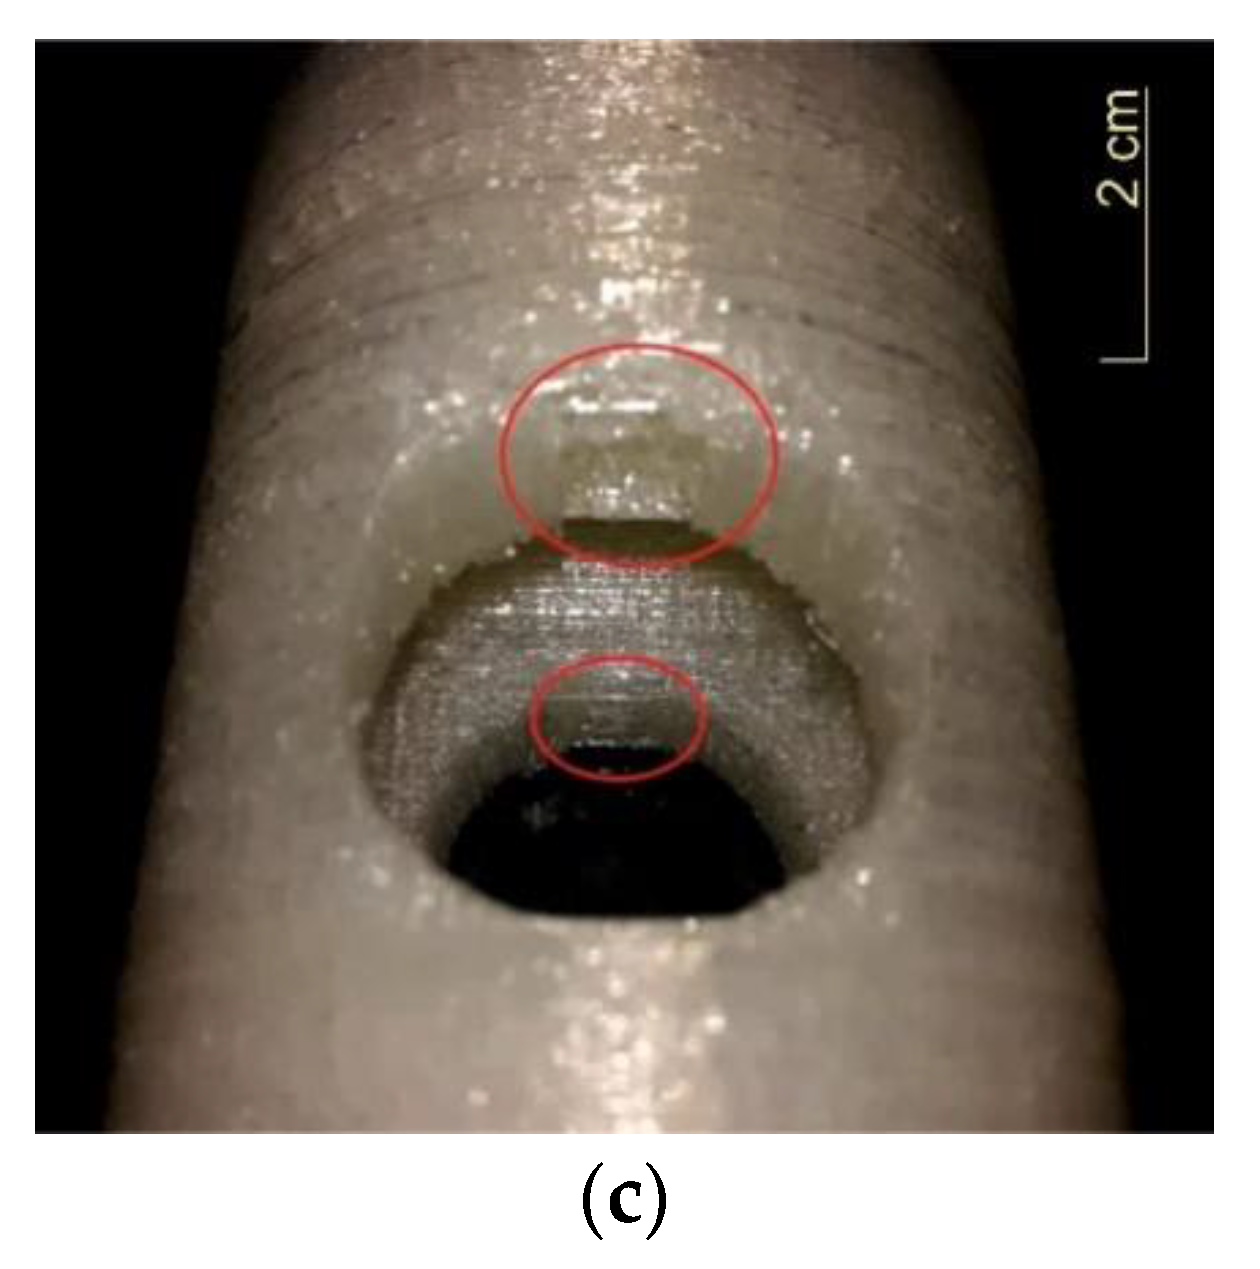
The research aim was to determine relations between the printing time, infill density, and material spent on printing. Figure 1a,b shows an example of the printed model parts with two infill densities. Figure 1c shows an example of printing when a design is not well adopted (software created the bridge to support the construction).
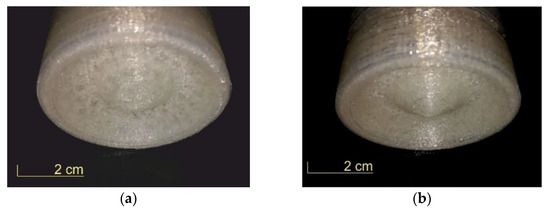
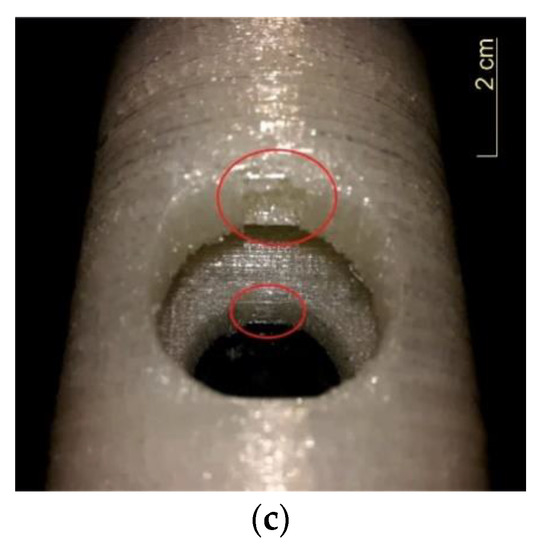
Figure 1.
(a) Printed engine part with an infill density of 20%, (b) the same engine part as at (a) with infill density of 30%, (c) a bridge that was printed by the software, the authors did not design this.
3. Results
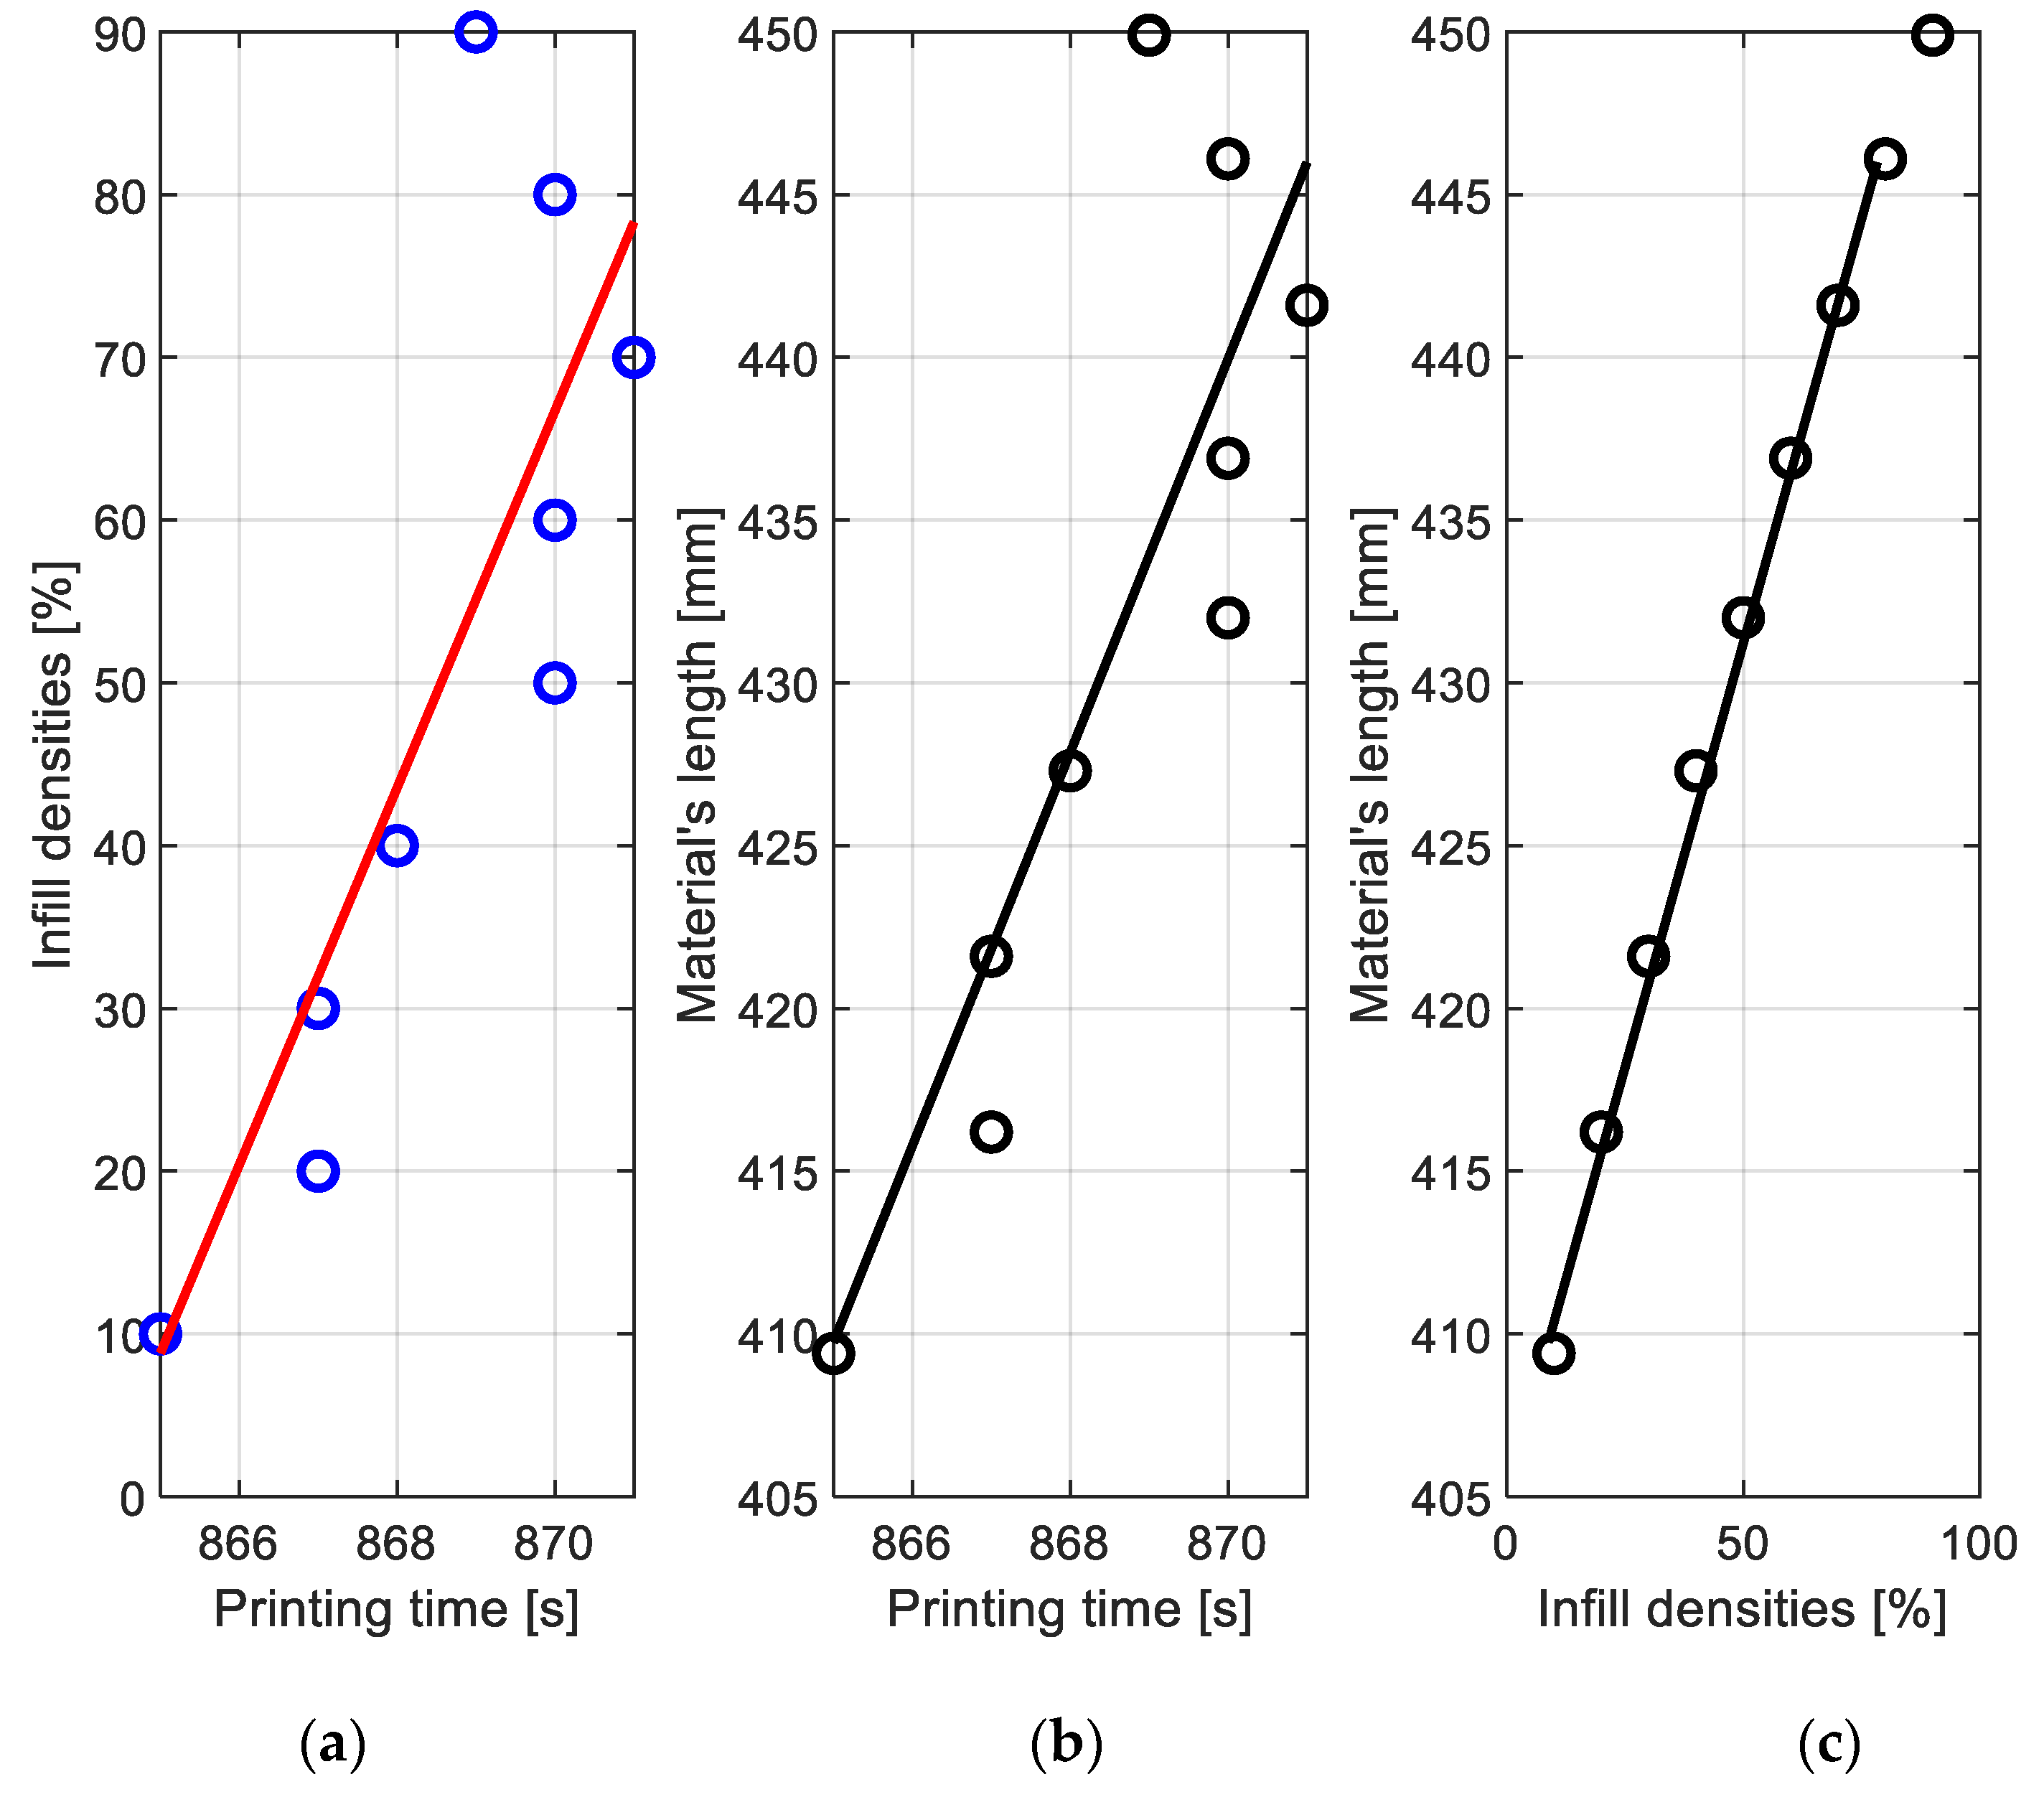
The next investigated task was to determine the relationship between the required filament, infill density, and printing time. Instead of printing the model with all filament settings, we used actual software to simulate printing, which meant that everything was performed as in printing except for the last stage (actual printer operation). Simulated infill densities were: 10%, 20%, 30%, 35%, 40%, 50%, 60%, 70%, 80%, 90%, and 99%. Results are shown in Figure 2. Figure 2 shows an interpolation line between the simulated points. It can be seen that the greatest distance from the interpolation line (see Figure 2) occurs at high infill densities. As can be seen from Figure 2, there was no significant change in printing time versus infill density, which is surprising. On the other hand, the filament required for printing increased with the infill density. This was expected because a denser infill means that more material is necessary. To establish some relations and obtain conclusions for the printing process, the following measurements were taken. Firstly, infill density was measured as a function of printing time. Simultaneously, filament usage, i.e., material spent, was also measured as a printing time function.
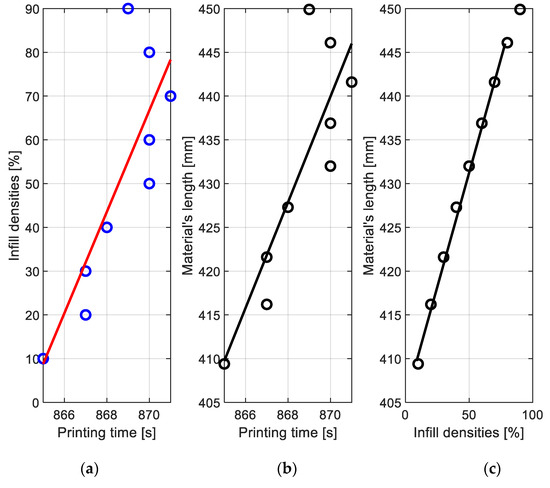
Figure 2.
2D plots of: (a) infill density vs. printing time, (b) material’s length vs. printing time, (c) infill density vs. the material’s length. Circles are experimental results and full line is the interpolation line.
3.1. Relationships between Infill Density, Printing Time, and Material’s Length
To draw a relationship between infill densities vs. printing time and material’s length vs. printing time, the least-squares method (LSM) was applied [36].
If the system is overdetermined, i.e., it has more equations than unknowns, then the LSM can be employed. In this case, nine points of the printing time have been used to obtain the values for infill densities and filament usage variables (see Figure 2). In a mathematical sense, we used a data set from two-dimensional vector space, R2, where it was assumed that yi = f(xi) where i = 1, 2, 3, …, 9. Figure 2 shows 2D plots of infill density vs. printing time, the material’s length vs. printing time, and the material’s length vs. infill density. Figure 2 shows that data do not lie on the line, otherwise data fitting must be employed. To get the best approximation, the sums of squared differences between data values and their corresponding modeled values must be minimized. If we assume linear dependence, then
where y and x are measured parameters and α1 and α0 unknown parameters. If we substitute y and x with infill densities and printing time, and filament length and printing time, the squared difference can be defined as:
where i = 1, 2, 3, …, 9. So, the sum of squared differences between data values or the sum of squared errors is then defined as:
where yi and xi are measured, and α0 and α1 are unknown parameters. The Least Square Criteria (LSC) is used for minimization, where the sum of squared error (SRR) is minimized.
3.2. Dielectric Property Measurements
This experiment’s scope was to investigate changes in the relative dielectric constant based on infill pattern and density. The relative dielectric constant was measured with a method of parallel capacitors, and it was performed with L-C Meter HM8018.
To calculate the relative dielectric constant value, Equation (4) was used [37]:
where C is the measured sample capacity, A contact surface (here was 0.001963 [m2]), absolute dielectric constant (8.8541878176 × 10⁻¹² F/m), and sample thickness.
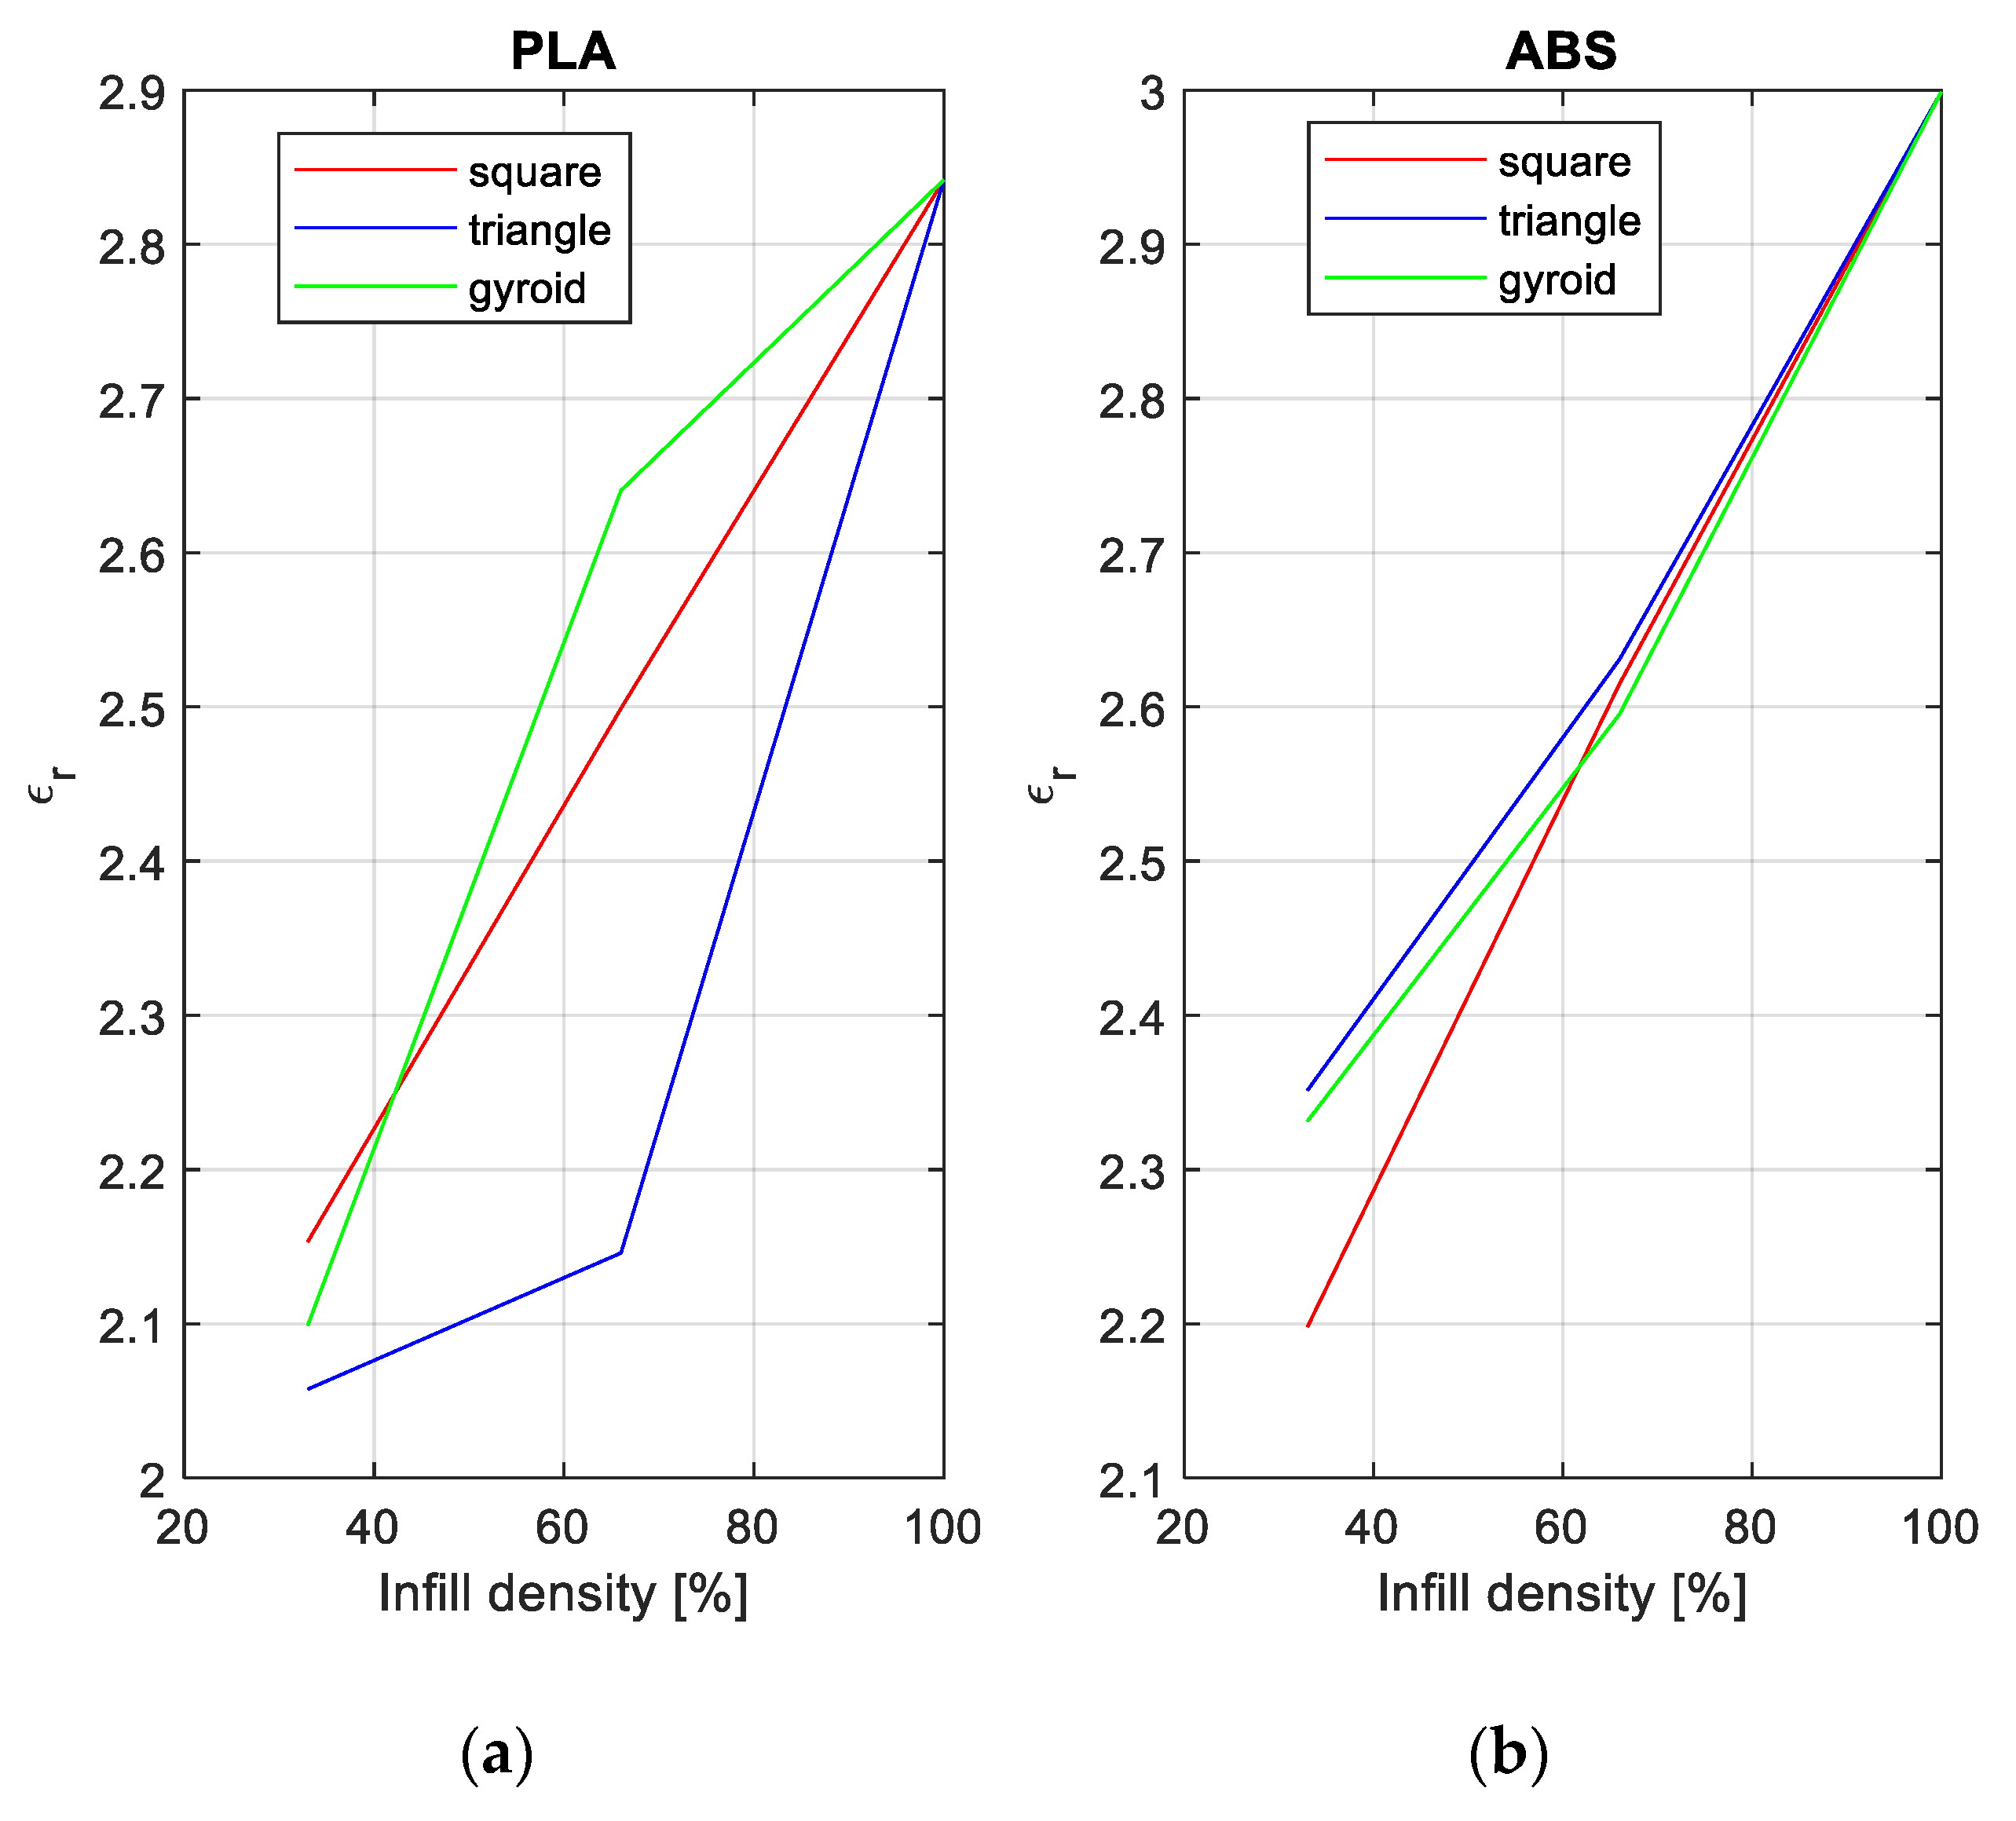
Figure 3 shows the results of the experiments for PLA and ABS filaments. Three types of infill patterns were used (square, triangle, and gyroid).
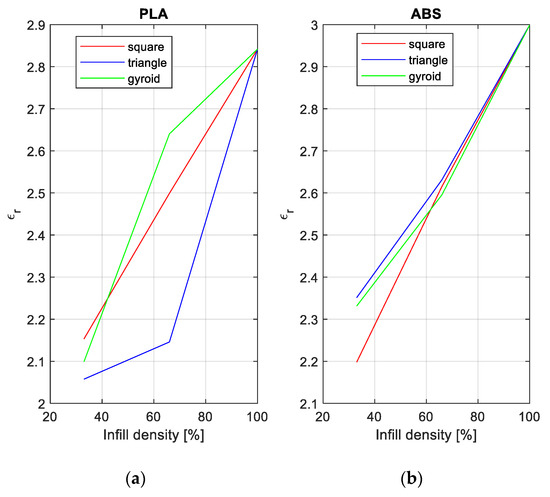
Figure 3.
Results of relative dielectric constant measurements with various infill densities: (a) PLA filament, (b) ABS filament.
From Figure 3, it can be seen that the relative dielectric constant increases with the increasing infill density, regardless of the infill pattern. Therefore, it can be observed that the infill pattern is a function of the relative dielectric constant. Furthermore, PLA is more sensitive to changes in patterns than ABS, which can be concluded due to the better focus of three lines in Figure 3b than in Figure 3a.
4. Statistical Analysis and Discussion
The previous section introduced experimental results, which must be evaluated. In order to check the credibility of data and conclusions, statistical analysis was performed. There are three parameters, therefore the correlation between them was calculated. The results are presented in Table 1.

Table 1.
Correlation between parameters.
From Table 1, it can be seen there are strong correlations between the variables. The correlation coefficient between the infill density and the material length was almost one (0.9975). Such a strong correlation coefficient could imply that the data from the variables come from the same source. The table shows that the hypothesized independent variables (the infill density and material length) have strong correlations (0.8219 and 0.8517, respectively) with the dependent variable, the printing time. Such strong correlations imply that the independent variables, the infill density, and the material length could form suitable regression analysis bases. Next, to check the observed variables’ hidden correlations, an ANOVA test was performed, as shown in Table 2.

Table 2.
An ANOVA analysis between the three observed variables.
Table 2 shows there were no hidden correlations between the observed variables, which implies that all of the variables did not come from the same source. From the table, F = 26,288.2, Fcrit = 3.4028, and p < 0.001. Furthermore, two separate t-tests were performed between the independent and dependent variables to test the variabilities of the data statistically. If the t-test is performed between the printing time and infill densities, the following values can be obtained: T = 1509.116, tcrit(one-tail) = 1.8595, tcrit(two-tails) = 2.306, p(one-tail) = 2.08 × 10⁻²³, and p(two-tail) = 4.16 × 10⁻²³. From the performed analysis, it can be seen that the variability between data is statistically significant. Also, if the second t-test analysis is performed, i.e., between the printing time and material length variables, the following values are obtained: T=107.77, tcrit(one-tail) = 1.859, tcrit(two-tail) = 2.306, p(one-tail) = 3.07 × 10⁻¹⁴, and p(two-tail) = 6.14 × 10⁻¹⁴. From the performed analysis, it can be concluded that the variability between data is also statistically significant, as in the previous case. Since there are no hidden correlations between the dependent and independent variables, there is significant variability between data, and there are strong correlations between the printing time and independent variables, the multiple regression analysis is performed. Equation (5) shows the dependence between the dependent variable printing time as a function of the infill densities and material length:
where tp is the printing time, ID denotes the infill density, and Lm denotes the material’s length.
tp = 499.068 − 37.493 × ID + 0.902 × Lm,
From Equation (5), it can be seen the variable ID has a negative coefficient, while the variable Lm has a positive coefficient (see again t 2). Also, the variable ID has a stronger influence than the variable Lm. Furthermore, to determine how much data can be explained with Equation (5), the coefficient of determination (r2), and the adjusted coefficient of determination (adj r2) metrics were calculated. From data r2 = 0.8795 and adj r2 is equal to 0.8394, it can be concluded that 87.95% or 83.94% (if the number of samples is taken into account) can be explained using Equation (5). Next, an ANOVA test performed on regression shows F = 21.907, which corresponds with p = 0.00174. It can be concluded that the multiple regression Equation (5) has significant explanatory power. Further, if the t-test is performed on coefficients of Equation (5), the following values are obtained; for the variable ID, T = −2.7707 which corresponds with p = 0.0323, and for the variable Lm, T = 3.1878, which corresponds with p = 0.01888. From the obtained values, it can be seen that both variables have a significant p-value, which supports the previous conclusion about the explanatory power of Equation (5).
From the performed analysis, it can be concluded that the printing time of the 3D-printer depends on both variables, i.e., ID and Lm.
To validate the derived equation’s explanatory power, Equation (5) was assessed using the following analysis. First, the variable printing time was presented as a function of the variable infill densities, and then the printing time was given as a function of the variable material densities. Then, the statistical analysis was performed, and the results were compared with Equation (5), and the appropriate conclusions were drawn.
If the regression analysis was performed with printing time as a function of infill densities, then Equation (6) is obtained:
tp = 865.638 + 5.833 × ID.
Equation (6) is illustrated by Figure 2. Performing an ANOVA analysis, F = 14.575, which corresponds with p = 0.0065, r2 = 0.6755, and adj r2 = 0.6292. From the calculated statistics, it can be seen that the explanatory power of Equation (6) is only 67.55% or 62.92% (if the number of samples is taken into account). From the p-value, it can be concluded that Equation (6) has statistically significant explanatory power. Further, performing t-test on Equation (6) coefficients shows that T = 3.817 corresponds with p = 0.0065. If a similar analysis is performed with printing time as a function of material length, Equation (7) is obtained:
tp = 816.775 + 0.12 × Lm.
This is illustrated by Figure 2. Performing the same methods as in previous cases, the following values are obtained: F = 18.496, which corresponds with p = 0.003, r2 = 0.7254, and adj r2 = 0.6862. Considering all of the statistical values, the equation’s explanatory power is 72.54%, which is better than for Equation (6). The p-value shows statistical significance, and when performing the t-test, the value T = 4.3 is obtained, which corresponds with p = 0.0035.
Comparing all three equations, i.e., (5), (6), and (7), it can be concluded that the printing time as a function of the infill densities and material length variables has the best explanatory power regarding the other two, as can be seen from Table 3.

Table 3.
Comparison of test parameters for regression and multiple regression.
5. Conclusions
It is shown that there is no significant change in the printing time vs. the infill density at rates of up to 90%. Further investigations should be performed for infill densities of 90-100%. Hence, if the mechanical and electrical characteristics are satisfied, there should be no obstacles to using 3D printed spare parts aboard ships.
Further research should be used to find a minimum infill density that satisfies electrical and mechanical characteristics necessary for spare parts. Furthermore, from derived results, the infill density is linearly proportional to the material’s length and infill density, which is not often the case. However, multiple regression is the best way to calculate how much time is needed to print a spare part in this case. Signal analysis practice often results in better metrics for single regression than for multiple regression. In this case, ANOVA provided the proof that there are no hidden correlations between independent variables, which resulted in better metrics for multiple regression. Hence, the printing time is better evaluated by taking into account dependencies with both the infill density and the material’s length.
An interesting topic for further research is the influence of an actual ship’s conditions on the 3D printing process. Namely, a ship faces many vibrations and disturbances, such as waves, winds, sway, yaw, roll, etc. How would a 3D printer be able to compensate for such vibrations and displacements? It is notable that 3D printers have vibration dampeners, but these are suitable for printer-made vibrations, not environmental ones.
Author Contributions
Conceptualization, I.V. and J.Š.; methodology, I.V and J.Š.; software, M.P.; validation, I.V., J.Š., and I.K.; formal analysis, I.V. and J.Š.; investigation, M.P., I.V., and J.Š.; resources, I.K. and M.P.; data curation, I.V., J.Š., and M.P.; writing—original draft preparation, I.V. and J.Š.; visualization, I.V. and M.P.; supervision, I.V. All authors have read and agreed to the published version of the manuscript.
Funding
This research received no external funding.
Acknowledgments
This work is a part of research for the project “Research on Innovative Maritime Technologies with Equipping the Research Laboratory at the Faculty of Maritime Studies” performed by the scientific group “New technologies in maritime.”
Conflicts of Interest
The authors declare no conflict of interest.
References
- Ramanayaka, K.H.; Chen, X.; Shi, B. UNSCALE: A fuzzy-based multi-criteria usability evaluation framework for measuring and evaluating library websites. IETE Tech. Rev. 2018, 36, 412–431. [Google Scholar] [CrossRef]
- Singh, M.; Pati, D. Countermeasures to replay attacks: A review. IETE Tech. Rev. 2019. [Google Scholar] [CrossRef]
- Kostidi, E.; Nikitakos, N. Is it time for the maritime industry to embrace 3d printed spare parts? TransNav 2018, 12, 557–564. [Google Scholar] [CrossRef]
- Felski, A.; Zwolak, K. The ocean-going autonomous ship—Challenges and threats. J. Mar. Sci. Eng. 2020, 8, 41. [Google Scholar] [CrossRef]
- 3D Print in the Maritime Industry. 2016. Available online: https://greenship.org/project/3d-print-in-the-maritime-industry-ii/ (accessed on 22 August 2019).
- Altan, B.D.; Kovan, V.; Altan, G. Numerical and experimental analysis of a 3D printed Savonius rotor with built-in extension plate. Wind Struct. 2018, 27, 1–9. [Google Scholar] [CrossRef]
- Bergsma, J.M.; van der Zalm, M.; Pruyn, J.F.J. 3D-printing and the maritime construction sector. In Proceedings of the 10th Symp High-Performance Marine Vehicles HIPER′16, Cortina, Italy, 17–19 October 2016; pp. 428–442. [Google Scholar]
- Boat and Ship Industry Ideal for 3D Printer R & D Tax Credits. 2017. Available online: https://3dprint.com/177513/boatand-ship-3d-printing/ (accessed on 22 August 2019).
- 3D Printing in the Port of Rotterdam. 2016. Available online: https://www.portofrotterdam.com/en/business-opportunities/innovation-smartest-port/cases/3d-printing-in-the-port-of-rotterdam (accessed on 22 August 2019).
- Pilot Project: 3D Printing Marine Spares. 2016. Final Report, Rotterdam. Available online: https://www.portofrotterdam.com/sites/default/files/report-3d-printing-marine-spares.pdf?token=sexODksY (accessed on 22 August 2019).
- Li, S.; Ning, J.; Zhang, G.-F.; Zhang, L.-J.; Wu, J.; Zhang, L.-X. Microstructural and mechanical properties of wire-arc additively manufactured Al–Zn–Mg aluminum alloy: The comparison of as-deposited and heat-treated samples. Vacuum 2021, 108, 109860. [Google Scholar] [CrossRef]
- Wang, Y.; Chena, X.; Konovalov, S.; Su, C.; Siddiquee, A.N.; Gangild, N. In-situ wire-feed additive manufacturing of Cu-Al alloy by addition of silicon. Appl. Surf. Sci. 2019, 487, 1366–1375. [Google Scholar] [CrossRef]
- Marine Sector Embraces New Initiatives in 3D Printing. 2016. Available online: https://tech-labs.com/blog/marine-sector-embraces-new-initiatives-3d-printing (accessed on 22 August 2019).
- Cilia, T.; Bertetta, D.; Gualeni, P.; Tani, G. Additive manufacturing application to a ship propeller model for experimental activity in the cavitational tunnel. J. Ship Prod. Des. 2019, 35, 364–373. [Google Scholar] [CrossRef]
- Goh, G.D.; Dikshit, V.; An, J.; Yeong, W.Y. Process-structure-property of additively manufactured continuous carbon fiber reinforced thermoplastic: An investigation of mode I interlaminar fracture toughness. Mech. Adv. Mater. Struct. 2020. [Google Scholar] [CrossRef]
- Tanikella, N.; Wittbrodt, B.; Pearce, J. Tensile strength of commercial polymer materials for fused filament fabrication 3D printing. Addit. Manuf. 2017, 15, 40–47. [Google Scholar] [CrossRef]
- Luis, E.; Pan, H.M.; Sing, S.L.; Bastola, A.K.; Goh, G.D.; Goh, G.L.; Tan, H.K.J.; Bajpai, R.; Song, J.; Yeong, W.Y. Silicone 3D Printing: Process Optimization, Product Biocompatibility, and Reliability of Silicone Meniscus Implants. 3D Print Addit. Manuf. 2019, 6, 319–332. [Google Scholar] [CrossRef]
- Kostidi, E.; Nikitakos, N. Disrupting the spare parts supply chain in the shipping industry with the introduction of 3D printing. In Proceedings of the International Scientific Conference eRA-11, Piraeus, Greece, 23 September 2016. [Google Scholar]
- Knulst, R. 3D Printing of Marine Spares: A Case Study on the Acceptance in the Maritime Industry. Master’s Thesis, Open Universiteit, Heerlen, The Nederland, 2016. [Google Scholar]
- Vujović, I.; Šoda, J.; Kuzmanić, I. Utjecaj tehnologije 3D tiskanja na raspoloživost brodskih sustava. Naše More 2015, 62, 93–96. [Google Scholar] [CrossRef]
- Top 10 3D Printing Applications in Maritime. 2017. Available online: https://www.3dnatives.com/en/3d-printing-maritime-applications230820174 (accessed on 22 August 2019).
- Nickels, L.; Fowler, L. Researches Tackle 3D Printing for Maritime Duties. Met. Powder Rep. 2017, 72, 363–364. [Google Scholar] [CrossRef]
- Mohammed, J.S. Applications of 3D printing technologies in oceanography. Method Oceanogr. 2016, 17, 97–117. [Google Scholar] [CrossRef]
- Pour, M.A.; Zanoni, S. Impact of merging components by additive manufacturing in spare parts management. Procedia Manuf. 2017, 11, 610–618. [Google Scholar] [CrossRef]
- Jiang, R.; Kleer, R.; Piller, F.T. Predicting the future of additive manufacturing: A Delphi study on economic and societal implications of 3D printing for 2030. Technol. Forecast. Soc. 2017, 117, 84–97. [Google Scholar] [CrossRef]
- Abbas, M.A.; Lichti, D.D.; Chong, A.K.; Setan, H.; Majid, Z.; Lau, C.L.; Idris, K.M.; Ari, M.F.M. Improvements to the accuracy of prototype ship models measurement method using terrestrial laser scanner. Measurement 2017, 100, 301–310. [Google Scholar] [CrossRef]
- Audette, M.A.; Jovanovic, V.; Bilgen, O.; Arcaute, K.; Dean, A.W. Creating the fleet maker: A 3D printing-centered STEM learning environment for the stimulation of innovative thinking and empowerment of sailors. In Proceedings of the ASNE Day 2017-Technology, Systems & Ships, Arlington, VA, USA, 14–16 February 2017. [Google Scholar]
- Calle, M.A.G.; Salmi, M.; Mazzariol, L.M.; Alves, M.; Kujala, P. Additive manufacturing of miniature marine structures for crashworthiness verification: Scaling technique and experimental tests. Mar. Struct. 2020, 72, 102764. [Google Scholar] [CrossRef]
- Zolfagharian, A.; Kaynak, A.; Khoo, S.Y.; Zhang, J.; Nahavandi, S.; Kouzani, A. Control-oriented modelling of a 3D-printed soft actuator. Materials 2019, 12, 71. [Google Scholar] [CrossRef]
- Stano, G.; Arleo, L.; Percoco, G. Additive manufacturing for soft robotics: Design and fabrication of airtight, monolithic bending PneuNets with embedded air connectors. Micromachines 2020, 11, 485. [Google Scholar] [CrossRef]
- Terzić, V. Implementation Possibilities for 3D Printing of Spare Parts. Master’s Thesis, University of Split, Faculty of Maritime Studies, Split, Croatia, 2019. [Google Scholar]
- Billah, K.M.; Coronel, J.L.; Halbig, M.C.; Wicker, R.B.; Espalin, D. Electrical and thermal characterization of 3D printed thermoplastic parts with embedded wires for high current-carrying applications. IEEE Access 2019, 7, 18799–18810. [Google Scholar] [CrossRef] [PubMed]
- Aloyaydi, B.A.; Sivasankaran, S.; Ammar, H.R. Influence of infill density on microstructure and flexural behavior of 3D printed PLA thermoplastic parts processed by fusion deposition modelling. AIMS Mater. Sci. 2019, 6, 1033–1048. [Google Scholar] [CrossRef]
- Saniman, M.N.F.; Hashim, M.M.; Mohammad, K.A.; Abd Wahid, K.A.; Muhamad, W.W.; Mohamed, N.N. Tensile Characteristics of Low Density Infill Patterns for Mass Reduction of 3D Printed Polylactic Parts. Int. J. Automot. Mech. Eng. 2020, 17, 7927–7934. [Google Scholar] [CrossRef]
- 123Design. Available online: https://autodesk-123d-design.en.lo4d.com/windows (accessed on 12 December 2020).
- van de Geer, S. Least squares estimation. In Encyclopedia of Statistics in Behavioural Science; Everitt, B.S., Howell, D.C., Eds.; John Wiley & Sons: Chichester, UK, 2005; Volume 2, pp. 1041–1045. [Google Scholar]
- Veselý, P.; Tichý, T.; Šefl, O.; Horynová, E. Evaluation of dielectric properties of 3D printed objects based on printing resolution. In Proceedings of the IOP 5th International Conference Recent Trends in Structural Materials, Pilsen, Czech Republic, 14–18 November 2018; Volume 461, p. 012091. [Google Scholar]
Publisher’s Note: MDPI stays neutral with regard to jurisdictional claims in published maps and institutional affiliations. |
© 2021 by the authors. Licensee MDPI, Basel, Switzerland. This article is an open access article distributed under the terms and conditions of the Creative Commons Attribution (CC BY) license (http://creativecommons.org/licenses/by/4.0/).

