1. Introduction
Among the most common cancers in women, ovarian cancer is the most lethal, due to its late symptoms and diagnosis, and its onset can be a primary tumor or secondary tumor of the fallopian tube or endometrium [
1]. Based on histopathology and molecular genetic alterations, ovarian carcinomas are divided into five main types that can be considered as different diseases: high-grade serous, endometrioid, clear cell, mucinous, and low-grade serous carcinomas [
2]. There is currently no reliable test to diagnose asymptomatic ovarian cancer, and any study of the molecular processes that are active in its proliferating cells can contribute to the identification of new molecular biomarkers for efficient diagnosis, prognosis, and therapy.
Next-Generation Sequencing (NGS) technologies provide researchers with experimental datasets that describe the molecular profile of cancerous cells by allowing them to estimate the expression of genes in a tissue sample, which is the number of copies of a gene that are present as Ribonucleic Acid (RNA) fragments and decoded by the sequencer. Standard bioinformatic pipelines are used to compute gene expressions and to compare samples for significant expression differences, with differential expression analysis [
3].
However, NGS experiments are quite expensive and require further laboratory validation of the most significant results, as they can present noise in the data that stems from the inherent complexity of the technology. This is why many researchers use NGS with a limited number of samples to extract the most evident molecular activities and validate those results only on a larger number of samples. Moreover, NGS results are highly dependent on the laboratory experimental settings used and the datasets produced with different technical conditions (sequencer type, tissue type, tissue conservation, etc.) are not directly comparable. This is why NGS data are mainly exploited for case-control studies with only two conditions.
Due to the digitalization process, the biomedical domain represents a source of valuable data. A growing amount of this data is generated every day, ranging from vital parameters to omics data and output from imaging devices. Therefore, machine learning techniques have been used extensively in the medical domain, as they can automatically derive useful models for making predictions, and detecting patterns that reveal hidden relationships in the data [
4]. Automatic systems have been proposed to support medical experts while avoiding repetitive tasks. Moreover, thanks to the availability of this huge amount of data and the high computational capabilities of modern systems, novel insights, which could not have been discovered through manual analyses, have been returned by automatic techniques.
Machine learning algorithms have been applied to biological data of the most varied diseases such as neurodegenerative diseases [
5,
6] and cancer [
7,
8], just to name a few. Computational Intelligence is a research branch dealing with nature-inspired algorithms, such as fuzzy logic, neural networks, and evolutionary algorithms, which can process numerical data to address complex problems that may be difficult to solve with traditional machine learning algorithms [
9]. Neural networks have gained a lot of attention in recent years and their “deep” variants have led to Deep Learning (DL), which has redefined the state-of-the-art performance in several domains, including the medical one [
10]. In particular, DL algorithms have been successfully applied to omics data for early disease prediction or the extraction of meaningful biomarkers [
11,
12]. However, DL techniques have two main drawbacks: they are not interpretable, even though research is moving in this direction [
13], and they need a huge amount of data to learn a model.
On the contrary, fuzzy logic has been widely used in the medical field due to its ability to represent the uncertainty and vagueness inherent in medical concepts and in the clinician’s way of reasoning [
14]. It differs from classical Boolean logic as each object partially belongs to a given set. A membership matrix is used to represent the possibility that each object belongs to each set [
9]. Moreover, a Fuzzy Inference System (FIS) is a fuzzy logic-based reasoning system that uses linguistic variables and linguistic terms to represent vague and uncertain concepts that are involved in the reasoning, thus leading to natural language-based explanations. In fact, the knowledge base of these systems is composed of fuzzy variables whose values are represented through fuzzy sets and
if-then rules that represent the reasoning [
14]. On the other hand, Genetic Algorithms (GAs) are heuristic methods inspired by natural evolution in which optimal individuals are selected for the reproduction of the next generation of the population [
9]. They are commonly used to solve complex problems that cannot be handled with procedural methods due to the high complexity of the task. GAs are typically used in Bioinformatics to select a subset of more informative genes; in fact, omics data usually produce thousands of variables for each single sample in an experimental investigation. This curse of dimensionality affects automatic techniques, so dimensionality reduction techniques are often used to extract the most significant subset of genes for the specific task [
15]. Thanks to their ability to gradually refine solutions through natural selection, GAs are not biased by human knowledge of the problem and are effectively used for feature selection [
16,
17].
In this study, we describe the results of our analyses performed on a set of data presented in previous work [
18]. This dataset contains the sequencing of 21 human ovarian tissue samples from 12 cancer and 9 non-cancer samples, grouped into 6 diagnostic classes. Due to the large number of classes and the low number of replicates for each class, this dataset is quite difficult to analyze with standard bioinformatic tools. In this paper, we aim to extract useful information from this dataset. The goal of the research was to characterize ovarian cancer tissues by comparing them with other ovarian and uterine tissues and to find a panel of genes capable of discriminating classes and providing information on the pathologic conditions. The method proposed to analyze this dataset is based on genetic algorithms for the selection of features and fuzzy rule-based systems for the classification task, i.e., the diagnosis of the 6 classes of samples. The proposed method aims to provide experts with an interpretable model that can help them, in further laboratory studies, to clarify still unknown mechanisms behind the pathology.
To the best of our knowledge, this is the first time fuzzy logic and genetic algorithms have been combined for ovarian cancer classification. Furthermore, this is the first time this dataset has been analyzed using automatic techniques. Therefore, both biological analyses and computational intelligence techniques have been applied in this paper to verify the effectiveness of the derived results.
The rest of this paper is organized as follows.
Section 2 describes the dataset that has been analyzed through the bioinformatic pipeline, and the computational intelligence techniques employed.
Section 3 reports the results obtained with the proposed methodologies. Finally, conclusions are summarized in
Section 4.
2. Materials and Methods
In this section, we will present the dataset employed in this work and the techniques used to analyze it and evaluate the results obtained.
2.1. Dataset Description and Bioinformatic Preprocessing
The dataset used in this work was presented in a previous paper [
18]. It was produced with the Illumina HiSeq2500 sequencer and consists of approximately 30 million paired-end reads (RNA fragments) per sample.
The sequenced samples were selected from 21 Formalin-Fixed Paraffin-Embedded tissues, belonging to 6 classes that are the target of our investigation:
3 endometrioid carcinoma (KE);
6 high-grade serous carcinoma (KS);
3 low-grade serous carcinoma (KSB);
3 serous cystadenofibroma (CS);
3 endometriosis (EN);
3 healthy tuba (N).
The last three groups are non-cancerous samples. The dataset is represented by raw FASTQ files (text files containing the RNA fragments detected by the sequencer), and the gene expressions (RNA counts) were estimated with the bioinformatic tool STAR [
19], combined with RSEM [
20] and MultiDEA [
21].
After gene expression estimation, the final dataset has 21 samples and over 45 thousand genes (features), but many of them will be filtered out for low intensity as low expressions are not reliable for evaluating significant changes in gene values. By applying the standard filter of gene expressions > 50, the feature space of this dataset is reduced to about 9 thousand genes. The main goal of expression profiling is to identify all the genes that are expressed in the samples under study and to extract the genes that show changes in the expression that may be correlated to the experimental conditions. The gene functions, activities, and interactions are collected in molecular pathways and stored in pathway databases, such as KEGG [
22] or BioCarta [
23].
2.2. Differential Expression Analysis
Differential expression analysis aims to verify whether an observed change in RNA counts (gene expressions) between two experimental conditions is statistically significant. Changes in expression are correlated to the activation of a series of actions among molecules in the cell (a pathway) that change the state of the cell in response to a stimulus.
Following a standard bioinformatic workflow, differential gene expression analysis was performed with DESeq2 [
24]. Significant changes are called overexpressions if the expression of the gene increases and underexpressions if it decreases, and the magnitude of the change is evaluated by fold change computation, which is the logarithmic rate of expression between two conditions. When expression values are estimated from RNA counts, they are proportional to the length of the gene that produced the fragments detected. The fold change metric is independent of gene length, but the significance of its result must be statistically tested. Only mean gene expressions > 50 were considered in the analysis, while the result of at least one halved or doubled expression with a
p-value < 0.05 was considered statistically significant, after multiple testing adjustments by False Discovery Rate [
25].
2.3. Fuzzy Rule-Based System
The classification task was performed on subsets of genes (selected by the genetic algorithm, as will be described in
Section 2.4) with a fuzzy rule-based system. A Fuzzy Inference System (FIS) is a popular rule-based method for modeling uncertain and imprecise information. In the medical domain, linguistic terms are used to represent patients’ symptoms and suggestions are derived through fuzzy inference mechanisms. The domain knowledge is expressed in the knowledge base in the form of
if-then fuzzy rules. The strength of these systems is their “interpretability”, that is the ability to easily express the reasoning behind the rules in a way that is understandable by humans [
26]. This is a critical aspect in medical applications as experts need to understand how certain results are obtained to trust the technology.
The classifier was implemented with the “frbs” R package [
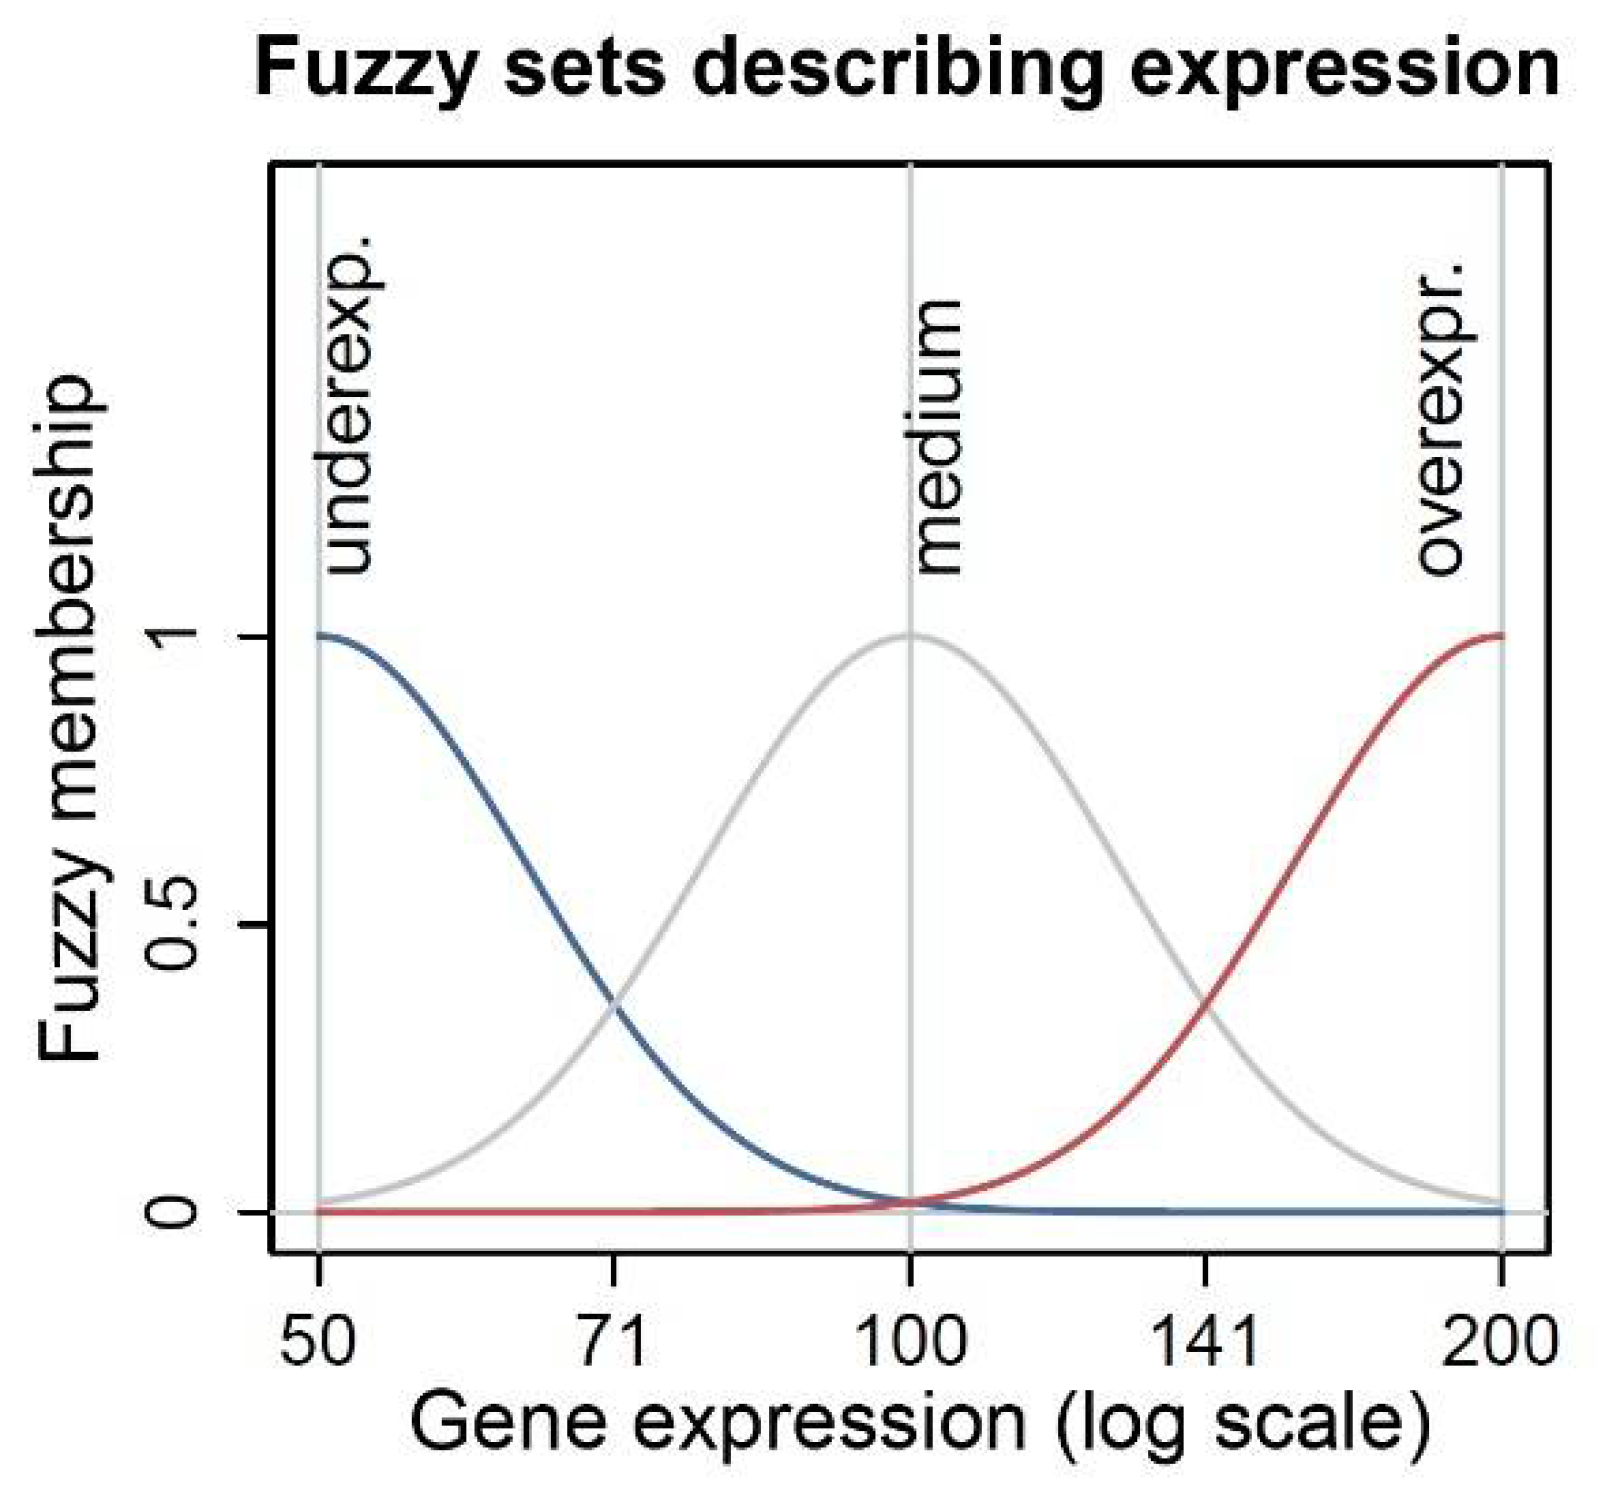
27]. As the aim of the work was to analyze the gene expression variations, the input variables are the genes selected through the GA. As variations are usually considered to be high (overexpression) or low (underexpression), we have defined the number of fuzzy terms for each gene domain as three (low, medium, and high expression). The medium expression fuzzy set is centered on the mean expression of the gene. The fuzzy rules are equidistant Gaussian sets, and the extreme sets have their center defined by the most extreme values of their gene domain. As domain experts are interested in observing the fold change rate, to linearly represent the increase and decrease of expression (for example, a halving or doubling of expression), we have defined the fuzzy sets on a logarithmic transformation of the estimated expressions, as shown in
Figure 1.
The output of the model is a set of
if-then rules in which the input fuzzy variables and their values (fuzzy terms) are concatenated in the premise. The consequent contains the output variable and its value, which in our case is discrete and corresponds to the 6 diagnoses of the samples (KE, KS, KSB, CS, EN, N).
Table 1 shows an example of fuzzy rule where the selected genes assume Medium/Overexpressed/Underexpressed values, and the target class is KE: endometrioid carcinoma.
Due to the low number of samples, the leave-one-out cross-validation method was used to assess the accuracy of the fuzzy classifier.
2.4. Genetic Algorithm
To preserve the interpretability of the fuzzy rule output, only a small number of genes should be included in the rules. The selection of these genes has been implemented with a genetic algorithm.
The evaluation of the most important and influential genes is a complex task because this feature selection task should take into account two important characteristics of NGS data: (1) gene expressions and their magnitude depend on gene length; (2) genes influence each other. These factors undermine the use of feature selection methods based on statistical assumptions such as variance evaluation. Our genetic algorithm can select the features considering multiple factors, suitably tuned by the fitness function.
These are the main parameters of the genetic algorithm:
Individuals—An individual is an array of integers, each element representing a feature in the feature space (the names of expressed genes).
Initial population—The initial population is generated randomly.
Crossing—A new individual is obtained by randomly selecting elements from two parents.
Selection—A parent is selected for crossing with roulette extraction. Each individual has a probability of being selected that is proportional to its fitness.
Mutation—Each new individual obtained from crossing can be randomly selected for a mutation event. If the mutation occurs (with a probability of 0.5), one of the elements of the individual is increased by 1 (or decreased if it represents the last feature).
Elitism—In each generation, a subset of individuals is reintroduced into the next generation.
Immigration—In each generation, a subset of new individuals is generated randomly.
Fitness function—Each individual is evaluated with the following fitness function:
where Accur is the accuracy of the model (number of correctly classified samples/total samples), Simpl is a value in [0,1] inversely proportional to the number of rules generated by the model (1 if the number of rules is equal to the number of classes), so that individuals with fewer rules are preferred, Inter is a value in [0,1] that evaluates how many selected genes are relevant for the biomedical task under analysis: if the gene is already known to be involved in cancer molecular pathways (as defined by KEGG [
22,
28]), the model is rewarded with additional fitness. Initially, only the accuracy (Accur) of the model was considered, but the final individuals showed a large number of fuzzy rules; in fact, the number of fuzzy rules is strictly dependent on the selection of variables returned by the GA. Then we introduced a factor that increases as the number of rules decreases (Simpl), which helped us to select the final individuals with a minimum number of fuzzy rules. However, repeatedly running the genetic algorithm with a different initial random seed produced very different final individuals (only a few genes were present in all results), so we decided to inject biological information into the model. This was performed by selecting the genes involved in cancer (by extracting KEGG’s cancer pathway from GSEA) and by adding another factor into the fitness function that increases when the individual contains those genes (Inter). The three parameters are weighted and summed, to obtain a total fitness in [0,1] and to give different (decreasing) importance to each element of the sum. We tested multiple weights and chose the final three shown in the formula to give slightly more importance to the classification accuracy and decreasing importance to the last two addends. This fitness function has been proposed to suit the classification task at hand.
Stop criteria: the genetic algorithm stops after a predefined number of generations, chosen empirically by observing the diversity of the population over the generations, or when the elite population contains less than 3 different individuals.
Final individuals: the final individuals will be selected based on the best accuracy and minimum number of final rules.
The fitness evaluation is the most time-consuming operation as it must be performed on all individuals of each generation. As its processing is independent for each individual, parallel computing could be used to speed up the execution time of each generation. Indeed, we compared the execution times required to compute 100 generations of 400 individuals by using both serial and parallel processing (with a 64 cores architecture). While the first took more than 4 h to stop, the second one ended after about 10 min, thus with a saving of over 20 times. The genetic algorithm was implemented with an R script and the R “parallel” package was adopted for parallel computing.
3. Results
In this section, we present the results of the elaboration performed on the ovarian cancer dataset. The data were analyzed with both a standard pipeline used by bioinformaticians and the model proposed in this paper. The analysis aims to extract information on changes in gene expression that can be useful for discriminating between different tissues, and thus to study the molecular mechanisms that differ in the samples.
As the dataset consists of only 3 samples for each class (6 samples in one case), the main objective is to highlight only the most important expression changes in an interpretable system that also takes into account the interactions among genes. The results obtained will also be discussed from a biomedical point of view.
3.1. Differential Expression Analysis
To give an idea of how complex and difficult it is to interpret an expression analysis with more than 2 classes, here we report some results of a standard differential expression analysis workflow we have applied (described in
Section 2). This type of analysis allows one to highlight those changes of expression that show statistical significance in the comparison between two conditions. We have performed this analysis in two steps.
In the first step, we have compared each group with the complete set of samples not belonging to the selected group, to search for those expression variations that are typical of the selected group. This analysis describes how specific a class tissue is, and is useful for the researcher who needs to study the singular events that occur in a tissue class and not in all the other classes analyzed, but it hides the events that occur in two or more classes and not in the other. The results are summarized in
Table 2. The “Specific genes” column contains the number of genes that are differentially expressed only in that specific group.
In the second step, we have compared each possible pair of groups to each other, to compute the differences of each tissue relative to another (
Table 3). This analysis is more useful for the researcher who needs to select a set of biomarkers, i.e., a minimal set of genes that allows one to distinguish all the tissues of a study.
From this analysis, we can extract the information in
Table 4. As we can see, these results are quite difficult to interpret and do not take into account the interactions among genes. Usually, at this stage, researchers analyze the molecular pathways of the differentially expressed genes and select a subset of genes to further study and validation; however, in this multiclass case this step is very complex. In
Section 3.2, we will present the results obtained with our proposed model based on fuzzy rules and genetic algorithms.
3.2. Fuzzy Rule-Based System & Genetic Algorithm
In this section, we describe the results obtained with the combination of genetic algorithms and fuzzy rules on the same dataset.
Table 5 summarizes the parameters tested for the execution of the genetic algorithm. Several values have been tested to speed up the execution of each generation, to avoid local minima, and to obtain final individuals with the highest fitness. In particular, the number of total individuals was increased to speed up the best individual’s selection (because the number of preserved and brand new individuals also increased), and the mutation was inserted to avoid local minima. The number of generations, initially set at 1000, was increased to 2000, because only a minority of executions stopped for a small elite population (see stop criteria in
Section 2.4). We also analyzed the composition of the population and observed that each feature appears at least once in the population after about 50 generations.
The number of features to be selected was based on the trade-off between the choice of a set of features capable of discriminating the 6 sample classes and the need to maintain the cardinality of the set rather low, to preserve the interpretability of the fuzzy rules and define a small number of genes to be selected for further biological study and laboratory validation. In addition, the domain experts wished to obtain a panel of genes capable of distinguishing samples of around 10–15 genes.
Several experiments were performed for the fitness function, as already detailed in
Section 2.4, near Equation (1). Different fitness functions were compared and—based on the empirical analyses made—the one including accuracy, the number of rules obtained, and involvement of cancer-associated genes were found to be the most suitable for our genetic algorithm. Moreover, a weighting mechanism has been used to give to each addend a different importance. Indeed, we give slightly more importance to the classification accuracy and decreasing importance to the last two addends. The final parameters are shown in bold in
Table 5.
The final individuals were selected based on accuracy only (100%), computed with leave-one-out cross-validation, then sorted by fitness. After repeating the genetic algorithm with different random seeds, we selected 72 best individuals. The final individuals are similar to each other for 78% of the selected features and differ on the remaining genes, and each individual is a subset of 10 out of the same 14 genes, listed in
Table 6. The parameter that encouraged the model definition with respect to genes already known to be strongly involved in cancer pathways (as collected in KEGG) influenced the selection of 6 cancer-related genes in each individual. The remaining four genes (the first 4 in the table) are the most important in the classification task; in fact, they are present in each of the 72 individuals. The number of fuzzy rules automatically extracted for each best individual is always equal to 10.
Table 7 lists the molecular pathways collected in the KEGG database and the genes involved. Moreover, MAPK9, MAPK1, KRAS, CBL, and EGFR are also involved in other molecular mechanisms active in cancer, such as choline metabolism, proteoglycan, and central carbon metabolism.
From a literature search, XPNPEP1, GATA4, DTX3L, and NPIPB12 also show some correlation with cancer. In particular: XPNPEP1 was found overexpressed in clear cell renal cell carcinoma [
29]; multiple studies have shown that GATA4 is closely associated with tumorigenesis [
30]; DTX3L is involved in cell proliferation, differentiation, and survival [
31]; NPIPB12 has also been correlated to cancer [
32].
Figure 2 shows an example of a set of rules defined by one of the final 72 individuals. As mentioned above, the final individuals all contain XPNPEP1, GATA4, DTX3L, and NPIPB12 and a different combination of the other genes. Moreover, all the final individuals exhibit a similar structure to the final rules. In particular:
The class that needs more rules to be described is always KS (high-grade serous carcinoma). This may be due to the complex and multifactorial nature of this cancer. Two rules capture the overexpression of DTX3L, and one rule also includes the overexpression of MAPK9 and the underexpression of NPIPB12.
The medium fuzzy set is very common in the rules, both in cancer and non-cancer rules. We expected non-cancer rules to be most represented by the “medium” membership functions, but as the dataset is mostly represented by cancer (12) or diseased (6) samples, and normal data are represented only by 3 samples, it is straightforward that the central data in the expression domains are mostly present in the rules.
For the genes that are selected in these final rules, we observed that underexpression is significantly present in non-cancer class rules and overexpression is present only in cancer class rules. We also noticed that in this set there is one rule for the KSB class (low grade of KS) that is significantly different from the others. This result requires deeper biological insights.
The KE, CS, and EN classes need only one rule to be described. In particular, the KE class is identified directly by the overexpression of XPNPEP1 and NPIPB12. This result underlines that the KS-KSB disease is the most difficult to describe.
The class N needs two rules to be described that differ only in the expression of NPIPB12, which can be medium or underexpressed. Moreover, GATA4 seems to be crucial for normal tissue identification, as it is underexpressed only in class N, in both rules.
Figure 3 shows two examples of fuzzy sets defined on MAPK9 and DTX3L, for KS data only. The MAPK9 gene (known to be strongly involved in cancer pathways) shows a tendency to overexpression, while the DTX3L gene shows an evident overexpression in KS data. This trend is correctly described by the fuzzy sets defined over the expression domain.
As can be seen, fuzzy rules are easily understood by users who are not technicians. Fuzzy systems can describe complex behaviors with a transparent description in terms of linguistic knowledge that is interpretable, i.e., easy to read and understand by human users [
26]. If we observe the rules generated by the FIS, they clearly explain which are the genes and their expressions involved in the activation of each rule. They are written by using terms coming from natural language, such as the names of the genes, the terms medium, under, and overexpression, that are commonly used by the domain experts, and the derived classes refer to different diseases, as classified by experts. This is a very desirable result as biologists have to analyze these outcomes. Indeed, all the results and comments that we were able to extract with this model based on the combination of fuzzy rule-based systems and genetic algorithms will be subject to further examinations and assessments by biologists and clinicians. Further laboratory validation of the expression of the 14 selected genes on a larger cohort of patients will allow the selection of the final set of genes useful for the definition of a final panel of biomarkers for ovarian cancer characterization.
4. Discussion and Conclusions
Ovarian cancer is a complex multifactorial disease characterized by complex gene interactions. Different types of ovarian cancer are essentially distinct diseases, as indicated by differences in epidemiological and genetic risk factors, precursor lesions, patterns of spread, and molecular events during oncogenesis, response to chemotherapy, and prognosis. A previous study attempted to address this disease by producing NGS datasets of 6 different classes of samples from surgical ovarian tissues, but classical bioinformatic workflows are unable to extract easily interpretable information for studying the expression profiles of the genes involved in the disease. The low number of replicates for each group does not allow the application of algorithms for automatic pattern extraction such as Artificial Neural Networks, and their limitations in result interpretation do not make them suitable for studying the genes involved in the disease mechanisms.
In this paper, we have tried to extract a set of genes that can be used to distinguish the 6 classes of samples and also to provide an explanation of how their expression changes in the data. We have compared the results of the most used bioinformatic pipeline with our model, based on the extraction of fuzzy rules on a set of genes selected by a genetic algorithm. The bioinformatic pipeline is designed for binary classes of case-control studies, and it allows the selection of statistically significant differentially expressed genes, but the results obtained on our 6 groups are difficult to interpret and to use for the extraction of biological markers. Moreover, it does not take into account the correlation and interactions among genes. Our proposal extracts a set of fuzzy rules that are indeed easier to interpret and selects genes both considering their ability to distinguish samples and their known involvement in cancer pathways. We have chosen to exploit fuzzy sets for our model because they represent well the concept of overexpression and underexpression, and we have applied genetic algorithms for gene selection because they allow us to select the features through a random search in the feature space, guided by some factors that are not based on variance evaluation and statistical testing. The perfect accuracy achieved by our classification model can be justified considering the very small size of the dataset we have adopted, which limits the generalizability of our results. Unfortunately, collecting a large sample of data in this particular domain is an extremely difficult task. However, we believe that the results obtained on our experimental data are still very promising and pave the way for a working system capable of supporting domain experts in ovarian cancer evaluation.
The result of our work is that with our method it is possible to select a small subset of genes able to distinguish the 6 classes of samples and to define an interpretable set of rules that can be used by domain experts to further study the selected genes, their involvement in cancer and the possibility of using them as early biomarkers for ovarian cancer diagnosis. Another important achievement of our proposal is that it allows us to elaborate meaningful results even with a reduced number of replicates for each class. As an extension of this work, in the near future, we will apply our model to other NGS datasets and define a more flexible function for pathway information in the fitness function.


 ,
, 


