1. Introduction
As one of the most important branches of distributed optical fiber sensing (DOFS), there has been a growing interest in phase-sensitive optical time domain reflectometry (φ-OTDR) in recent years. Due to its desirable characteristics such as high sensitivity, long-scale monitoring range [
1] and immunity to electromagnetic interference, φ-OTDR has already been widely used in many applications, including but not limited to intrusion detection [
2,
3], pipeline surveillance [
4], dancing of transmission cable and seismic wave detection [
5,
6,
7], where vibrational disturbances are the primary cues for detection. In recent years, it has also been innovatively proposed for use in the field of optical biosensing [
8,
9]. φ-OTDR originates from OTDR but utilizes highly coherent lasers with narrow linewidths as light sources. Compared with traditional OTDRs, which focus on measuring the intensity change of Rayleigh backscatter trace (RBS) along the fiber, φ-OTDR detects the optical phase variation of RBS for its definite linear relationship with the external variation. By demodulating the phase variation of RBS, external disturbance could be quantitatively reconstructed using φ-OTDR [
10].
However, φ-OTDR is susceptible to fading [
11], which causes drastic amplitude fluctuation on RBS traces. Within fading areas, RBS intensity is close to or even lower than the noise floor. The signal-to-noise ratio (SNR) in these areas is not good enough to correctly demodulate the external variation, leading to a high rate of distortion. For fading suppression, several methods have been investigated. According to the interferential characteristic, a differential phase shift pulsing technology was used to suppress fading by applying two optical pulses [
12,
13]. A 0-
binary phase shift process was applied on the second half part of the optical pulses. Based on the above operation, a phase stitching method was introduced in phase demodulation to get a higher amplitude, and the probability of fading was reduced. Then, time-gated digital optical frequency domain reflectometry (TGD-OFDR) based on optical intensity modulators (IM) was proposed, which was targeted for frequency domain measurement but could be exploited as a φ-OTDR [
14]. The IM had a large modulator bandwidth and created both positive and negative frequency components that could be fully used to suppress fading while the spatial resolution remained unchanged. Moreover, because the distributions of fading areas were different for independent optical frequencies, a frequency division multiplexing (FDM) method was studied. In 2013, Pan et al. proposed a φ-OTDR with a three optical frequency source [
15]. A φ-OTDR using optimum tracking over multiple probe frequencies was then proposed [
16]. Nevertheless, these structures were relatively complex, came at a high cost and required additional components.
Since the RBS intensity conforms to the property of the Rayleigh distribution [
17,
18], it can be considered to avoid fading areas before phase demodulation. Therefore, the phase demodulation reference positions can be optimized using a short measurement time. For example, the RBS signal is divided into several intervals, so the reference intervals with the maximum amplitude intensity can be optimized as much as possible to avoid fading. However, this method is usually only suitable for the reconstruction of high-frequency vibration signals. Up to now, the detection frequency of φ-OTDR has mostly been in the tens of Hz to MHz level. However, the detection for some applications such as transmission cable dancing (generally less than 3 Hz) or material craking below 10 Hz is difficult [
19,
20]. In recent years, researchers have only begun to study how to improve the low-frequency response capability of φ-OTDR. It is necessary to continuously measure low-frequency signals for a long time to correctly reconstruct the signals. Moreover, due to the drift of the phase bias of the intermediate frequency (IF) curves, the extraction of low-frequency signals is more difficult, leading to poor low-frequency sensing performance by φ-OTDR [
21].
The fading can usually be relieved by averaging various RBS traces over time directly for noise reduction [
22,
23]. As the noise floor decreases, SNR increases so that the φ-OTDR system can extract the vibration signal with more fidelity, even in fading areas. However, in conventional coherent φ-OTDR, the carrier signal inside the acoustic optical modulator (AOM), external modulation signal and data acquisition (DAQ) card trigger signals come from an independent oscillation source. Thus, every RBS trace has a different phase bias. In 2016, He et al. used a self-mixing signal demodulation scheme to eliminate the influence of phase bias drift but lacked the extraction of phases to restore changes in external disturbances [
24]. In 2017, an embedded pattern recognition method for φ-OTDR with analog down conversion and digital I/Q demodulation was proposed to classify and identify external disturbance events. Similarly, it could not avoid the phase bias drift and affected the accuracy of demodulation and pattern recognition [
25]. Then, a clock homologous I/Q demodulation based on phase-locking structure was proposed. However, the system only provided the clock homologous modulation signal of AOM and the chopper signal, which could not completely solve the problem of phase bias drift [
26]. In addition, the aim of this phase-locking structure was to eliminate the influence of residual frequency during phase demodulation rather than the negative influence of fading. Due to the drift of phase bias, the correlation between the RBS traces gradually decreased. Averaging the original heterodyne intermediate frequency (IF) curves did not provide much improvement on the SNR. Hence, it was difficult to directly average several IF signals for noise reduction to relieve fading.
In this paper, we present a novel, coherent φ-OTDR system based on a phase-locking structure. This structure provides a clock homologous carrier signal, a modulation signal and a DAQ trigger signal. The moving average method is taken on IF signals before phase demodulating to reduce the overall noise floor of the system. SNR in fading areas is improved for enhancement of phase demodulation fidelity. The proposed system is more tolerant to fading, which can provide higher accuracy for vibration reconstruction.
2. Principles of the Phase-Locking φ-OTDR
In a heterodyne detection coherent φ-OTDR system, the photocurrent,
, of a photo detector after band-pass filtering can be expressed as
where
and
are the electric field of RBS light and the optical local oscillator (OLO), respectively.
is the frequency shift provided by a modulator, and
is the phase of the RBS. We can simplify it to
where
is the magnitude of the IF electric field. The changes in the backscattered phase signal are extremely nonlinear [
27]. Hence, it is common to use the phase difference between two specific points for vibration sensing. The phase of RBS light is specific to the location along the fiber. We can extract phase signals in any zone along the fiber by selecting reference points before and after that area and analyze the phase changes between these two points.
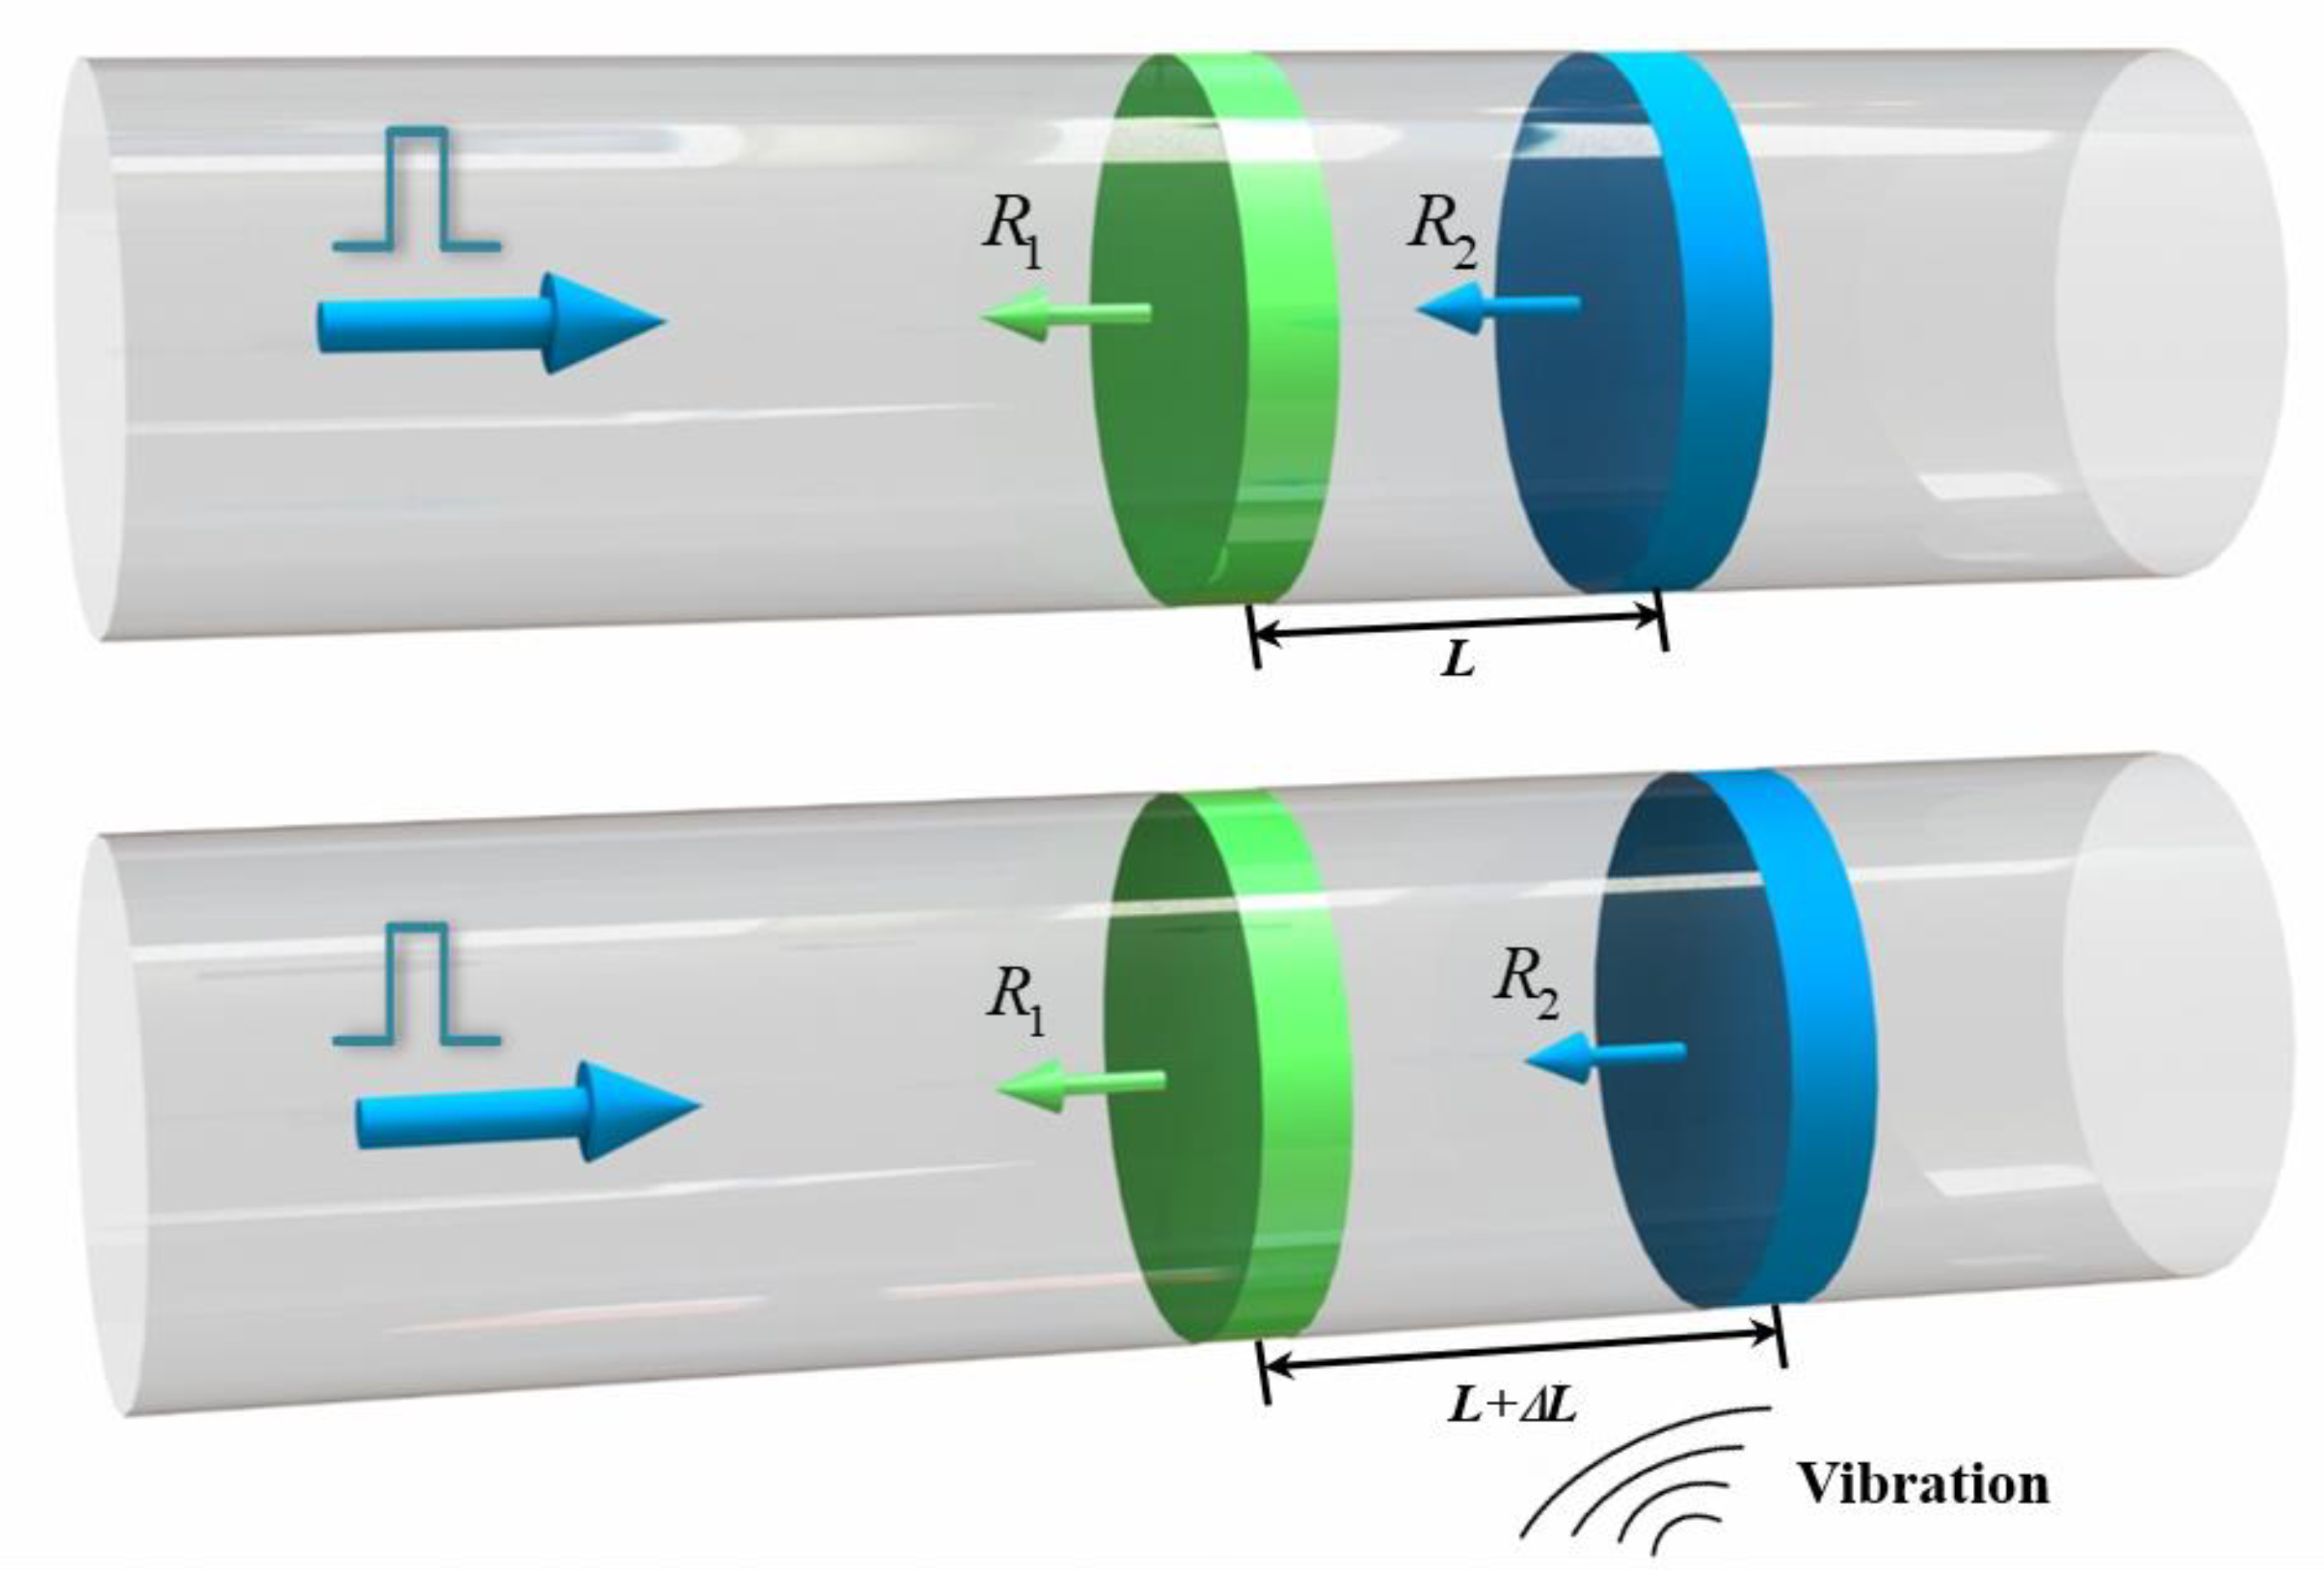
Figure 1 shows how an external vibration induces extra stress on the fiber and results in a change in the optical path length (OPL). Two segments of fiber,
and
, with an interval length of
L, are selected as the reference points. The length change
is directly related to the change in relative phase between these two segments. Any external vibration within segments
and
changes the phase of the RBS light. Therefore, any disturbance event that occurs with the two segments can be reconstructed by demodulating the phase difference
.
is the wavelength of optical pulse, and
n is the refractive index of the optical fiber.
Here, every IF signal trace can be directly sampled and quantized. Averaging is commonly used for reducing system noise to relieve fading. If a certain number of adjacent periods of IF signal traces are averaged, the overall noise power is decreased and SNR is greatly improved, according to the characteristics of random noise. Next, we introduce a moving average method to decrease the noise floor. Supposing that there are IF traces set of M samples:
where
represents the
th IF trace. If the window width of the moving average is N, the averaged traces set is
where
The current averaged result is the average value of th and the previous N-1 raw IF traces.
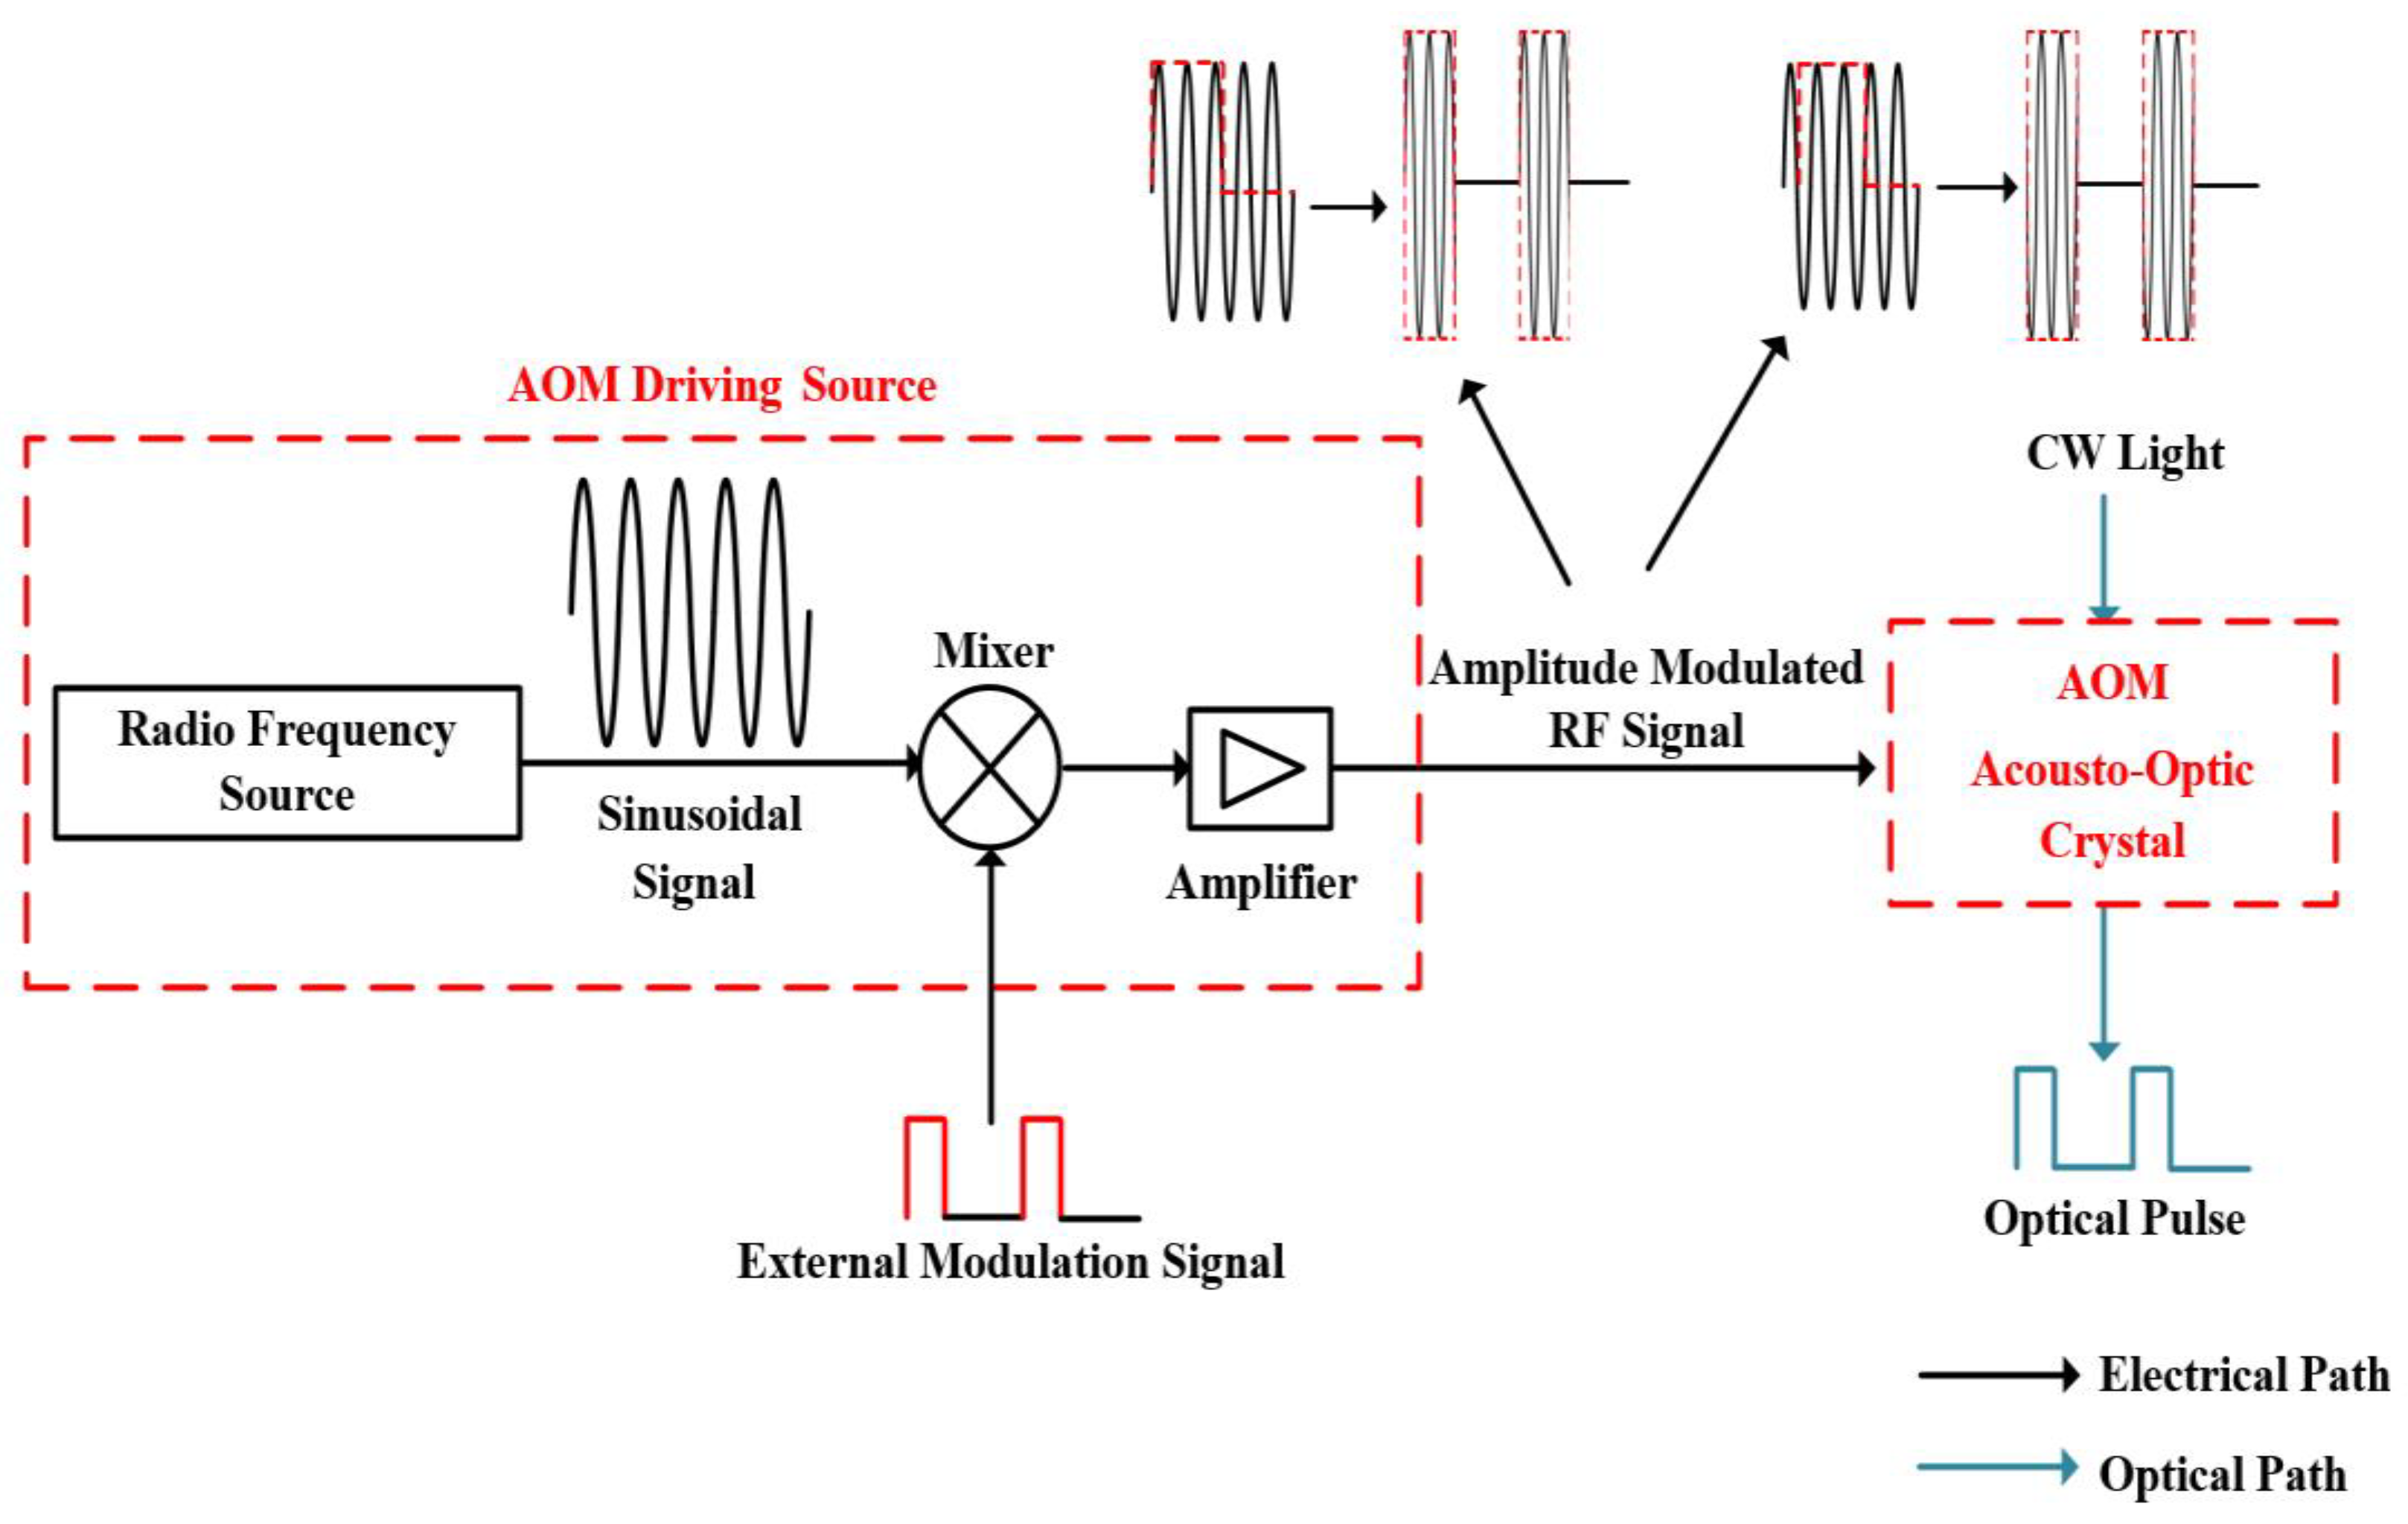
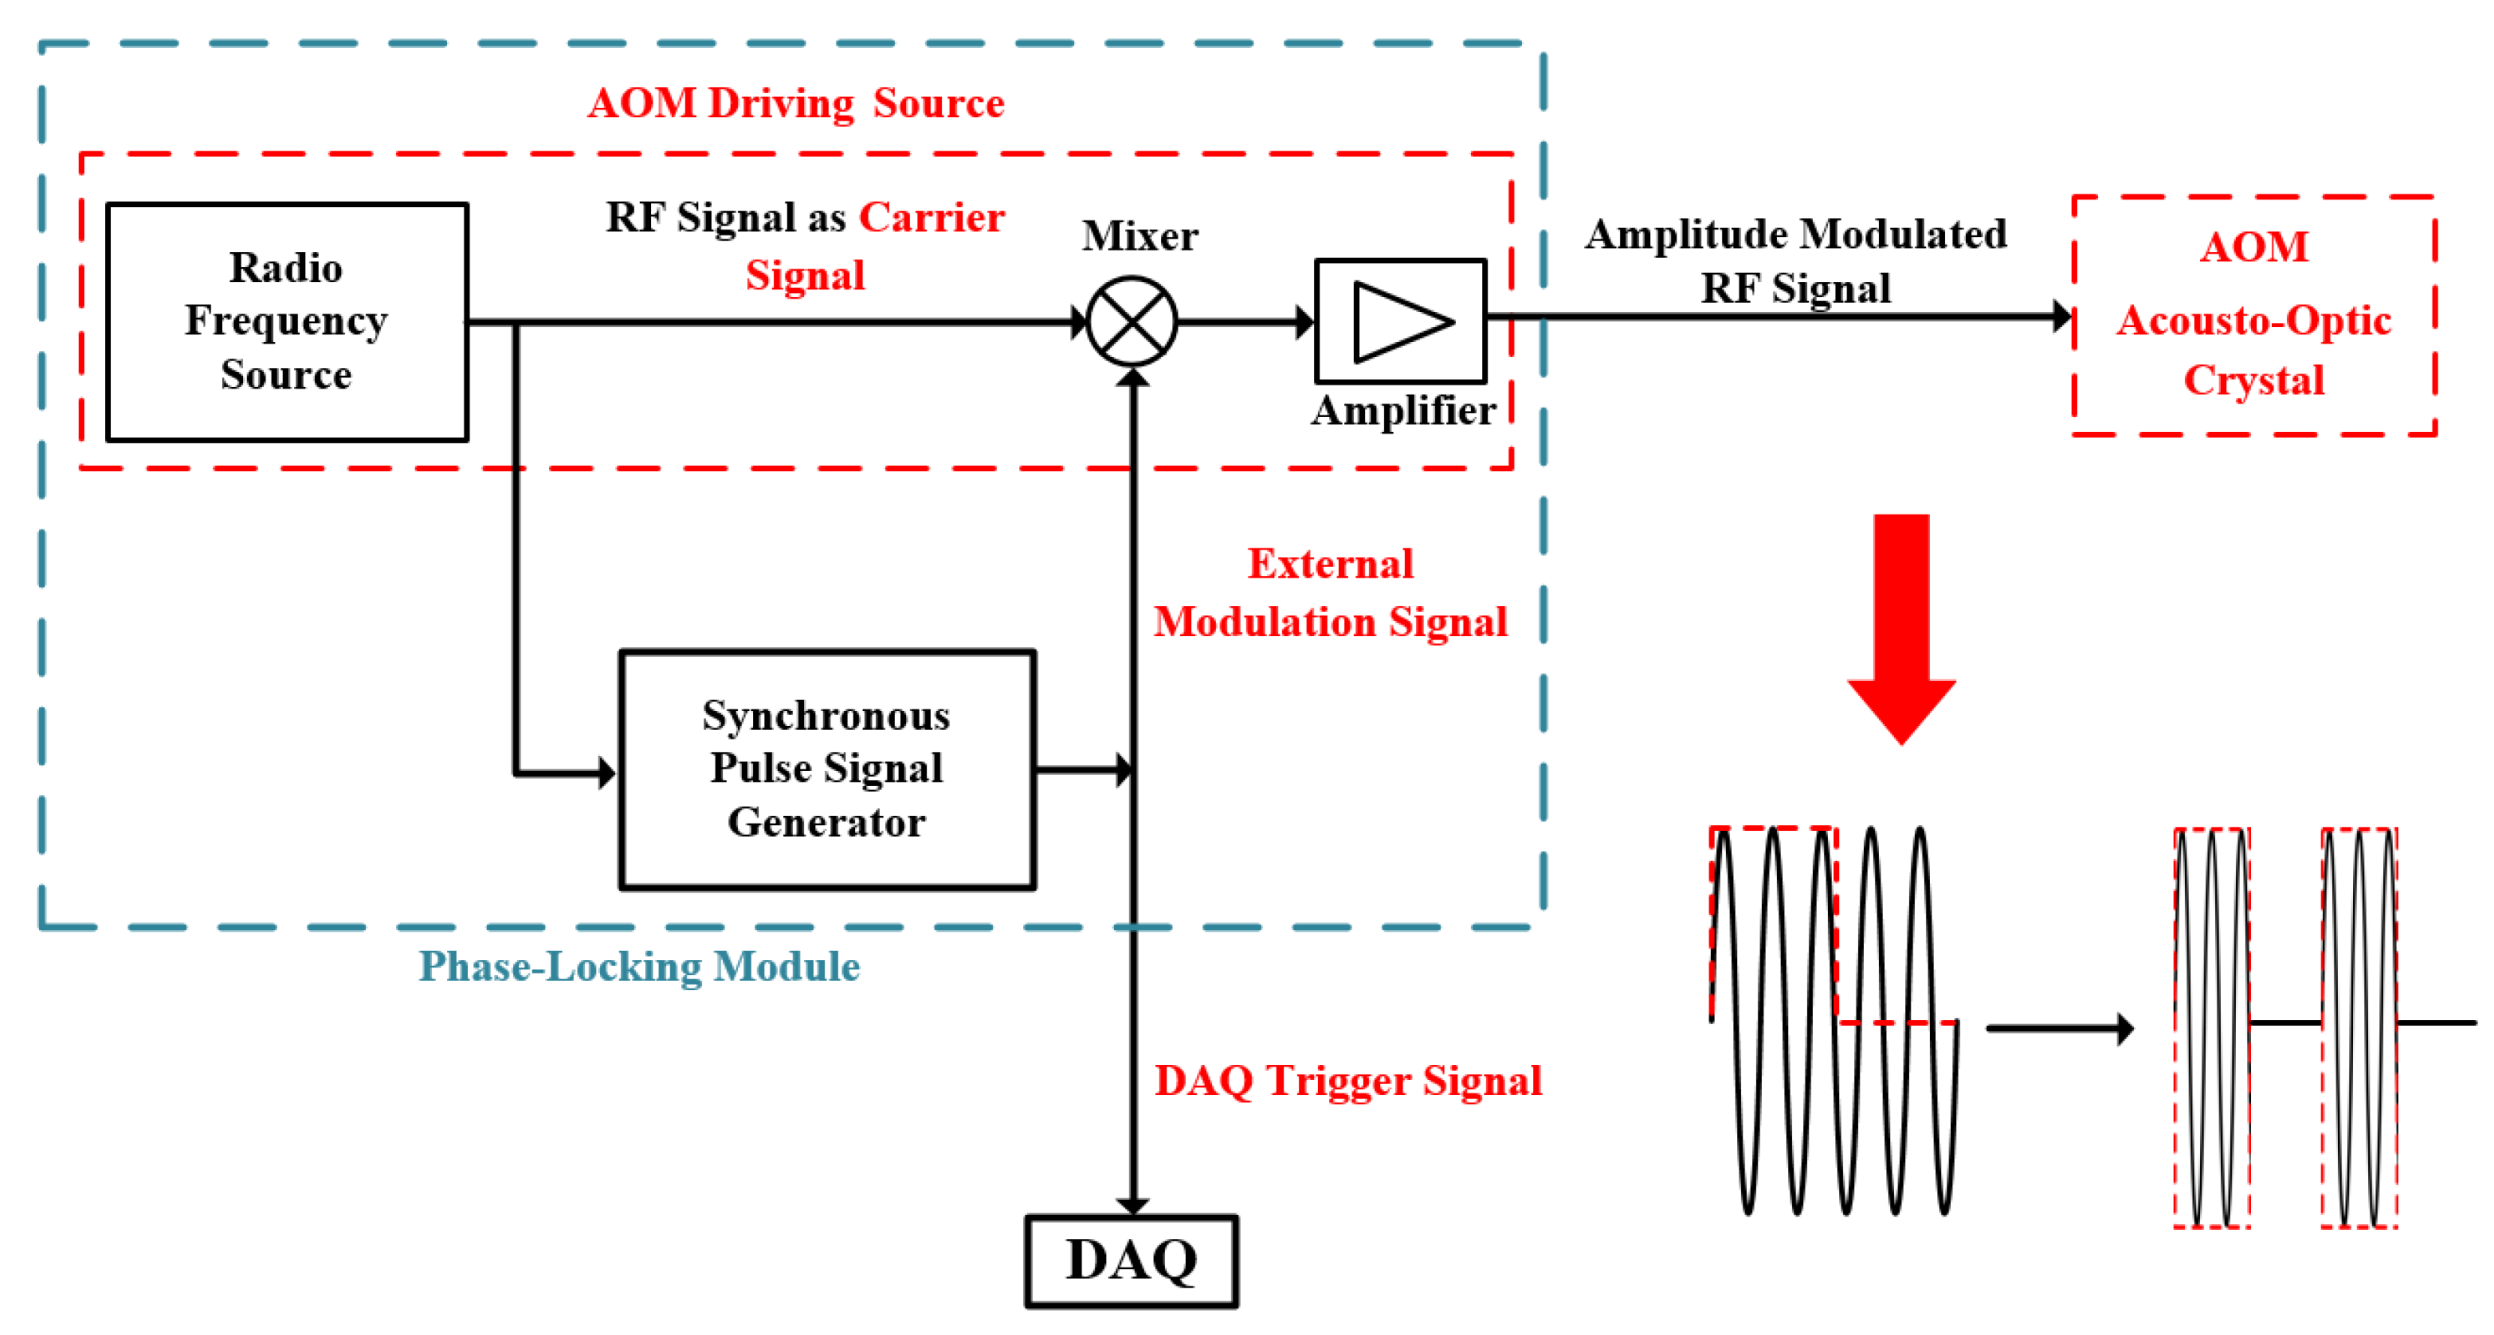
In a φ-OTDR system, AOM is a common modulator that shapes continuous-wave (CW) light into optical pulses, which consists of driving sources and acousto-optic crystals. The sinusoidal signal launched by the radio frequency (RF) source inside the driver is multiplied with the external modulation signal through the RF mixer to output the electrical acousto-optic modulated driving signal, which is the chopper for the sinusoidal signal. By applying a periodical on/off external modulation signal to the AOM diving source, an amplitude-modulated (AM) RF signal with a pulse envelope can be generated and then gained by an amplifier to increase its power level for driving the acousto-optic crystal. The AM RF signal is then converted into ultrasonic field changing within the acousto-optic crystal due to the acousto-optic effect [
28], as shown in
Figure 2. The refractive index of the acousto-optic medium changes as the sound field changes, and the power of the output optical signal also changes accordingly.
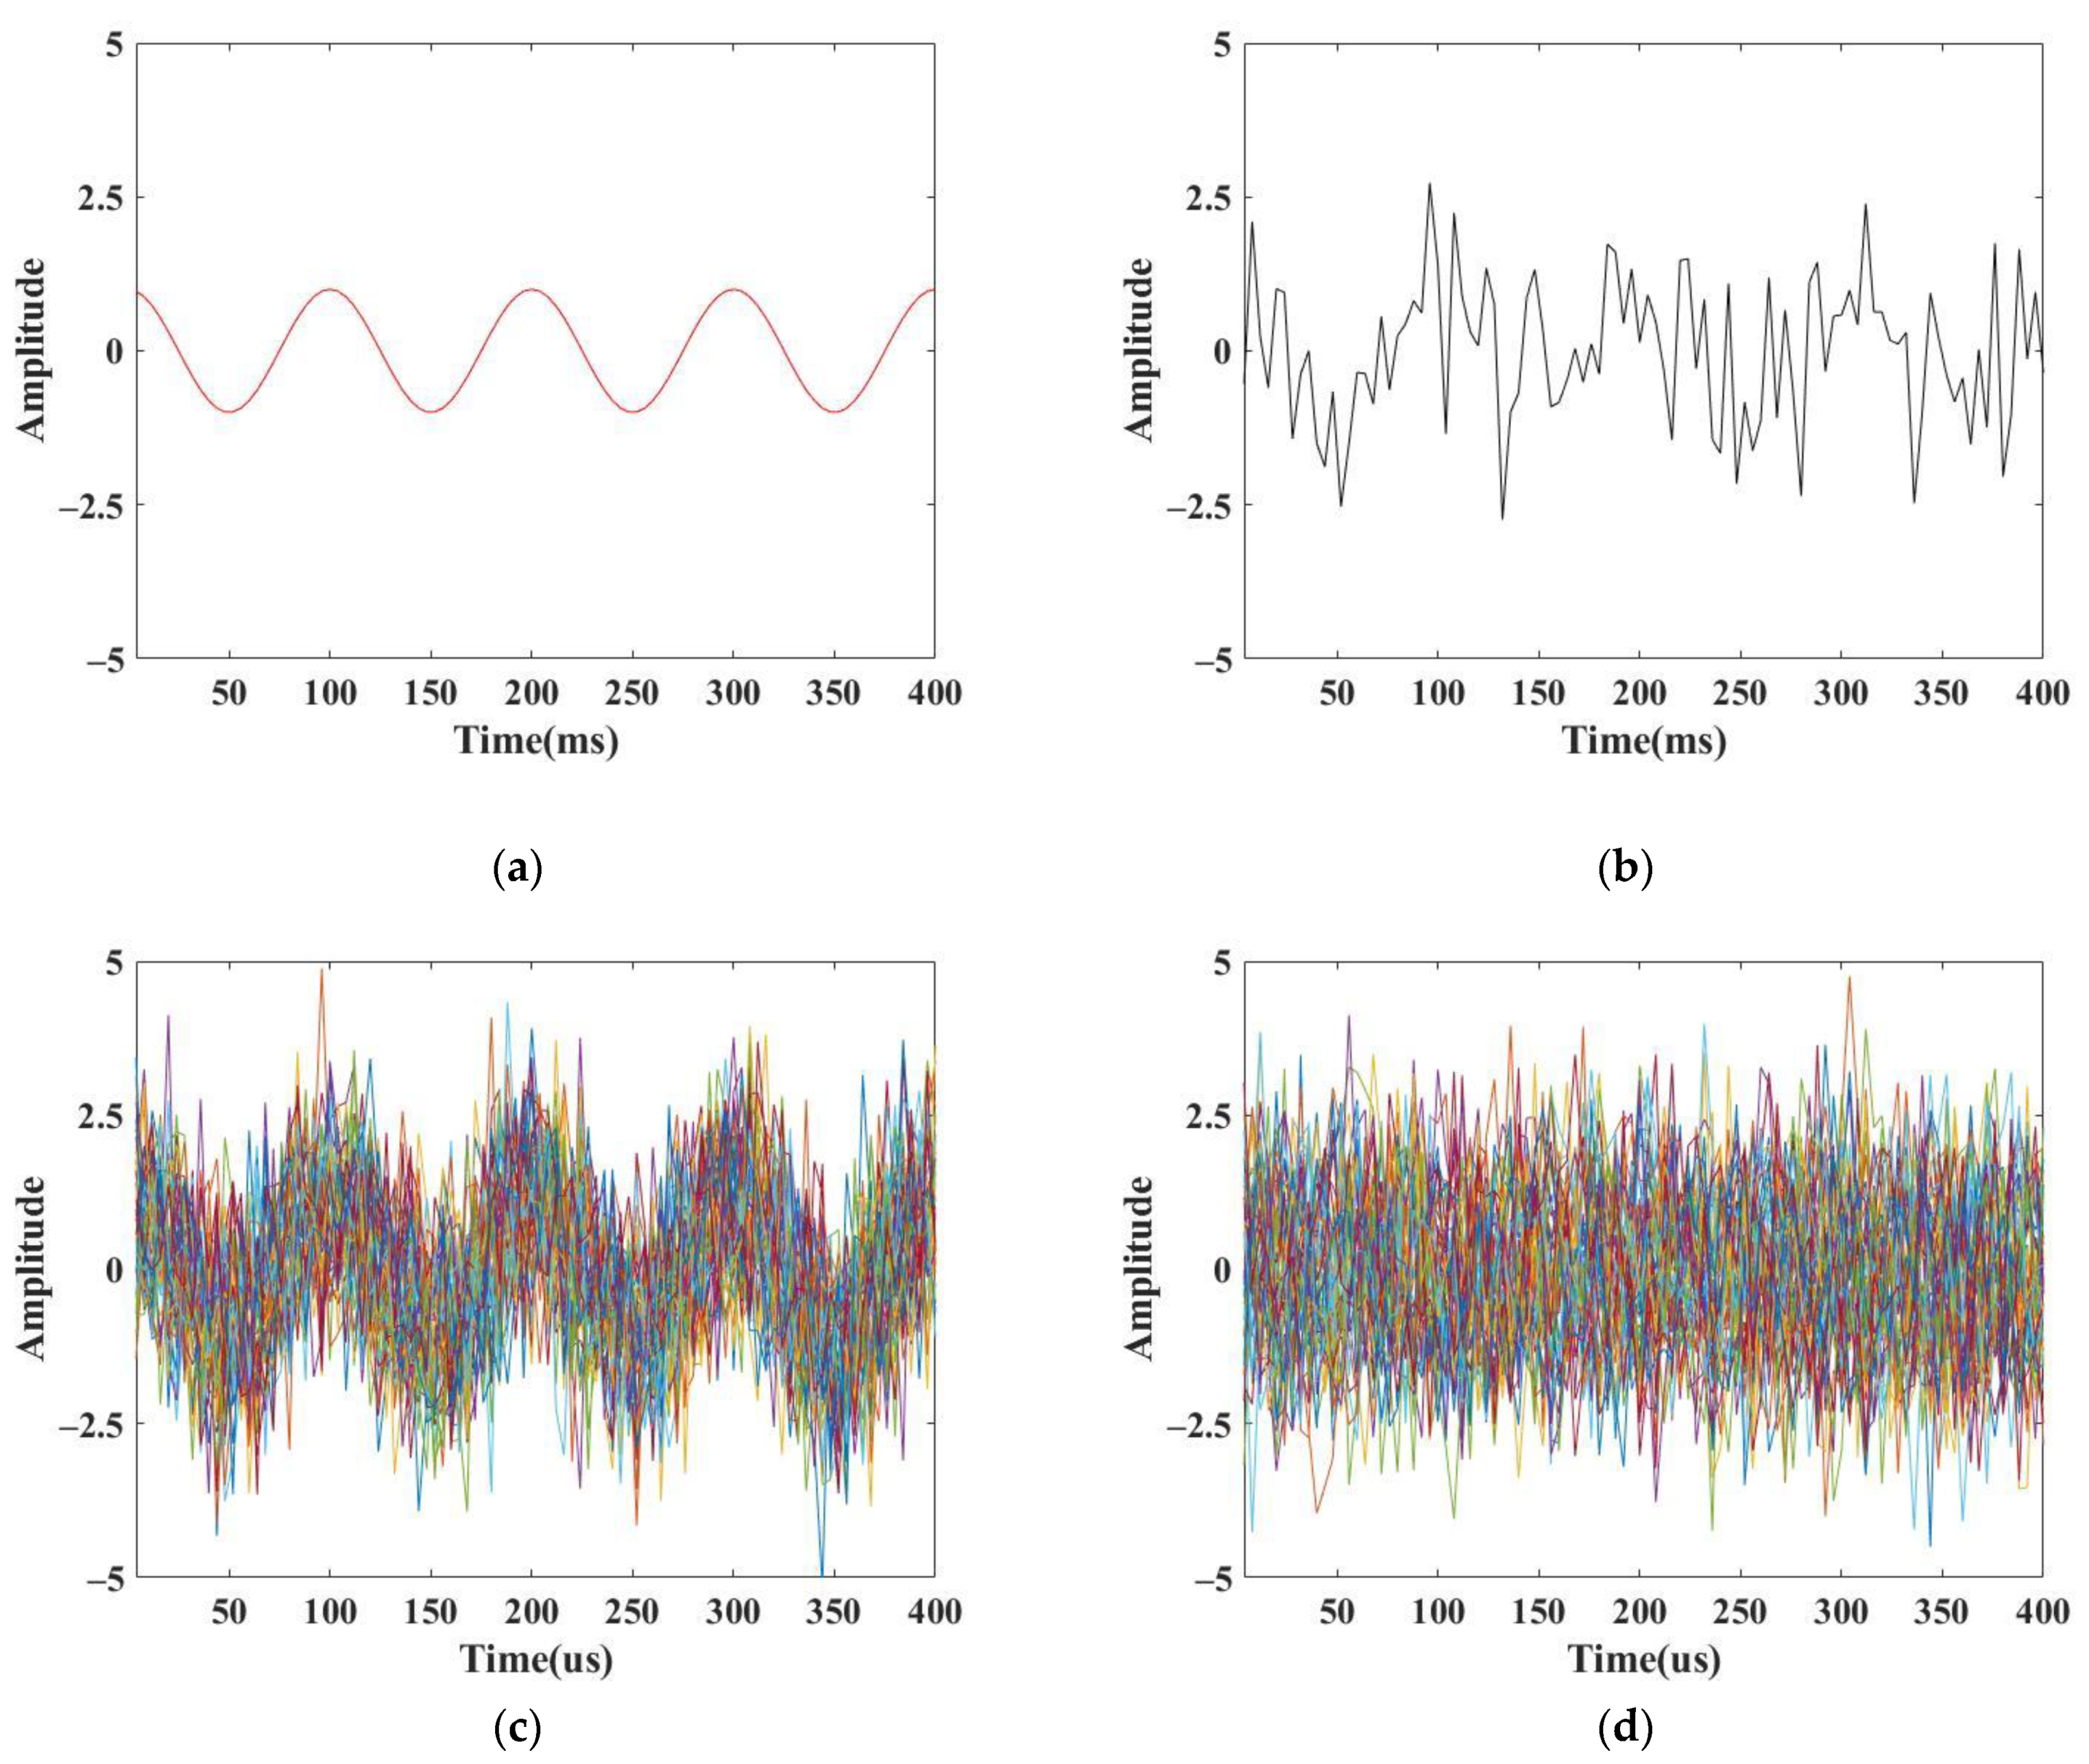
However, since the carrier signal, external modulation signal and DAQ trigger signal come from an independent oscillation source, each optical pulse has a random initial phase bias, so that every IF signal trace also has a different initial phase bias that varies over time. The initial phase bias changes continuously so that the correlation between several consecutive IF traces decreases with time. The weak correlation was verified by simulation. Two groups of sinusoidal signals with random noise were constructed to simulate the reference signals, and the SNR of that was −5 dB. One group represented the signals with the same initial phase bias, and the other group contained a continuously changing phase bias between adjacent periods. Simulation results for these two groups (each group included 50 curves) of sinusoidal signals with averaging are shown in
Figure 3. Every curve was generated for 400 ms at a 250 M/s sampling rate.
Figure 3a,b represent one trace of a simulated sinusoidal signal with random noise.
Figure 3c shows that with the same initial phase bias, the correlation between several consecutive traces is strong. Although the SNR is not good, we can see that all traces show similar shapes. Conversely, the correlation with the continuously changing phase bias is weak so that the supposition of nearby traces is totally mussed, as shown in
Figure 3d. After averaging, the result of the first group still has a sinusoidal shape, as shown in
Figure 3e, while the amplitude of the averaging result for the second group is degraded. From
Figure 3, it can be concluded that if the curves with weak correlation are averaged, the intensity will be too low to acquire a good SNR.
In order to express every IF signal trace with the same phase bias and considering the influence of noise, Equation (2) could be rewritten as
where
and
is the
ith IF signal trace,
is amplitude of the effective signal and
is overall noise and fluctuates randomly. Therefore, SNR before averaging is
where
is the variance of noise.
If the averaging number is
N, the averaged IF signal is
Then, the mean variance of noise after averaging is
Therefore, SNR after averaging is
In ideal conditions, SNR can be increased by N.
To make it possible to directly move the average on the nearby IF signals, the initial phase bias must be kept the same. Therefore, a phase-locking structure is proposed, as shown in
Figure 4. The RF source generates a RF signal and launches it into the mixer and the synchronous pulse signal generator, respectively. The synchronous pulse signal generator takes it as a clock trigger signal so as to generate an external modulation signal and a DAQ trigger signal. The RF signal and the external modulation signal are mixed by the mixer and passed through to form the AM RF signal. This structure makes it possible for the carrier signal, modulation signal and DAQ trigger signal to be synchronized so that the initial phase bias of every IF signal is the same. Therefore, this phase-locking structure provides a clock homologous carrier signal, a modulation signal and a DAQ trigger signal.
3. Experimental Setup
The proposed phase-locking coherent φ-OTDR is shown in
Figure 5. A narrow, line-width CW laser (HAN’s Laser Module) was used as the light source, whose center wavelength and linewidth were 1550 nm and 15 kHz, respectively, and its output power was 15 dBm. The CW light was split into two paths, a sensing path and an OLO path, through a 90:10 optical coupler (OC1). AOM shaped the sensing light into a narrow optical pulse with a frequency shift
of 200 MHz. The optical pulse had a repetition rate of 1 kHz, and the pulse width was 100ns. An erbium-doped fiber amplifier (EDFA) amplified the optical pulse to enhance intensity and launched it into the sensing fiber via a circulator. A cylindrical PZT (piezoelectric transducer) actuator, which was stimulated with a low-frequency sinusoidal wave, was implanted at the end of a 220 m sensing fiber. The length of fiber wrapped on the PZT was about 40 m. The driving voltage range in our experiment was 2 V, so that the PZT was stretched by 11.2 nm in the axial direction and by 7.22 nm in the radial direction. Then, the other 370 m fiber was located on the far end of the sensing fiber. The RBS returning from the sensing fiber was combined with OLO light through a 50:50 optical coupler (OC2) for beating. A balanced photoelectric detector (BPD) with a 350 MHz bandwidth converted the beat frequency optical signal into an electrical signal while eliminating DC and common components, which was recorded using a data acquisition card with a 1.25 GHz/s sampling rate. In our experimental system, the spatial resolution was less than 40 m, and the sensing distance was about 700 m. Since we were mainly demonstrating phase-locking structures, we did not pay attention to the spatial resolution and the sensing distance. In practical applications, these two parameters could be better.
According to the phase-locking module structure described in
Figure 4, we customized a phase-locking module to provide a driving signal for the AOM crystal and the trigger signal for the DAQ card respectively. In order to experimentally verify the difference of phase extraction between the phase-locking φ-OTDR and conventional φ-OTDR, we also used the traditional AOM driver and temporarily disconnected the transmission of the synchronous signal source to the DAQ card. In this situation, the DAQ card and the driver source worked separately with their own reference source. With the experimental setup shown in
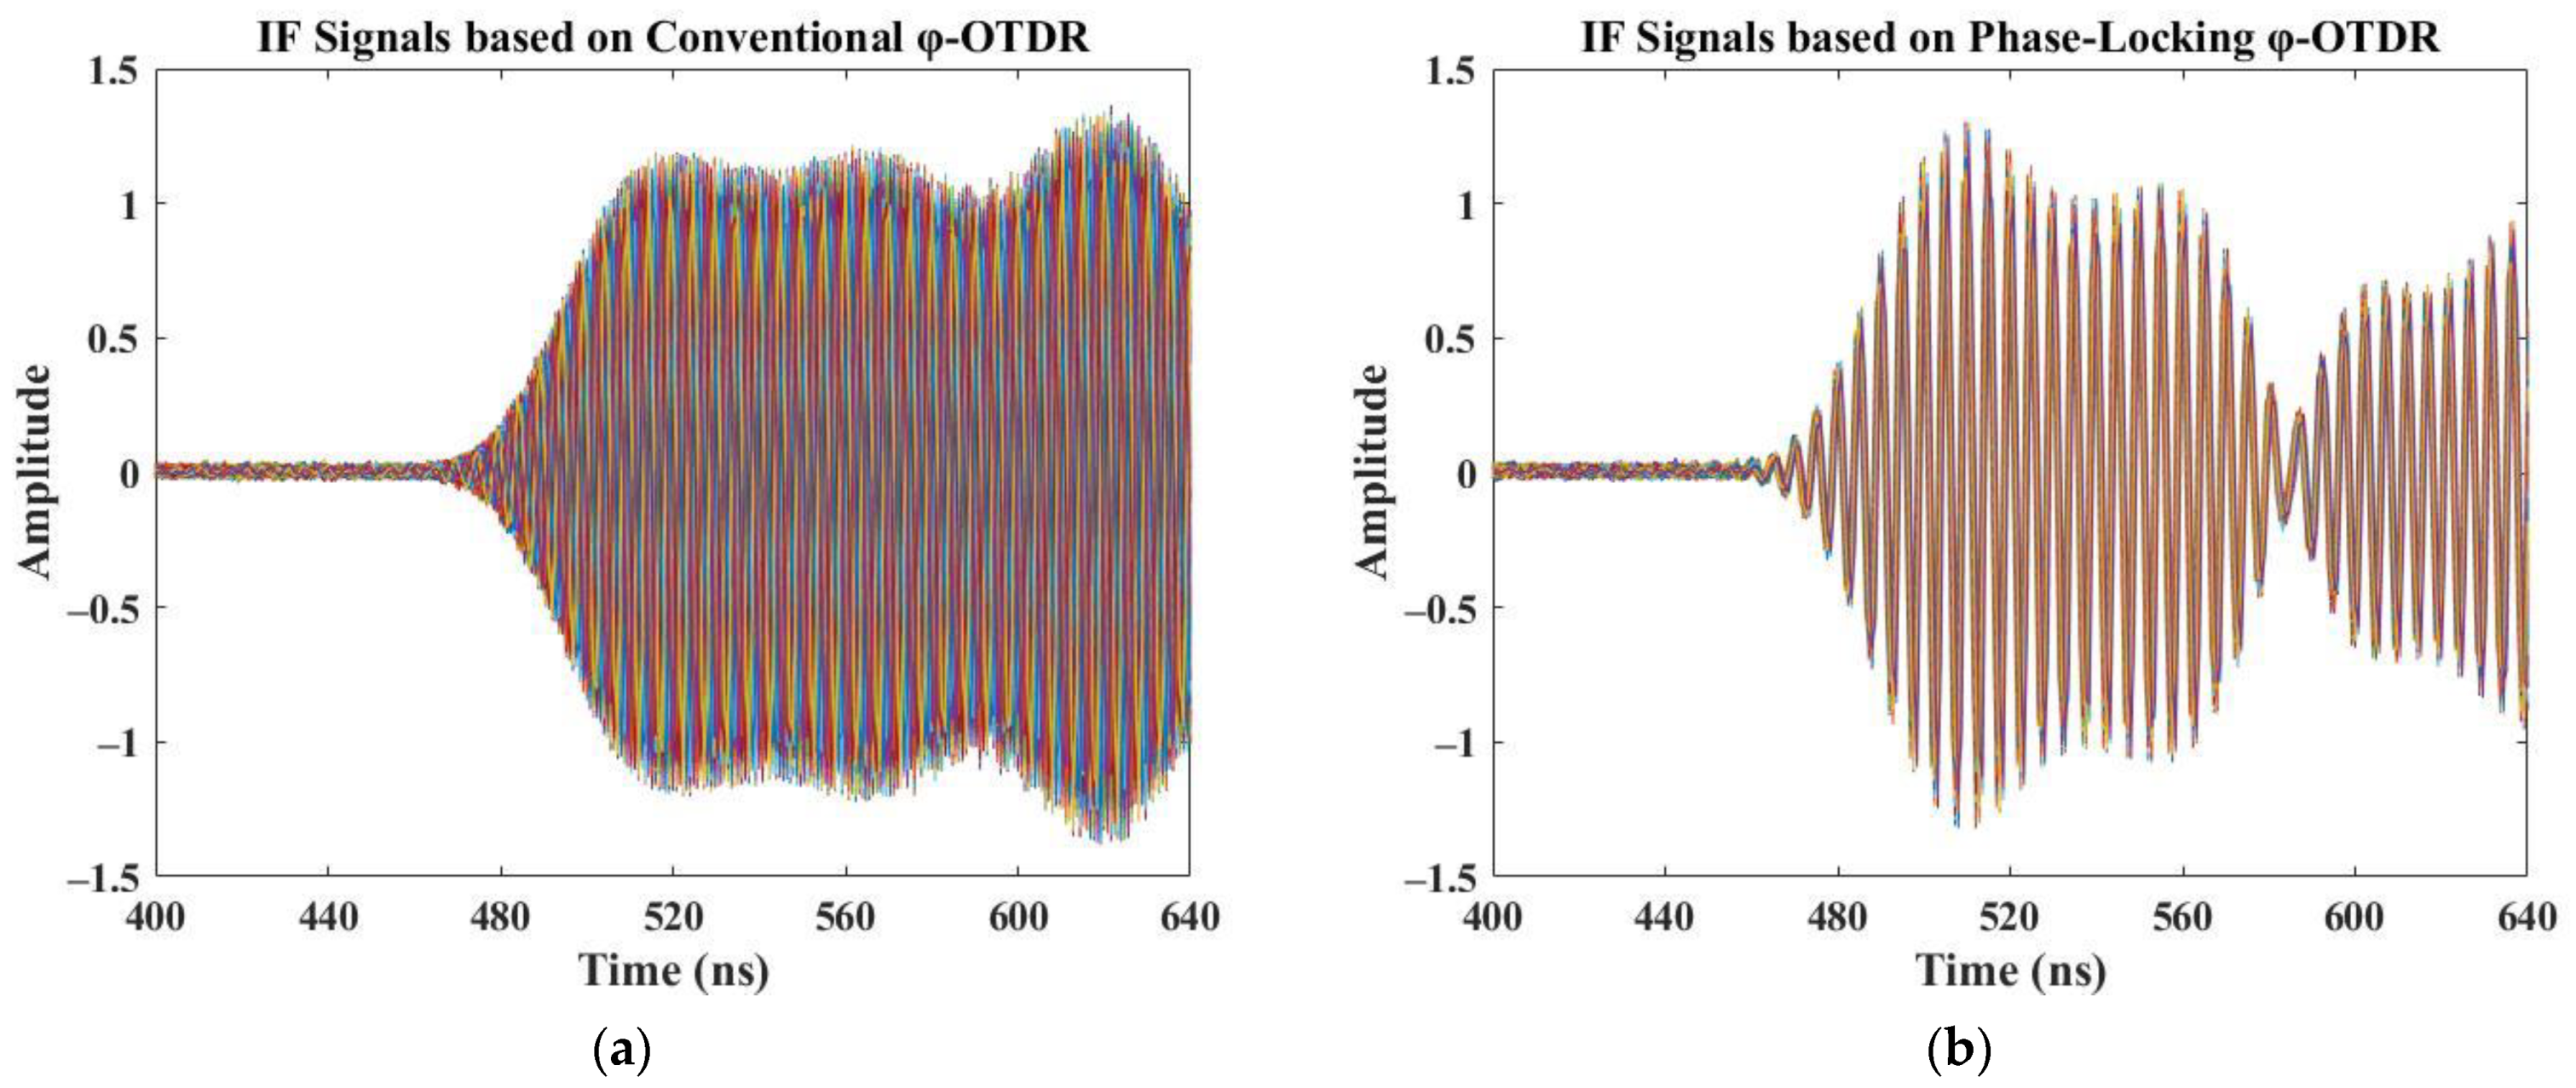
Figure 5, we recorded the original IF signal traces from the conventional and the phase-locking φ-OTDR, respectively. Data from both setups were collected continuously for 200 periods, which corresponded to 0.2 s, as shown in
Figure 6. The curves were disorderly, and their initial phase bias was changing randomly as shown in
Figure 6a. On the other hand, every IF trace from the phase-locking structure also had the same initial phase bias as shown in
Figure 6b.
To test and evaluate the coherent φ-OTDR system based on a phase-locking structure with a direct averaging method, we applied a 1 Hz sinusoidal driving signal on the PZT to create low-frequency vibration on the sensing fiber. We demodulated the amplitude and phase of the IF recorded signals and drew the waterfall diagram of the amplitude of the signals for 25 s in a specific part of the testing fiber, as shown in
Figure 7. Warm color stands for high amplitude, while cool color areas present low amplitude, which forms the fading areas. The numerical range on the color bar indicates the amplitude voltage range is 0–2 V. The amplitude of RBS dropped into the fading areas is usually low; therefore, a reference point with a weak amplitude has a great probability of fading, so we picked the cool color positions A and B, respectively before and after the PZT, to retrieve the induced sinusoidal vibration signal form phase signal. Then, a comparison on the fading tolerance between the conventional and phase-locking φ-OTDR schemes could be carried out.
The moving average method can be regarded as a low-pass filter. Then, the relationship between the number of moving average filtering points and the cutoff frequency can be written as
where
is the repetition rate of the optical pulse,
is the cutoff frequency and
N is the number of moving average filtering points. Since the fundamental frequency of the vibration signal is 1 Hz, we keep the
larger or at least equal to 4.4 Hz for performance evaluation [
29] by tuning the
N from 0 to 100 under 1 kHz of
.
4. Results and Discussion
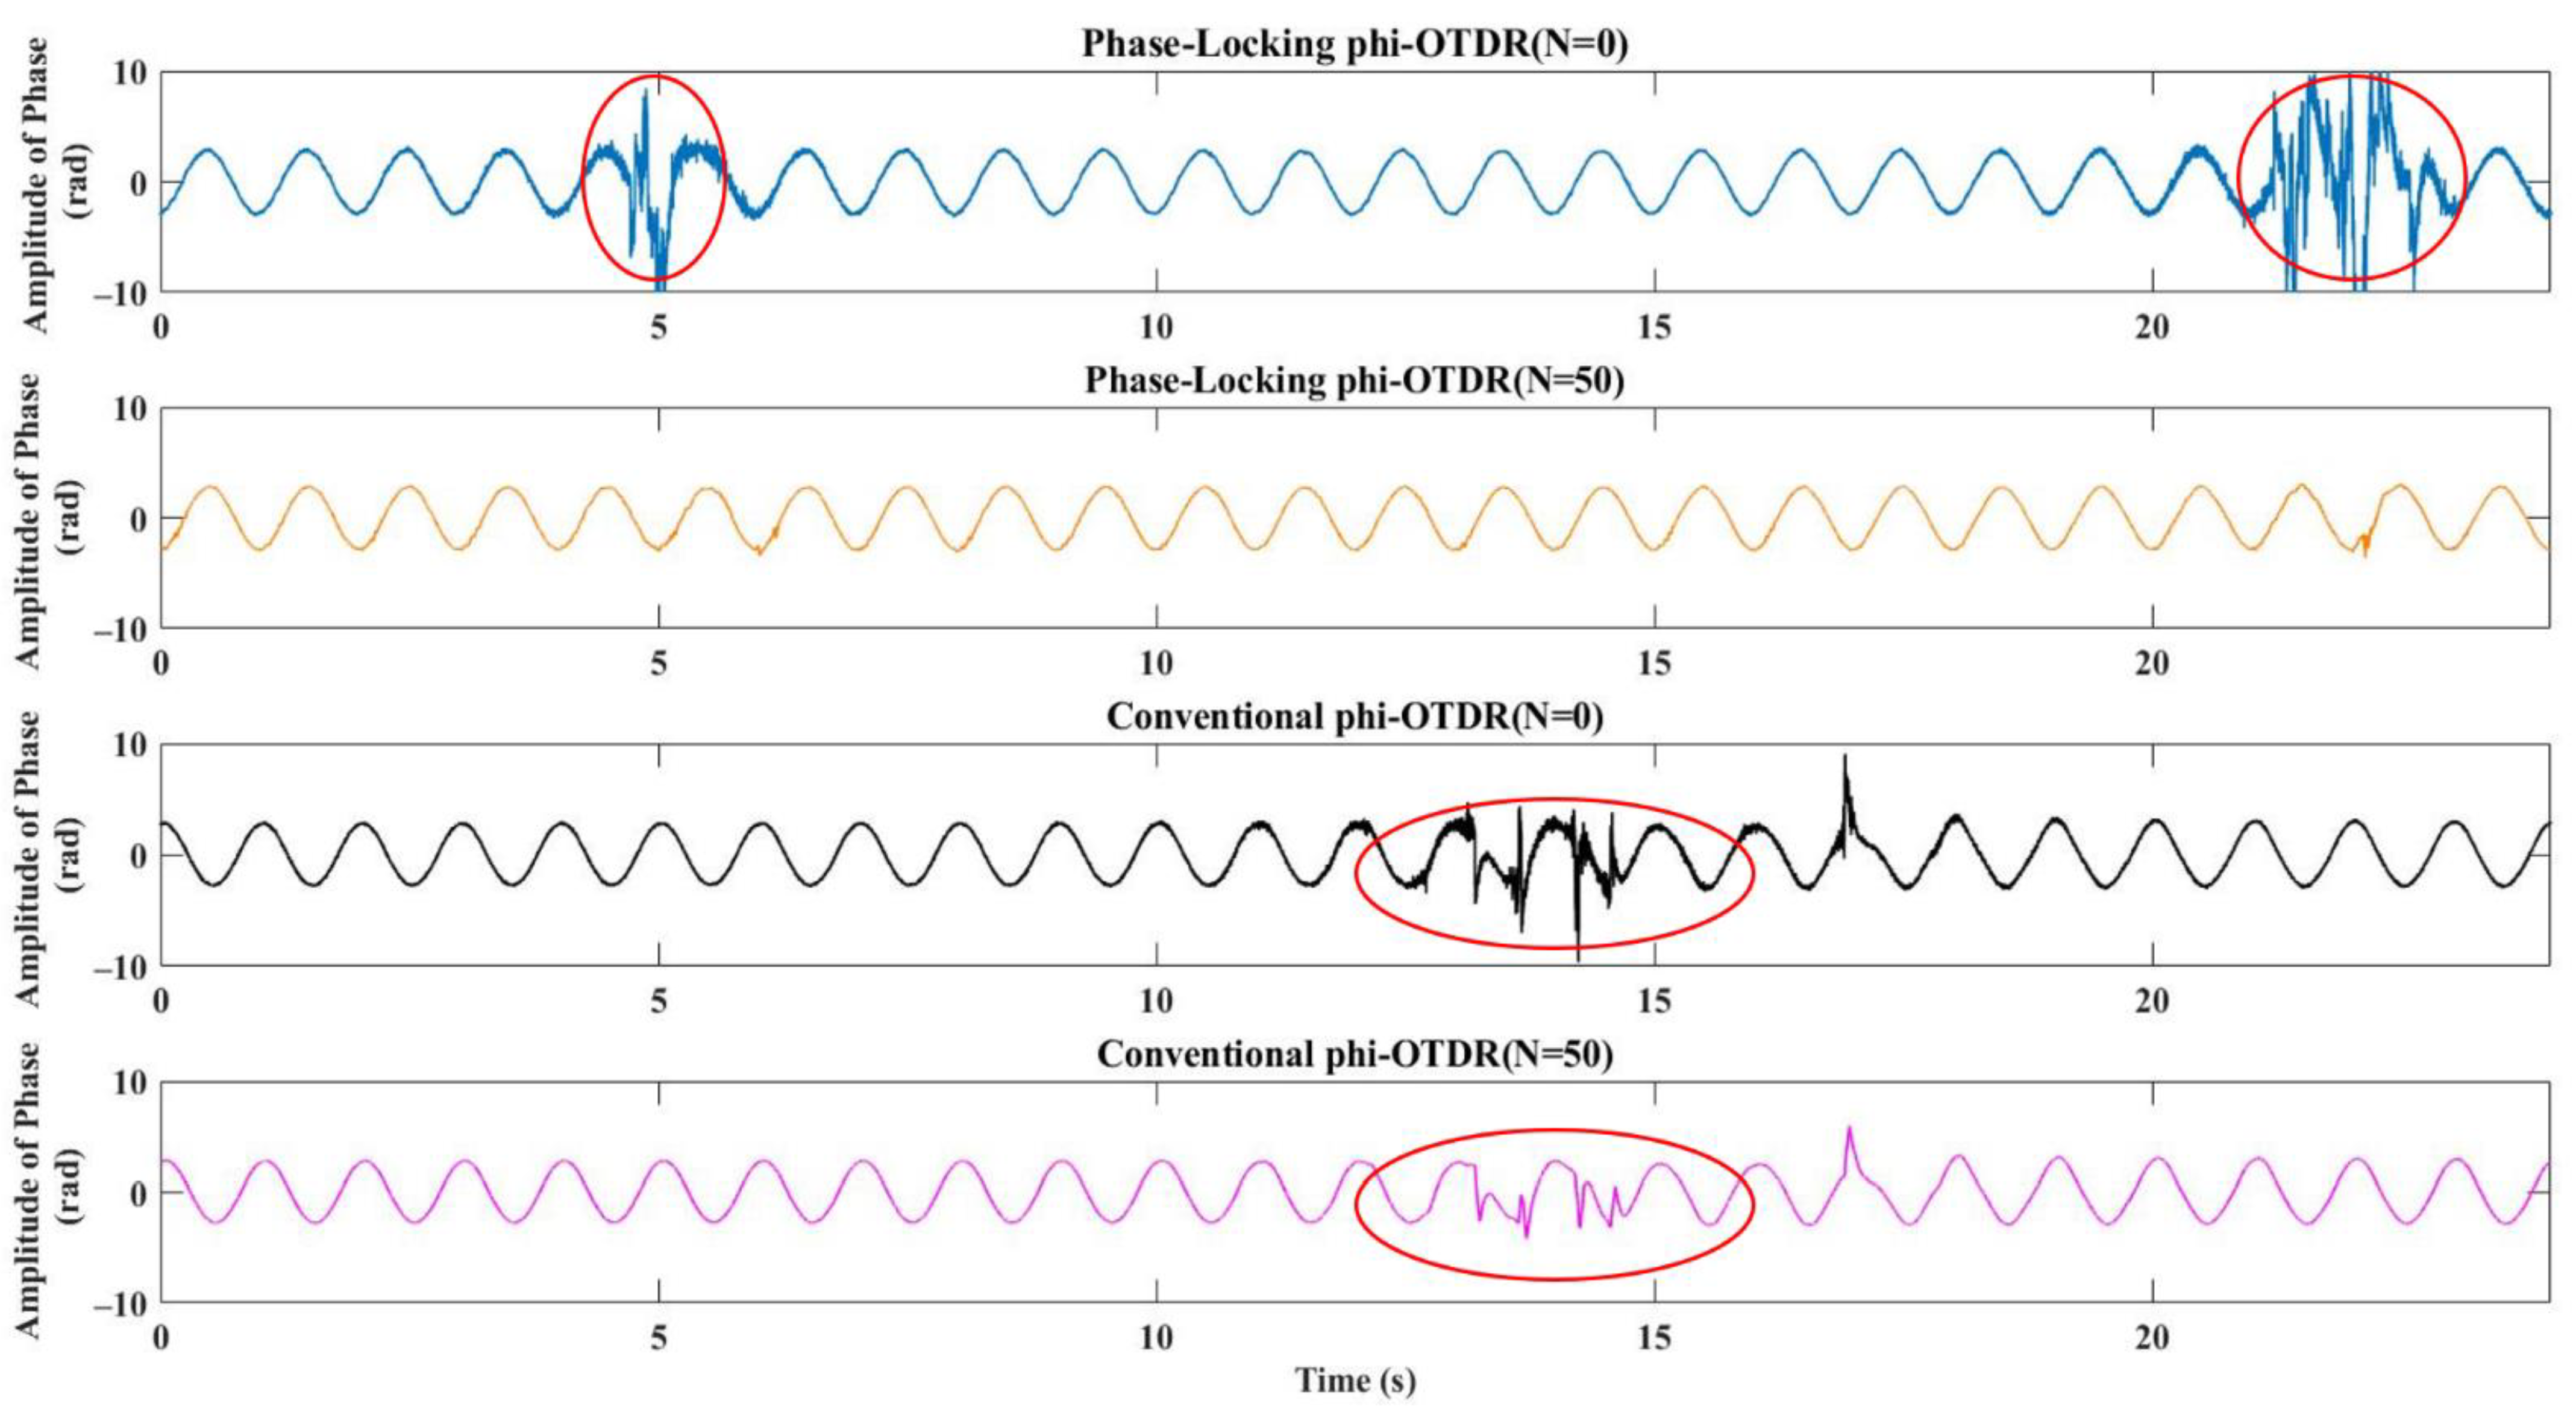
Figure 8 illustrates the waveforms of the reconstructed vibration signals of approximately 24 s from the conventional and phase-locking φ-OTDR with different
N, respectively. Because of fading, there were significant errors in the vibration signal reconstruction. In phase-locking coherent φ-OTDR, as
N changed from 0 to 100, according to the experiment, the best reconstructed signal was obtained when
N = 50. Significantly, phase demodulation errors caused by fading were corrected. The vibration signal was well reconstructed. Moreover, it is common to smooth the final phase signal using the moving average method after phase demodulating in conventional coherent φ-OTDR. However, it would be difficult to overcome errors caused by fading even with 50 times averaging. The last two waveforms respectively describe the phase results before and after averaging with the same window width in a conventional coherent φ-OTDR system. Obviously, errors in phase demodulation cannot be removed completely.
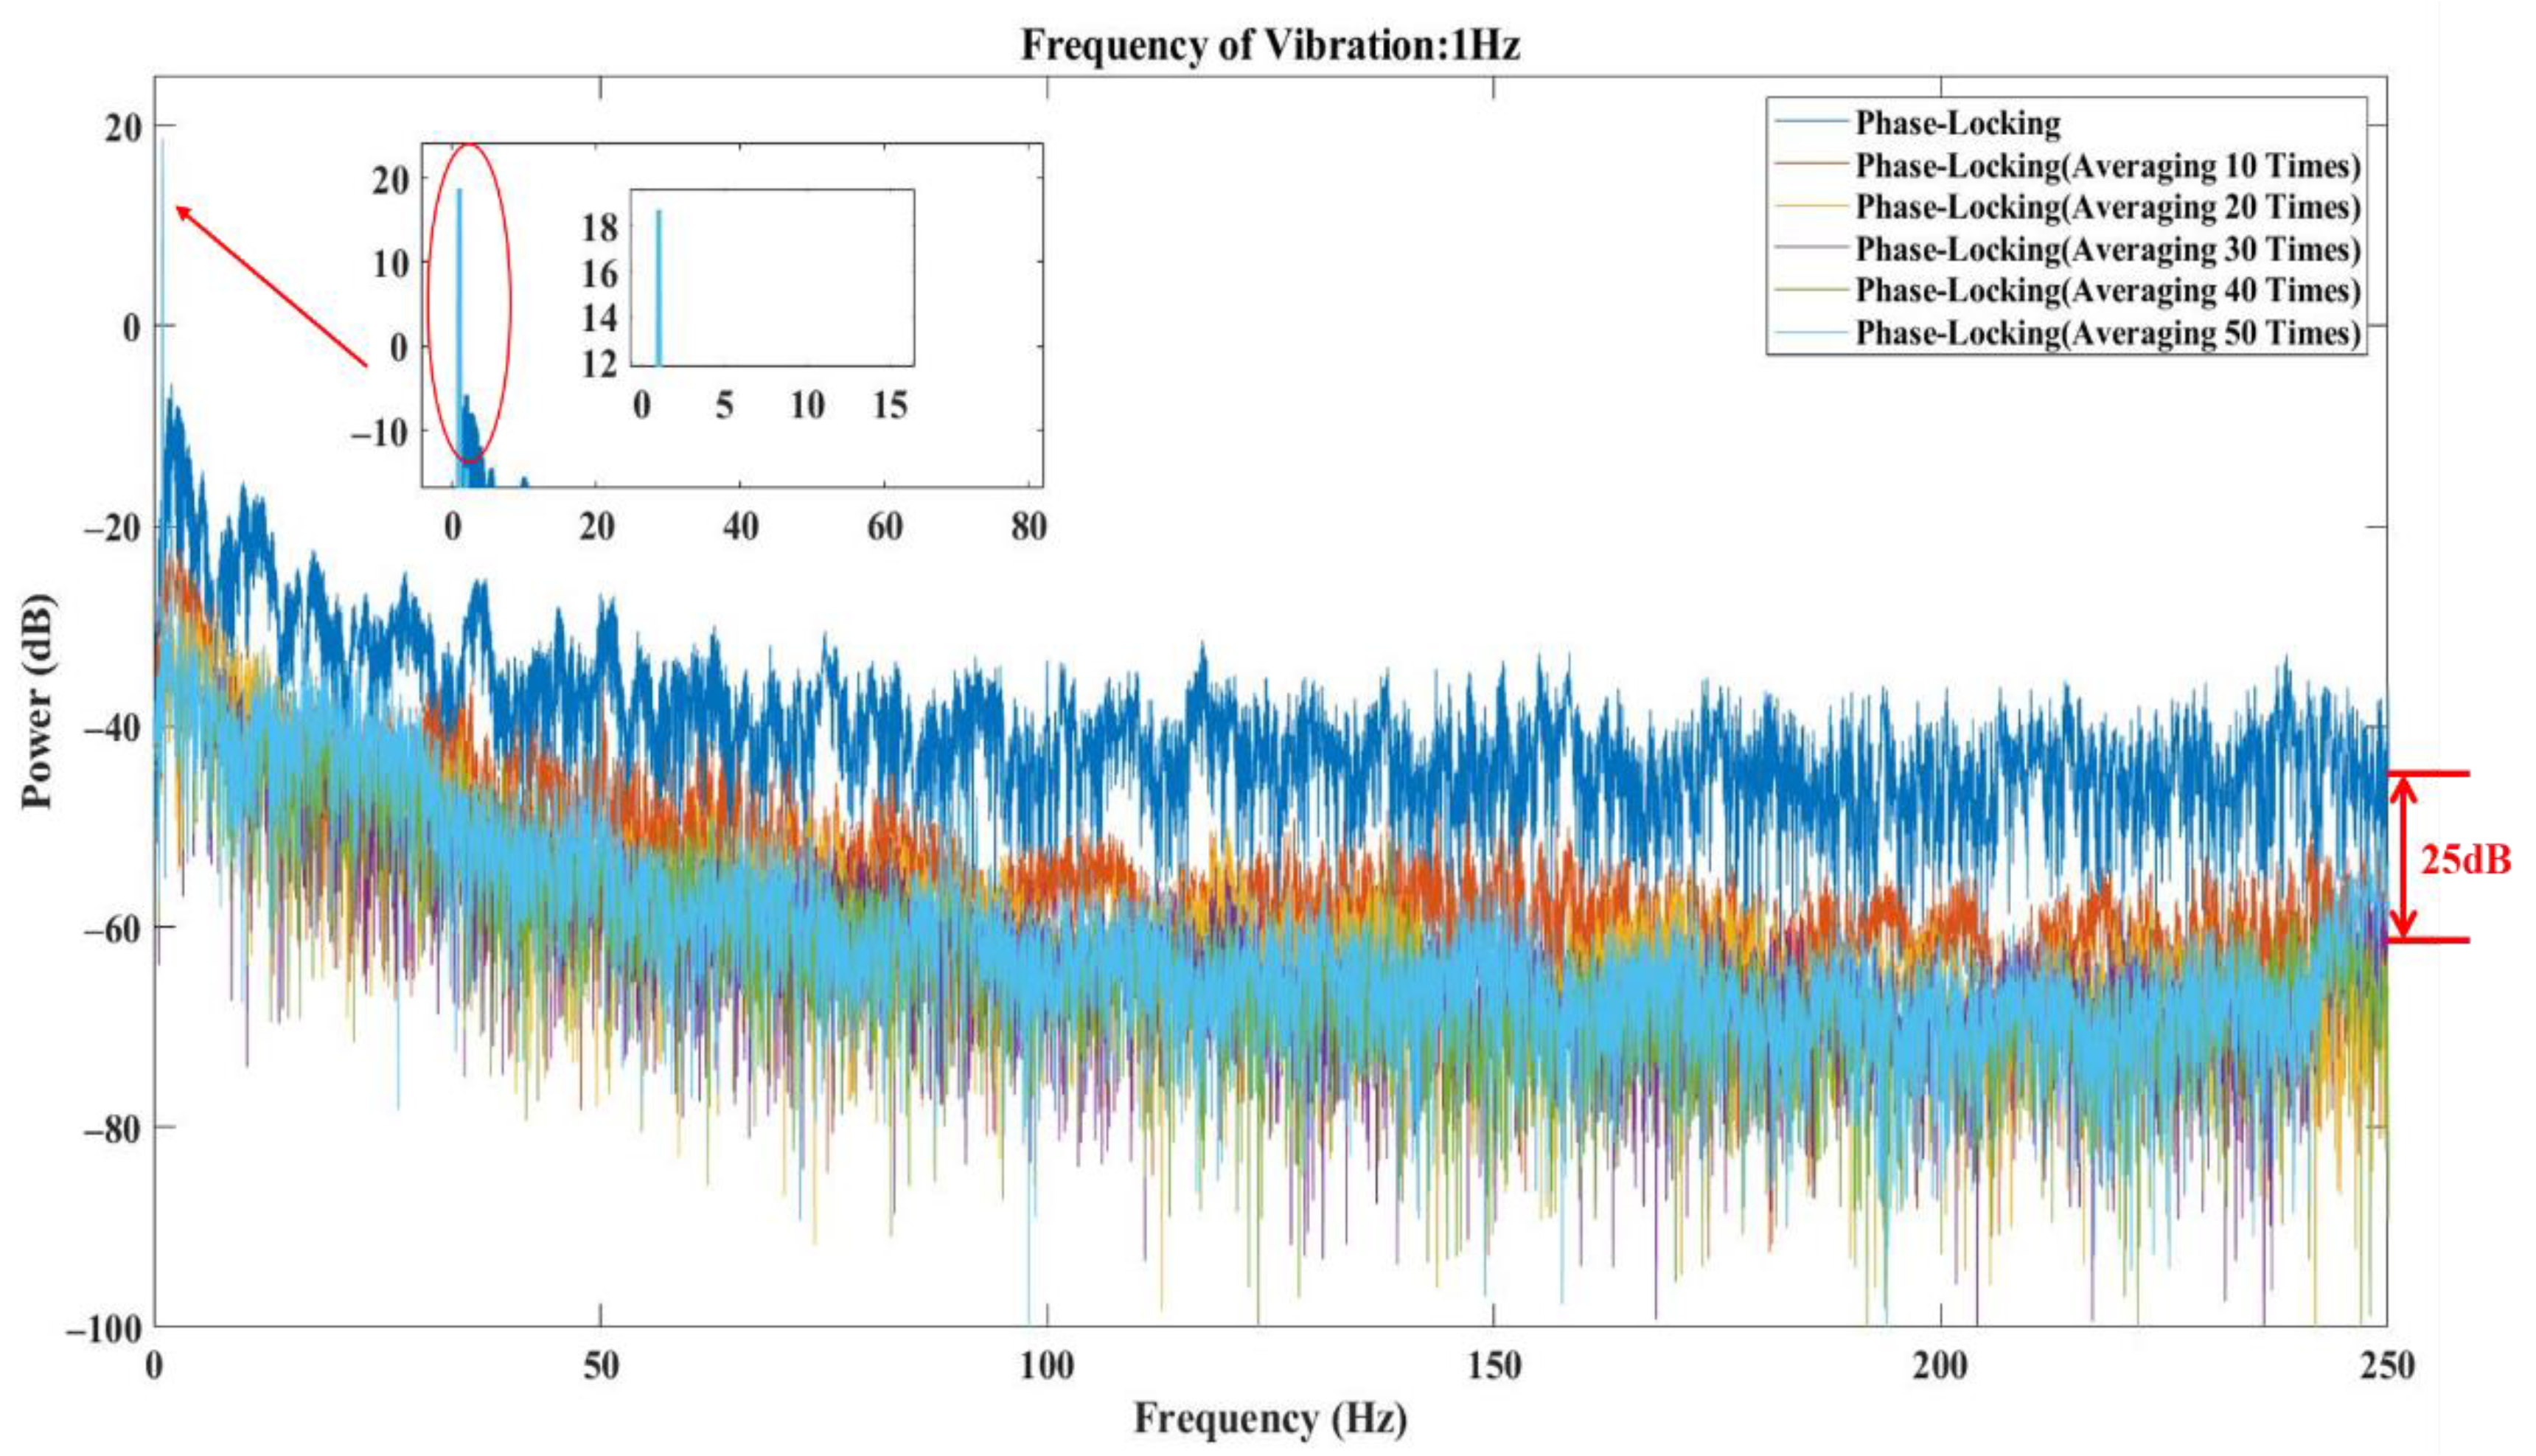
To evaluate the performance the phase demodulation results under different schemes and averaging numbers, we obtained the power spectrums through Fourier transformation of the time domain demodulation result, as shown in
Figure 9. The level of the noise floor could be reduced by nearly 25 dB, and the vibration at 1 Hz could be significantly distinguished. For the repetition frequency of 1 kHz, the moving averaging method with window width
N = 50 applied to the IF traces of adjacent periods improved SNR to a great extent and eliminated the negative effects of phase demodulation errors introduced by fading, especially for measurements on low-frequency bands.
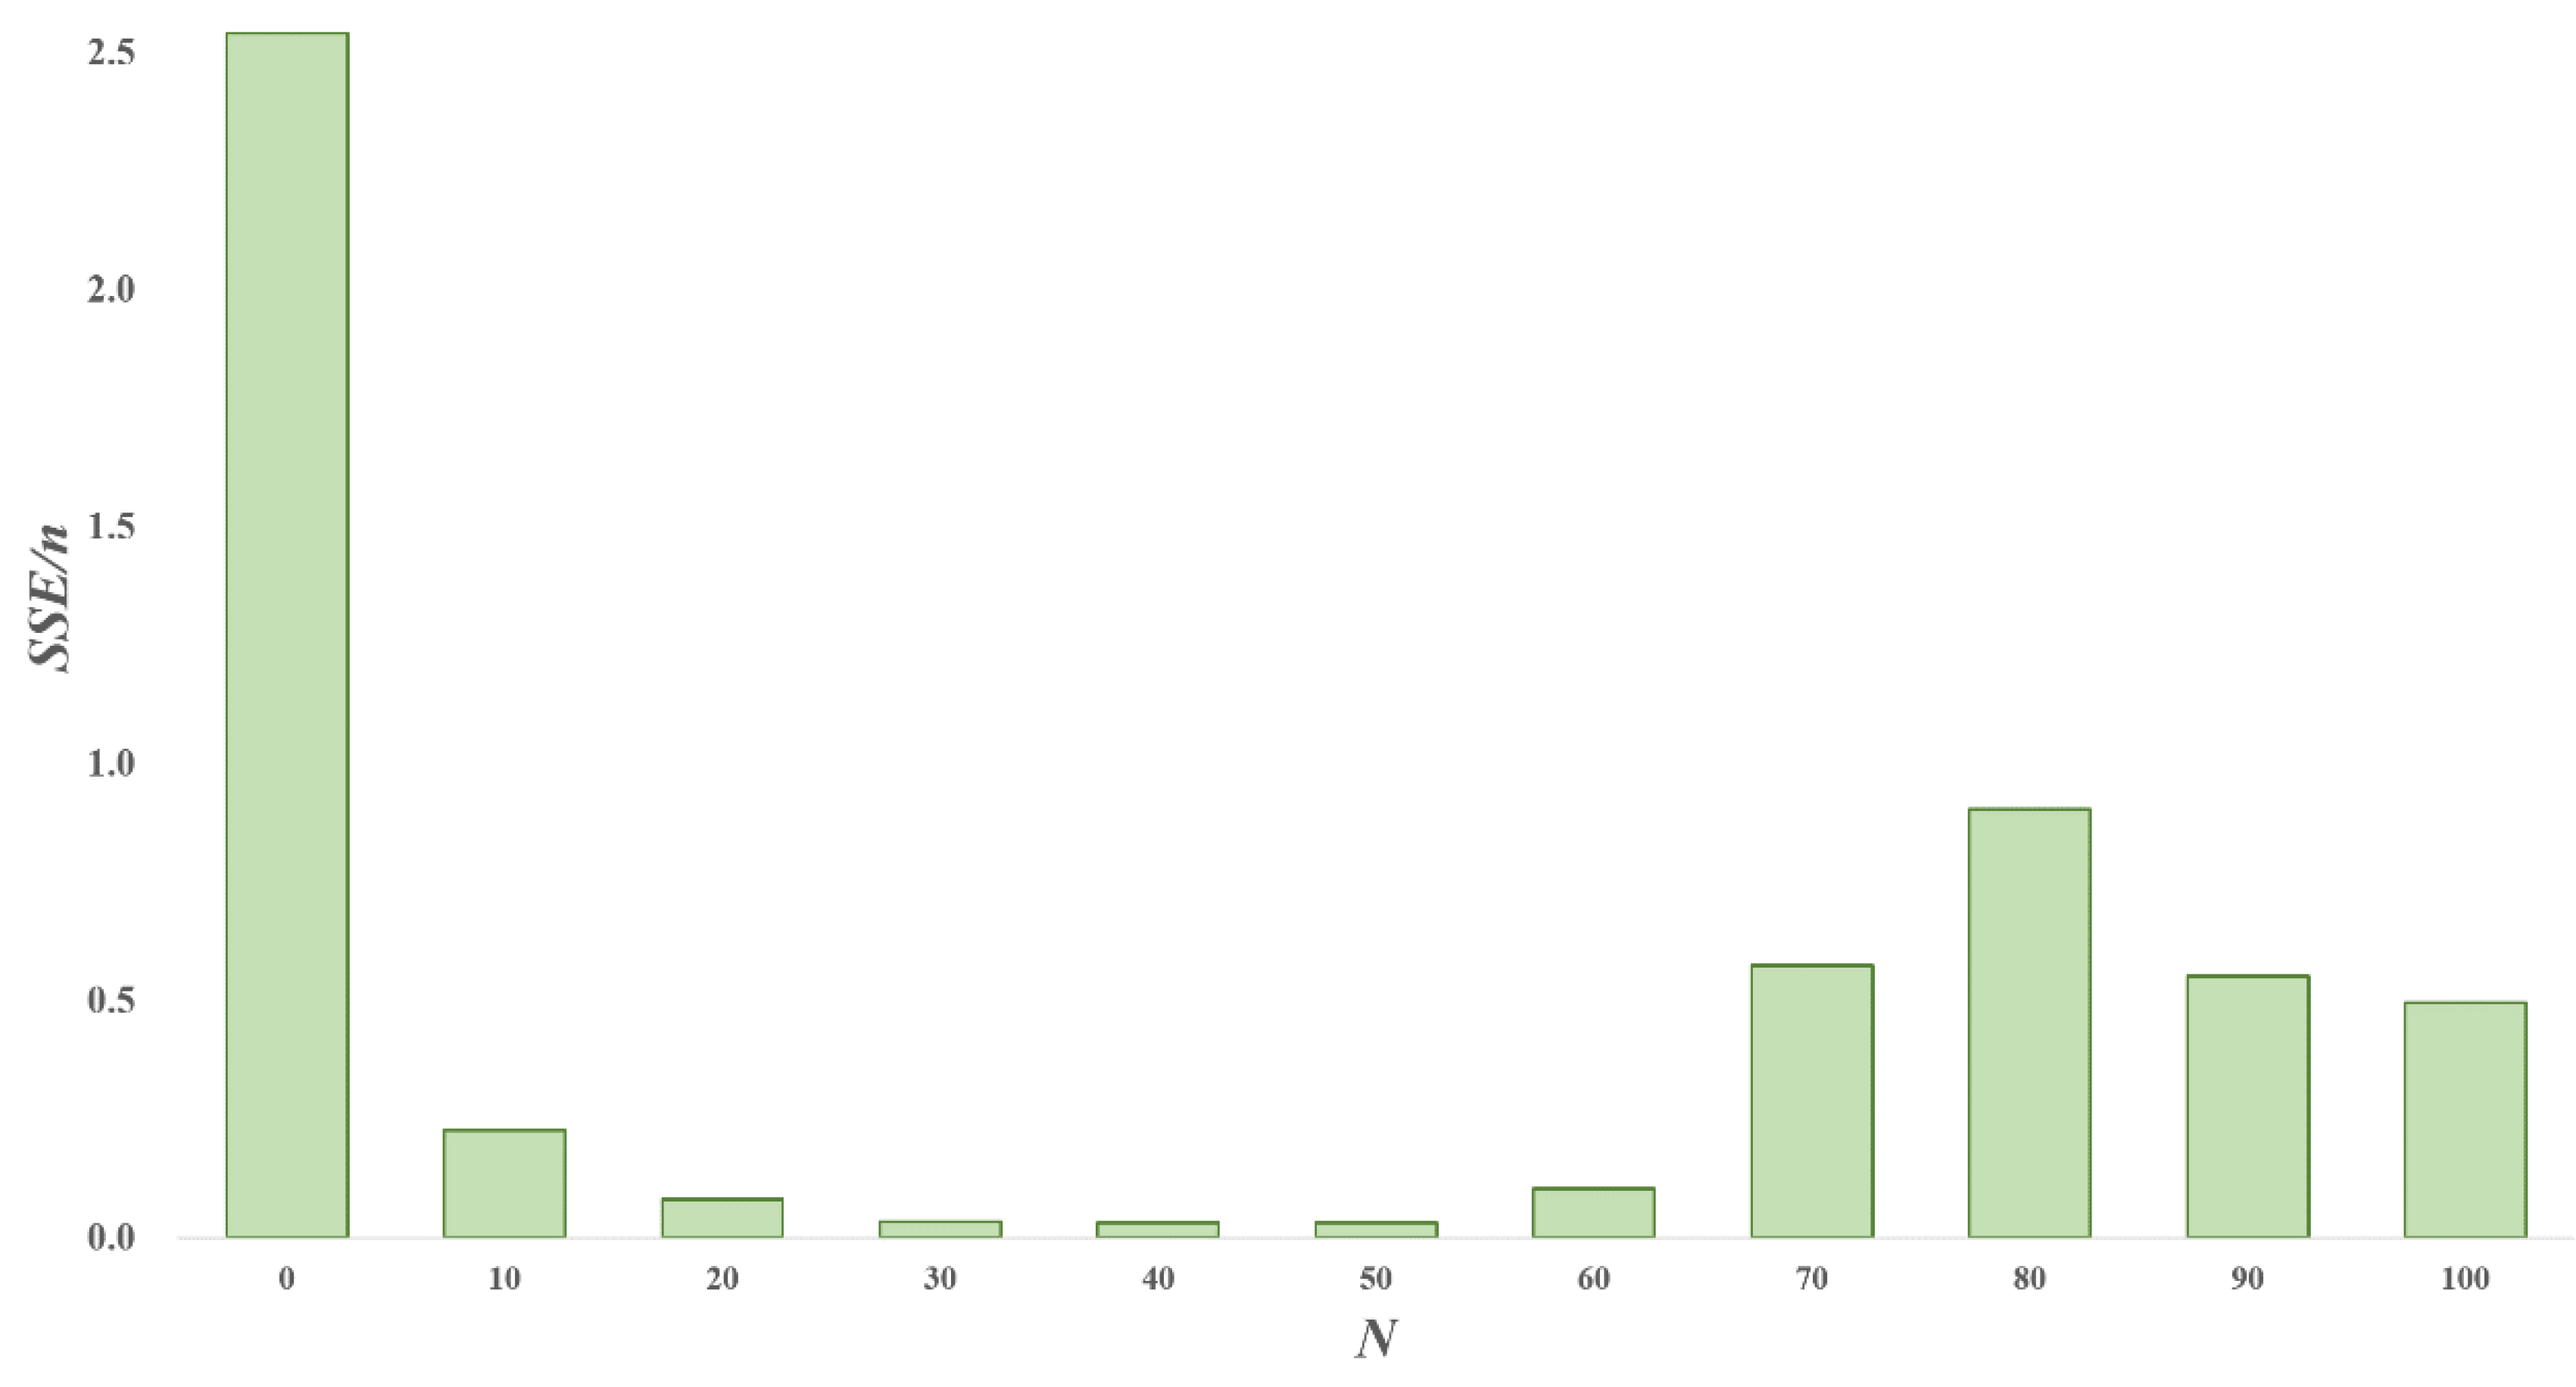
The best choice for the window width
N still needs to be further studied. We used the mean square error (MSE) to evaluate the degree of fitting under different
N values [
30]. The smaller the MSE, the more perfect the vibration reconstructed. As
Figure 10 shows, MSE first decreased by increasing
N. The best result was obtained from
N = 50, which was 0.0318. After
N = 50, MSE increased rapidly.
We can assume there is an optimal N which obtains the best vibration reconstruction effect for every repetition rate of the optical pulse. Obviously, there is a need for optimization in the selection of N. It may be simultaneously related to the SNR of the original IF signals, the frequency of the vibration signal and the repetition rate of the optical pulse light, which needs to be considered in the application.


