Article

Futuristic Trends and Innovations for Examining the Performance of Course Learning Outcomes Using the Rasch Analytical Model

by
Moustafa M. Nasralla
1,*,
Basiem Al-Shattarat
2,
Dhafer J. Almakhles
1,
Abdelhakim Abdelhadi
3 and
Eman S. Abowardah
4
1
Department of Communications and Networks Engineering, College of Engineering, Prince Sultan University, Riyadh 11586, Saudi Arabia
2
Department of Accounting, College of Business and Administration, Prince Sultan University, Riyadh 11586, Saudi Arabia
3
Department of Engineering Management, College of Engineering, Prince Sultan University, Riyadh 11586, Saudi Arabia
4
Department of Architectural Engineering, College of Engineering, Prince Sultan University, Riyadh 11586, Saudi Arabia
*
Author to whom correspondence should be addressed.
Electronics 2021, 10(6), 727; https://doi.org/10.3390/electronics10060727
Submission received: 11 February 2021 / Revised: 12 March 2021 / Accepted: 15 March 2021 / Published: 19 March 2021
(This article belongs to the Special Issue Machine Learning in Educational Data Mining)

Abstract

:
The literature on engineering education research highlights the relevance of evaluating course learning outcomes (CLOs). However, generic and reliable mechanisms for evaluating CLOs remain challenges. The purpose of this project was to accurately assess the efficacy of the learning and teaching techniques through analysing the CLOs’ performance by using an advanced analytical model (i.e., the Rasch model) in the context of engineering and business education. This model produced an association pattern between the students and the overall achieved CLO performance. The sample in this project comprised students who are enrolled in some nominated engineering and business courses over one academic year at Prince Sultan University, Saudi Arabia. This sample considered several types of assessment, such as direct assessments (e.g., quizzes, assignments, projects, and examination) and indirect assessments (e.g., surveys). The current research illustrates that the Rasch model for measurement can categorise grades according to course expectations and standards in a more accurate manner, thus differentiating students by their extent of educational knowledge. The results from this project will guide the educator to track and monitor the CLOs’ performance, which is identified in every course to estimate the students’ knowledge, skills, and competence levels, which will be collected from the predefined sample by the end of each semester. The Rasch measurement model’s proposed approach can adequately assess the learning outcomes.

1. Introduction

Learning outcomes can be defined as statements that describe what students can do or have to perform at the end of the learning process. They probably have to be differentiated from learning goals. Outcomes of learning are directly associated with students to ensure understandable directions of what they have to accomplish throughout a course/program. In turn, learning goals are made, rather, for teachers in relation to program management and implementation [1]. Bloom, who was a pundit in education [2], classified learning outcomes by three core dimensions of study: cognitive (based on knowledge), emotional (based on attitude), as well as psychomotor (based on human skills). Nevertheless, the Arabian sector of higher education has also classified learning outcomes by three relevant dimensions (knowledge, competence, and skills), referring to the so-called Saudi Qualification Framework (SAQF). The knowledge and skills domains are relatively clear and easy to understand, whereas competence represents a more complex category and needs further interpretation.
Moreover, skills are relatively commonly understood as being directly related to knowledge and are perceived as the application of knowledge. However, some frameworks have utilised a wider description, which relates skills to the demonstration of activities in simulated conditions. Competencies are attributed to a broad range of meanings and definitions. While some NQFs describe competence as an overarching category referring to the ability of learners to apply knowledge and skills in a self-directed way, others relate competence solely to the demonstration of knowledge and skills in real-time and work situations.
The application of teacher assessment techniques has gained a lot of attention in terms of policymaking. The studies revealed that 15–25% of the discrepancy in student accomplishments and grades is attributed to teachers’ work and contribution. Therefore, teachers make more significant gains in their effectiveness when they teach in a supportive, collegial environment or accumulate experience in the same grade, subject or district; and more experienced teachers confer benefits to their colleagues. Eventually, a variety of research-related classroom monitoring tools have been designed since then [3,4]. Today, teacher assessments fulfil three essential functions. They are not limited by policies anymore, yet functions remain formative and summarising nature [5]. Summarising teacher assessment helps them to maintain decisions on a teacher’s choices as well as solutions related to career development.
Nonetheless, scholars have neglected the notion that valid summarising decisions should be assessed based on more than 10 independent evaluations made by diverse experts [5]. The formative assessment also demands different monitoring reviews from experts to constitute a valid decision. In the context of teaching, this issue is typically managed by a brief communication with a teacher under observation, asking something like: “Was the class indicative enough”? or “Have you had the chance to demonstrate all professional skills”? If answers are mostly negative, a second monitoring assessment is conducted.
Nowadays, the techniques of measuring learning outcomes and course performance include the delivery of questionnaires to students in the last week of the educational semester (as per Prince Sultan University policy). This questionnaire lists the course learning outcomes (CLOs) that the students have to utilise to assess their knowledge over the predefined CLOs. Thus, it remains problematic to understand every selected CLO’s relevant and exact performance. Nonetheless, this process was found unfit for evaluating the student CLO performances as it was mainly grounded on the students’ subjective feelings and opinions [6,7].
The Rasch measurement model [8,9] is known as one characteristic, logistic, and non-dynamic design in terms of a single item response theory (IRT) in which the quantity of a selected latent personal characteristic and the quantity of another similar latent characteristic are expressed in different items, which is why it might be calculated separately; however, they can be still compared and contrasted between each other [6]. Scores can be used in parametric statistics and validity testing [10,11,12]. The Rasch model and the many-facet Rasch model approach has been used in a steadily increasing number of applications in the fields of language testing [13], educational and psychological measurement [14,15,16,17].
This study aligns with the Kingdom of Saudi Arabia (KSA) National Transfer Program (NTP) 2020; the third PSU Strategic Plan ((2018–2023), p. 11); and KSA Vision 2030. Theme 2 of NTP 2020 is titled “Improve Living Standards and Safety”, which aimed to extend the delivery of top-quality education services by getting appropriate accreditation, improving education services, and simplifying admission practices in international higher-education institutions. The NTP objectives related to education are: “Improving the learning environment to stimulate creativity and innovation; improving curricula and teaching methods, and Improving students’ values and core skills”. However, the usual procedure to examine the performances for the CLOs is conducted by distributing survey questions either manually or online to the students [18]. Unfortunately, following this approach does not accurately interpret the students’ performances through actual evaluation. In addition, in our departments, we lack accuracy in assessing every CLO because weights distributions on the offered activities in the direct assessments are performed heterogeneously regarding each teacher’s criteria.
This study contributes to the literature by providing evidence using the advanced analytical model, which accurately and statistically assesses the efficacy of the learning and teaching techniques when using direct and indirect assessment methods. The Rasch model is a measurement technique that utilises inputs from the students’ evaluations and converses this data into the scale titled as ‘logit’, thus modifying the evaluation results into a linear interrelation with the equivalent interval [19] (In Rasch, it produced a reliable repeatable measurement instrument instead of establishing the ‘best fit line’ [20]). The outcomes are then assessed to find if the evaluation has been made clear. Furthermore, the professor utilises certain guidance for streamlining the teaching approaches [19]. The outcomes derived from the Rasch evaluation will supply professors and teachers with valid information on the students’ learning skills and achievement potential. Technically, the Rasch model concentrates on developing the measurement tool with precision instead of adjusting the inputs to a measurement process, yet with some errors [20]. Nevertheless, the current research illustrates that the Rasch measurement technique is able to categorise grades in compliance with course goals in a more accurate manner, thus differentiating the students by their level of knowledge. In a way, the Rasch outcomes will be utilised as a directive for lecturers and professors to observe students’ performance in every particular CLO with the purpose of measuring the extent of efficiency of completing teaching and learning goals in any course program [21].

2. Research Design

2.1. Data and Sample

This study was conducted on a sample of 31 male students of the first semester of the academic year 2019–2020 from both the Department of Communications and Networks Engineering and the College of Business and Administrative (CBA), Faculty of Accounting at Prince Sultan University, KSA (PSU). The selected courses for this study are core courses for undergraduate students in their second year of both programs.

2.2. The Process for Measuring Course Learning Outcome (CLO) Using Rasch Model

In this research, the specific Rasch model known as Person-Item Distribution Map (PIDM) was used to ensure significant data on the students’ learning performance, evaluating outcomes on what knowledge a student has and what his/her place is in the instructional order. The model’s capacity to produce data based on a minor sample is a great opportunity for adequate observation of the students’ learning progress in the engineering and accounting fields, especially when the instructional plan is in progress. Significantly, PIDM illustrates the whole scale of learning barriers, clearly outlining the certain challenges students from the engineering and accounting fields experience to further education progress.
Using the Rasch model for measurement, each individual with a specific amount of selected latent characteristics clarified the chance to reply appropriately in one of the item’s domains. The model hence provided an exceptional and full-fledged learning performance measurement system (LPMS) for CLO evaluation [22,23], which was able to improve the understanding of how the education programs are aligned, moreover helping teachers to design and support high-quality education standards in Prince Sultan University (Saudi Arabia) with meeting the country’s national needs—particularly in engineering and accounting educational fields, as mentioned in our case. In the dichotomous context, the Rasch model is shown as follows in the psychological metrics system:
Pr {   x i =   1   } =   e β v δ i 1 +   e β v δ i
where,
  • Pr {   x i = 0 ,   1 } 
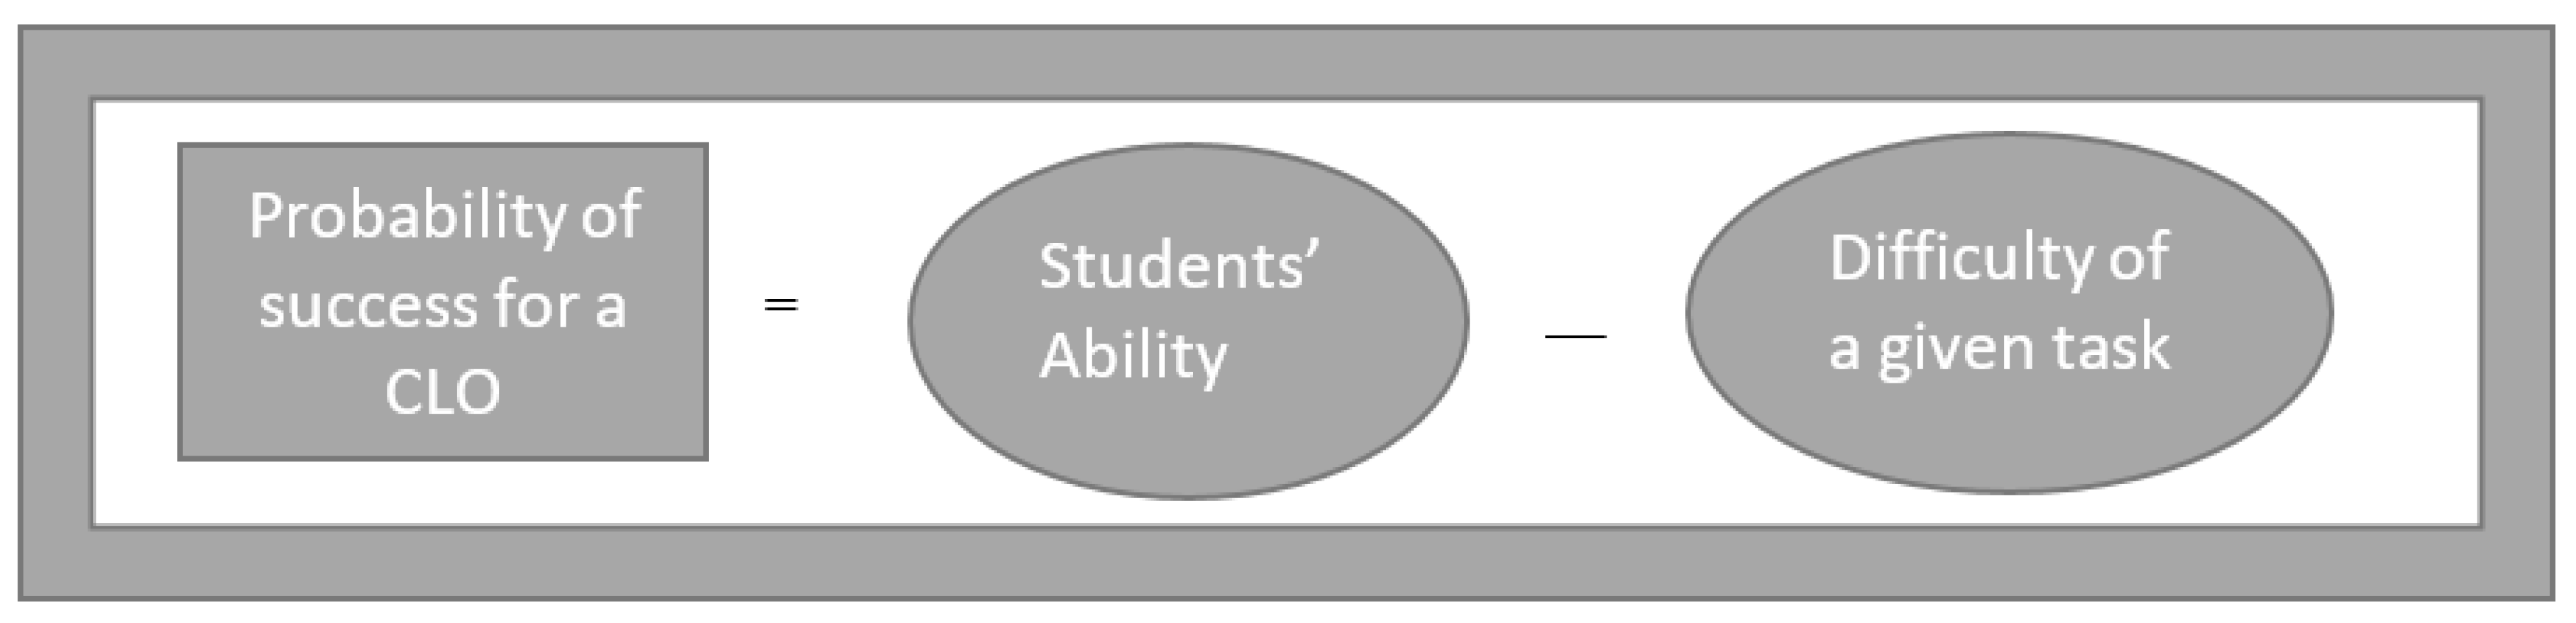
is the probability of turn of the event upon the interaction between the relevant person and assessment item;
  • e = Euler’s number, (i.e., 2.71828)
  • β v = The ability of person v
  • δ i = the difficulty of assessment item i
In this scenario, the chance of success might be modified and re-recorded within logit, representing the so-called logistic regression linear hierarchical model. It has been depicted that the log-odds, known as logit of appropriate reply to an item by an individual, refer to the model, is modified as:
logit ( P 1 P ) =   β v δ i    
Thus, the chance of achieving a specific CLO might be considered, as demonstrated in Figure 1.
The Rasch model transforms sequential grading scale or partial-credit information into the typical interval-based scale. The eventual Rasch-converted output is placed in “logits”, a unit that incorporates data on every item’s complexity (titled “item complexity”) and the individual’s capacity (titled “personability”). Individual capacities are produced by a calculated maximum probability ratio of item complexities. Numbers related to items and individuals can be closely contrasted with each other to produce deductions on item’s complexity for every person. When the individual’s capacity and item complexity overlap, there is a 50% likelihood for an individual to reply in a correct way [11].

2.3. Empirical Model

The study comprised three stages, namely planning, categorisation, and evaluation. The planning stage represented the identification of the domain by assessing each questionnaire list. The test description based on CLO was prepared. The informational categorisations grounded on the summation of students’ evaluation outcomes for every CLO were established. Afterwards, inputs were converted into the databases, including ratings of grades in the form of mark clusters. The inputs converted were further used as data for the WinSteps application. Eventually, the outcomes were evaluated through several periods.
During the planning stage, the research focus and dimension definition was the starting point. Such modules as CME322 Network Design and Analysis (in terms of engineering) and ACC102 Introduction to Managerial Accounting (in terms of accounting) have been selected for the studying dimension. The CLOs for each module were thoroughly investigated. The course aims at teaching students about the methods of developing expert systems with the help of the life cycle program related to expert system development. The design of the CLO for a particular course was made in compliance with Bloom’s classification, as depicted in Table 1 (Panels A and B). This classification incorporates cognitive learning stages, such as knowledge, understanding, applying, evaluating, estimating, and synthesising. They were used in relation to CLOs in constructing the course. In a given course, several estimation techniques were utilised to verify a student’s comprehension of instruction-centred knowledge. The evaluation is based on 10% of quizzes, 10% of special tasks, 40% of two mid-term exams, and 40% of the final exam.
In the classification phase, we focus on the pre-processing of the total number of 11 students for CME322 and 20 students for ACC102, who enrolled for this course in the first semester of the academic year 2019–2020 at Prince Sultan University. Several practices on this stage involved: (1) quizzes/questionnaires, tasks, mid-term exams as well as final exams that are prepared to test the CLO l for every particular question; (2) marks of students for each assessment domain were gathered in compliance with CLO; and (3) marks of students have been assigned to each related grade. The grades achieved will be used as data for the Winstep application.
Based on the Rasch model for measurement, the evaluation of the students’ accomplishments in education may be clearly defined. Moreover, the progress of students’ development of cognitive abilities might also be assessed by investigating the extent of complexities. The measurement of CLO accomplishments for this methodology is presented in the following Equation (2).
Estimating every CLO is one of the steps to validate the accomplishments in CME322 and ACC102 courses. The procedure is demonstrated in the graph (Figure 2).
Eleven students who enrolled in CME322 entitled Network Design and Analysis during the first semester of the academic year 2019/2020 and 20 students who enrolled in ACC102 entitled Introduction to Managerial Accounting were chosen as the study samples. All the lists of questions utilised in assessment forms were checked and categorised based on CLO standards. With reference to the categorisation system, the share of allocation of every question based on CLO was synthesised (Table 2).
The shares of marks’ allocation were calculated based on CLO. Every assessment mark for a particular CLO was synthesised and divided by the summary of total values for a particular CLO. Table 3 illustrates the allocation of marks among students based on CLO.
Marks for each CLO were then assigned according to grade based on the category below (as shown in Figure 3).
f ( x ) = { 0 ,     i f   0     x   <   40 ;     1 ,     i f   40     x   <   50 ; 2 ,     i f   50     x   <   60 ; 3 ,     i f   60     x   <   70 ;   4 ,     i f   70     x   <   80 ; 5 ,     i f   80   x   100
The mapping of the selected CLO marks in the grade classification was ensured prior to their processing in the Winstep application. The output of the mapping procedure is documented in Figure 4 and Figure 5.
In this group of the grade ACC102, we calculated Pearson’s, Kendall’s Tau, and Spearman’s Rho correlation coefficients, as this group had a more representative number of students. For this test, we used the original grades from 0 to 100, as these marks have more information. The results of the three correlation tests were similar and coherent among each other. Figure 6 shows the results of Pearson’s correlation test.
One can observe that these CLOs marks strongly correlated with significance levels in all the possible pair combinations. This means that students usually obtained similar marks in all CLOs, which show coherence in measuring learning aspects of the same subject.

3. Empirical Results and Analysis

A combination of inputs covered 31 students in total for two separate courses, such as CME322 (11 participants) and ACC102 (20 participants). The summary of their evaluation outcomes was treated as valuable input with the help of the WinSteps application. The aim was to calculate the outcomes. Afterwards, PIDM was designed by the application.
The value δ represents the item’s area on the same characteristic. If βn prevails over δi, then the individual will be likely to reply to the item in a correct manner. The item’s differentiation outlines the extent of an individual’s capacity against the individual’s presence on the map. In this sense, the greater the differentiation, the more increased likelihood for an individual to reply appropriately to the given item. Equally, the degree of item complexity is expressed in the distribution of the item throughout the scale: related to the higher bar; the greater and higher the area from the item, Meantime, the bigger the perception is that the item is more complex compared to the item from a lower area. Hence, the Meantime becomes a formal threshold with the following set limits on the logit scale—0.47 for CME322 as well as 1.94 for ACC102. Nevertheless, to estimate the student’s accomplishment and CLO’s progress in terms of the PIDM, the logit parameters are produced specifically, as demonstrated in Table 4 and Table 5.
The estimations of students and related CLOs illustrate the logit parameter site for every participant and outcome. The PIDM indicated that the group Meanperson related to CME322 (0.79) and ACC102 (4.13) lay above the threshold limit. This meant that students incorporated great skills and capacities for the CLOs selected. In the CME322 course, one of the students (S1) was found to be below Meanitem. This student generally was able to achieve all the CLOs except CLO2. Most of the questions to test CLO2 were used in quizzes, mid-term (1), and final examination. Thus, before the examination started, the student needed to attend skill-building workshops (i.e., time management); throughout the semester, students needed to attend all of their classes (e.g., go to class prepared; set a study schedule for each class, and follow it; focus on class; attend tutoring sessions; ask their professor for help if having difficulty in a course); and during the examination, the period student needed to go to the exam preparation and to help sort out your time management (e.g., set up a timetable for your study; documenting how many examination forms are in place and how many days it will take to manage them all; preparing their education plans accordingly; making some of the exams more prioritised for preparation, and reach sort of personal peaceful harmony for continuous professional performance. In the ACC102 course, all 20 students were found to be higher than Meanitem, which indicates that all students were able to achieve CLOs without any difficulties.
Table 6 illustrates the likelihood of every learner accomplishing every CLO in courses such as CME322 and ACC102. It ensures the evaluation of interrelations between each student with particular items in greater detail by calculating the likelihood of CLOs accomplishment for every student. By applying Equations (1) and (2) mentioned above, calculations can be conducted manually. By selecting student S8 for the course, CME322 as a case for computing the likelihood of accomplishing CLO5, with referring to Equation (2), Pr (Si, CLOi) will become as follows:
logit ( P 1 P ) =   β v ( S 8 ) δ i ( CLO 5 ) =     1.89 0.41 = 1.48
Substitute this value into the equation below:
Pr {   S 8 ,   C L O 5   } =   e β v δ i 1 +   e β v δ i = 0.815
The estimate of 0.815 will become the accomplishment of CLO5 for the particular learner (S8). Table 6 also contains other parts of the evaluation.
In Table 6 Panel A, it can be concluded that out of 11 students of the CME322 course, there is only one student who has no problems with his CLOs achievement. This indicates that students (S2, S3, S4, and S5) have difficulty achieving CLO2 and no problem with the rest of the other CLOs. In addition, these particular students (S1, S6, S7, S10, S11) deal with issues in accomplishing all CLOs where the likelihood of accomplishing outcomes is lower than 0.57, which is emphasised by the italic-bold font. Panel B of Table 6 indicates that among 20 students related to the ACC102 course, only 12 learners experience no issues with accomplishing their CLOs. This implies that the other eight learners have general complexities with accomplishing all CLOs, where the likelihood of accomplishing outcomes is lower than 0.83 and emphasised by the italic-bold font.
We analysed the correlation of probabilities for the different pairs of CLOs, considering Pearson’s, Kendall’s Tau, and Spearman’s Rho correlation coefficients for ACC102. The untabulated results of Pearson’s correlation coefficient show that all the pairs of CLOs kept a strong correlation (i.e., with a significance level of 0.01) for all the pairs. These results are coherent with the previous results, showing that our Rash Model application obtained coherent results considering the correlations among different CLO. Figure 6 shows the histograms of the probabilities of achieving each CLO, alongside the normal distribution curves for the corresponding means and SDs.
In this example, one can observe distributions similar to one between 0.50 or 0.60 to 1.00, with means between 80 and 90, showing results similar to the success ratio of students for this course and university. Thus, the proposed approach obtains realistic results. Normally the distributions were similar to normal distributions with the only exception of CLO1, in which the distribution was relatively different.

4. Conclusions

The Rasch model for measurement has become a valid tool for estimating and identifying equivalents within educational courses, which follows the mission and vision of measuring criteria and protocols. Even being a linear model, it is still quantifiable in nature. The model has become highly practical with its predictive functionality and ability to recover missing information pieces. This study discussed the evaluation and practical calculations of students’ learning outcomes for CME322 and ACC102 courses in the first semester of the academic year 2019–2020 from both the Department of Communications and Networks Engineering and the College of Business and Administrative studies, PSU, by using Rasch Measurement Model. The results were coherent in terms of correlation among different CLOs for the same group of students, and the probabilities of reaching each CLO usually followed normal distributions.
This research has confirmed that the application of the Rasch model for assessing CLO performance for courses such as CME322 and ACC102 leads to more precise results. Measurement methodology of this sort becomes highly useful when conventional techniques of measuring the CLO solely on the students’ feedback through questionnaires fail to provide an adequate picture. The given model can generate a clear correlation pattern comparing values of students’ performance with values for every CLO. In fact, a traditional measurement technique is unable to compute such a pattern. This study’s findings might serve as helpful guidance for teachers and professors in observing the students’ performance for course-based CLO. Moreover, they might help teaching specialists determine the pitfalls in their teaching approaches, allowing them further to enhance their methods and thus contribute to students’ increased performance. The main limitation of this study is the small sample size used for the analysis. As future work, we plan to develop a tool that helps teachers easily calculate the Rasch model for students. We also plan to expand our experiments on more courses and use larger samples.

Author Contributions

Conceptualization, M.M.N. and B.A.-S.; Data curation, M.M.N. and B.A.-S. Funding acquisition, M.M.N., B.A.-S., D.J.A., A.A. and E.S.A.; Investigation, M.M.N. and B.A.-S.; Methodology, M.M.N., D.J.A., A.A. and E.S.A.; Project administration, M.M.N., D.J.A.., A.A. and E.S.A.; Resources, M.M.N. and B.A.-S.; Software, M.M.N. and B.A.-S.; Supervision, M.M.N., D.J.A., A.A. and E.S.A.; Validation M.M.N. and B.A.-S.; Writing—original draft, M.M.N. and B.A.-S.; Writing—review and editing, M.M.N. and B.A.-S. All authors have read and agreed to the published version of the manuscript.

Funding

This work was supported by the research grants from Prince Sultan University, Saudi Arabia (Seed Project number RIC2020-18).

Data Availability Statement

Available from the corresponding author upon request.

Acknowledgments

The authors would like to acknowledge Prince Sultan University and Smart Systems Engineering and Renewable Energy Labs for their valuable support and provision of research facilities that were essential for completing this work. Also, the authors would like to acknowledge the support of Prince Sultan University for paying the Article Processing Charges (APC) of this publication.

Conflicts of Interest

On behalf of all authors, the corresponding author states no conflict of interest.

References

  1. Bai, X.; Xu, Y.; Ikem, F. Rubric and performance-based assessment. Issues Inf. Syst. 2013, 14, 1–11. [Google Scholar]
  2. Bloom, B.S. Taxonomy of educational objectives. Cognitive domain. N. Y. McKay 1956, 1, 20–24. [Google Scholar]
  3. Podolsky, A.; Kini, T.; Darling-Hammond, L. Does teaching experience increase teacher effectiveness? A review of US research. J. Prof. Cap. Community 2019, 4, 286–308. [Google Scholar] [CrossRef]
  4. Van de Grift, W.; Helms-Lorenz, M.; Maulana, R. Teaching skills of student teachers: Calibration of an evaluation instrument and its value in predicting student academic engagement. Stud. Educ. Eval. 2014, 43, 150–159. [Google Scholar] [CrossRef]
  5. Van der Lans, R.M.; Van de Grift, W.J.C.M.; Van Veen, K.; Fokkens Bruinsma, M. Once is not enough: Establishing reliability criteria for feedback and evaluation decisions based on classroom observations. Stud. Educ. Eval. 2016, 50, 88–95. [Google Scholar] [CrossRef]
  6. Bradley, K.D.; Cunningham, J.; Haines, R.T.; Harris, W.E., Jr.; Mueller, C.E.; Royal, K.D.; Shannon, O.S.; Gilbert, S.; Weber, J. Constructing and Evaluating Measures: Applications of the Rasch Measurement Model; University of Kentucky: Lexington, KY, USA, 2010. [Google Scholar]
  7. Farhan, M.; Aslam, M.; Jabbar, S.; Khalid, S. Multimedia based qualitative assessment methodology in eLearning: Student teacher engagement analysis. Multimed. Tools Appl. 2018, 77, 4909–4923. [Google Scholar] [CrossRef]
  8. Rasch, G. Probabilistic Models for Some Intelligence and Achievement Tests; MESA Press: Chicago, IL, USA, 1960. [Google Scholar]
  9. Rasch, G. On general laws and the meaning of measurement in psychology. In Proceedings of the Fourth Berkeley Symposium on Mathematical Statistics and Probability, Berkeley, CA, USA, 20–30 June 1960; University of California Press: Berkeley, CA, USA, 1961; Volume 4, pp. 321–333. [Google Scholar]
  10. Wright, B.D.; Mok, M. Understanding Rasch measurement: Rasch models overview. J. Appl. Meas. 2000, 1, 83–106. [Google Scholar] [PubMed]
  11. Bond, T.G.; Fox, C.M. Applying the Rasch Model: Fundamental Measurement in the Human Sciences, 3rd ed.; Routledge: Oxford, UK, 2015. [Google Scholar]
  12. Kalinowski, K.; Krenczyk, D.; Paprocka, I.; Kempa, W.; Grabowik, C. Multi-criteria evaluation methods in the production scheduling. In IOP Conference Series: Materials Science and Engineering; IOP Publishing: Orlando, FL, USA, 2016; Volume 145, p. 022019. [Google Scholar]
  13. Bonk, W.J.; Ockey, G.J. A many-facet Rasch analysis of the second language group oral discussion task. Lang. Test. 2003, 20, 89–110. [Google Scholar] [CrossRef]
  14. Semerci, Ç. The relationships between achievement focused motivation and critical thinking. Afr. J. Bus. Manag. 2011, 5, 61–79. [Google Scholar]
  15. Chang, M.L.; Engelhard, G., Jr. Examining the Teachers’ Sense of Efficacy Scale at the item level with Rasch measurement model. J. Psychoeduc. Assess. 2016, 34, 177–191. [Google Scholar] [CrossRef] [Green Version]
  16. Cetin, B.; Ilhan, M. An analysis of rater severity and leniency in open-ended mathematic questions rated through standard rubrics and rubrics based on the SOLO taxonomy. Egit. Bilim 2017, 42. [Google Scholar] [CrossRef] [Green Version]
  17. Kaya-Uyanik, G.; Gur-Erdogan, D.; Canan-Gungoren, O. International Journal of Educational Methodology. IJEM 2019, 5, 407. [Google Scholar]
  18. Chae, J.; Cho, Y.; Lee, M.; Lee, S.; Choi, M.; Park, S. Design and implementation of a system for creating multimedia linked data and its applications in education. Multimed. Tools Appl. 2016, 75, 13121–13134. [Google Scholar] [CrossRef]
  19. Rozeha, A.R.; Azami, Z.; Mohd Saidfudin, M. Application of Rasch Measurement in Evaluation of Learning Outcomes: A case study in electrical engineering. In Proceedings of the Regional Conference on Engineering Mathematics, Mechanics, Manufacturing & Architecture (EM3ARC), Kuala Lumpur, Malaysia, 27–28 November 2007. [Google Scholar]
  20. Azrilah, A.A.; Azlinah, M.; Azami, Z.; Sohaimi, Z.; Hamzah, A.G.; Saidfudin, M. Evaluation of Information Professionals Competency Face Validity Test Using Rasch Model. 5th WSEAS. In Proceedings of the IASME International Conference on Engineering Education (EE’08), Stevens Point, WI, USA, 27–31 July 2008; pp. 22–24. [Google Scholar]
  21. Abdullah, S.; Rahmat, R.A.A.O.; Zaharim, A.; Muhamad, N.; Deros, B.M.; Kofli, N.T.; Tahir, M.M.; Muchtar, A.; Azhari, C.H.; Azhari, C.H.; et al. Implementing continual review of programme educational objectives and outcomes for OBE Curriculum based on stakeholders’ input. Eur. J. Sci. Res. 2009, 29, 89–99. [Google Scholar]
  22. Talib, A.M.; Alomary, F.O.; Alwadi, H.F. Assessment of Student Performance for Course Examination Using Rasch Measurement Model: A Case Study of Information Technology Fundamentals Course. Educ. Res. Int. 2018, 1–8. [Google Scholar] [CrossRef] [Green Version]
  23. Van de Grift, W.J.; Houtveen, T.A.; van den Hurk, H.T.; Terpstra, O. Measuring teaching skills in elementary education using the Rasch model. Sch. Eff. Sch. Improv. 2019, 30, 455–486. [Google Scholar] [CrossRef] [Green Version]
Figure 1. Course learning outcome (CLO) success model.
Electronics 10 00727 g001
Figure 2. The stages of Course Learning Outcome measurements.
Electronics 10 00727 g002
Figure 3. Grade rating based on marks cluster.
Electronics 10 00727 g003
Figure 4. Mapping result for Course Learning Outcomes rate according to the grade of Communications and Networks Engineering Course (CME322).
Electronics 10 00727 g004
Figure 5. Mapping result for Course Learning Outcomes rate according to the grade of ACC102.
Electronics 10 00727 g005
Figure 6. Histograms of probabilities obtained with the proposed approach for the six Course Learning Outcomes used in ACC102. Number of students (N).
Electronics 10 00727 g006
Table 1. Course learning outcomes mapping with Bloom taxonomy.
(a)
Course Learning Outcomes (CLO) for Communications and Networks Engineering Course (CME322)—Network Design and Analysis
Course Learning Outcome Bloom taxonomy
CLO1Describe network technologies such as Ethernet, Virtual local area networks, wireless local area networks, mobility management principles, and mobile Internet Protocol. Knowledge
CLO2Describe routing principles and illustrate routing algorithms such as link-state and distance-vector.Knowledge
CLO3Explain different type of delay, loss, and throughput, and recognise different type of network switching mechanisms such as packet- and circuit-switching.Skills
CLO4Explain transport layer connection/connectionless services, Transport Control Protocol (TCP) reliable data transfer, TCP flow-control and TCP congestion-control mechanisms.Skills
CLO5Demonstrate and apply error detection and correction schemes, channel access mechanisms and, data centre design and operation.Competence
(b)
Course Learning Outcomes (CLO) for Accounting Course ACC102—Introduction to Managerial Accounting
Course Learning Outcome Bloom taxonomy
CLO1Describe the basic management accounting concepts and techniques.Knowledge
CLO2Determine the cost of a manufactured product using job order and process costing systems.Knowledge
CLO3Explain the purposes of budgeting and prepare the master budget components and relate the budget to planning and control.Skills
CLO4Apply break-even techniques in CVP analysis.Skills
CLO5Apply and justify relevant techniques to aid internal users in decision making.Competence
CLO6Demonstrate oral and written communication skills in evaluating different approaches to management accounting.Competence
Table 2. Synthesis of the grades allocated to every assessment for the course learning outcomes.
(a)
Percentage Distribution according to Course Learning Outcomes (CLO) for Communications and Networks Engineering Course (CME322)—Network Design and Analysis
EvaluationQuiz (10%)Mid-term 1 (20%)Mid-term 2 (20%)Assignment (10%)Final Exam (40%)Total
(100%)
CLO10.350.800.000.000.1250.245
CLO20.350.200.000.000.1750.145
CLO30.300.000.550.000.200.22
CLO40.000.000.450.000.250.19
CLO50.000.000.001.000.250.20
Check1.001.001.001.001.001.00
(b)
Percentage Distribution according to Course Learning Outcomes (CLO) for Accounting Course ACC102—Introduction to Managerial Accounting
EvaluationQuiz (10%)Mid-term 1 (20%)Mid-term 2 (20%)Assignment (10%)Final Exam (40%)Total
(100%)
CLO10.200.000.000.000.100.06
CLO20.500.350.000.000.200.20
CLO30.150.650.000.000.200.225
CLO40.150.001.000.000.250.315
CLO50.000.000.000.000.250.10
CLO60.000.000.001.000.000.10
Check 1.001.001.001.001.001.00
Table 3. Allocation of marks among students with respect to every course learning outcome.
(a)
Marks Distribution according to Course Learning Outcomes (CLO) for Communications and Networks Engineering Course (CME322).
Student (S)CLO1CLO2CLO3CLO4CLO4CLO5
S1678354568667
S2808073937280
S3927985917992
S4758787827575
S5758584779075
S6969579785496
S7717779919071
S8849682839384
S9788982708578
S10908580756590
S11777375888677
(b)
Marks Distribution according to Course Learning Outcomes (CLO) for Accounting Course (ACC102).
Student (S)CLO1CLO2CLO3CLO4CLO4CLO5CLO6
S152597278725952
S256637784776356
S357647885786457
S452597278725952
S549556773675549
S661688491846861
S754607480746054
S836415054504136
S974839292928374
S1050566874685650
S1153597379735953
S1264728896887264
S1376869595958676
S1472819990998172
S1564728896887264
S1661688491846861
S1760688390836860
S1858657986796558
S1968779485947768
S2072819090908172
Table 4. Logit parameters for estimating students’ accomplishments.
(a)
Logit Value for Each Student for Communications and Networks Engineering Course (CME322).
Entry NumberTotal ScoreTotal CountMeasureModel S. E.Student Identification
82553.721.89S8
22351.550.79S2
32351.550.79S3
42351.550.79S4
52351.550.79S5
92351.550.79S9
72251.040.64S7
102251.040.64S10
112251.040.64S11
62050.410.5S6
1175−0.230.44S1
Mean 0.79
Standard Deviation 0.37
(b)
Logit Value for Each Student for Accounting Course (ACC102).
Entry NumberTotal ScoreTotal CountMeasureModel S. E.Student Identification
929651.815.93S9
1329651.815.93S13
1429651.815.93S14
2029651.815.93S20
1226635.835.92S12
1526635.835.92S15
1926635.835.92S19
624627.323.09S6
1624627.323.09S16
1724627.323.09S17
221618.813.7S2
321618.813.7S3
721618.813.7S7
1821618.813.7S18
118610.472.88S1
418610.472.88S4
1118610.472.88S11
101664.432S10
51560.272.45S5
886−22.034.02S8
Mean 4.13
Standard Deviation 1.39
Table 5. Logit parameters for estimating course learning outcomes progress.
(a)
Logit Value for each Course Learning Outcome (CLO) for Communications and Networks Engineering Course (CME322).
Entry NumberTotal ScoreTotal CountMeasureModel S. E.CLO
547110.350.41CLO5
148110.180.43CLO1
348110.180.43CLO3
448110.180.43CLO4
25211−0.880.64CLO2
Mean48.6 0.47
Standard Deviation1.7 0.08
(b)
Logit Value for each Course Learning Outcomes (CLO) for Accounting Course (ACC102).
Entry NumberTotal ScoreTotal CountMeasureModel S. E.CLO
1512021.091.55CLO1
2642011.942CLO2
6642011.942CLO6
38620−11.961.99CLO3
58620−11.961.99CLO5
49220−21.042.1CLO4
Mean73.83 1.94
Standard Deviation14.90 0.18
Table 6. Probability of students’ success in achieving each course learning outcome.
(a)
Probability of Each Student to Achieve Each Course Learning Outcomes (CLO) for Communications and Networks Engineering Course (CME322).
Probability
of Success
CLO5CLO1CLO3CLO4CLO2
S80.8150.8120.8120.8120.777
S20.5940.5890.5890.5890.537
S30.5940.5890.5890.5890.537
S40.5940.5890.5890.5890.537
S50.5940.5890.5890.5890.537
S90.5940.5890.5890.5890.537
S70.5570.5520.5520.5520.500
S100.5570.5520.5520.5520.500
S110.5570.5520.5520.5520.500
S60.5220.5170.5170.5170.465
S10.5070.5020.5020.5020.450
(b)
Probability of Each Student to Achieve Each Course Learning Outcomes (CLO) for Accounting Course (ACC102).
Probability
of Success
CLO1CLO2CLO6CLO3CLO5CLO4
S90.990.980.980.980.980.98
S130.990.980.980.980.980.98
S140.990.980.980.980.980.98
S200.990.980.980.980.980.98
S120.990.980.980.980.980.98
S150.990.980.980.980.980.98
S190.990.980.980.980.980.98
S60.820.750.750.750.750.73
S160.820.750.750.750.750.73
S170.820.750.750.750.750.73
S20.900.850.850.850.850.83
S30.900.850.850.850.850.83
S70.900.850.850.850.850.83
S180.900.850.850.850.850.83
S10.790.710.710.710.710.69
S40.790.710.710.710.710.69
S110.790.710.710.710.710.69
S100.610.500.500.500.500.48
S50.710.610.610.610.610.59
S80.920.880.880.880.880.87
Publisher’s Note: MDPI stays neutral with regard to jurisdictional claims in published maps and institutional affiliations.

