
Assessment and Integration of Renewable Energy Resources Installations with Reactive Power Compensator in Indian Utility Power System Network

 , ,
, ,  , and
, and 
Abstract
:1. Introduction
1.1. Background
1.2. Literature Survey
1.3. Research Gaps
- Most of the previous studies are conducted on distribution systems.
- Assessment of renewable energy potential is not performed together with optimal allocation.
- Positions of RPGs and/or RPCs are fixed in some works.
- Few network constraints are ignored.
- Economic considerations are unnoticed in few articles.
- The results obtained by few methods are suboptimal.
1.4. Objectives
- To determine the optimal locations and sizes of RPGs and RPCs in the IUPS.
- To minimize the power losses and voltage deviation, and maximize voltage stability.
- To realize the technical and economic impacts through the proposed PSO algorithm.
- To study the feasibility of the candidature locations with real-time resource availability.
1.5. Organization of the Paper
2. Problem Formulation
2.1. Objective Functions
2.1.1. Minimization of Power Losses
2.1.2. Minimization of Voltage Deviation Index
2.1.3. Maximization of Voltage Stability Index
2.2. Constraints
2.2.1. Power Balance Constraints
2.2.2. Voltage Constraints
2.2.3. Transmission Line Loading Constraints
2.2.4. Reactive Power Resources Constraints
2.2.5. RPGs Capacity Constraint
2.2.6. Power Infeed and Power Factor Constraints
3. Optimal Location of RPCs and RPGs Based on LSF
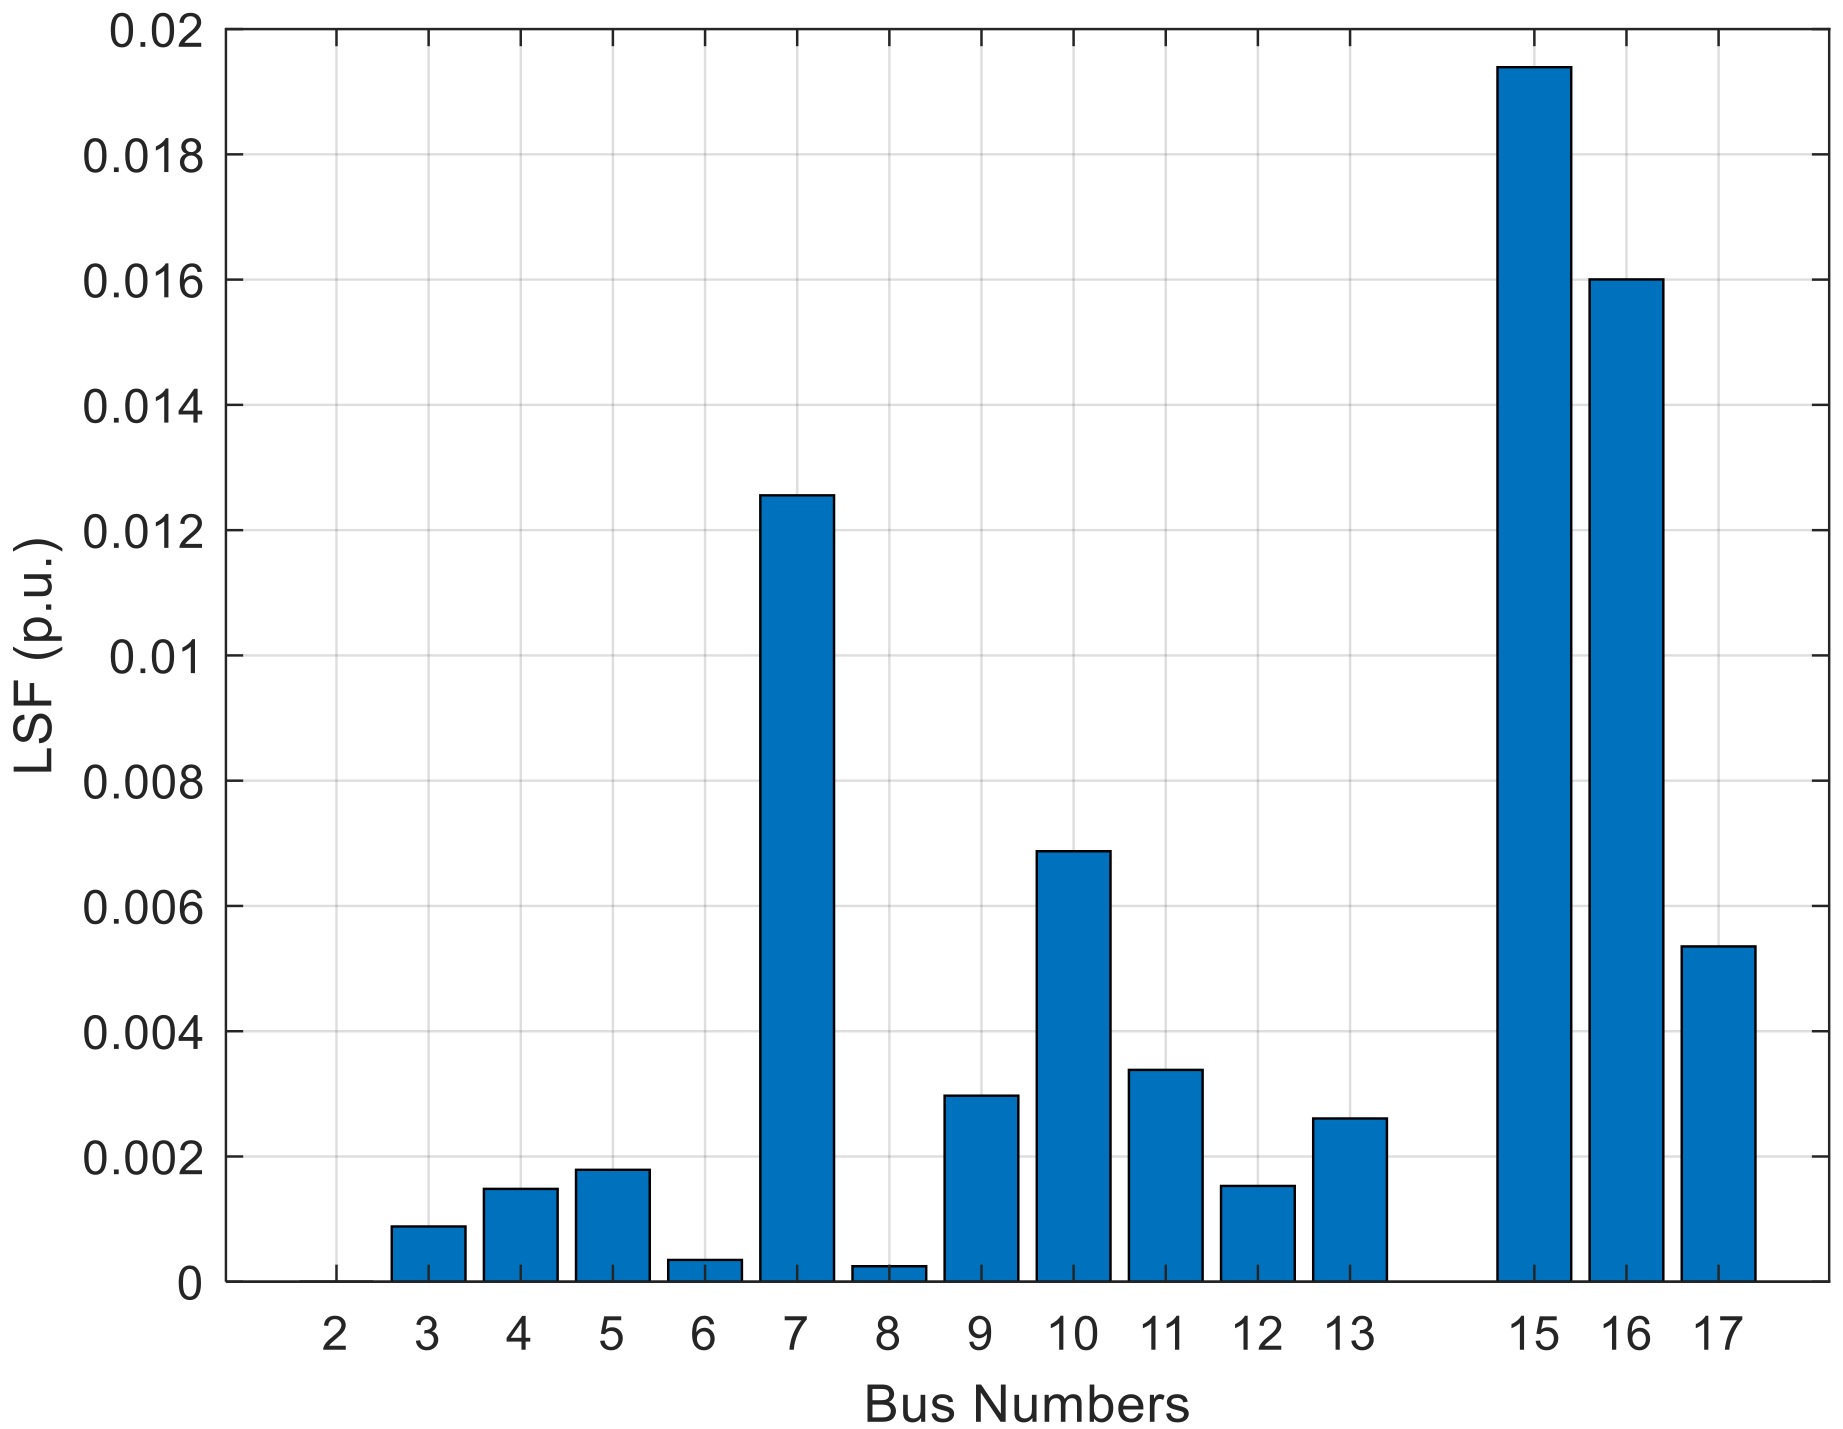
3.1. Loss Sensitivity Factor Method
3.2. Identification of Optimal Locations Using the LSF Method
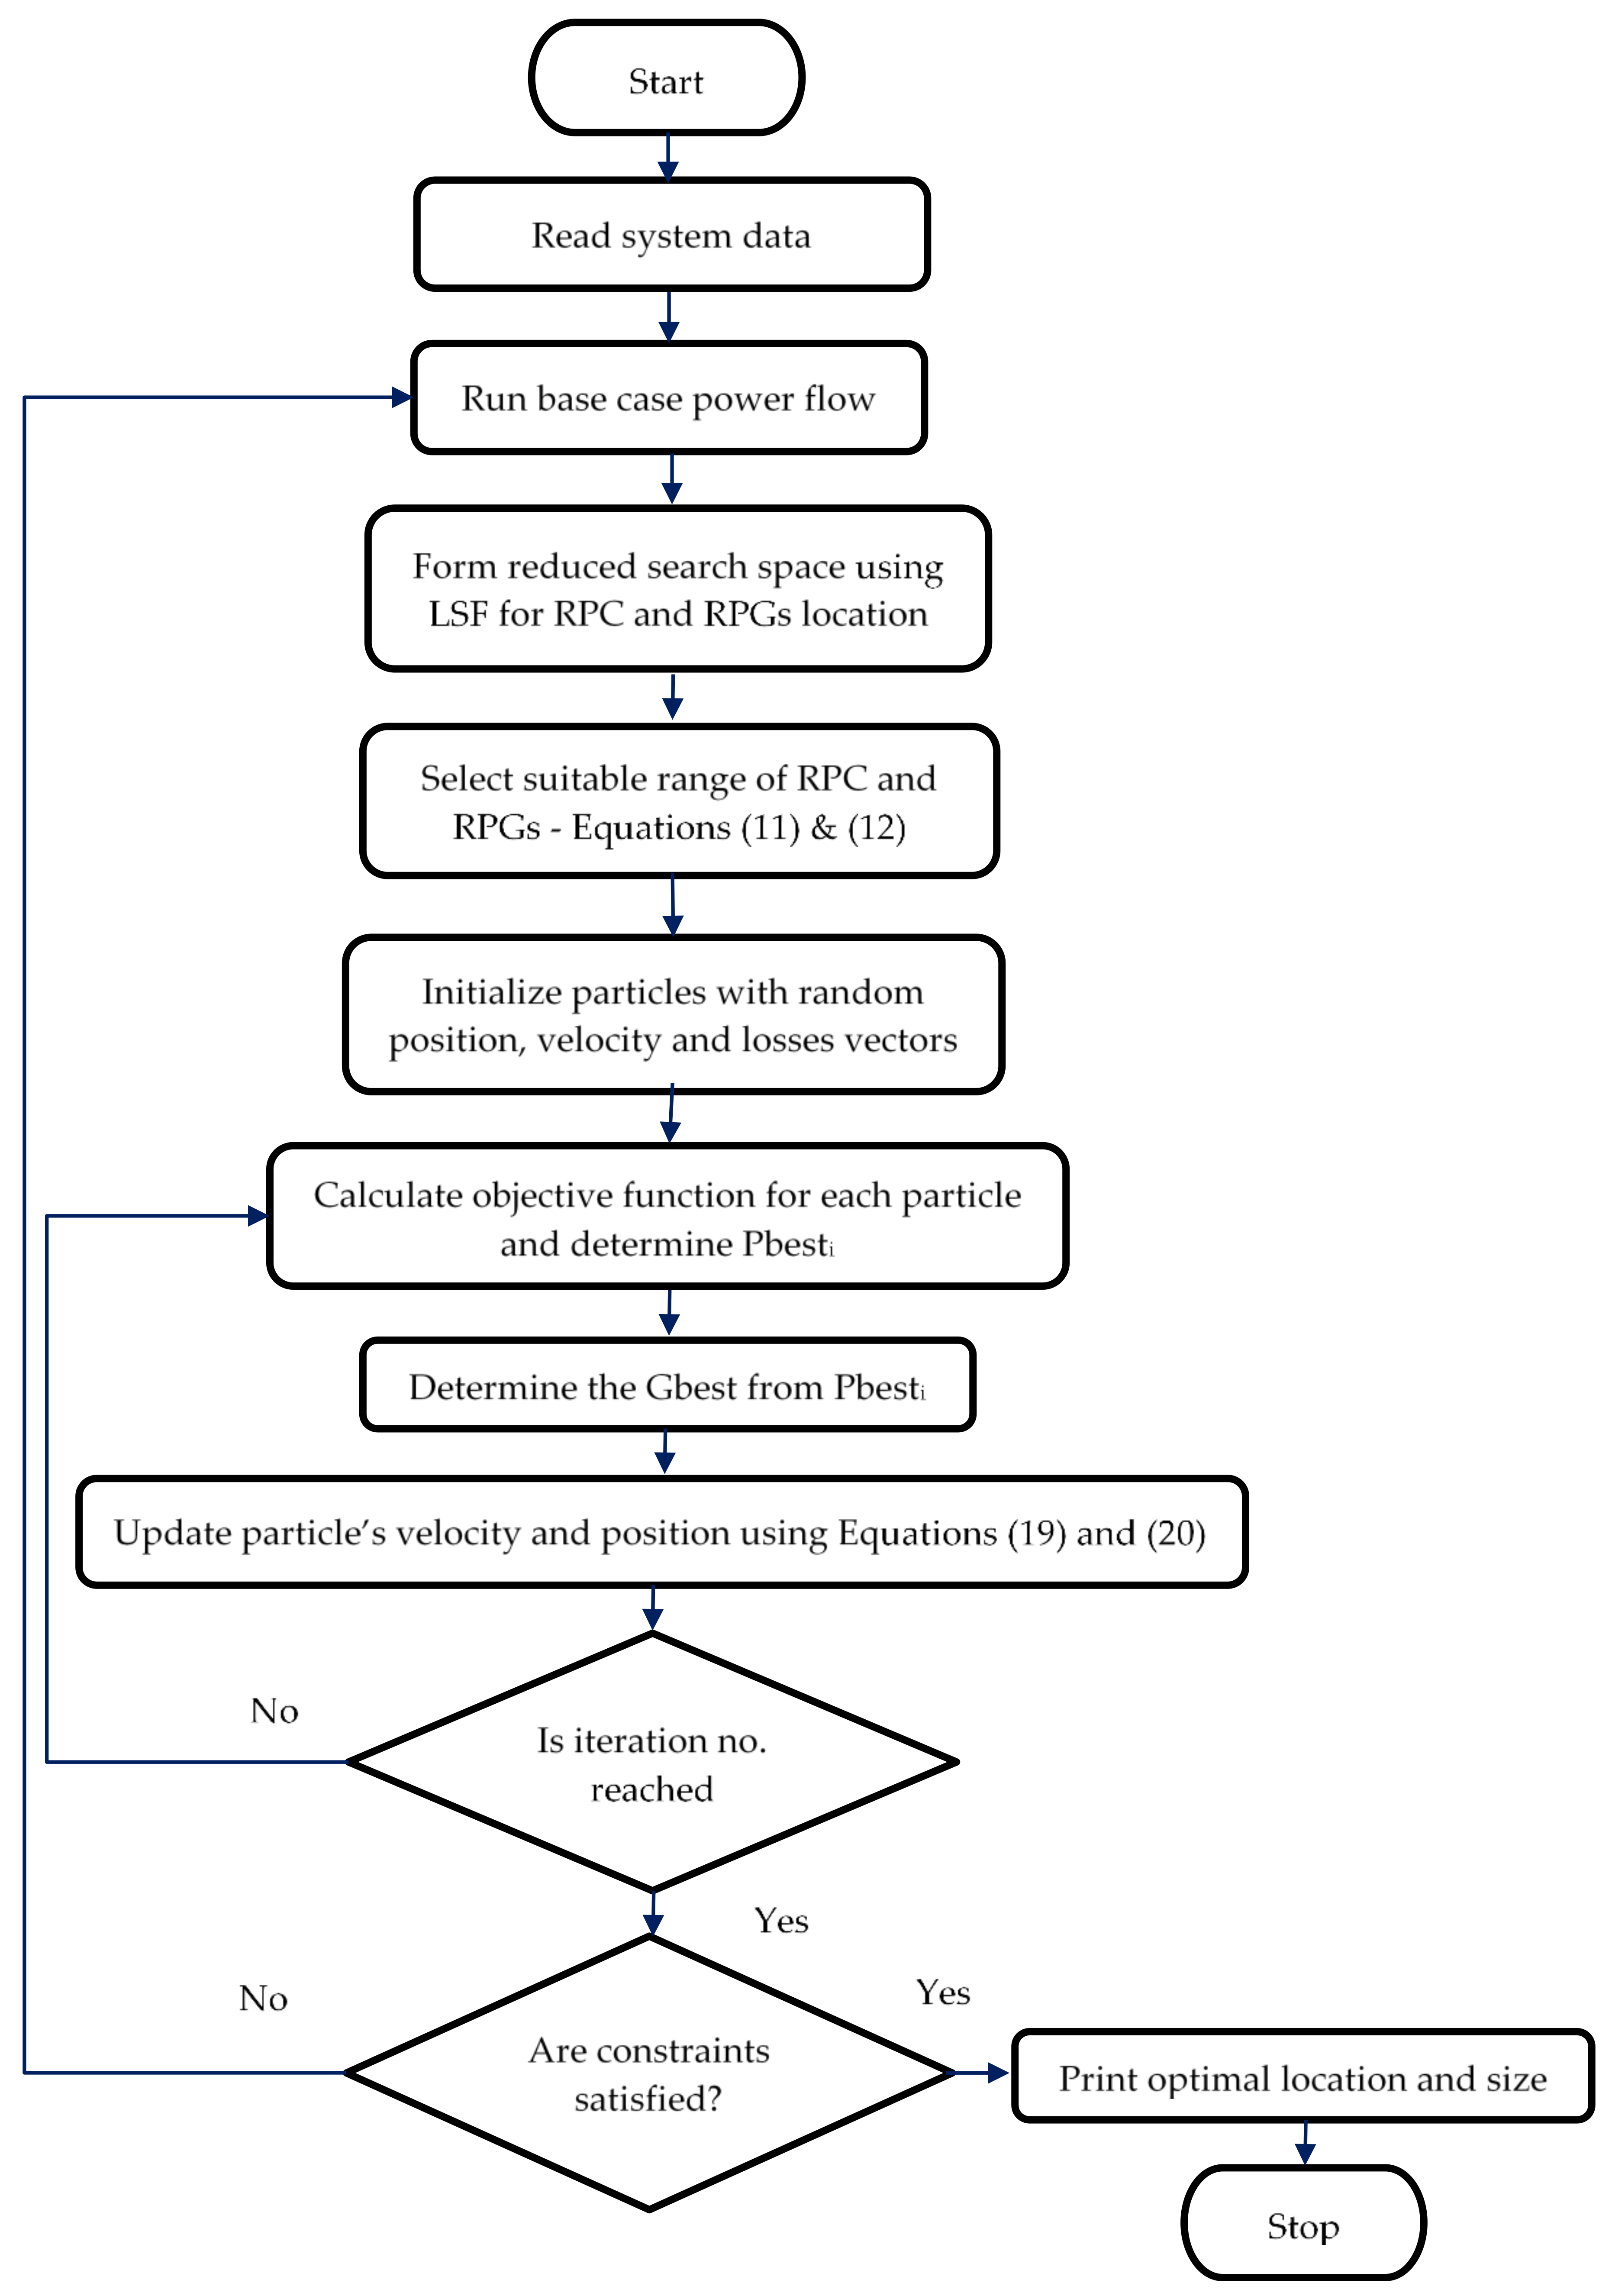
4. Algorithm
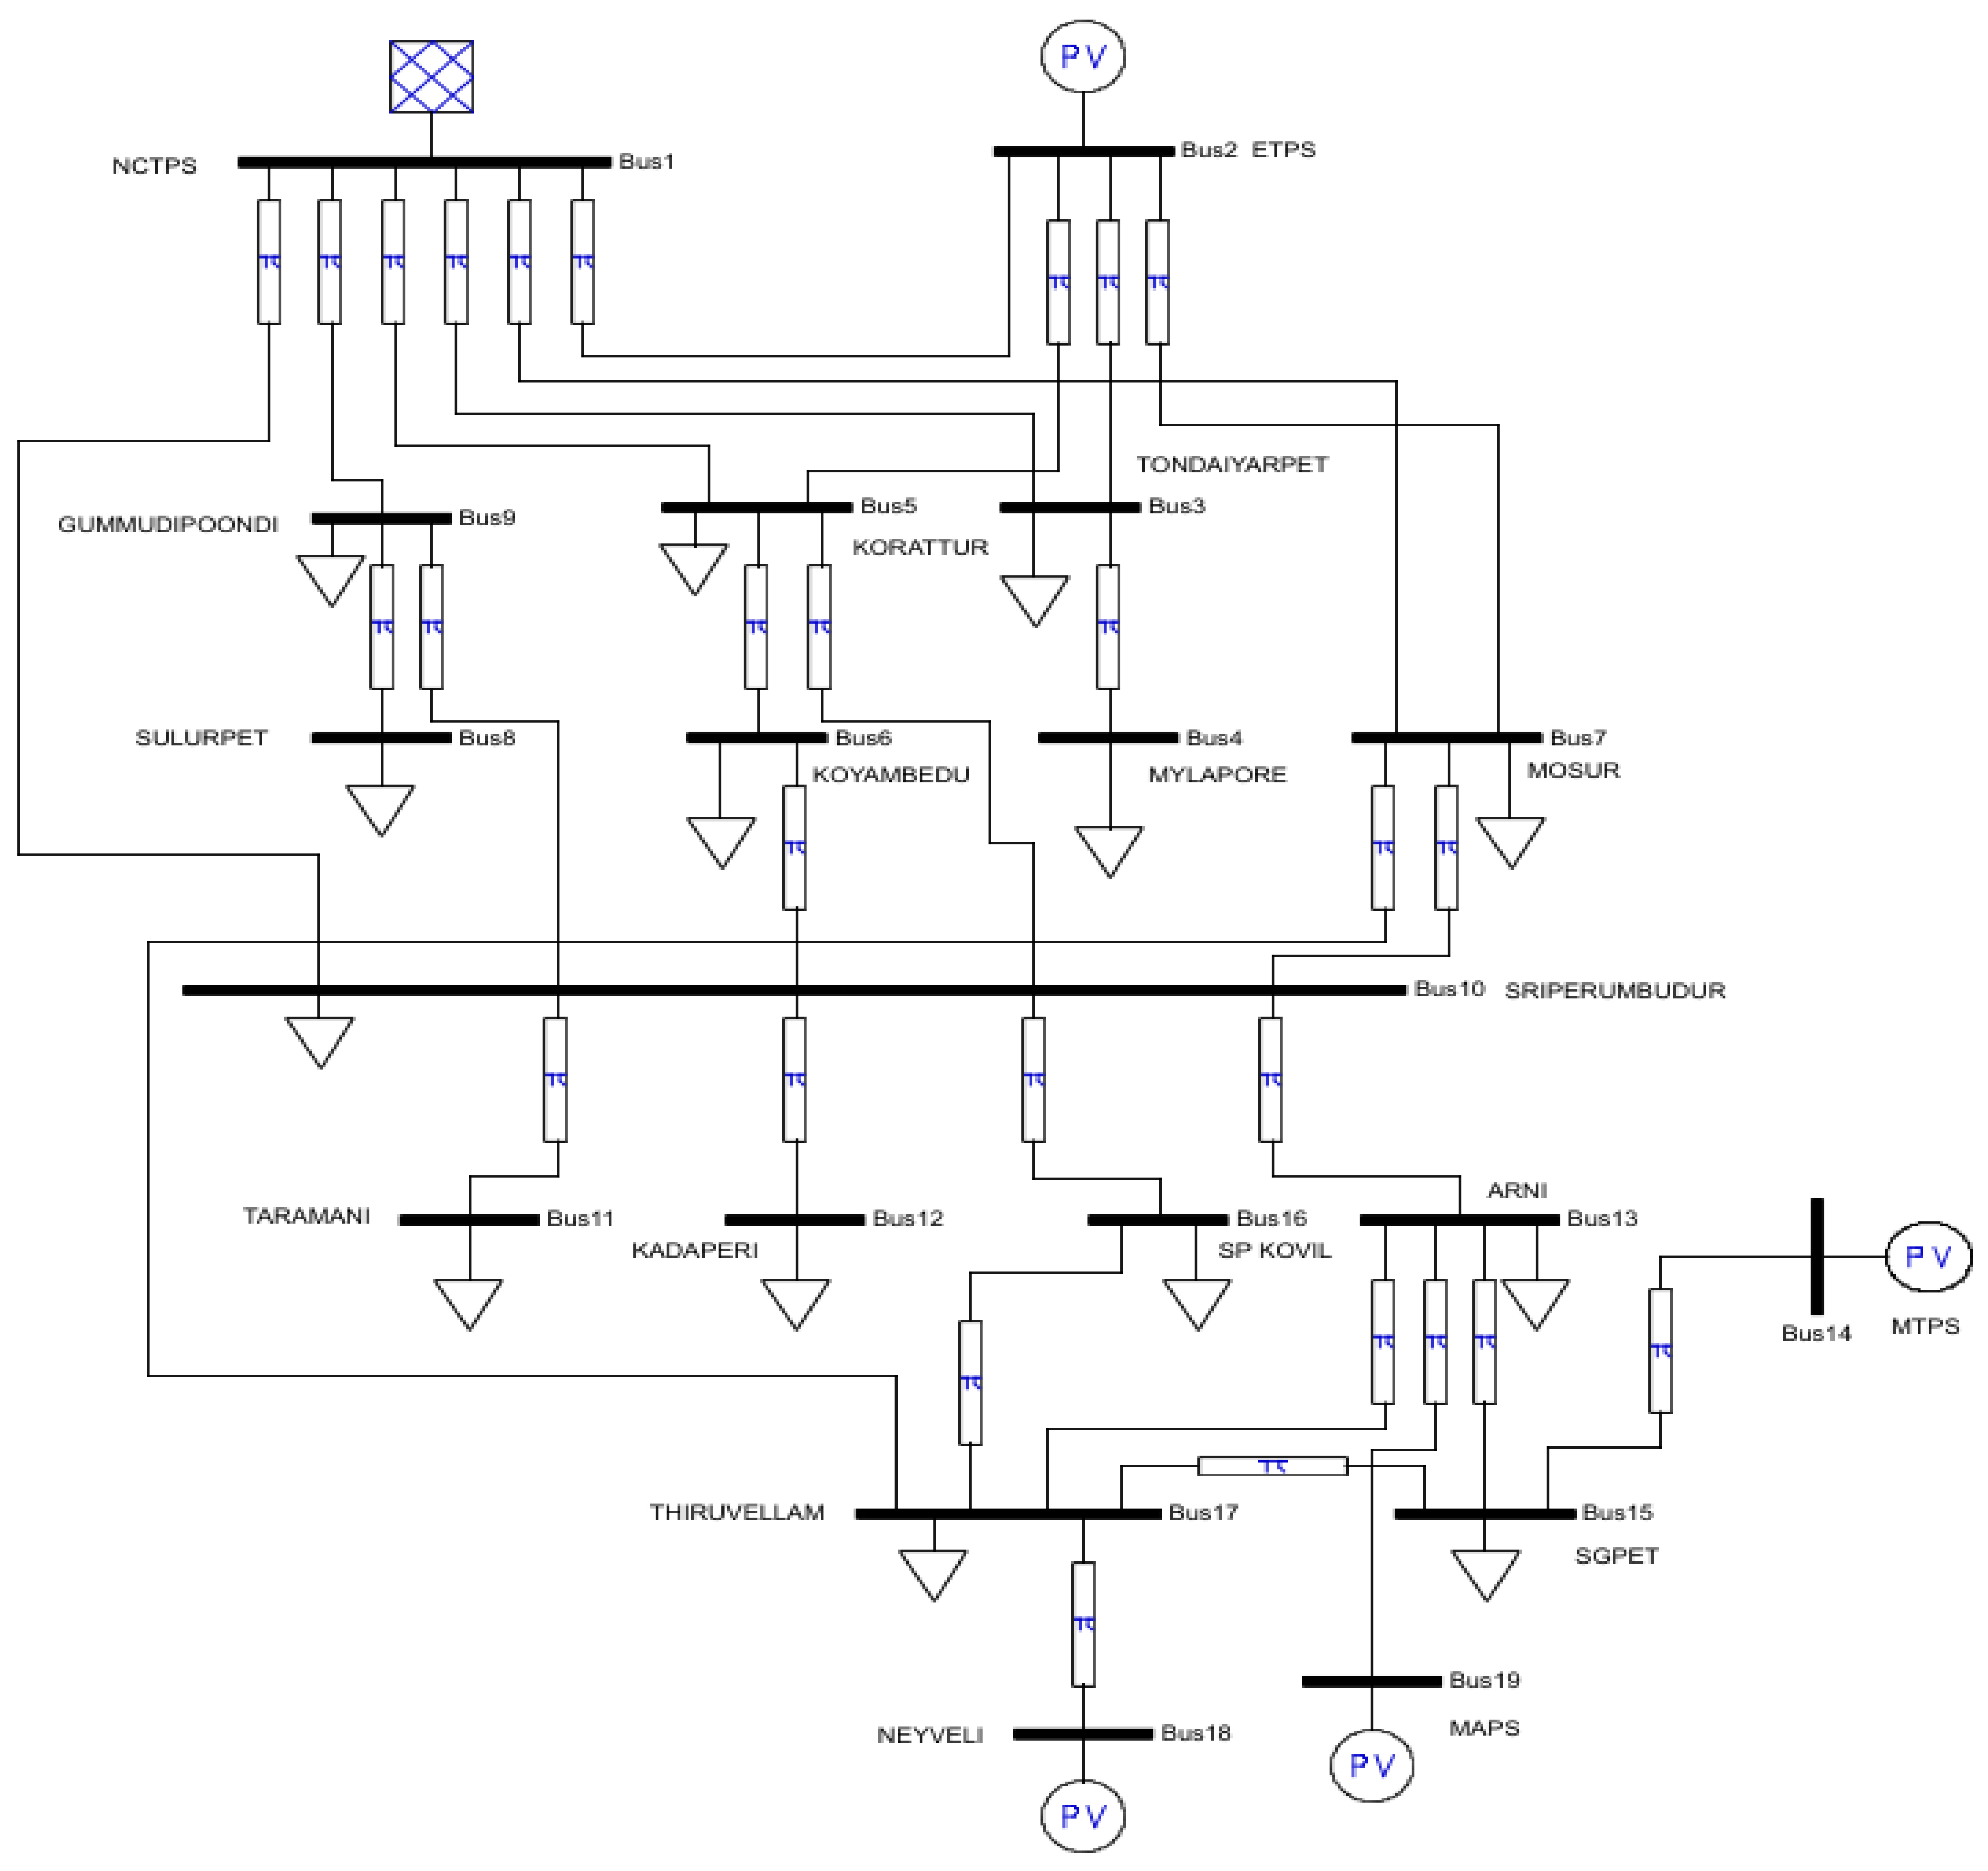
5. Description of the IUPS
- Inertia weight (Wt) = 1 (for improved convergence and stability).
- Update coefficient (alpha) = 0.05 (to speed up the convergence).
- Cognitive and social components (c1 and c2) = 2 (to avoid local optima).
- Number of particles = 50 (optimal performance).
- The stopping criterion is set as the maximum number of iterations = 100.
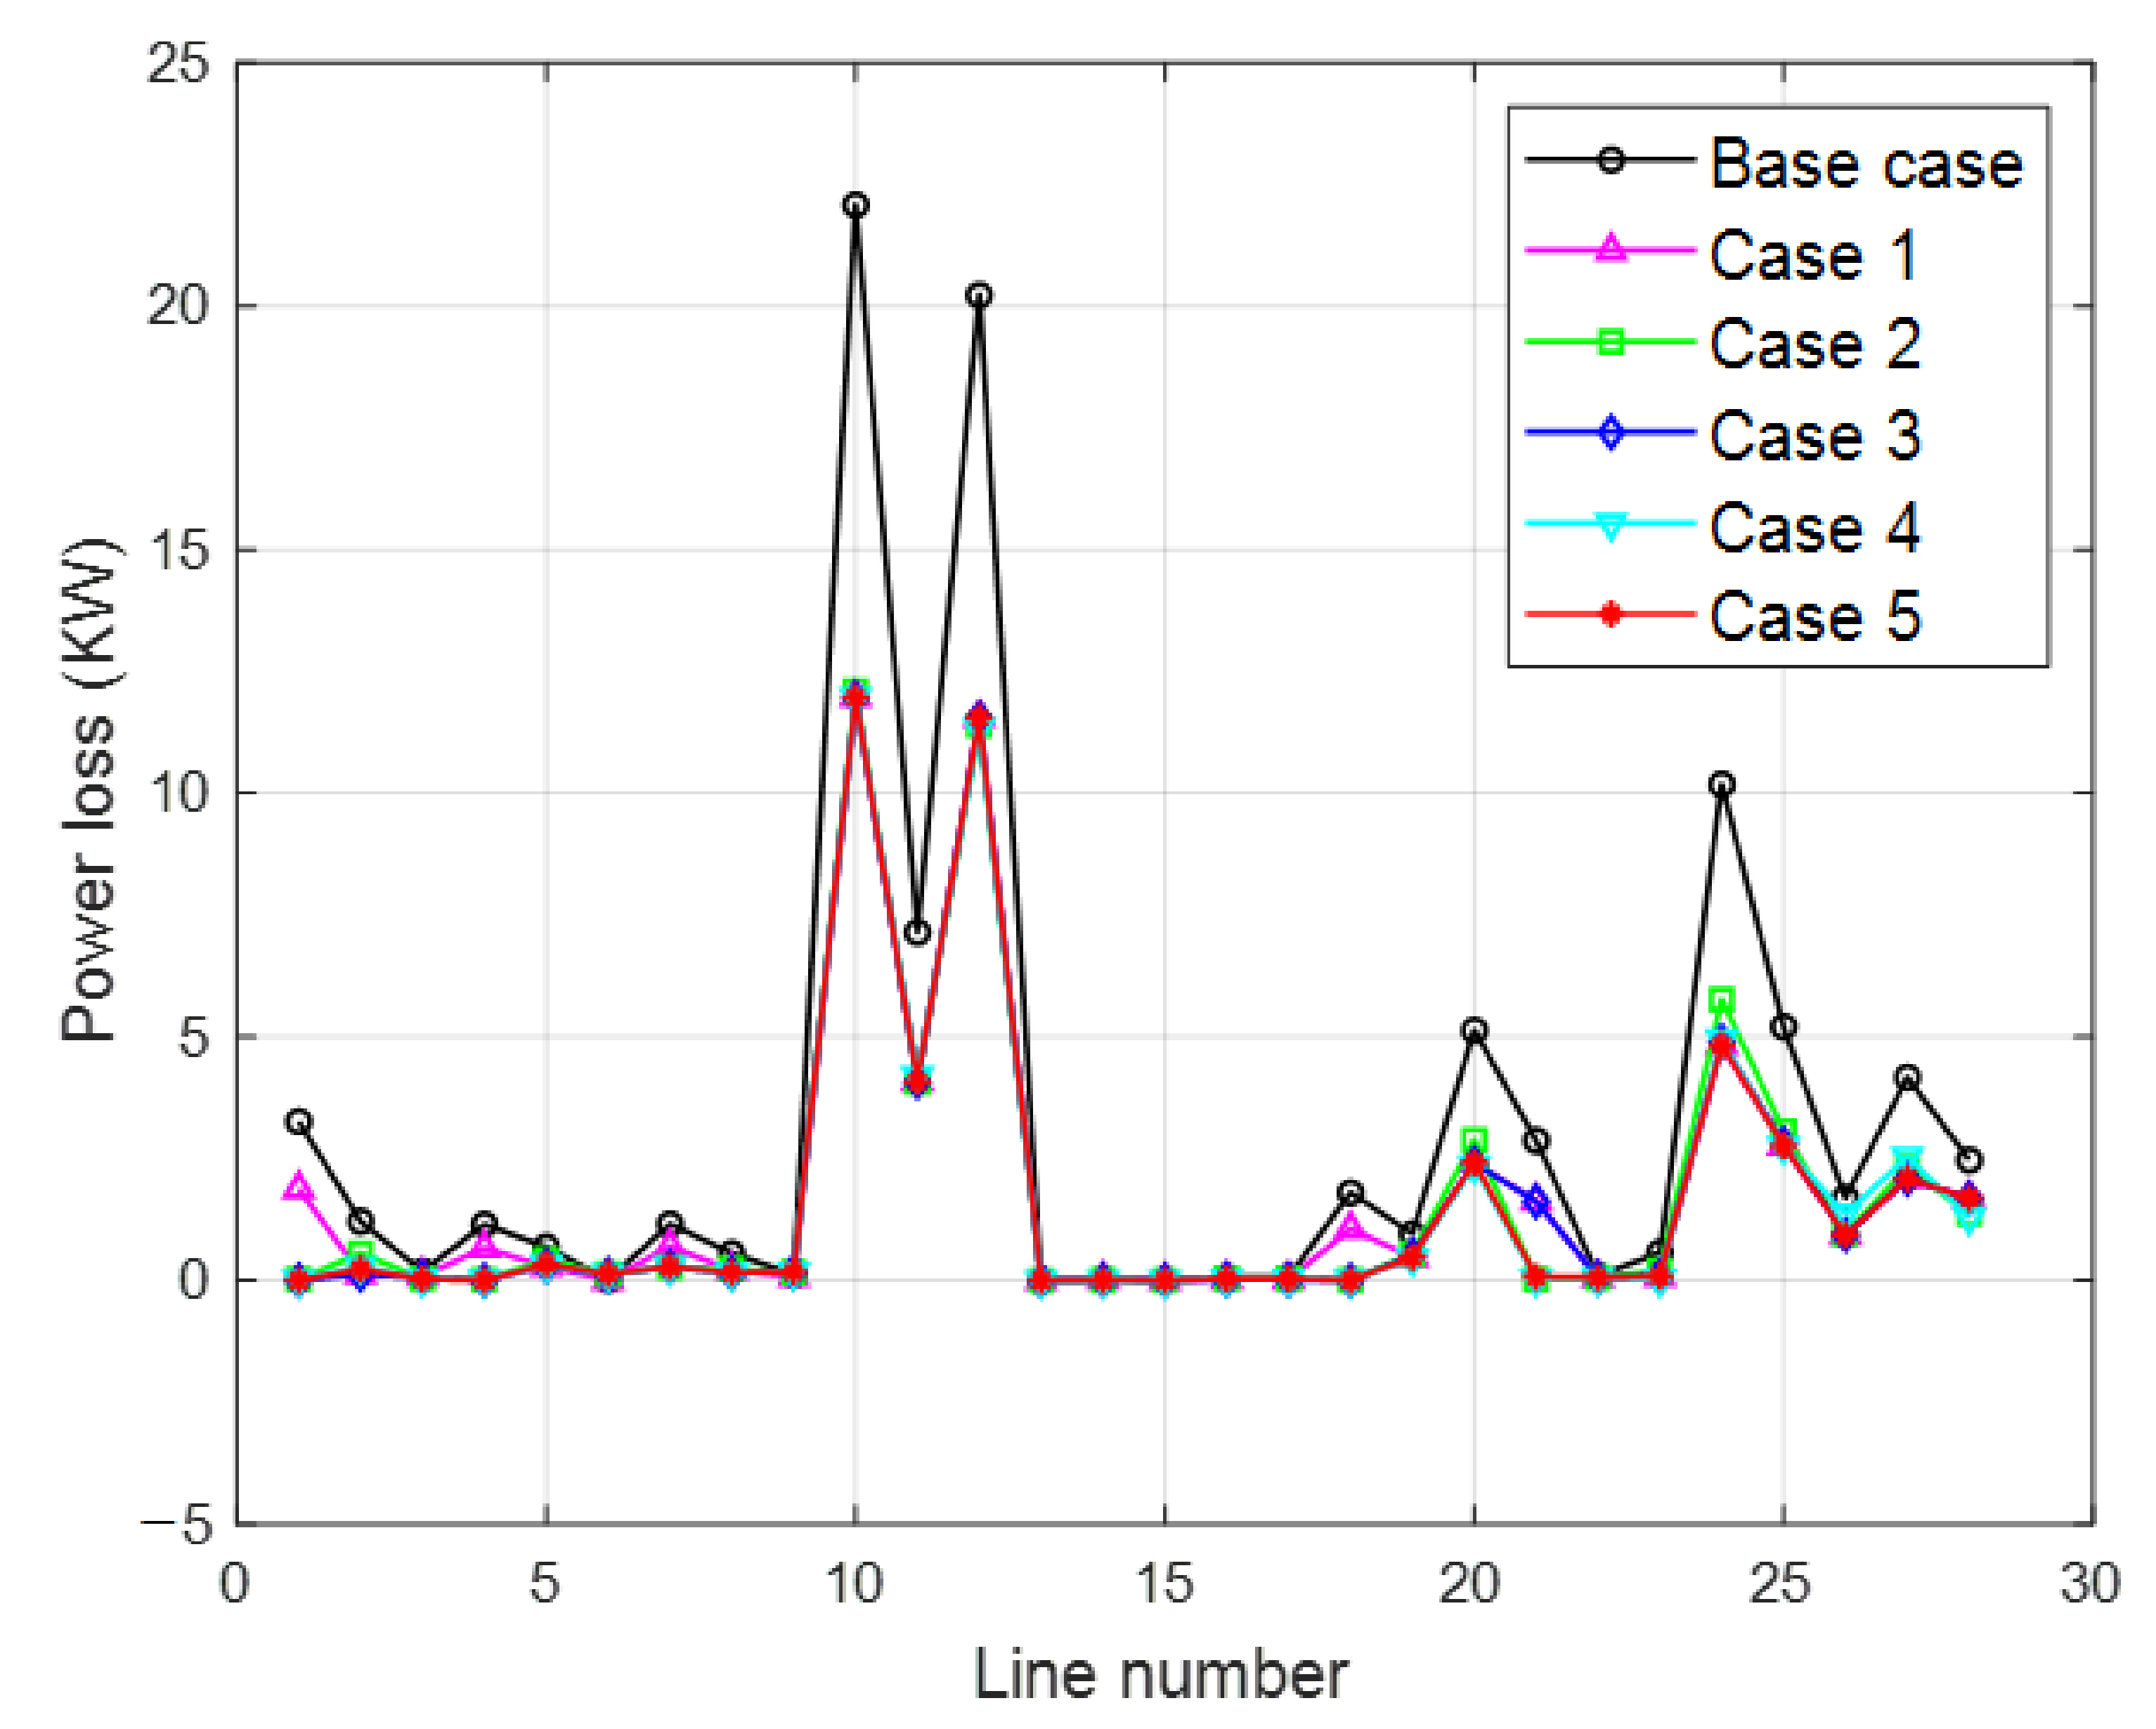
6. Numerical Results
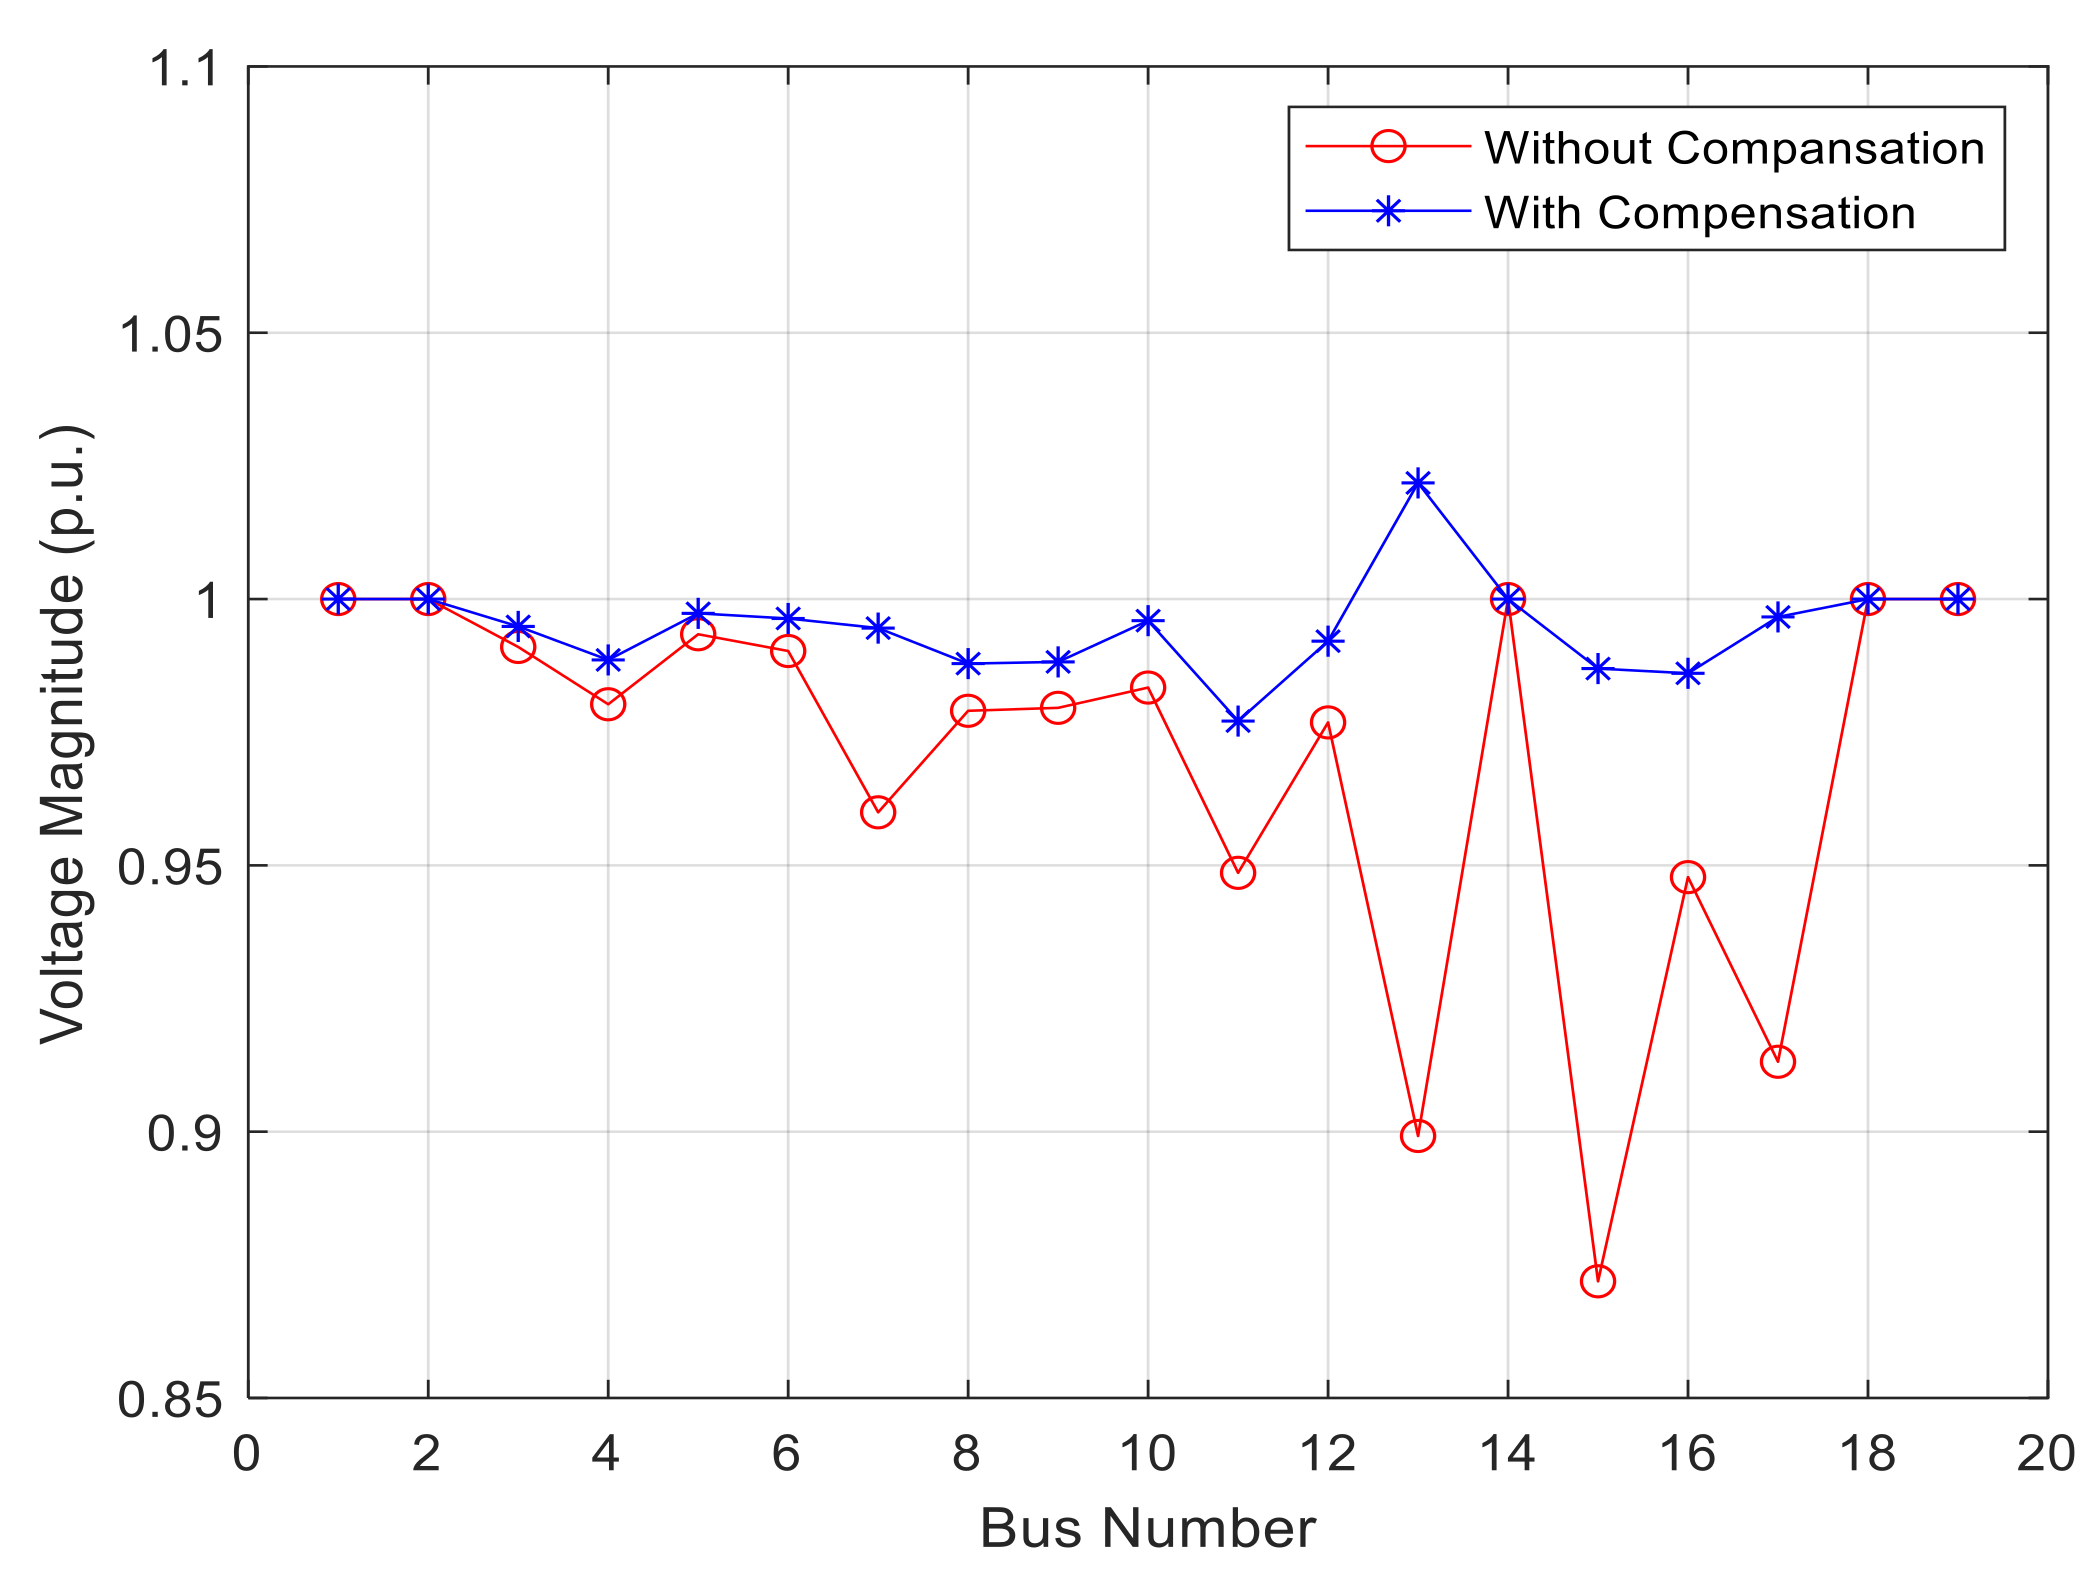
6.1. Case 1
6.2. Case 2
6.3. Case 3
6.4. Case 4
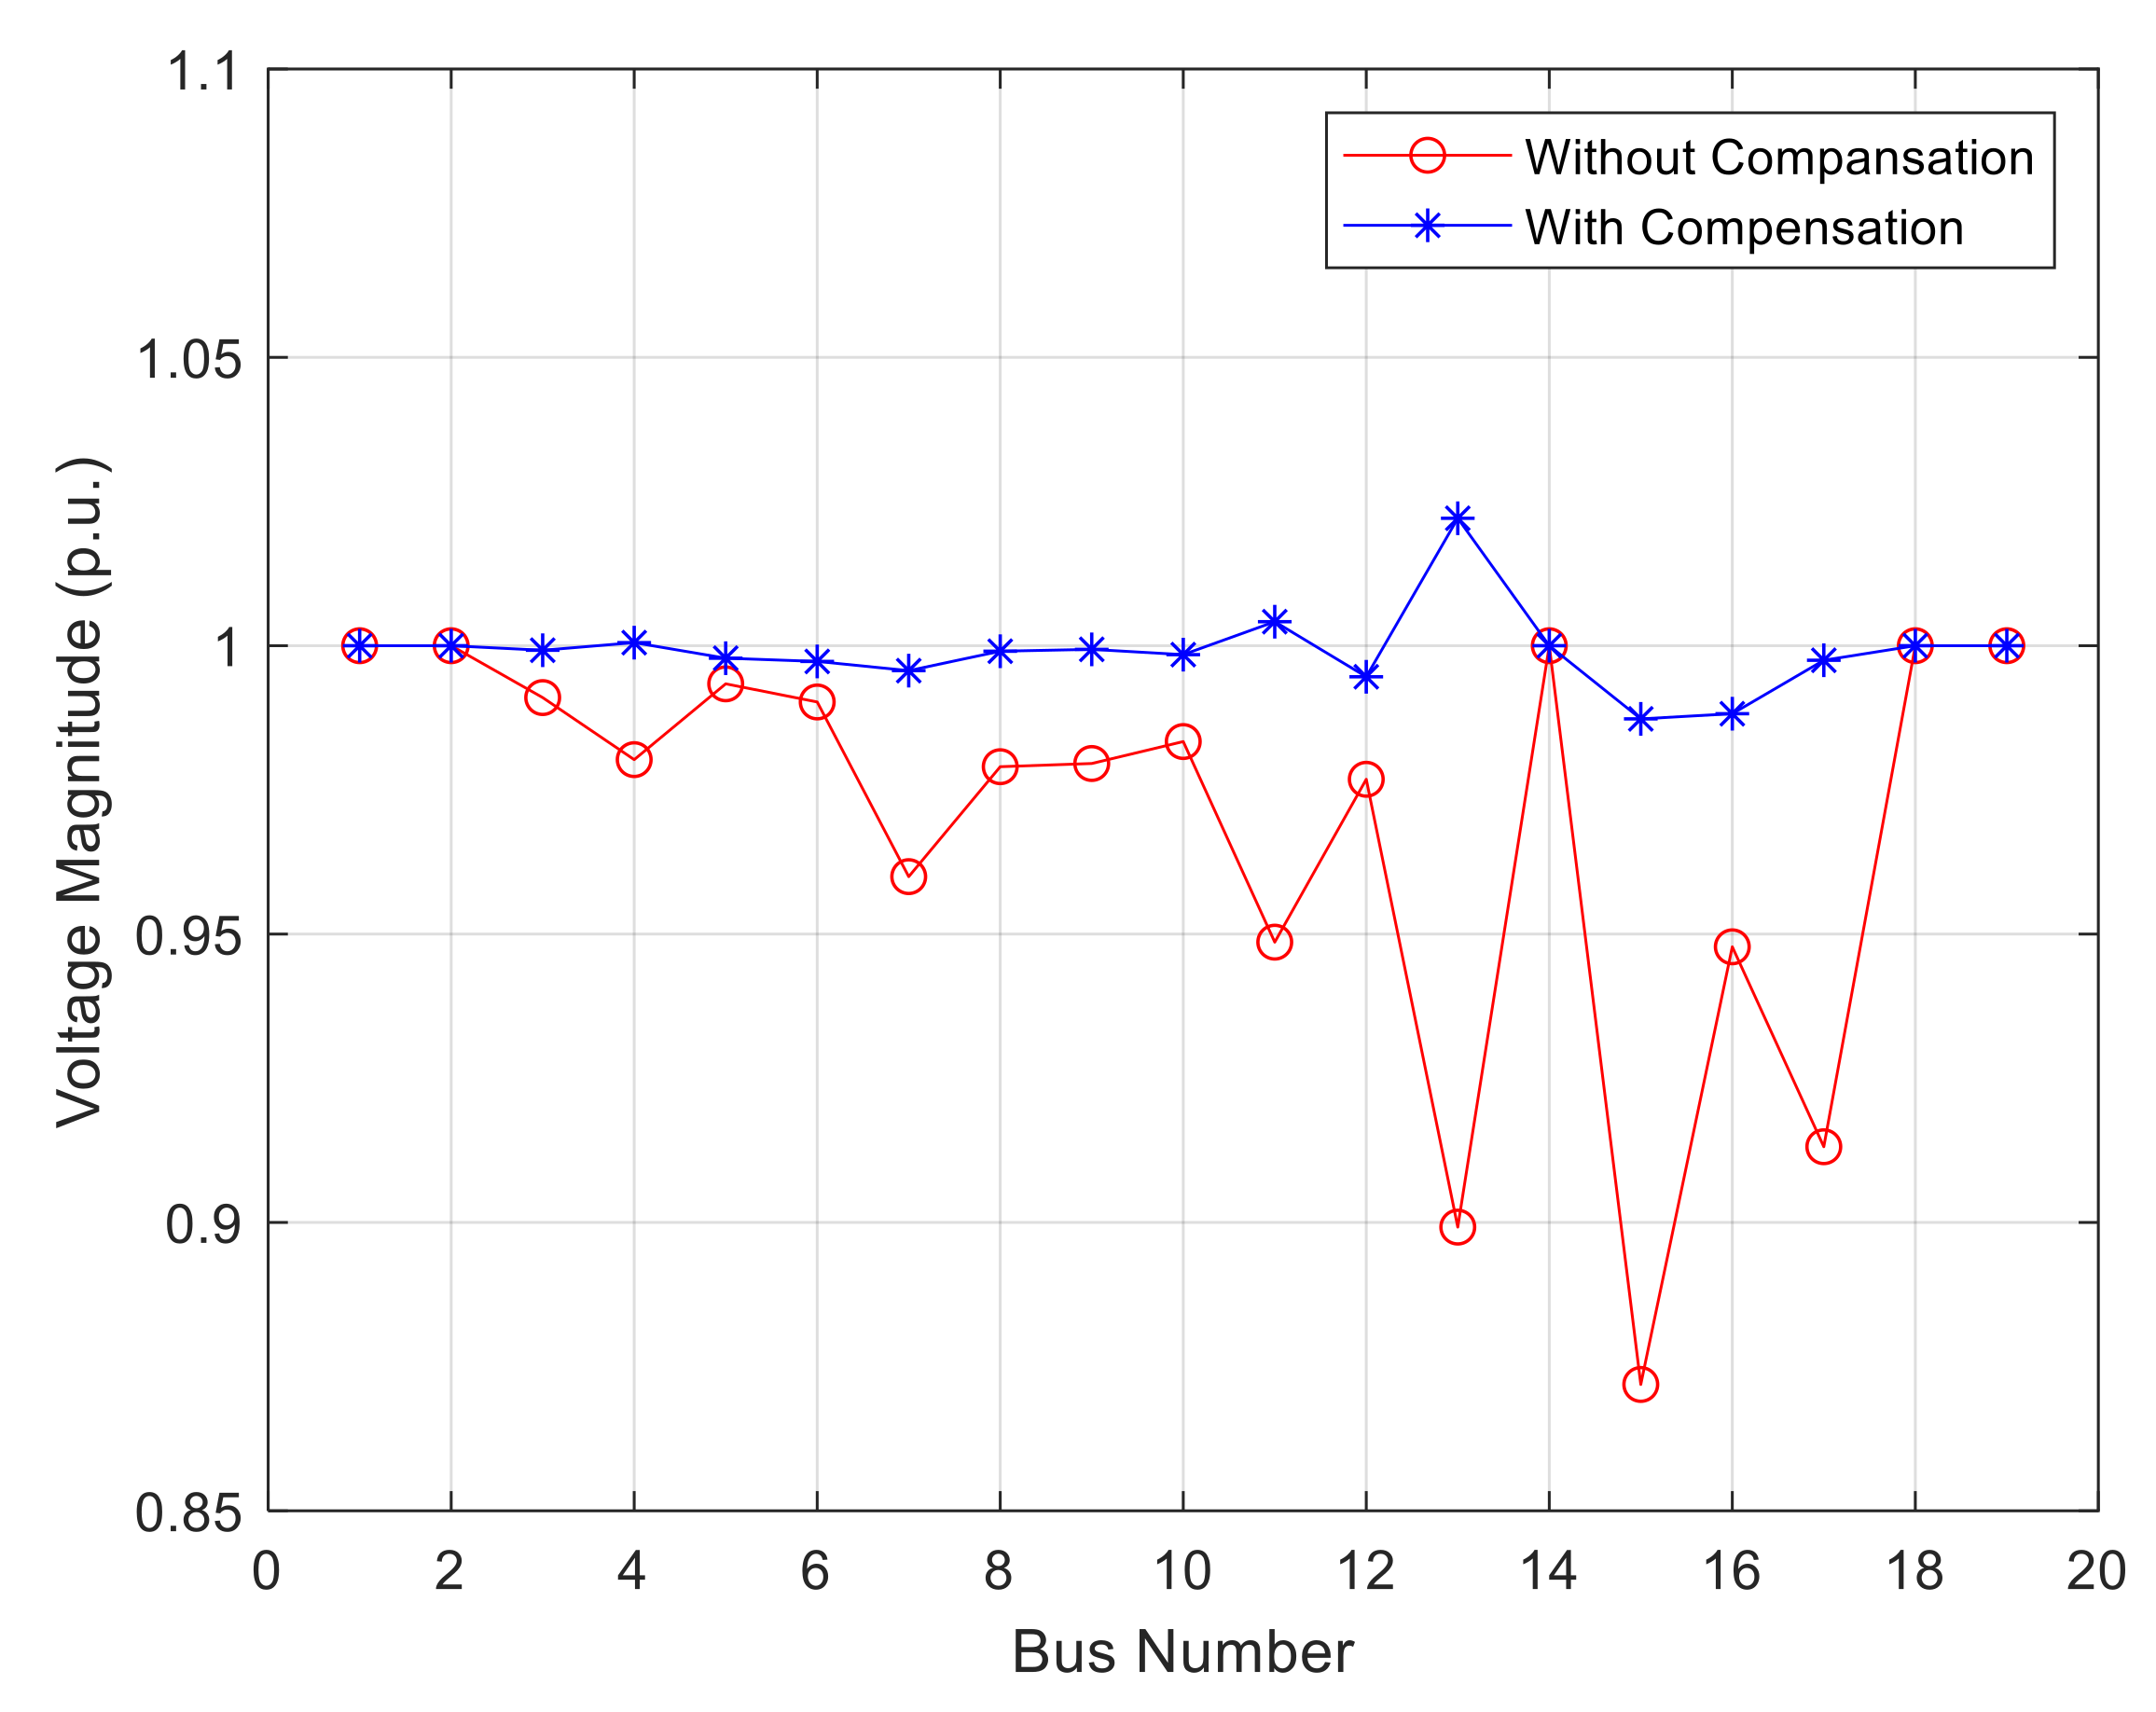
6.5. Case 5
7. Comparative Analysis
7.1. Technical Parameters
7.2. Cost Analysis
- Generating cost of the uncompensated system was $52,478/hr.
- Generating cost of the compensated system for case 5, i.e., best case (optimal placement and sizing of RPC and RPGs at 0.85 LPF) was $33,449/hr.
- From the results, it was found that the total cost savings of 36.26% were obtained when RPGs at 0.85 LPF and RPC were allocated optimally in the IUPS.
7.3. Comparison with Existing Work
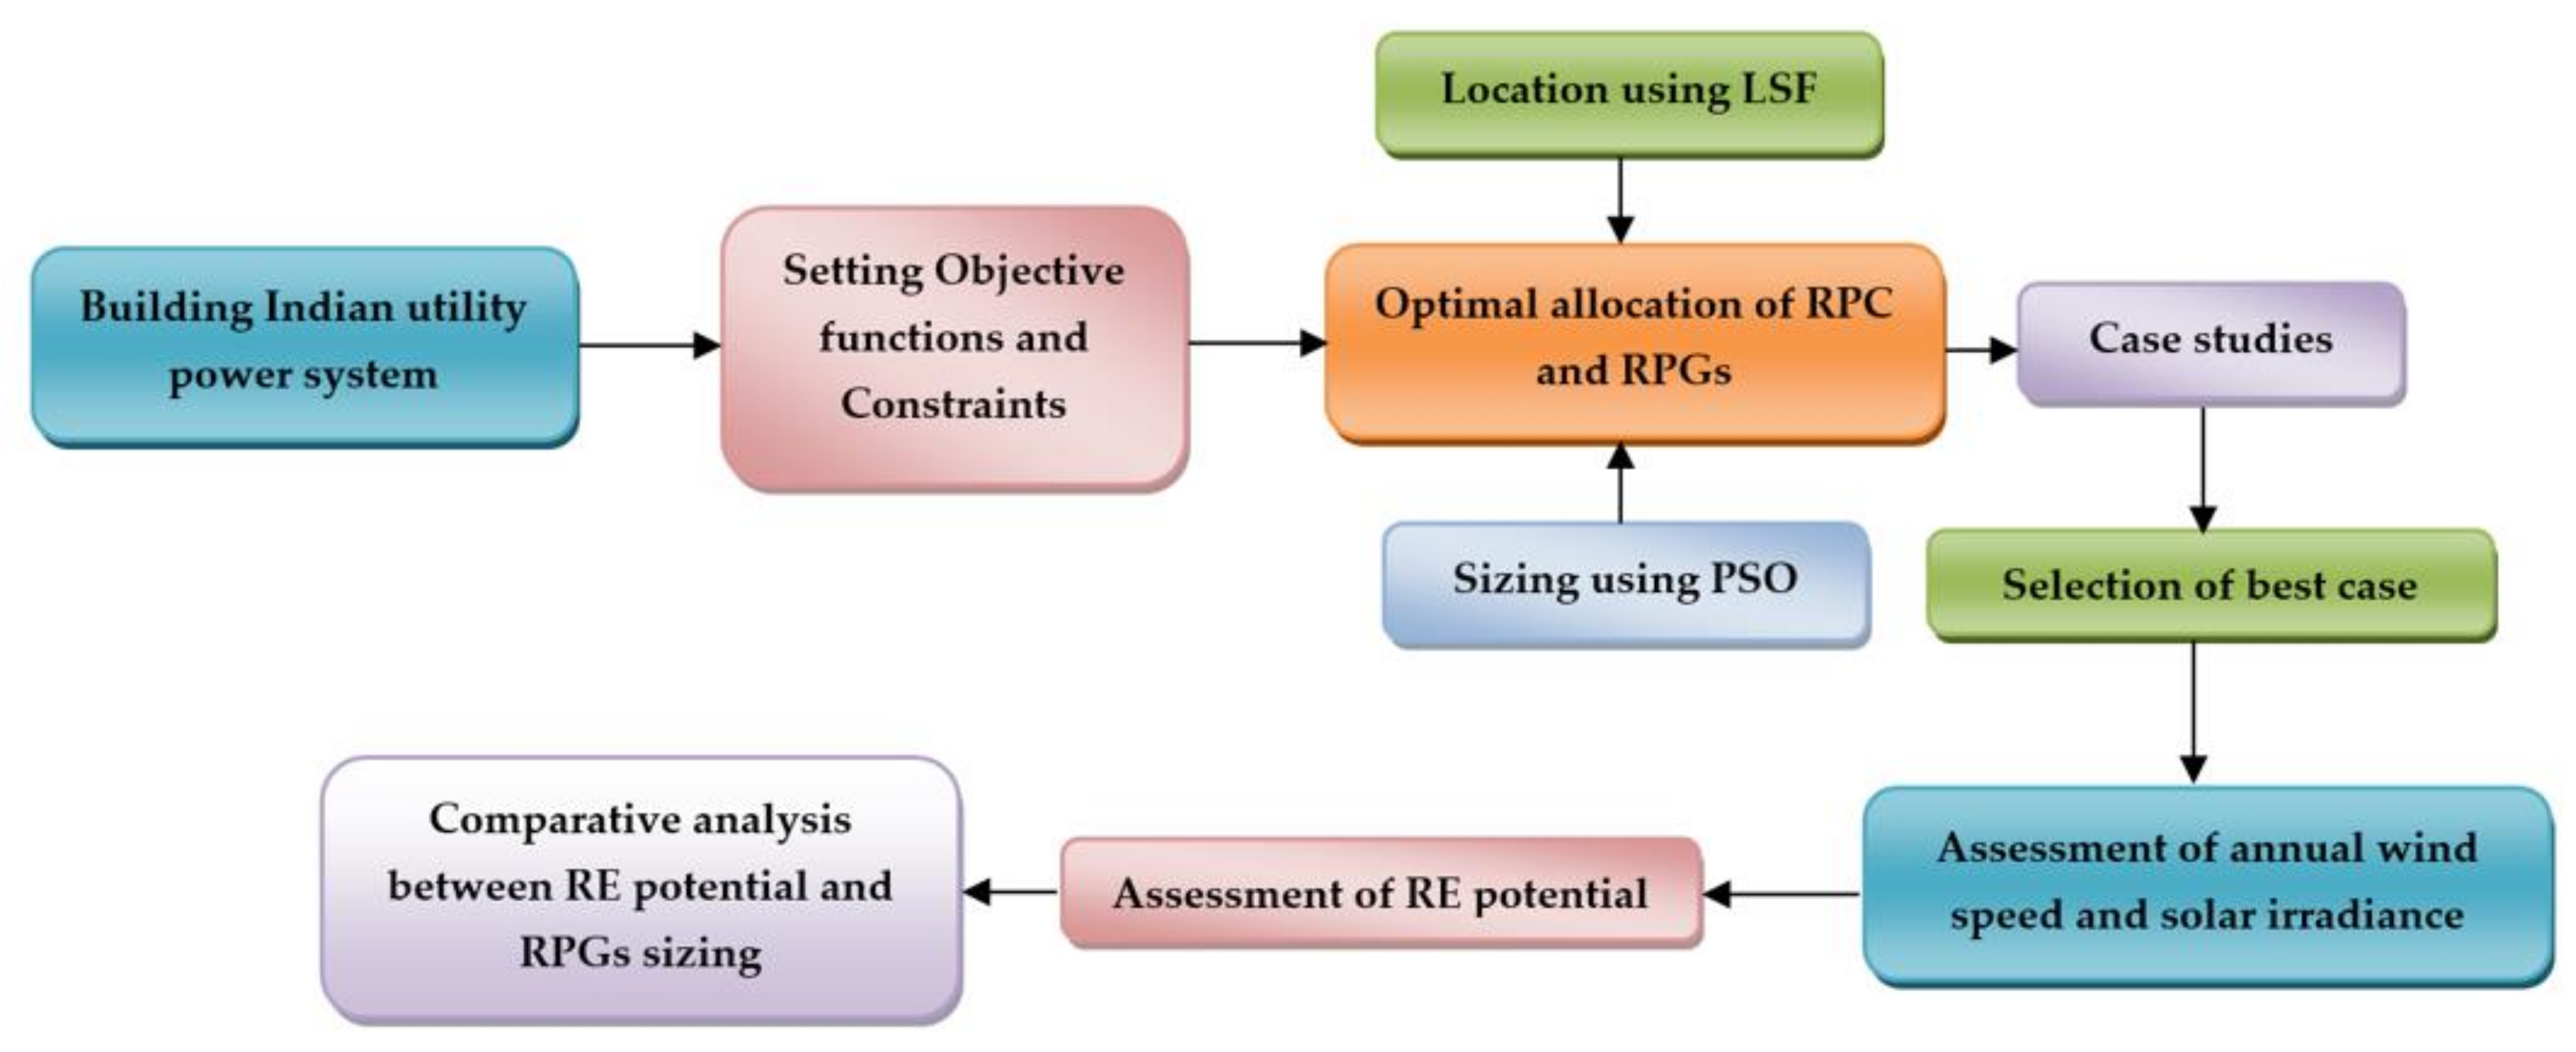
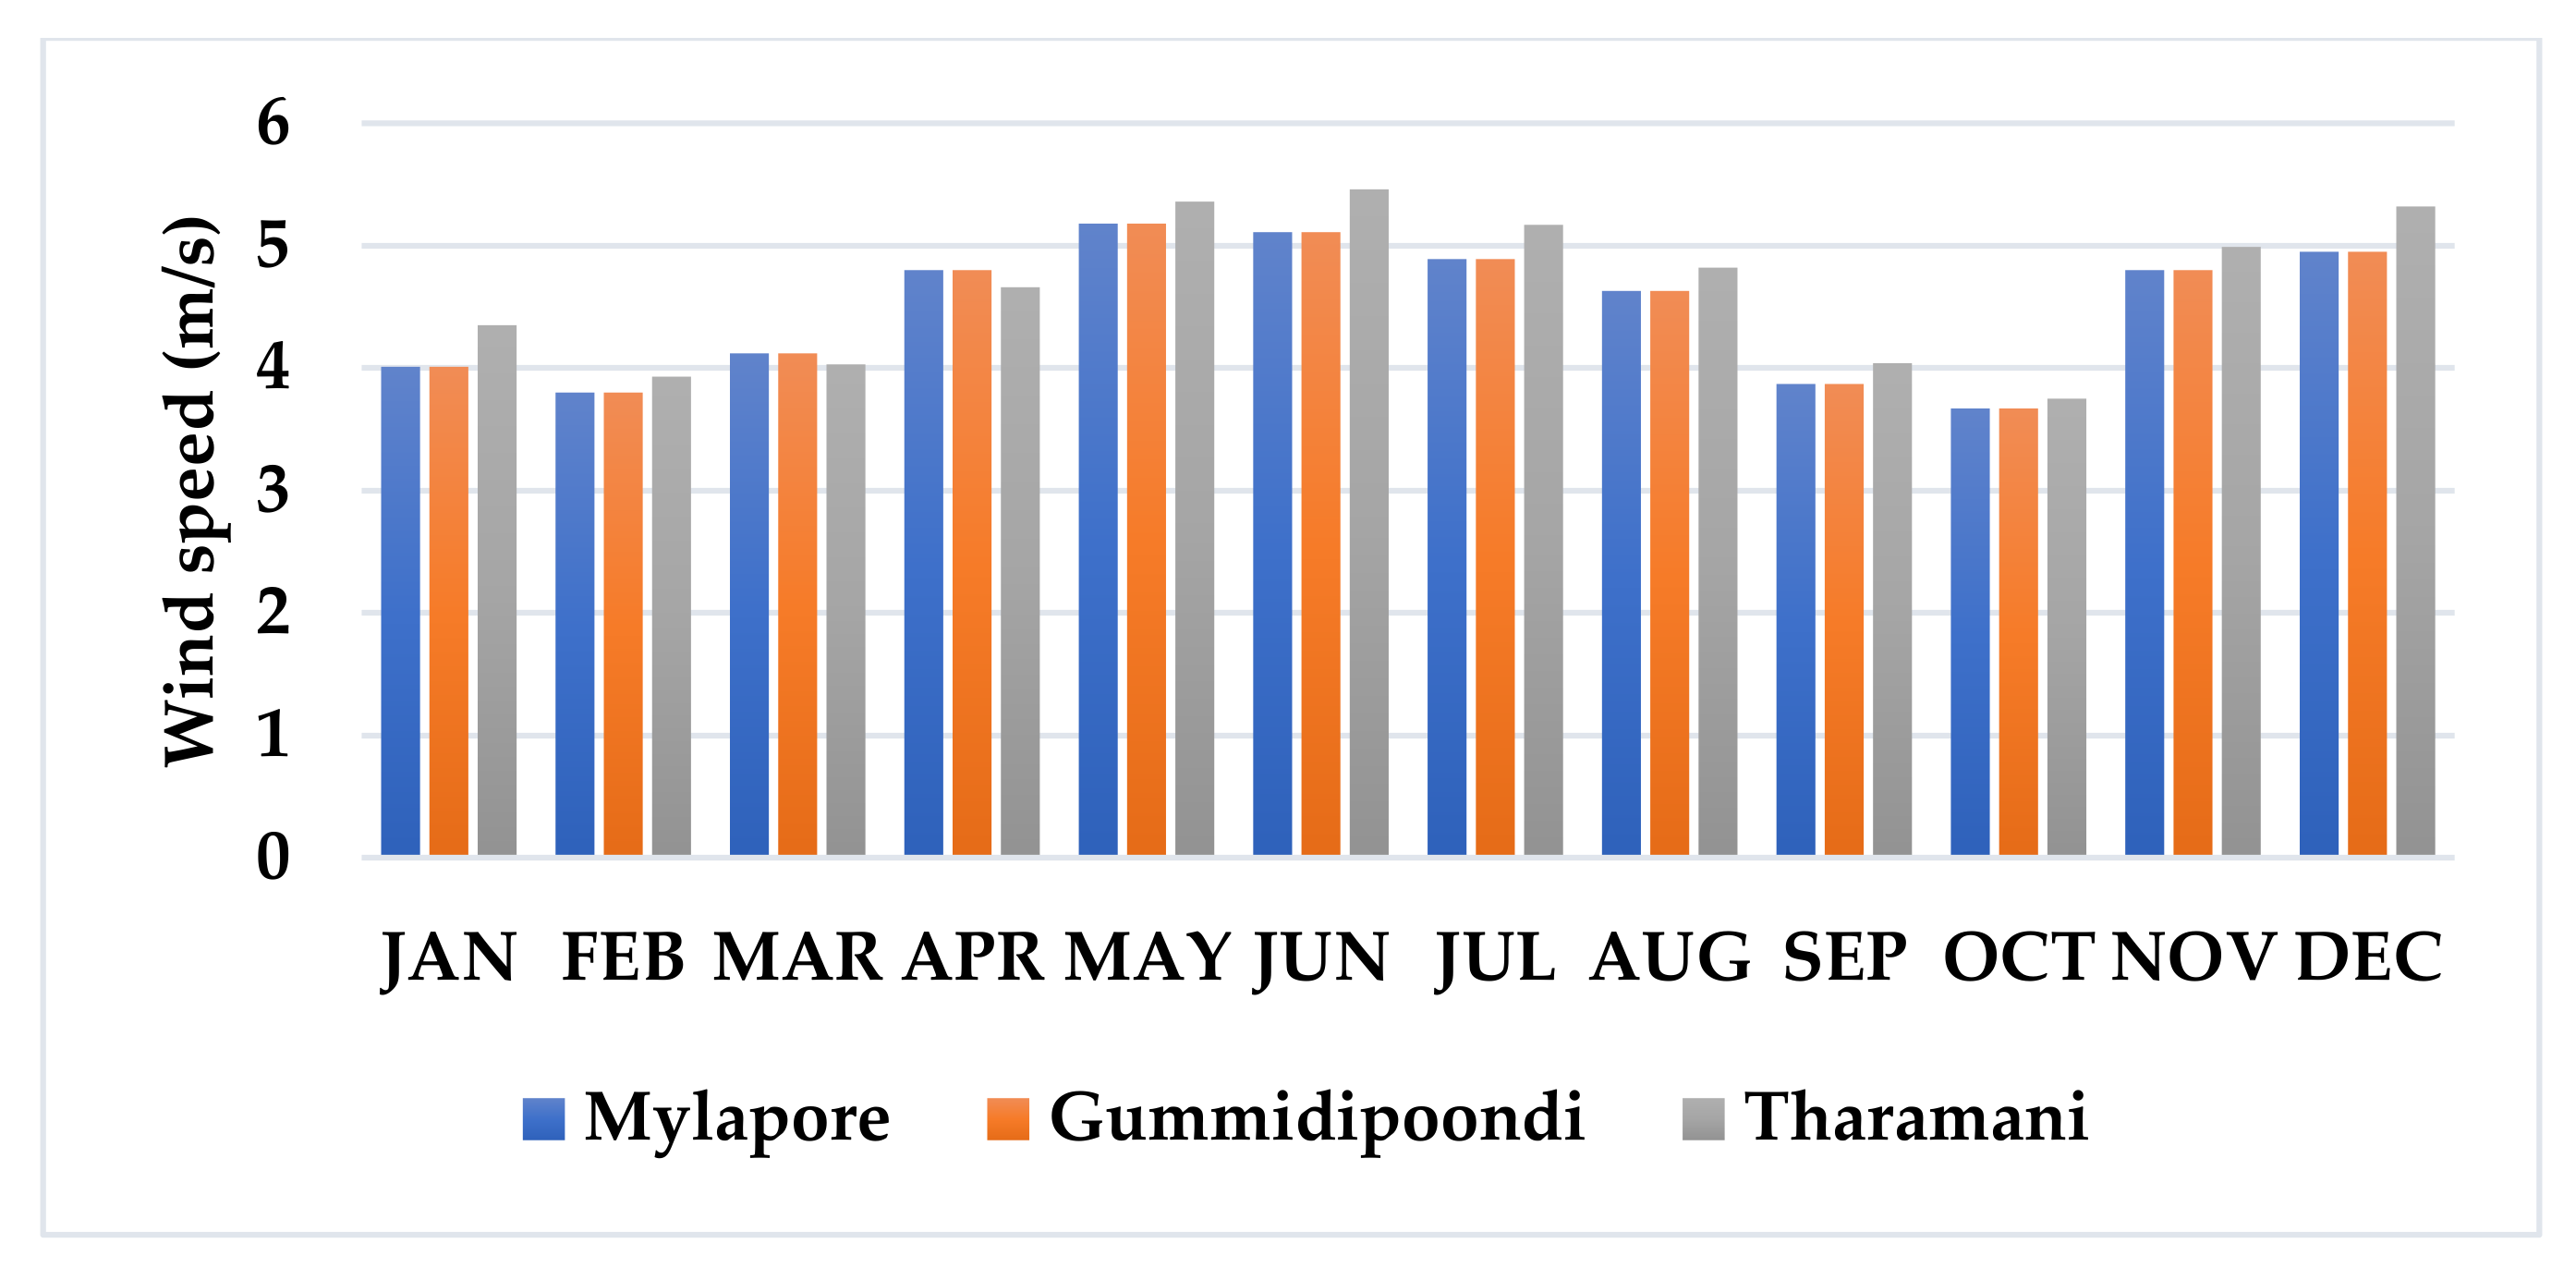
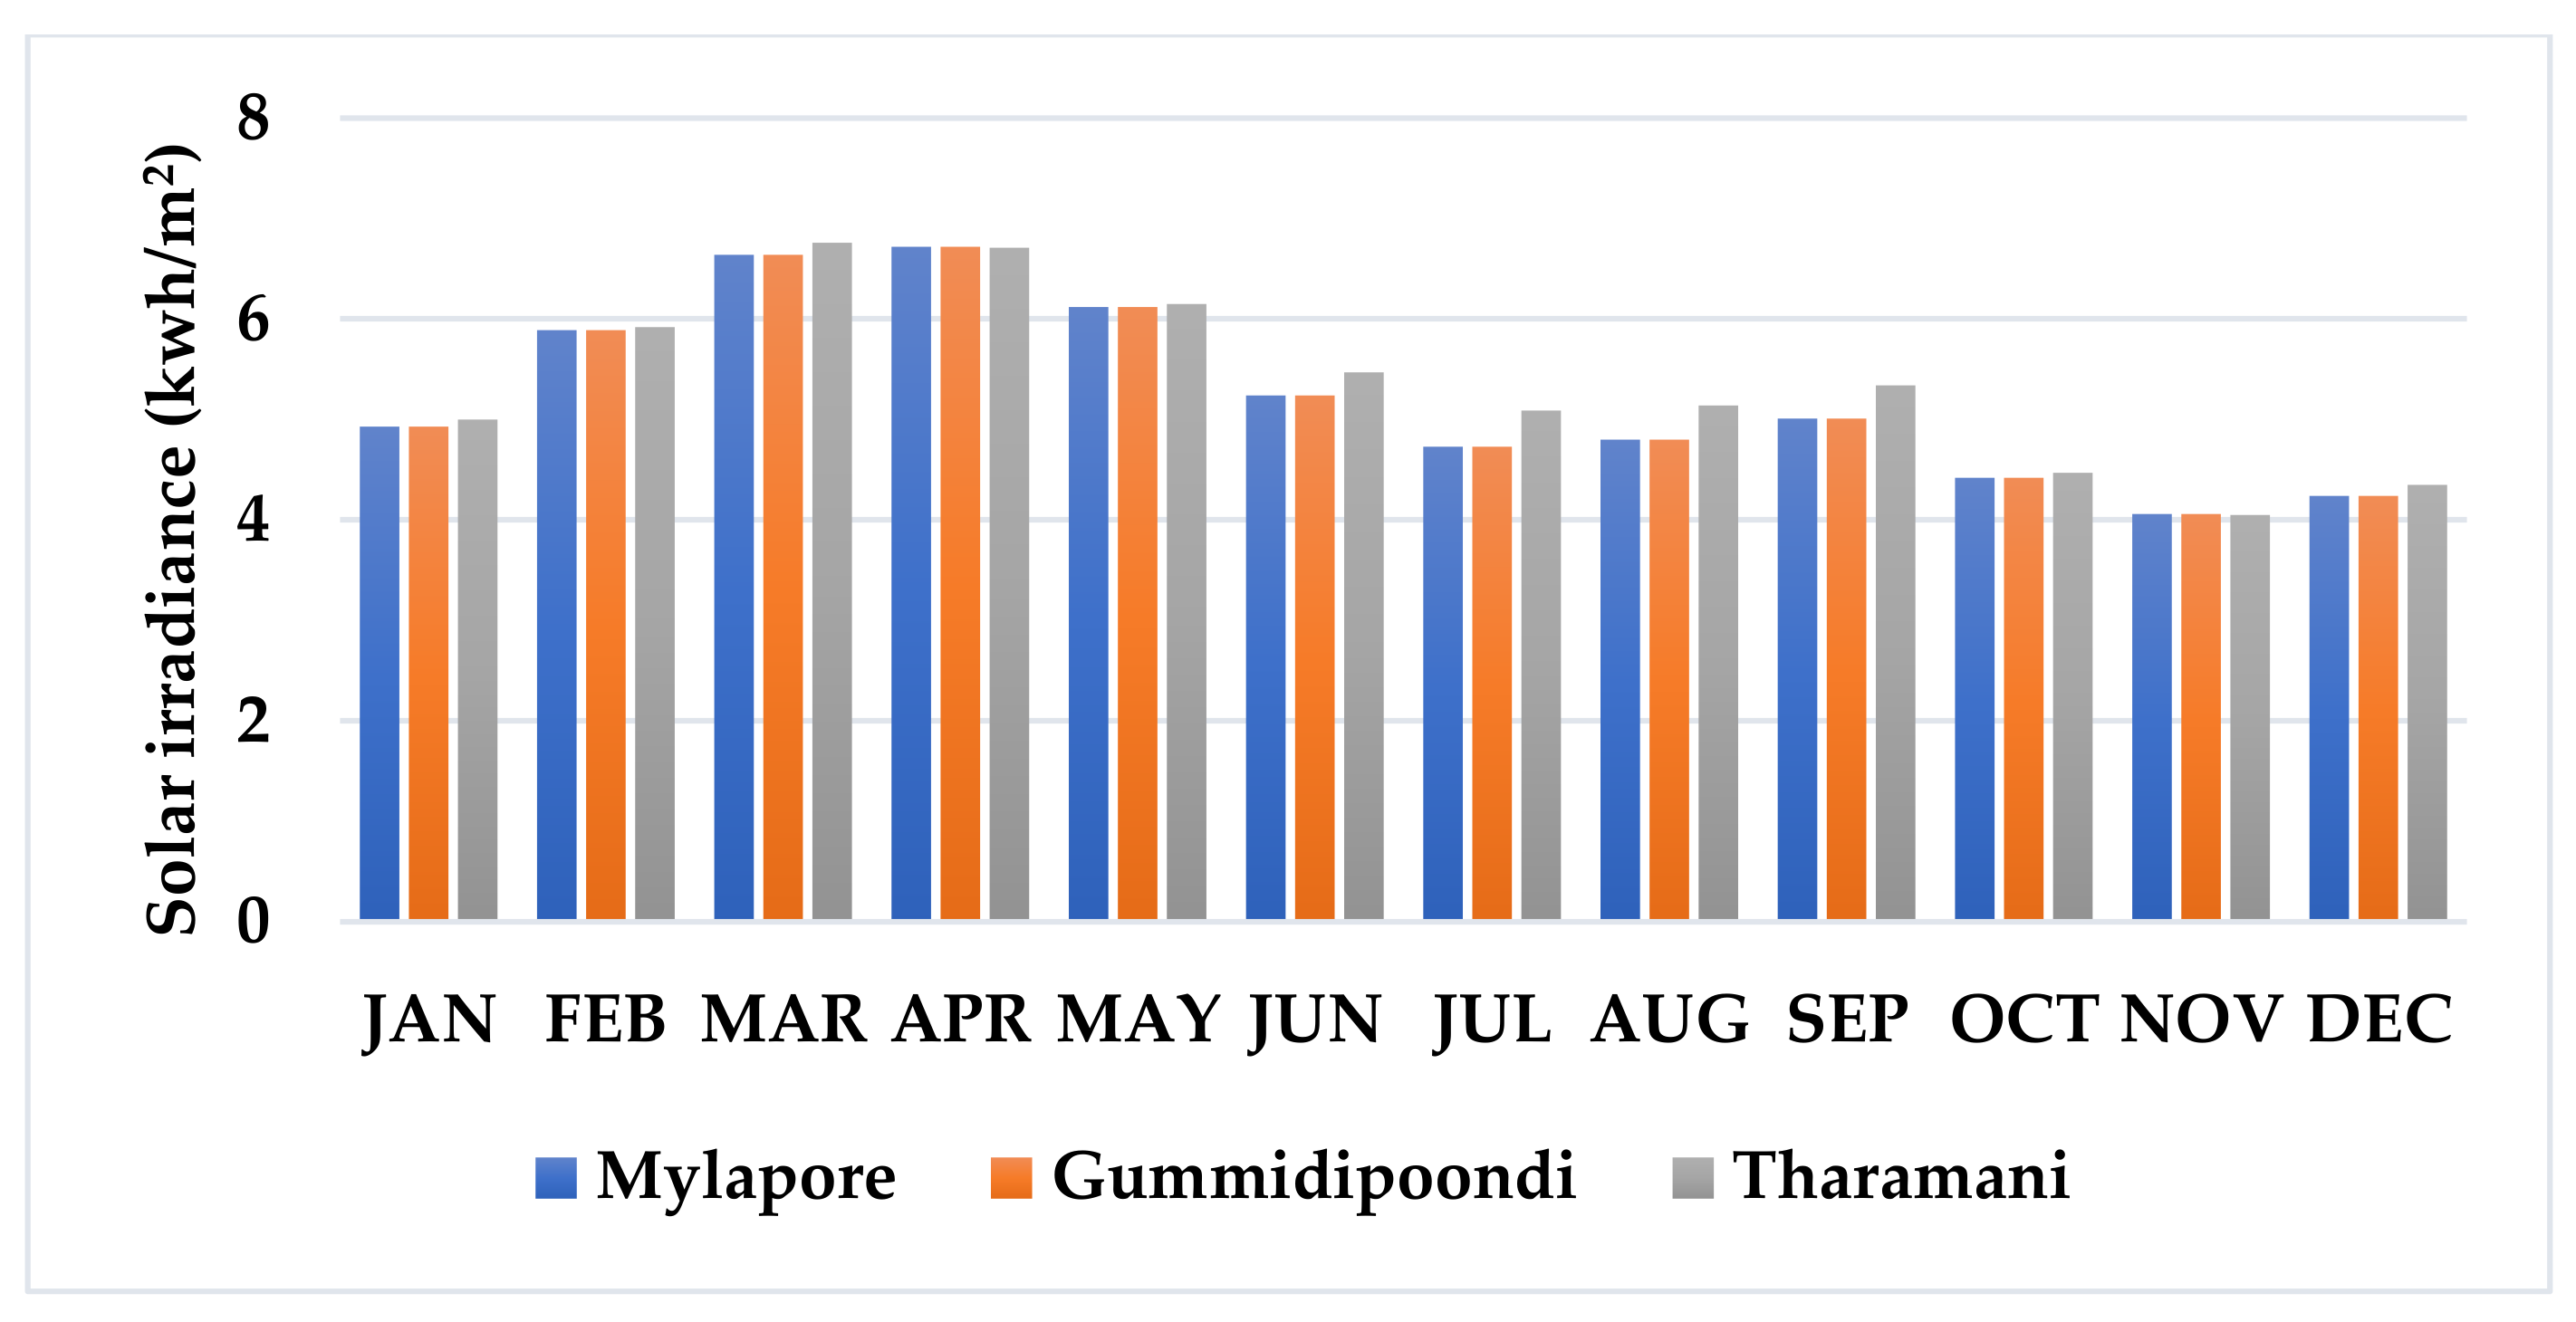
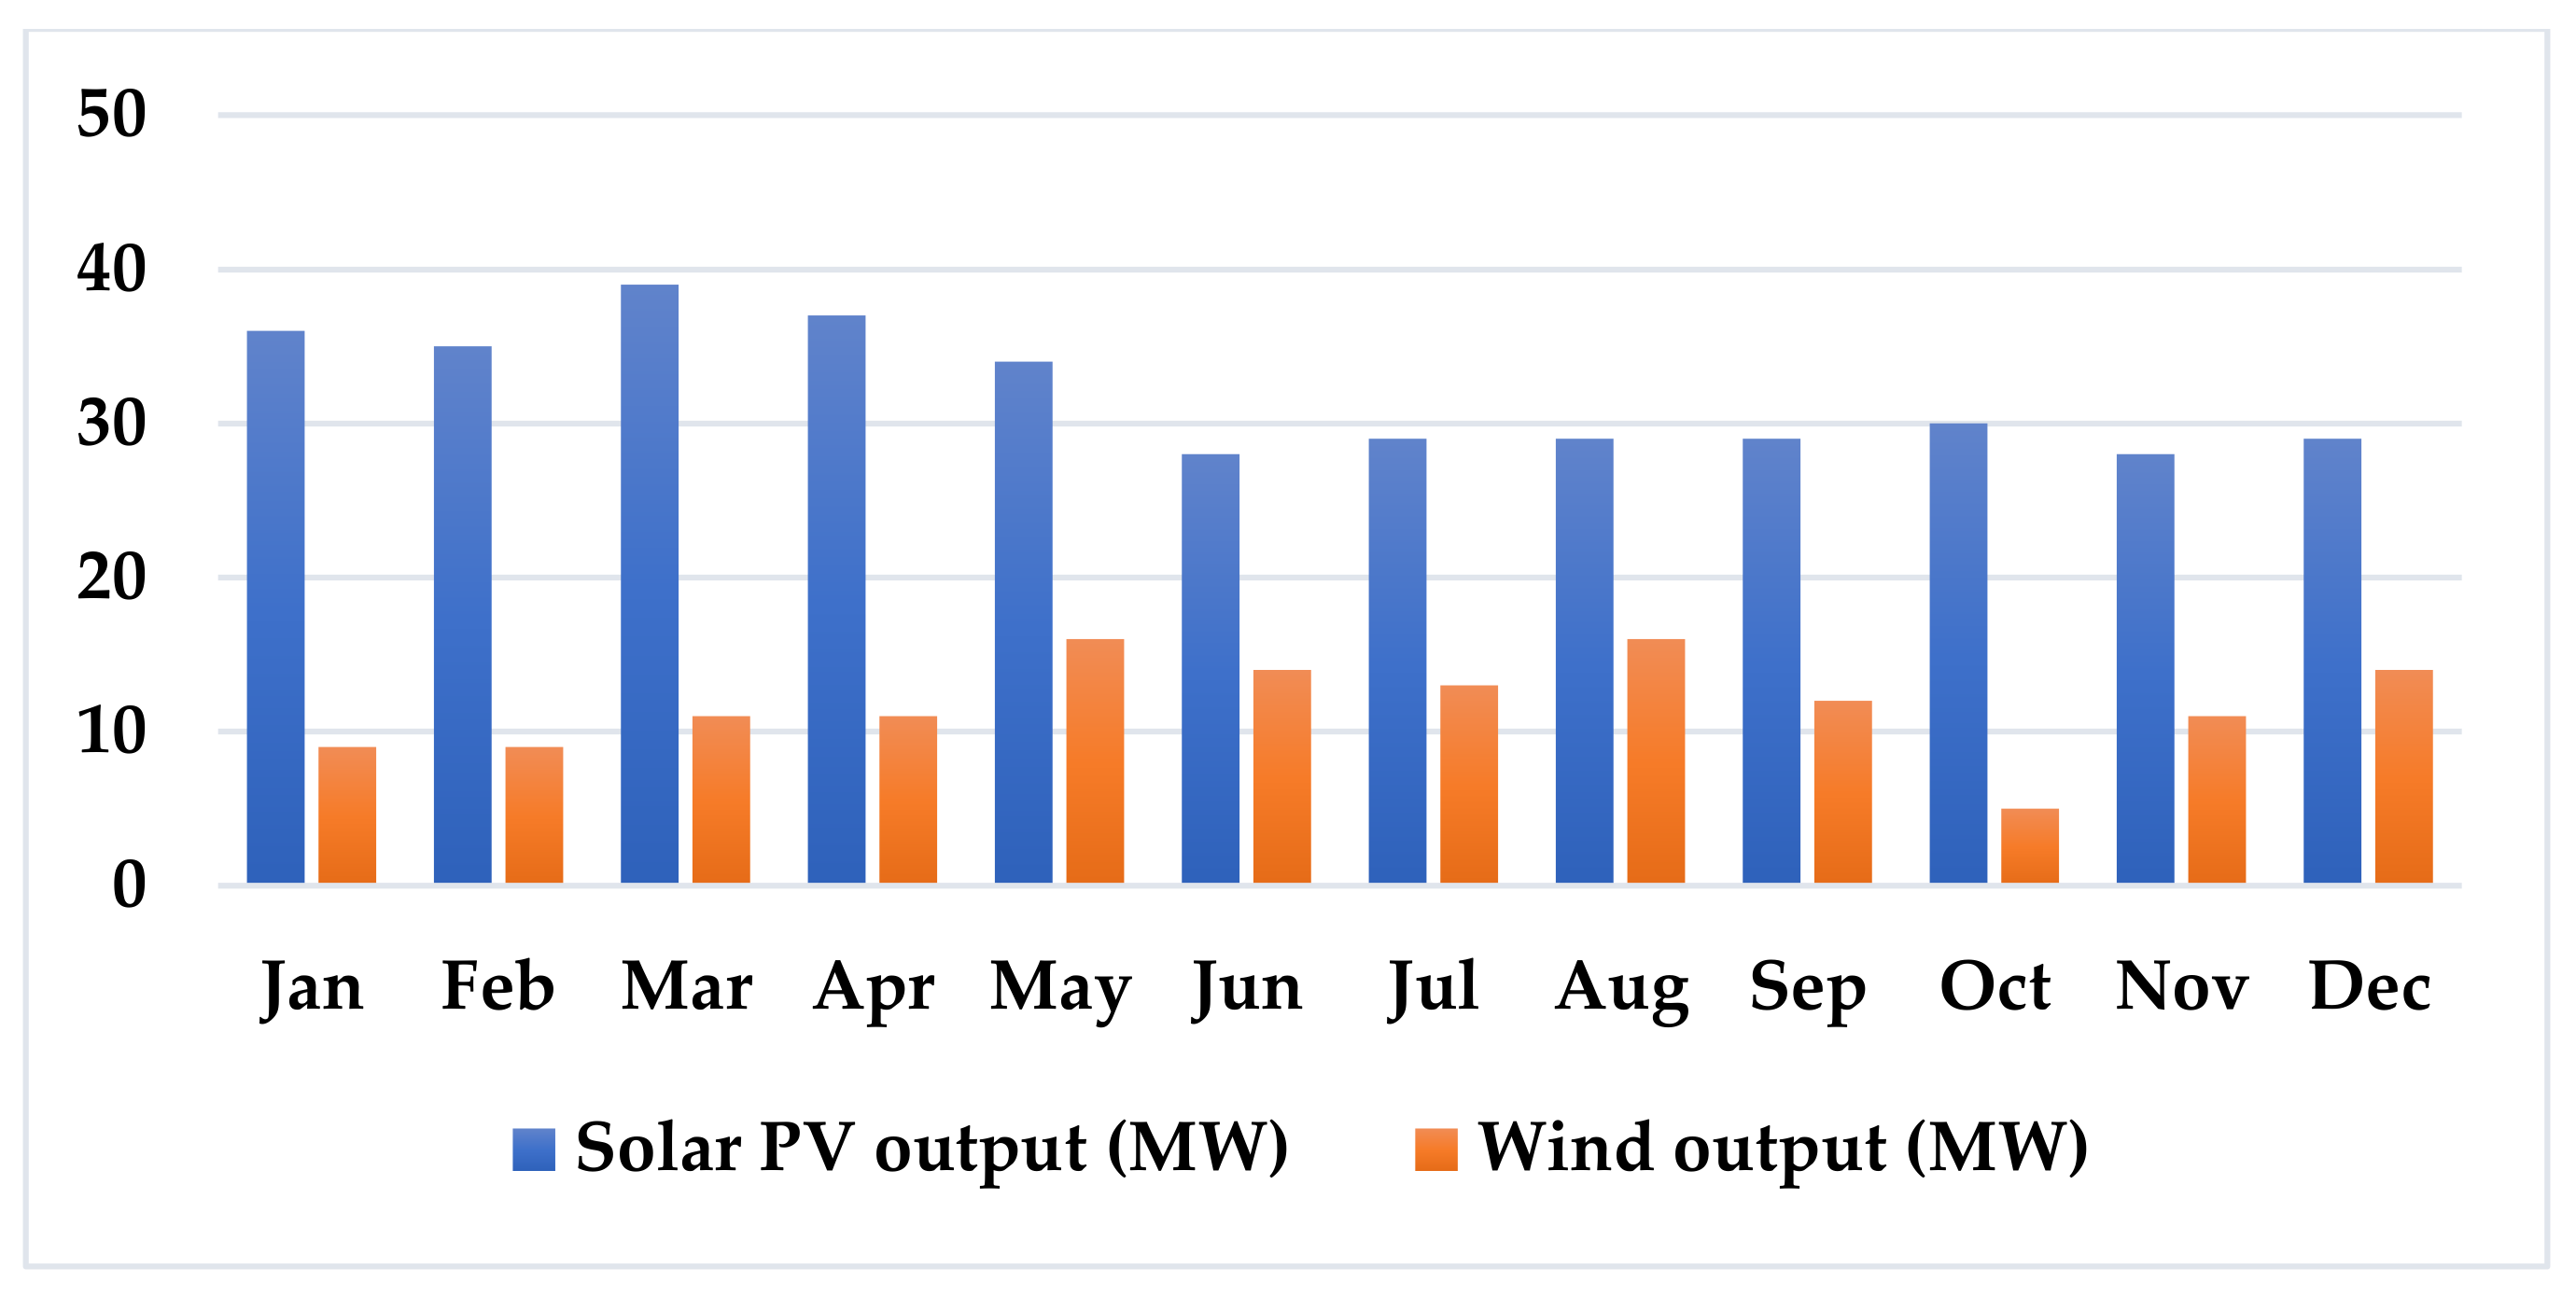
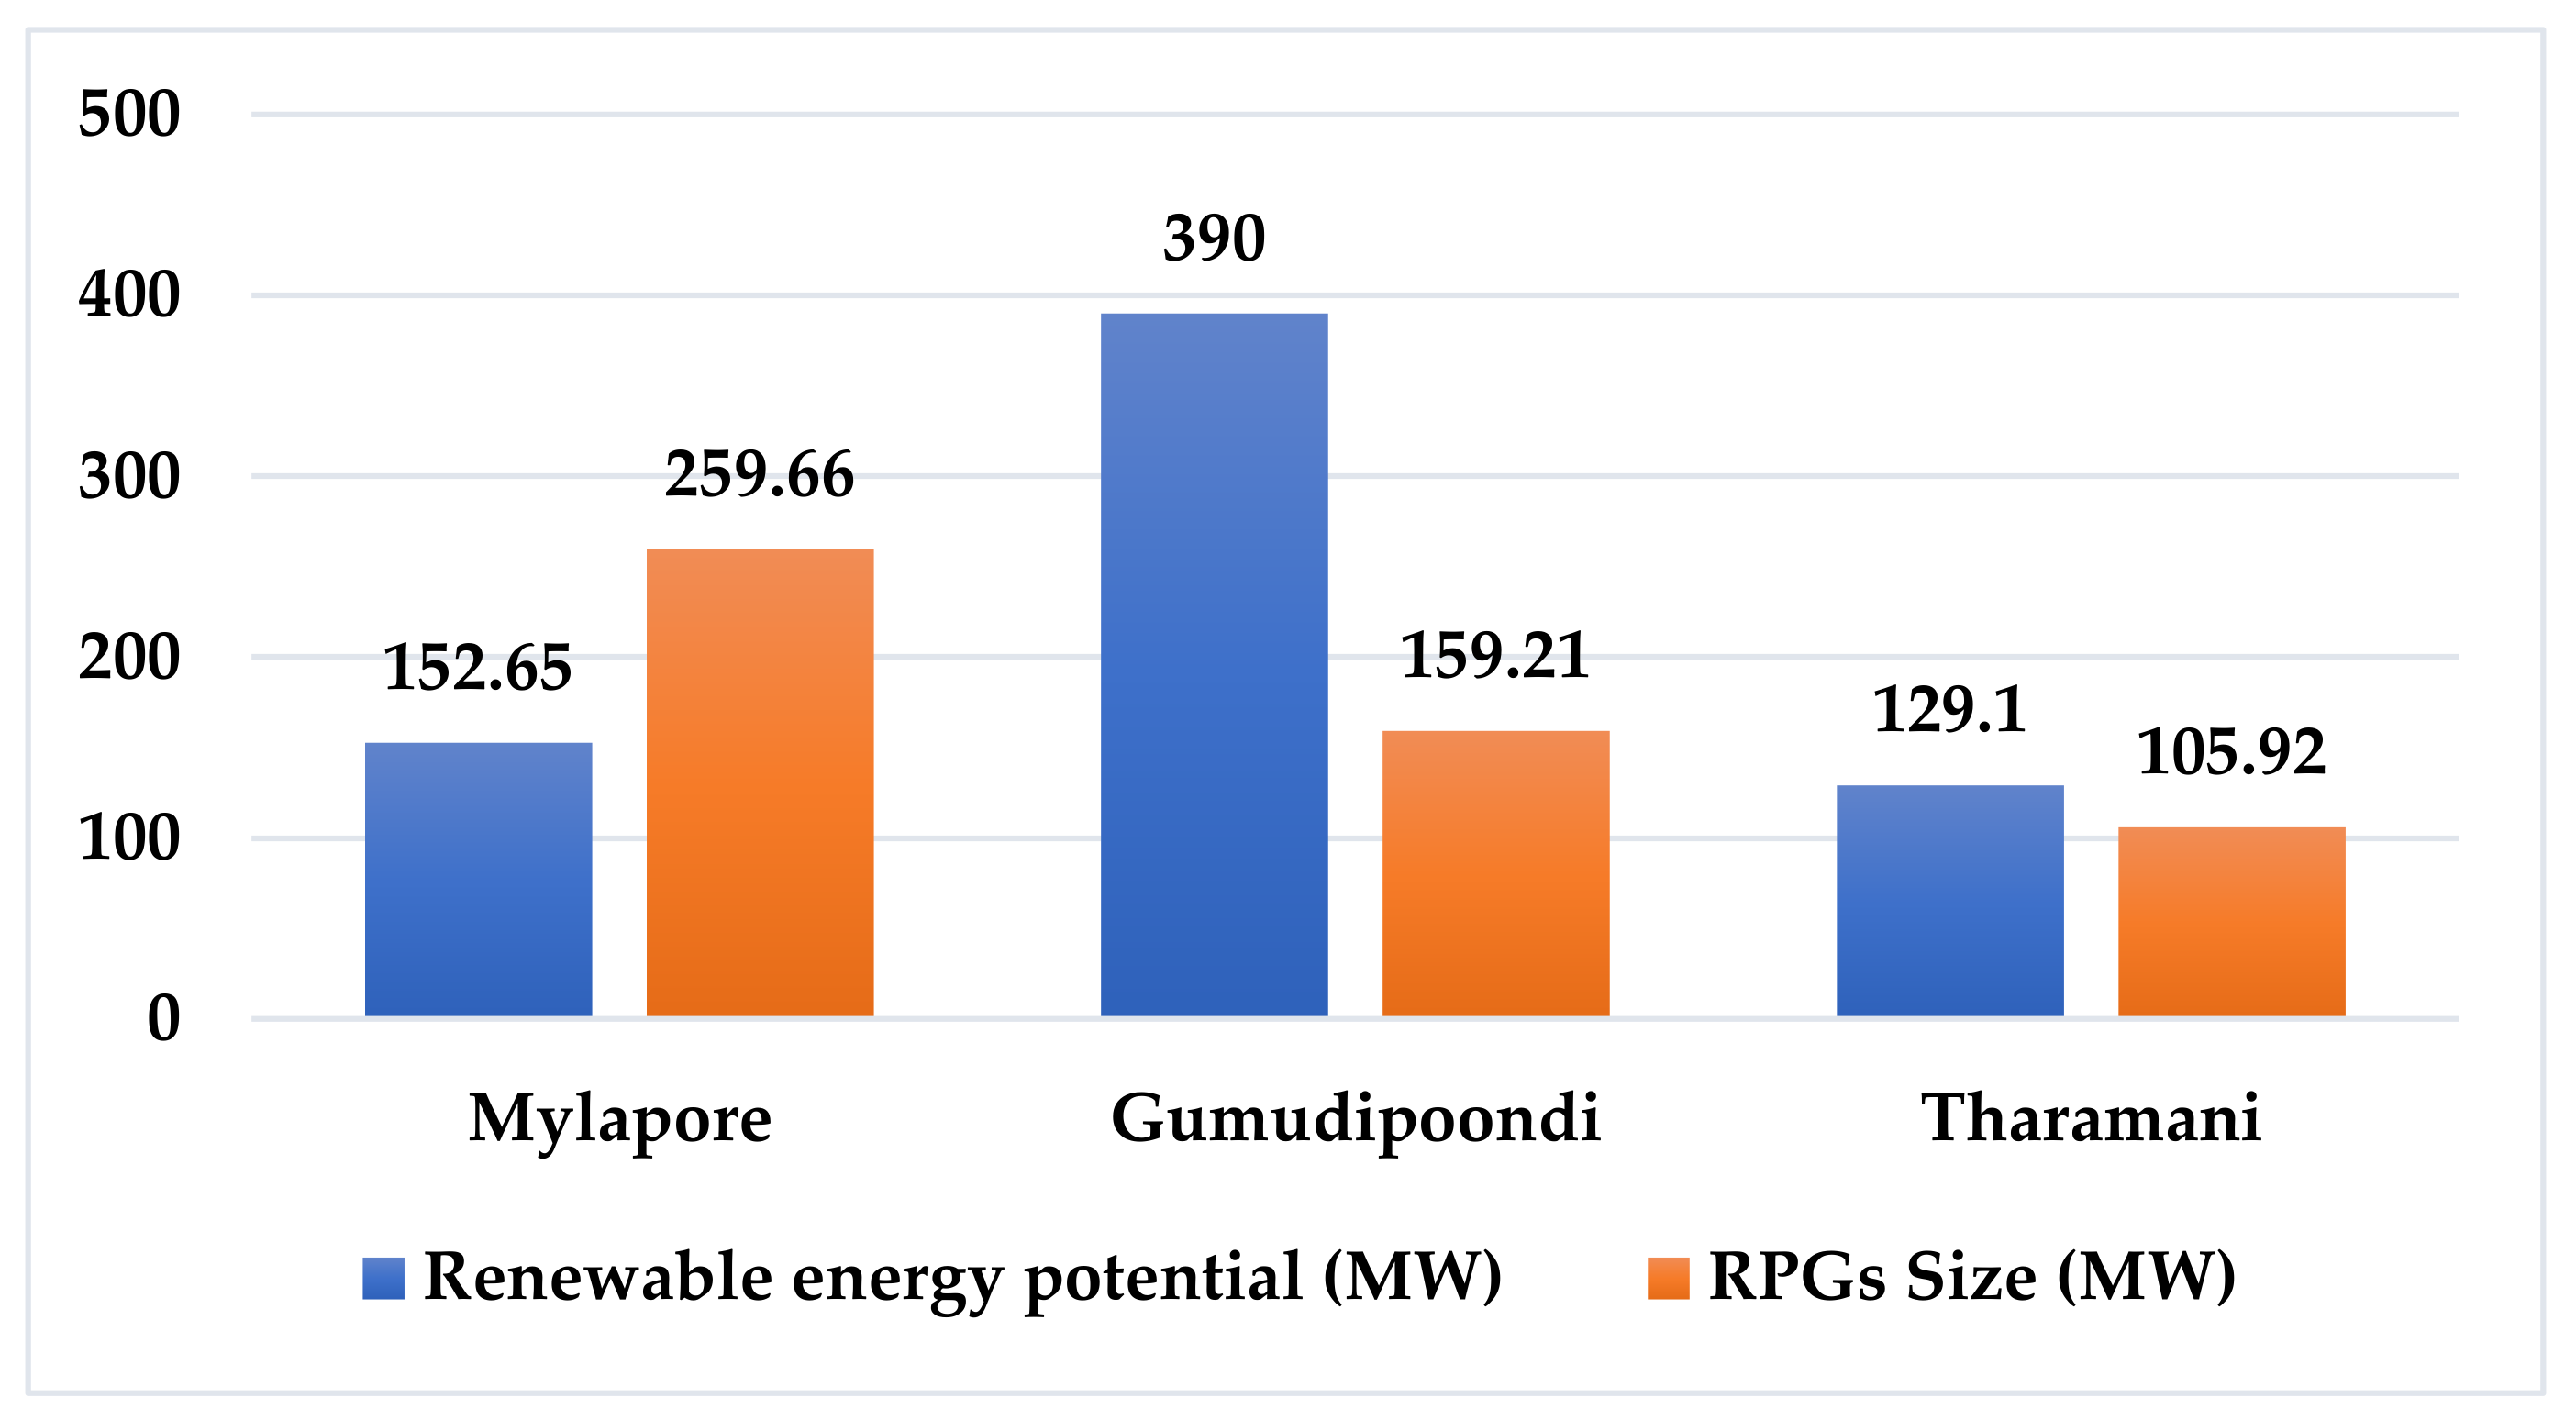
8. Assessment of RE Potential in the Selected Location
8.1. Framework and Methodology
8.2. RE Potential Based on the Land Use Factor
9. Conclusions
Author Contributions
Funding
Conflicts of Interest
Appendix A

| Bus No. | Generation | Load | ||
|---|---|---|---|---|
| P (MW) | Q (MVAR) | P (MW) | Q (MVAR) | |
| 1 | - | - | - | - |
| 2 | 225 | - | - | - |
| 3 | - | - | 142.5 | 7.5 |
| 4 | - | - | 250 | 26 |
| 5 | - | - | 137.5 | 10 |
| 6 | - | - | 22.5 | 7 |
| 7 | - | - | 11 | 7.5 |
| 8 | - | - | 4 | 1 |
| 9 | - | - | 167.5 | 12 |
| 10 | - | - | 7.5 | 3.5 |
| 11 | - | - | 130 | 10 |
| 12 | - | - | 35 | 10 |
| 13 | - | - | 25 | 2 |
| 14 | 220 | - | - | - |
| 15 | - | - | 38.5 | 6.5 |
| 16 | - | - | 120 | 20 |
| 17 | - | - | 8.5 | 4 |
| 18 | 110 | - | - | - |
| 19 | 220 | - | - | - |
| Line No. | From Bus | To Bus | Impedance (p.u.) | MVA Rating | |
|---|---|---|---|---|---|
| R | X | ||||
| 1 | 1 | 9 | 0.01188 | 0.061 | 175 |
| 2 | 1 | 10 | 0.00212 | 0.0068 | 125 |
| 3 | 1 | 5 | 0.00212 | 0.011 | 150 |
| 4 | 1 | 3 | 0.00274 | 0.0124 | 250 |
| 5 | 1 | 7 | 0.0288 | 0.1486 | 50 |
| 6 | 1 | 2 | 0.00548 | 0.0282 | 100 |
| 7 | 2 | 3 | 0.00304 | 0.0156 | 225 |
| 8 | 2 | 7 | 0.0316 | 0.1626 | 50 |
| 9 | 2 | 5 | 0.0067 | 0.0344 | 62.5 |
| 10 | 14 | 15 | 0.0412 | 0.2082 | 275 |
| 11 | 18 | 17 | 0.0558 | 0.2864 | 250 |
| 12 | 19 | 13 | 0.039 | 0.2 | 262.5 |
| 13 | 9 | 8 | 0.01188 | 0.061 | 25 |
| 14 | 9 | 10 | 0.025 | 0.1284 | 62.5 |
| 15 | 5 | 6 | 0.00244 | 0.0124 | 50 |
| 16 | 6 | 10 | 0.00974 | 0.05 | 25 |
| 17 | 5 | 10 | 0.0118 | 0.061 | 25 |
| 18 | 3 | 4 | 0.00274 | 0.0124 | 300 |
| 19 | 7 | 10 | 0.01492 | 0.0766 | 100 |
| 20 | 17 | 7 | 0.01674 | 0.086 | 187.5 |
| 21 | 10 | 11 | 0.01522 | 0.0782 | 175 |
| 22 | 10 | 12 | 0.0073 | 0.0376 | 50 |
| 23 | 10 | 16 | 0.00822 | 0.0422 | 65 |
| 24 | 13 | 10 | 0.03138 | 0.1612 | 200 |
| 25 | 17 | 16 | 0.02772 | 0.1424 | 162.5 |
| 26 | 17 | 13 | 0.0137 | 0.0704 | 150 |
| 27 | 17 | 15 | 0.0426 | 0.219 | 112.5 |
| 28 | 13 | 15 | 0.0296 | 0.1518 | 100 |
References
- Krishnamoorthy, R.; Udhayakumar, K.; Kannadasan, R.; Madurai Elavarasan, R.; Mihet-Popa, L. An Assessment of Onshore and Offshore Wind Energy Potential in India Using Moth Flame Optimization. Energies 2020, 13, 3063. [Google Scholar]
- Ganesan, S.; Subramaniam, U.; Ghodke, A.A.; Elavarasan, R.M.; Raju, K.; Bhaskar, S.M. Investigation on Sizing of Voltage Source for a Battery Energy Storage System in Microgrid with Renewable Energy Sources. IEEE Access 2020, 8, 188861–188874. [Google Scholar] [CrossRef]
- Madurai Elavarasan, R.; Selvamanohar, L.; Raju, K.; Rajan Vijayaraghavan, R.; Subburaj, R.; Nurunnabi, M.; Khan, I.A.; Afridhis, S.; Hariharan, A.; Pugazhendhi, R.; et al. A Holistic Review of the Present and Future Drivers of the Renewable Energy Mix in Maharashtra, State of India. Sustainability 2020, 12, 6596. [Google Scholar] [CrossRef]
- Madurai Elavarasan, R.; Shafiullah, G.M.; Raju, K.; Mudgal, V.; Arif, M.T.; Jamal, T.; Subramanian, S.; Sriraja Balaguru, V.S.; Reddy, K.S.; Subramaniam, U. COVID-19: Impact analysis and recommendations for power sector operation. Appl. Energy 2020, 279, 115739. [Google Scholar] [CrossRef]
- Anthony, M.; Prasad, V.; Raju, K.; Alsharif, M.H.; Geem, Z.W.; Hong, J. Design of Rotor Blades for Vertical Axis Wind Turbine with Wind Flow Modifier for Low Wind Profile Areas. Sustainability 2020, 12, 8050. [Google Scholar] [CrossRef]
- El-Ela, A.A.A.; El-Sehiemy, R.A.; Abbas, A.S. Optimal Placement and Sizing of Distributed Generation and Capacitor Banks in Distribution Systems Using Water Cycle Algorithm. IEEE Syst. J. 2018, 12, 3629–3636. [Google Scholar] [CrossRef]
- Chahkandi Nejad, H.; Tavakoli, S.; Ghadimi, N.; Korjani, S.; Nojavan, S.; Pashaei-Didani, H. Reliability based optimal allocation of distributed generations in transmission systems under demand response program. Electr. Power Syst. Res. 2019, 176, 105952. [Google Scholar] [CrossRef]
- Available online: https://www.eqmagpro.com/wp-content/uploads/2018/03/Renewable-Energy-Integration-Background-paper-WebBrand-19-01-2018.pdf (accessed on 26 March 2021).
- Dixit, M.; Kundu, P.; Jariwala, H.R. Optimal integration of shunt capacitor banks in distribution networks for assessment of techno-economic asset. Comput. Electr. Eng. 2018, 71, 331–345. [Google Scholar] [CrossRef]
- Han, T.; Chen, Y.; Ma, J.; Zhao, Y.; Chi, Y. Surrogate Modeling-Based Multi-Objective Dynamic VAR Planning Considering Short-Term Voltage Stability and Transient Stability. IEEE Trans. Power Syst. 2018, 33, 622–633. [Google Scholar] [CrossRef]
- Tahboub, A.M.; Moursi, M.S.E.; Woon, W.L.; Kirtley, J.L. Multiobjective Dynamic VAR Planning Strategy With Different Shunt Compensation Technologies. IEEE Trans. Power Syst. 2018, 33, 2429–2439. [Google Scholar] [CrossRef]
- Bawazir, R.O.; Cetin, N.S. Comprehensive overview of optimizing PV-DG allocation in power system and solar energy resource potential assessments. Energy Rep. 2020, 6, 173–208. [Google Scholar] [CrossRef]
- Bayat, A.; Bagheri, A. Optimal active and reactive power allocation in distribution networks using a novel heuristic approach. Appl. Energy 2019, 233–234, 71–85. [Google Scholar] [CrossRef]
- Jamil, M.; Anees, A.S. Optimal sizing and location of SPV (solar photovoltaic) based MLDG (multiple location distributed generator) in distribution system for loss reduction, voltage profile improvement with economical benefits. Energy 2016, 103, 231–239. [Google Scholar] [CrossRef]
- Suresh, M.C.V.; Edward, J.B. A hybrid algorithm based optimal placement of DG units for loss reduction in the distribution system. Appl. Soft Comput. 2020, 91, 106191. [Google Scholar] [CrossRef]
- Partha, P.B.; Mallipeddi, R.; Suganthan, P.N.; Gehan, A.J.A. A multiobjective approach for optimal placement and sizing of distributed generators and capacitors in distribution network. Appl. Soft Comput. 2017, 60, 268–280. [Google Scholar]
- Kanwar, N.; Gupta, N.; Niazi, K.R.; Swarnkar, A. Optimal distributed resource planning for microgrids under uncertain environment. IET Renew. Power Gener. 2018, 12, 244–251. [Google Scholar] [CrossRef]
- Rahmani-andebili, M. Simultaneous placement of DG and capacitor in distribution network. Electr. Power Syst. Res. 2016, 131, 1–10. [Google Scholar] [CrossRef]
- Murthy, V.V.S.N.; Kumar, A. Comparison of optimal DG allocation methods in radial distribution systems based on sensitivity approaches. Int. J. Electr. Power Energy Syst. 2013, 53, 450–467. [Google Scholar] [CrossRef]
- Askarzadeh, A. Capacitor placement in distribution systems for power loss reduction and voltage improvement: A new methodology. IET Gener. Transm. Distrib. 2016, 10, 3631–3638. [Google Scholar] [CrossRef]
- Zeinalzadeh, A.; Mohammadi, Y.; Mohammad, H.M. Optimal multi objective placement and sizing of multiple DGs and shunt capacitor banks simultaneously considering load uncertainty via MOPSO approach. Int. J. Electr. Power Energy Syst. 2015, 67, 336–349. [Google Scholar] [CrossRef]
- Chu, C.-T.; Hawkes, A.D. A geographic information system-based global variable renewable potential assessment using spatially resolved simulation. Energy 2020, 193, 116630. [Google Scholar] [CrossRef]
- Marc-Alain, M.N.; Numbi, B.P. Assessment of renewable energy potential in Kwazulu-Natal province, South Africa. Energy Rep. 2019, 5, 874–881. [Google Scholar]
- Zhang, H.; Cao, Y.; Zhang, Y.; Terzija, V. Quantitative synergy assessment of regional wind-solar energy resources based on MERRA reanalysis data. Appl. Energy 2018, 216, 172–182. [Google Scholar] [CrossRef]
- Kumar, D. Satellite-based solar energy potential analysis for southern states of India. Energy Rep. 2020, 6, 1487–1500. [Google Scholar] [CrossRef]
- Jeslin Drusila Nesamalar, J.; Venkatesh, P.; Charles Raja, S. The drive of renewable energy in Tamilnadu: Status, barriers and future prospect. Renew. Sustain. Energy Rev. 2017, 73, 115–124. [Google Scholar] [CrossRef]
- Deshmukh, R.; Grace, C.W.; Duncan, S.C.; Phadke, A. Geospatial and techno-economic analysis of wind and solar resources in India. Renew. Energy 2019, 134, 947–960. [Google Scholar] [CrossRef] [Green Version]
- Yang, B.; Yu, L.; Chen, Y.; Ye, H.; Shao, R.; Shu, H.; Yu, T.; Zhang, X.; Sun, L. Modelling, applications, and evaluations of optimal sizing and placement of distributed generations: A critical state-of-the-art survey. Int. J. Energy Res. 2021, 45, 3615–3642. [Google Scholar] [CrossRef]
- Balu, K.; Mukherjee, V. Siting and Sizing of Distributed Generation and Shunt Capacitor Banks in Radial Distribution System Using Constriction Factor Particle Swarm Optimization. Electr. Power Compon. Syst. 2020, 48, 697–710. [Google Scholar] [CrossRef]
- Muthukumar, K.; Jayalalitha, S. Optimal placement and sizing of distributed generators and shunt capacitors for power loss minimization in radial distribution networks using hybrid heuristic search optimization technique. Int. J. Electr. Power Energy Syst. 2016, 78, 299–319. [Google Scholar] [CrossRef]
- Khodabakhshian, A.; Andishgar, M.H. Simultaneous placement and sizing of DGs and shunt capacitors in distribution systems by using IMDE algorithm. Int. J. Electr. Power Energy Syst. 2016, 82, 599–607. [Google Scholar] [CrossRef]
- Ramamoorthy, A.; Ramachandran, R. Optimal Siting and Sizing of Multiple DG Units for the Enhancement of Voltage Profile and Loss Minimization in Transmission Systems Using Nature Inspired Algorithms. Sci. World J. 2016, 2016, 1086579. [Google Scholar] [CrossRef] [PubMed] [Green Version]
- Taha, I.B.M.; Elattar, E.E. Optimal reactive power resources sizing for power system operations enhancement based on improved grey wolf optimizer. IET Gener. Transm. Distrib. 2018, 12, 3421–3434. [Google Scholar] [CrossRef]
- Gampa, S.R.; Das, D. Simultaneous optimal allocation and sizing of distributed generations and shunt capacitors in distribution networks using fuzzy GA methodology. J. Electr. Syst. Inf. Technol. 2019, 6, 4. [Google Scholar] [CrossRef] [Green Version]
- Ameur, A.; Berrada, A.; Loudiyi, K.; Aggour, M. Analysis of renewable energy integration into the transmission network. Electr. J. 2019, 32, 106676. [Google Scholar] [CrossRef]
- Mosbah, M.; Mohammedi, R.D.; Arif, S. Differential Evolution Method for Optimal Size and Localization of Photovoltaic in the Algerian Transmission Power System. In Proceedings of the 2019 Algerian Large Electrical Network Conference (CAGRE), Algiers, Algeria, 26–28 February 2019. [Google Scholar]
- Syed Mustaffa, S.A.; Musirin, I.; Mohamad Zamani, M.K.; Othman, M.M. Pareto optimal approach in Multi-Objective Chaotic Mutation Immune Evolutionary Programming (MOCMIEP) for optimal Distributed Generation Photovoltaic (DGPV) integration in power system. Ain Shams Eng. J. 2019, 10, 745–754. [Google Scholar] [CrossRef]
- Masaud, T.M.; El-Saadany, E.F. Optimal Wind DG Integration for Security Risk-Based Line Overload Enhancement: A Two Stage Approach. IEEE Access 2020, 8, 11939–11947. [Google Scholar] [CrossRef]
- Mahmoud, I.; Kamel, S.; Abdel-Mawgoud, H.; Nasrat, L.; Jurado, F. Integration of DG and Capacitor in Radial Distribution Networks Using an Efficient Hybrid Optimization Method. Electr. Power Compon. Syst. 2020, 48, 1102–1110. [Google Scholar] [CrossRef]
- Dehghani, M.; Montazeri, Z.; Malik, O.P. Optimal Sizing and Placement of Capacitor Banks and Distributed Generation in Distribution Systems Using Spring Search Algorithm. Int. J. Electr. Power Energy Syst. 2020, 21. [Google Scholar] [CrossRef] [Green Version]
- Naderipour, A.; Abdul-Malek, Z.; Hajivand, M.; Seifabad, Z.M.; Farsi, M.A.; Nowdeh, S.A.; Davoudkhani, I.F. Spotted hyena optimizer algorithm for capacitor allocation in radial distribution system with distributed generation and microgrid operation considering different load types. Sci. Rep. 2021, 11, 2728. [Google Scholar] [CrossRef]
- Venkatesan, C.; Kannadasan, R.; Alsharif, M.H.; Kim, M.K.; Nebhen, J. A Novel Multiobjective Hybrid Technique for Siting and Sizing of Distributed Generation and Capacitor Banks in Radial Distribution Systems. Sustainability 2021, 13, 3308. [Google Scholar] [CrossRef]
- Victoria, Y.M.O.; Rodrigo, M.S.O.; Carolina, M.A. Cuckoo Search approach enhanced with genetic replacement of abandoned nests applied to optimal allocation of distributed generation units. IET Gener. Transm. Distrib. 2018, 12, 3353–3362. [Google Scholar]
- Sadiq, A.A.; Adamu, S.S.; Buhari, M. Optimal distributed generation planning in distribution networks: A comparison of transmission network models with FACTS. Eng. Sci. Technol. Int. J. 2019, 22, 33–46. [Google Scholar] [CrossRef]
- Sheng, W.; Liu, K.-Y.; Liu, Y.; Meng, X.; Li, Y. Optimal Placement and Sizing of Distributed Generation via an Improved Nondominated Sorting Genetic Algorithm II. IEEE Trans. Power Deliv. 2015, 30, 569–578. [Google Scholar] [CrossRef]
- Quadri, I.A.; Bhowmick, S.; Joshi, D. A comprehensive technique for optimal allocation of distributed energy resources in radial distribution systems. Appl. Energy 2018, 211, 1245–1260. [Google Scholar] [CrossRef]
- Aisha, M.P.; Hatem, H.Z.; Ehab, F.; Sultan, S.A. Optimal allocation of distributed generation for planning master-slave controlled microgrids. IET Gener. Transm. Distrib. 2019, 13, 3704–3712. [Google Scholar]
- HassanzadehFard, H.; Jalilian, A. Optimal sizing and location of renewable energy based DG units in distribution systems considering load growth. Int. J. Electr. Power Energy Syst. 2018, 101, 356–370. [Google Scholar] [CrossRef]
- Mao, X.; Zhu, W.; Wu, L.; Zhou, B. Optimal allocation of dynamic VAR sources using zoning-based distributed optimization algorithm. Int. J. Electr. Power Energy Syst. 2019, 113, 952–962. [Google Scholar] [CrossRef]
- Huy, P.D.; Ramachandaramurthy, V.K.; Yong, J.Y.; Tan, K.M.; Ekanayake, J.B. Optimal Placement, Sizing and Power Factor of Distributed Generation: A Comprehensive Study Spanning from the Planning Stage to the Operation Stage. Energy 2020, 195, 117011. [Google Scholar] [CrossRef]
- Abdelaziz, A.Y.; Ali, E.S.; Abd Elazim, S.M. Flower Pollination Algorithm and Loss Sensitivity Factors for optimal sizing and placement of capacitors in radial distribution systems. Int. J. Electr. Power Energy. Syst. 2016, 78, 207–214. [Google Scholar] [CrossRef]
- Poornazaryan, B.; Karimyan, P.; Gharehpetian, G.B.; Mehrdad, A. Optimal allocation and sizing of DG units considering voltage stability, losses and load variations. Int. J. Electr. Power Energy Syst. 2016, 79, 42–52. [Google Scholar] [CrossRef]
- Zimmerman, R.D.; Murillo-Sanchez, C.E. Matpower [Software]. 2019. Available online: https://matpower.org (accessed on 15 February 2021).
- Kumar, S.; Kamal, K.M.; Chakraborty, N. Optimal DG placement by multi-objective opposition based chaotic differential evolution for techno-economic analysis. Appl. Soft Comput. 2019, 78, 70–83. [Google Scholar] [CrossRef]
- Ahmad, M.T.; Ravikumar Pandi, V.; Zeineldin, H.H. Distribution System Reconfiguration for Annual Energy Loss Reduction Considering Variable Distributed Generation Profiles. IEEE Trans. Power Deliv. 2015, 30, 1677–1685. [Google Scholar]
- Niknam, T. A new approach based on ant colony optimization for daily Volt/Var control in distribution networks considering distributed generators. Energy Convers. Manag. 2008, 49, 3417–3424. [Google Scholar] [CrossRef]
- POWER Data Access Viewer. Available online: https://power.larc.nasa.gov/data-access-viewer (accessed on 22 February 2021).
- Dondariya, C.; Porwal, D.; Awasthi, A.; Shukla, A.K.; Sudhakar, K.; Murali Manohar, S.R.; Bhimte, A. Performance simulation of grid-connected rooftop solar PV system for small households: A case study of Ujjain, India. Energy Rep. 2018, 4, 546–553. [Google Scholar] [CrossRef]


| Ref. No. | Year | Objective Function | Installations | Test System | Research Gap (Technical Limitations/ Drawbacks) | |
|---|---|---|---|---|---|---|
| RPG | RPC | |||||
| [17] | 2016 | Minimizing total cost | √ | √ | 28-bus distribution system | Single test system is considered |
| [30] | 2016 | Minimizing power losses | √ | √ | 33 and 119-node distribution systems | Economic evaluations are ignored |
| [31] | 2016 | Minimizing total cost of losses | √ | √ | 33 and 69-bus distribution systems | Investment cost analysis ignored |
| [32] | 2016 | Minimizing network power losses and improving the voltage stability | √ | 30-bus transmission system | Only solar DG is considered | |
| [15] | 2017 | Minimizing the real and reactive power losses | √ | √ | 33, 69, and 119-bus distribution networks | Voltage stability and economic deliberations are ignored |
| [6] | 2018 | Minimizing distribution power losses, power generation costs, and generation units’ emissions, and improving voltage profile and voltage stability index | √ | √ | 33, 69-bus and Egyptian distribution networks | Reactive power injection from DGs alone ignored |
| [16] | 2018 | Optimizing techno-economic objective | √ | √ | 33-bus distribution system | Strategies for voltage enhancement are ignored |
| [33] | 2018 | Minimizing generation cost, power loss, and voltage deviation | √ | √ | 30, 39, and 118-bus test systems | Voltage stability and power factor constraints ignored |
| [7] | 2019 | Improving reliability | √ | IEEE Reliability Test System (RTS-79) | Single transmission system is considered | |
| [12] | 2019 | Minimizing power loss and improve voltage profile | √ | √ | 33, 69, and 119-bus distribution networks | Few network constraints are ignored |
| [34] | 2019 | Reduction of active, reactive power supply and real power loss, improvement of branch current capacity, voltage profile and voltage stability | √ | √ | 51 and 69-node distribution systems | Economic considerations are not considered |
| [35] | 2019 | To analyze the impact of integration of renewable sources on the grid | Moroccan transmission grid | Optimal location and size of DGs/CBs are ignored | ||
| [36] | 2019 | Minimizing active power losses | √ | Algerian transmission power system | Only photovoltaic source is considered | |
| [37] | 2019 | Minimizing active power losses and fast voltage stability index | √ | 57-bus transmission system | Only photovoltaic DG is considered | |
| [38] | 2020 | Improving transmission security and minimizing DG investment cost | √ | 30-bus transmission system | Only wind DG is considered | |
| [29] | 2020 | Minimizing active and reactive power losses, and total voltage deviation, and improving voltage stability index | √ | √ | 33 and Brazil distribution systems | Reactive power injection from DGs ignored |
| [39] | 2020 | Minimizing power losses and enhancing voltage profile | √ | √ | 69-bus distribution system | DG number is fixed and a single test system is considered |
| [40] | 2020 | Minimizing the power losses, power generation costs, and generation units’ emissions, and enhance the voltage profile | √ | √ | 33-bus distribution system | Voltage stability ignored, only one test system is considered |
| [41] | 2021 | Minimizing the cost of energy losses, peak power losses, and the capacitor | √ | √ | 24-bus distribution network | Single test system alone is considered |
| [42] | 2021 | Minimizing real power losses, power generation costs, emissions, and voltage deviation index, and improving voltage stability index | √ | √ | 33 and 69-bus distribution systems | Real-time system is ignored |
| Cases | Commissioning | Sizing | RPCs | RPGs | Power Factor | |
|---|---|---|---|---|---|---|
| Unity | 0.85 Lead | |||||
| Case 1 | √ | √ | √ | |||
| Case 2 | √ | √ | √ | √ | ||
| Case 3 | √ | √ | √ | √ | ||
| Case 4 | √ | √ | √ | √ | √ | |
| Case 5 | √ | √ | √ | √ | √ | |
| RPC Size in MVAR (Bus No.) | Power Loss (MW) | Loss Reduction (%) | Average Voltage (p.u.) | VDI (p.u.) | VSI (p.u.) |
|---|---|---|---|---|---|
| Uncompensated | 93.185 | 0 | 0.9582 | 0.0418 | 0.6467 |
| 193 (13) | 49.78 | 46.58 | 0.9932 | 0.0068 | 0.9522 |
| Techniques | RPGs Size in MW (Bus No.) | Total RPG Size (MW) | Power Loss (MW) | Loss Reduction (%) | Average Voltage (p.u.) | VDI (p.u.) | VSI (p.u.) | ||
|---|---|---|---|---|---|---|---|---|---|
| Uncompensated | -- | -- | 93.185 | 0 | 0.9582 | 0.0418 | 0.6467 | ||
| PSO | 257.53 (4) | 164.72 (9) | 115.17 (11) | 537.42 | 46.837 | 49.74 | 0.9862 | 0.0138 | 0.8597 |
| RPGs Size in MW + jMVAR (Bus No.) | Total RPG Size (MW) and Power Factor | Power Loss (MW) | Loss Reduction (%) | Average Voltage (p.u.) | VDI (p.u.) | VSI (p.u.) | ||
|---|---|---|---|---|---|---|---|---|
| Uncompensated | -- | 93.185 | 0 | 0.9582 | 0.0418 | 0.6467 | ||
| 250.12 + j38.13 (4) | 163.66 + j13.97 (9) | 1.24 + j196.95 (13) | (415, 0.86) | 45.981 | 50.66 | 0.9959 | 0.0041 | 0.9701 |
| RPGs Size in MW (Bus No.) | Total RPG Size (MW) | RPC Size in MVAR (Bus no.) | Power Loss (MW) | Loss Reduction (%) | Average Voltage (p.u.) | VDI (p.u.) | VSI (p.u.) | ||
|---|---|---|---|---|---|---|---|---|---|
| Uncompensated | -- | 93.185 | 0 | 0.9582 | 0.0418 | 0.6467 | |||
| 257.57 (4) | 164.65 (9) | 114.91 (11) | 537.13 | 194.55 (17) | 44.84 | 51.88 | 0.9969 | 0.0031 | 0.9676 |
| RPGs Size in MW + jMVAR (Bus No.) | Total RPG Size (MW) and Power Factor | RPC (MVAR) | Power Loss (MW) | Loss Reduction (%) | Average Voltage (p.u.) | VDI (p.u.) | VSI (p.u.) | ||
|---|---|---|---|---|---|---|---|---|---|
| Uncompensated | - | - | 93.185 | 0 | 0.9582 | 0.0418 | 0.6467 | ||
| 259.66 + j41.57 (4) | 159.21+ j9.73 (9) | 105.92 + j27.09 (11) | (524.8, 0.99) | 189.64 (13) | 44.48 | 52.27 | 0.9987 | 0.0013 | 0.9748 |
| Test Cases | RPC Position Size (MVAR) | RPGs Position Size (MW + jMVAR) | Real Power Loss (MW) | Average Voltage (p. u.) | VDI (p.u.) | VSI (p.u.) | ||
|---|---|---|---|---|---|---|---|---|
| Uncompensated | - | - | - | - | 93.185 | 0.9582 | 0.0418 | 0.6467 |
| Case 1 | 13 | 193 | - | - | 49.78 | 0.9932 | 0.0068 | 0.9522 |
| Case 2 | - | - | 4 9 11 | 257.53 + j0 164.72 + j0 115.17 + j0 | 46.837 | 0.9862 | 0.0138 | 0.8597 |
| Case 3 | - | - | 4 9 13 | 250.12 + j38.13 163.66 + j13.97 1.24 + j196.95 | 45.981 | 0.9959 | 0.0041 | 0.9701 |
| Case 4 | 17 | 194.55 | 4 9 11 | 257.57 + j0 164.65 + j0 114.91 + j0 | 44.84 | 0.9969 | 0.0031 | 0.9676 |
| Case 5 | 13 | 189.64 | 4 9 11 | 259.66 + j41.57 159.21 + j9.73 105.92 + j27.09 | 44.48 | 0.9987 | 0.0013 | 0.9748 |
| Cost Components | PV | WT |
|---|---|---|
| Capital cost ($/kW) | 3985 | 1822 |
| Rated capacity (MW) | 1 | 5 |
| Life time (year) | 20 | 20 |
| O&M costs ($/kWh) | 0.01207 | 0.00952 |
| Fuel cost ($/kWh) | - | - |
| Techniques | PV DGs Size in MW (Bus No.) | Total RPG Size (MW) | Power Loss (MW) | Loss Reduction (%) | Minimum Voltage (p.u.) | VDI (p.u.) | VSI (p.u.) | ||
|---|---|---|---|---|---|---|---|---|---|
| Uncompensated | - | - | 33.45 | 0 | 0.9571 | - | - | ||
| DE [36] | 144.61 (6) | 149.11 (44) | 49.26 (66) | 342.98 | 27.59 | 17.52 | 0.97261 | - | - |
| Sl. No. | Bus No. | Name of the Area | Latitude and Longitude |
|---|---|---|---|
| 1 | 4 | Mylapore | 13°1′54″ N, 80°16′12″ E |
| 2 | 9 | Gummidipoondi | 13°25′50″ N, 80°4′55″ E |
| 3 | 11 | Tharamani | 12°59′6″ N, 80°14′26″ E |
| Sl. No. | Bus No. | Name of the Area | Area (km2) | Land Use Factors | ||||
|---|---|---|---|---|---|---|---|---|
| Wind Potential (MW) | Solar PV Potential (MW) | |||||||
| 9 MW/km2 | 2.25 MW/km2 | 30 MW/km2 | 7.5 MW/km2 | |||||
| 1 | 4 | Mylapore | 3.914 | 35.23 | 8.81 | 117.42 | 29.36 | |
| 2 | 9 | Gummidipoondi | 10 | 90 | 22.5 | 300 | 75 | |
| 3 | 11 | Tharamani | 3.31 | 29.8 | 7.45 | 99.3 | 24.83 | |
Publisher’s Note: MDPI stays neutral with regard to jurisdictional claims in published maps and institutional affiliations. |
© 2021 by the authors. Licensee MDPI, Basel, Switzerland. This article is an open access article distributed under the terms and conditions of the Creative Commons Attribution (CC BY) license (https://creativecommons.org/licenses/by/4.0/).
Share and Cite
Venkatesan, C.; Kannadasan, R.; Alsharif, M.H.; Kim, M.-K.; Nebhen, J. Assessment and Integration of Renewable Energy Resources Installations with Reactive Power Compensator in Indian Utility Power System Network. Electronics 2021, 10, 912. https://doi.org/10.3390/electronics10080912
Venkatesan C, Kannadasan R, Alsharif MH, Kim M-K, Nebhen J. Assessment and Integration of Renewable Energy Resources Installations with Reactive Power Compensator in Indian Utility Power System Network. Electronics. 2021; 10(8):912. https://doi.org/10.3390/electronics10080912
Chicago/Turabian StyleVenkatesan, Chandrasekaran, Raju Kannadasan, Mohammed H. Alsharif, Mun-Kyeom Kim, and Jamel Nebhen. 2021. "Assessment and Integration of Renewable Energy Resources Installations with Reactive Power Compensator in Indian Utility Power System Network" Electronics 10, no. 8: 912. https://doi.org/10.3390/electronics10080912