1. Introduction
Each year, over 80,000 lives are tragically lost on roads, according to the World Health Organization (WHO) yearly report [
1]. European regional status report on road safety shows that over 221 people are killed on roads every day in the European region, and thousands more are injured or disabled, with long-lasting effects. According to the research, 30% of killed road users are pedestrians and cyclists. The main reasons for fatalities are rapid urbanization and motorization, poor safety standards and infrastructure, lack of strong enforcement, drivers being distracted or under the influence of drugs or alcohol, a failure to wear seat belts or helmets, and lack of access to timely post-crash care. Speeding is another critical element causing lack of time to avoid the accident, and early-stage detection of collision could drastically minimize the chance of accident [
2,
3,
4]. Lastly, severe weather conditions like rain, snow, fog are visibility affecting factors causing drivers to adapt to the conditions. However, the study of Das et al. [
5] showed that fog or smoke is 3.24 times more likely to result in a severe injury and is 1.53 times more likely to cause a multiple-vehicle crash. A similar study, prepared by Sun et al. [
6] analyzed rain influence for the diver and, depending on road type, the risk to have an accident increase to 2.61 times.
1.1. Existing Solutions for Driver Assistance
Autonomous vehicles may reach full automation (Level-5) only when they can perform all driving functions under all conditions. It includes the ability to operate autonomously in adverse weather conditions and at night. The far-infrared (FIR) thermal sensors can deliver the sensing capabilities that Level-5 autonomy demands. It is expected, that night vision system revenue growth worldwide between 2015 and 2025 will reach around 18% [
7]. A number of related patents are registered by AdaSky Ltd. [
8,
9,
10,
11], Autoliv Development and AB Flir Systems Inc. [
12,
13], to name a few. FIR based solutions are already available for Level-1 and Level-2 vehicle automation levels. Usually, these are pedestrian detection systems, combining visual spectrum, and FIR camera. Automakers like Audi, BMW, and Daimler install Autoliv designed FLIR Pathfinder nighttime driving assistance. Such a system is based on an FIR spectrum FLIR camera with a resolution of 324 × 256 and a frame rate of 30 Hz [
14]. There are not many details available about accuracy, performance, and type of detector used, but in one publication [
15] Autoliv engineers refer to a Cascade classifier. AdaSky uses convolutional recurrent neural networks for image pre-processing [
11] and additional detector for pedestrian, vehicle, and animal detection.
1.2. Infrared Imaging
Infrared imaging is an important topic in computer vision since radiation of these electromagnetic waves could be detected by the sensors all day long. The most highly available and cheapest cameras on the market are near-infrared (NIR) cameras. It is a visual spectrum camera without an infrared spectrum filter. Such camera for pedestrian detection systems could provide from 44 to 73 m visibility during the night [
16]. However, NIR vision’s primary drawbacks include their susceptibility to glare, blooming, and streaking from active light sources such as oncoming traffic, traffic lights, streetlights, and reflective objects such as road signs. Also, NIR illuminators may cause glare to other drivers using the same type of system and may cause damage to eyes at short distances (<1 m) [
17].
A short-wave infrared (SWIR) spectrum image sensors are rarely used in pedestrian detection applications. Bertozzi et al. [
18] tried to use SWIR cameras in poor visibility conditions. Research has demonstrated that reduced visibility phenomena as haze and fog feature quite different behaviors in the SWIR spectrum but still of no practical utility for automotive applications. Whereas better visibility through haze may be achieved by employing SWIR sensors, but it is a negligible benefit for pedestrian detection, hazing a long-distance phenomenon, no improvements can be obtained in foggy conditions. Similar results observed by [
19] where authors shown that detection rates obtained are no better than reported in the revised state-of-the-art works.
Mid-wave infrared (MWIR) is popular bandwidth used in military applications such as guided missile technology. The 3000–5000 nm portion of MWIR band is the atmospheric window in which the homing heads of passive IR ‘heat-seeking’ missiles are designed to work, homing on to the IR signature of the target aircraft, typically the jet engine exhaust plume [
20]. There are not many published research works related to MWIR use for pedestrian detection use, probably because of specific military use. However, Nguyen et al. [
21] tried to set up a dual detector based on MWIR and long-wave infrared (LWIR) spectrum. The work provided a very robust pedestrian tracking. However, none of the tested sequences provided ambient conditions such as fog, smoke, haze, and precipitation, all of which are expected to impact the two bands differently.
LWIR cameras can provide a better fit for person detection, especially in complex outdoor scenarios with masking background texture or lack of illumination according to [
22]. In general, the human appearance in LWIR images is not homogeneously bright due to clothes and other effects. Instead, there are smooth gray-value transitions inside the human blob and, in case of a merge also to surrounding bright background regions. Also, according to Beeck et al. [
23], LWIR images provide visible pedestrians in severe weather conditions (e.g., fog, heavy rain).
The far-infrared (FIR) cameras are mainly used for pedestrian detection because far-infrared rays are less susceptible to moisture than rays of other wavelength bands [
24]. Unlike NIR or visible spectrum cameras, FIR cameras are susceptible to disturbing light, such as oncoming headlights.
1.3. Contribution
The main contributions of this paper can be summarized as follows:
A new approach of severe weather feature extraction and augmentation approach by using the Denoising Convolutional Neural Network (DnCNN).
Results of pedestrian detection using state-of-the-art detectors testing in a wide variety of situations by using two biggest FIR domain datasets.
A set of trained models for pedestrian detection, which shows the current state-of-the-art performance and are ready for real-time applications.
2. State-of-the-Art
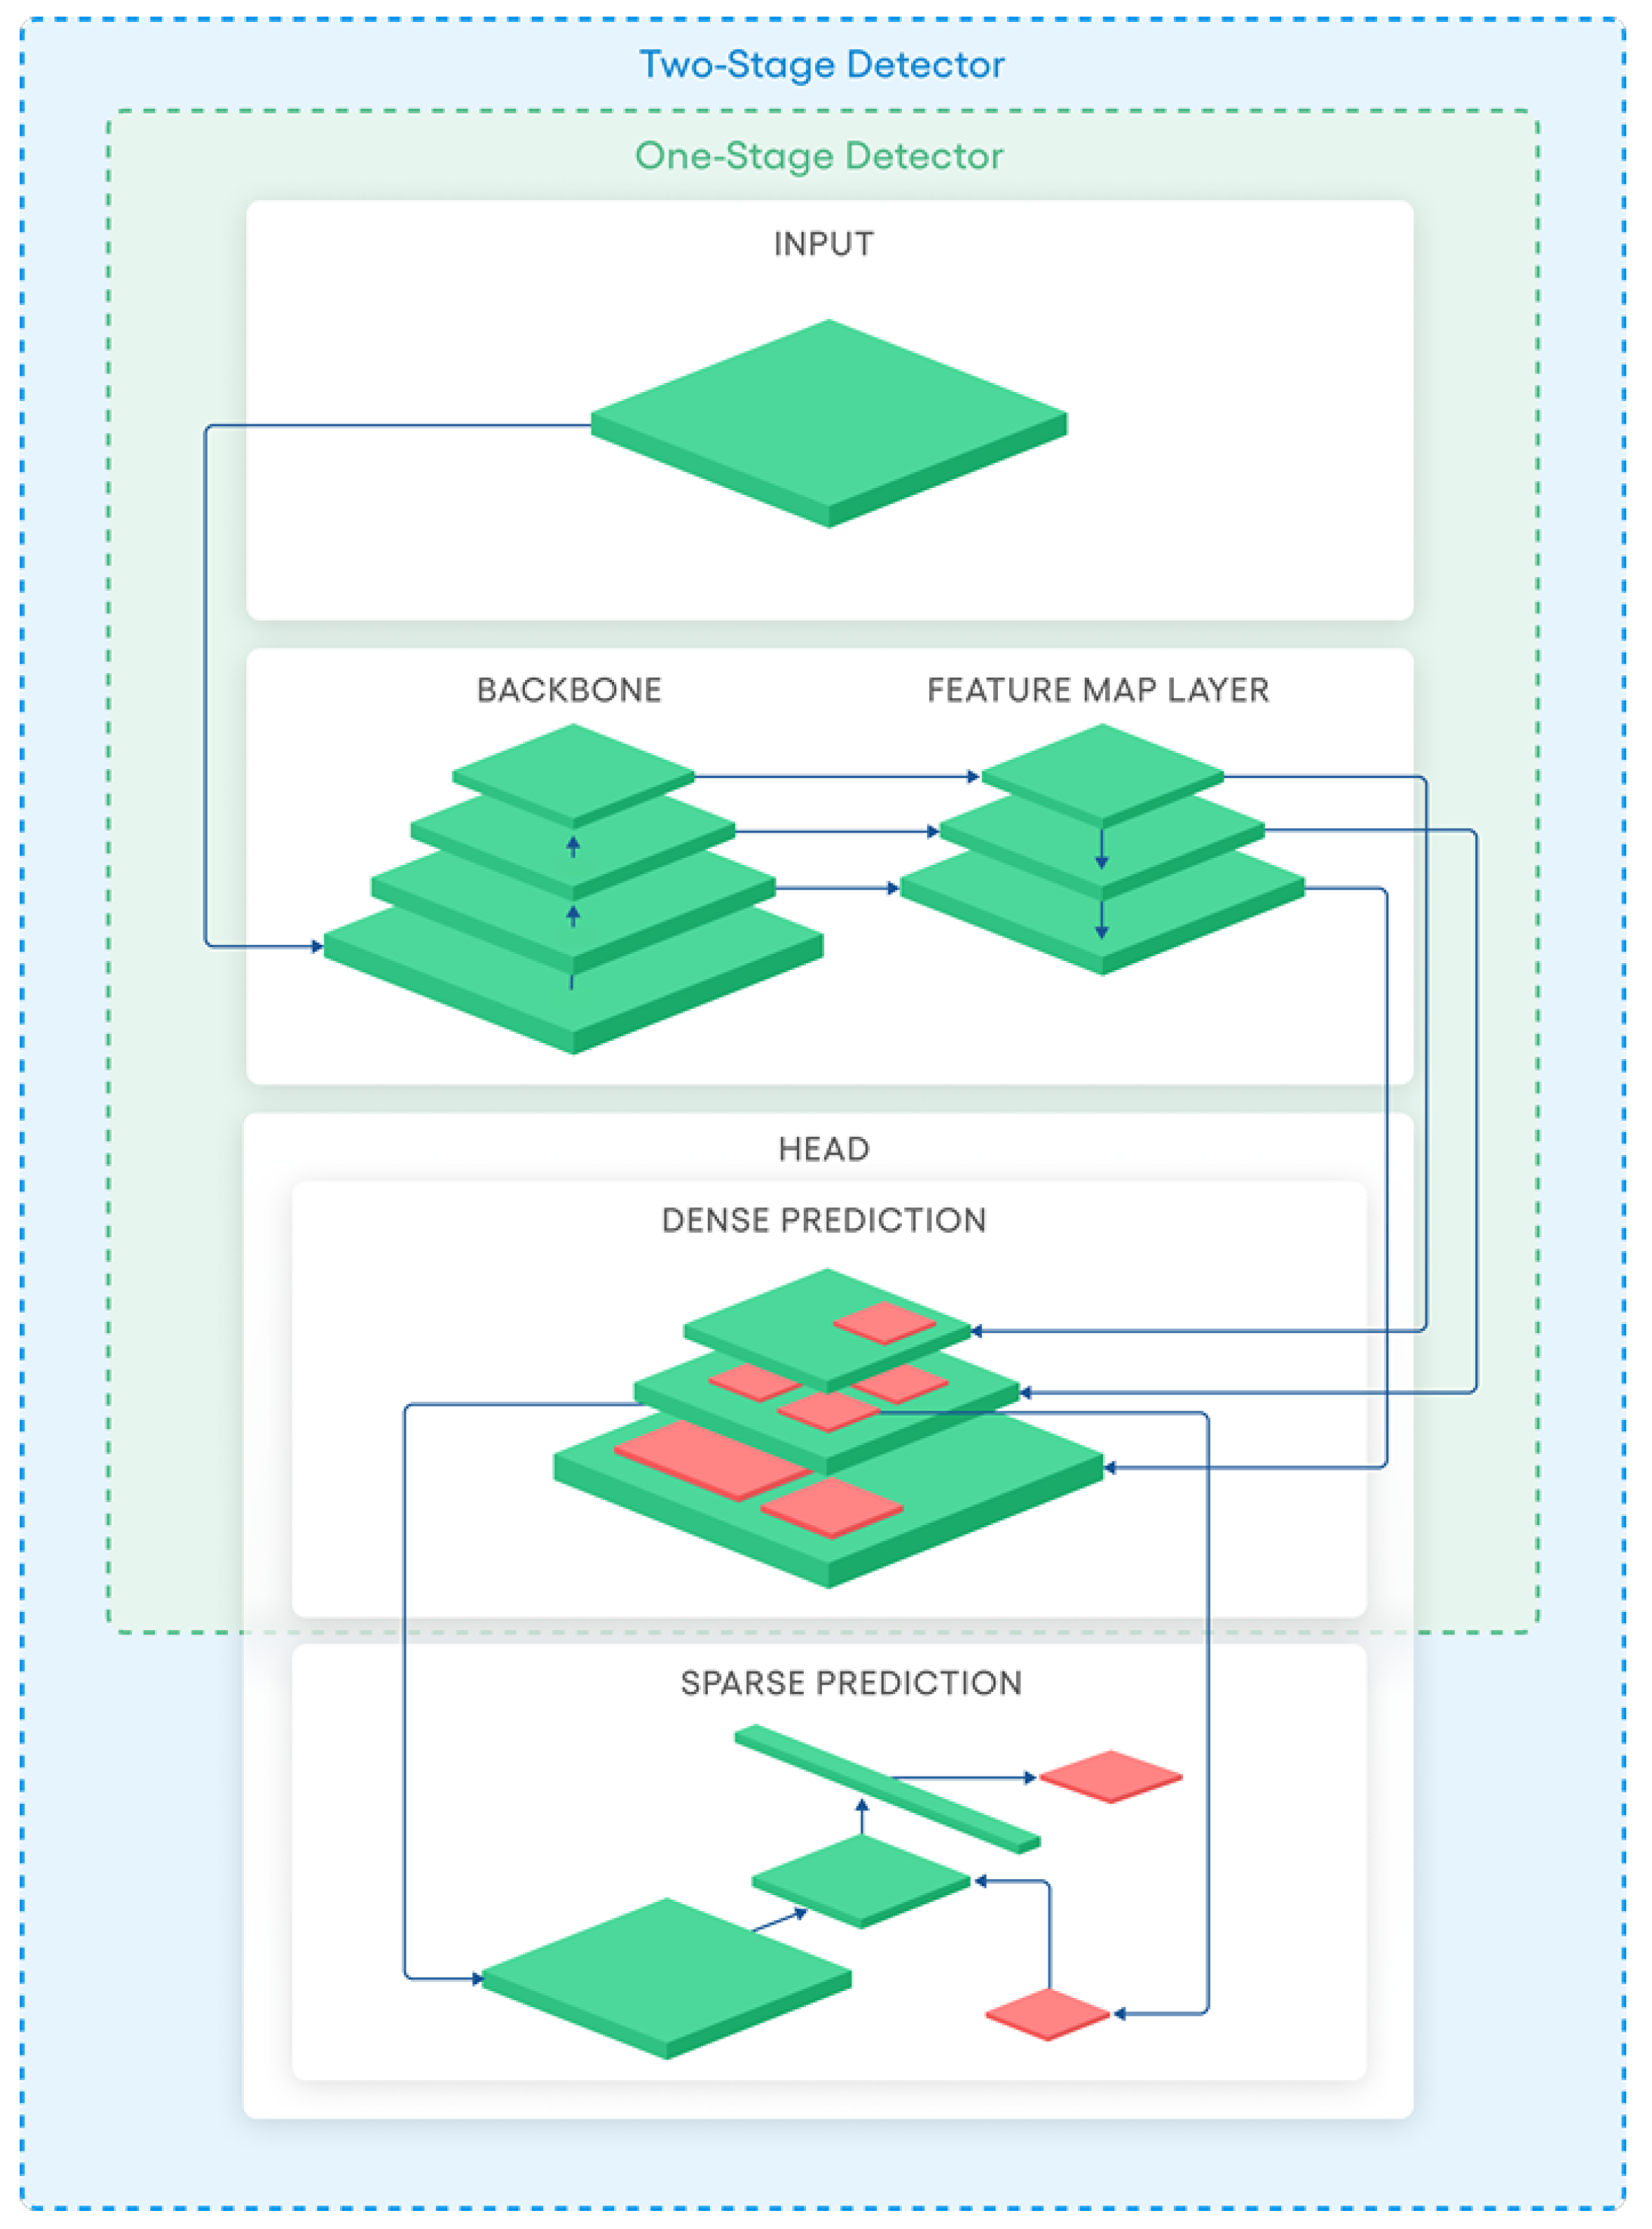
Modern object detectors proposed in literature may be categorized into two categories. In
Figure 1 we have represented a schematic diagram of one-stage and two-stage detectors. The shared part between the two categories is the backbone and the feature map layer parts. At this stage an object classification is usually implemented by following structures like Cross Stage Partial Networks (CSPNet) [
25], Darknet [
26], ResNet [
27], ResNeXt [
28], and VGG [
29]. The Feature map layer is a bridge between the Backbone and Head where different layers are interconnected and composed of several paths. Typically, at this stage, researchers include different Feature Pyramid Networks [
26,
30,
31,
32] and Path Aggregation Network [
33] (PANet). The Head is the part where actual detection is taking place.
The state-of-the-art of one-stage object detectors includes several versions of You Only Look Once (YOLO) [
26,
34,
35,
36], SSD [
37], and RetinaNet [
38]. The state-of-the-art two-stage detectors are R-CNN [
39], Faster R-CNN [
40], and R-FCN [
41].
Two criteria are usually used to evaluate object detectors’ performance: speed measured in frames per second (FPS) and accuracy evaluated by mean Average Precision (mAP). It is a metric typically used for PASCAL challenges [
42] where Average Precision (AP) for one object class is calculated having an IoU threshold of 0.5 and the mAP is calculated by averaging AP over all object classes. Typically, two-stage detectors are very slow because of a complex feature extraction stage and complicated structure. In addition, two-stage detector are able to process images reaching only from 0.1 to 5 FPS [
39,
40,
41,
43,
44]. However, such detectors has comparatively excellent accuracy of up to 69 mAP [
45,
46] on many popular benchmarking datasets (Caltech [
47], KITTI [
48], ImageNet [
49], PASCAL VOC [
50], and MS COCO [
51]). On the other hand, the single-stage detectors are trying to trade accuracy in order to gain speed. YOLO and the minimized version called TINY YOLO were one of the first detectors able to achieve real-time performance with up to 43 mAP, outperforming SSD by 14 mAP [
36].
One of the challenges for both detector categories’ backbone and feature map layers is the multi-scale object detection. To address this problem, researchers usually stack different size layers on each other to extract features at different scales and join them later in a feature map layer. For example, the YOLOv2 backbone has 19 layers, and YOLOv3 has 53 layers. Such modification has affected the detector’s accuracy on the MS COCO dataset by giving a 9.8 mAP increase. However, the speed has decreased from 40 to 20 FPS [
52].
For pedestrian detection, researchers try to combine visual spectrum with FIR domain data [
53,
54,
55,
56] and apply YOLOv1, YOLOv2, YOLOv3, Faster R-CNN, R-FCN, or slightly modified versions where accuracy is ranging from 66 to 79 mAP. An actual FIR domain accuracy was tested by thermal camera manufacturer FLIR and SSD detector and reached 79.4 mAP [
57]. A modified version of SSD was also tested [
58] and reached from 87.68 to 97.5 mAP and YOLOv2 ranged from 58.5 to 80.5 mAP.
3. Materials and Methods
Numerous research showed that a key to successful machine learning-based image object detection is a rich dataset with diverse labeled examples used for model training. However, it is not easy to collect a dataset with many examples covering various situations captured by the FIR image sensor. The first reason—severe weather conditions prevent data collection due to rain and dirt which covers the sensor. The second reason—an image from the sensor is captured after pre-processing, where the charge collected in the FIR sensor matrix is equalized over the range to form an image. This pre-processing causes different images achieved at various environmental temperatures, and the same objects might look differently on a hot summer day and on cold winter day.
The annotation process is time-consuming and requires manual and repetitive work, which usually introduces errors. Finally, data diversification does not cover all situations. For these reasons, application-specific data augmentation could be an advantageous technique to generate additional unique samples. Data augmentation makes the dataset full of different samples, more balanced, transferring annotation, and filling the dataset gaps.
3.1. Pedestrian Datasets
In order to have an accurate pedestrian detector, a rich of features dataset is needed. Features could be described as situations where the image was captured for example during severe rain. Also, it is important to have various pedestrians poses like walking people in the group, crossing the street, or riding an bicycle.
There are up to ten datasets dedicated for pedestrian detection application in the FIR domain: CVC-09 [
59], CVC-14 [
24], FLIR-ADAS [
60], KAIST [
53], KMU [
55], LSIFIR [
61], OTCBVS [
62], RISWIR [
63], Terravic Motion IR [
64], SCUT [
65], and ZUT-FIR-ADAS (ZUT) [
66]. The biggest thermal dataset is SCUT, containing up to 211k frames, captured with 384 × 288 resolution sensor and having more than 448k pedestrian annotations collected in Guangzhou, China. The dataset has a strictly predefined labeling protocol and has six classes (walk person, squat person, ride person, people, person, and combined annotation person/people). The second biggest dataset is the ZUT dataset. It contains widest variety of fine-grained annotated images (110k frames and 122k annotations), which were captured in the four biggest European Union countries with a 320 × 240 resolution sensor during severe weather conditions. The dataset also provides a synchronized Controller Area Network (CAN bus) data, including driving speed, brake pedal status, and outside temperature for further driver assistance system development.
However, the existing dataset does not cover all possible situations and data diversification could reveal possible deficiencies of detectors or rather improve existing performance.
3.2. Fusion of the Two Biggest Datasets
To train a mathematical model of the detector, we decided to merge ZUT [
66] and SCUT [
65] datasets into one. From ZUT, we took an 8bit+low pass version frames, containing only “Pedestrian”, “Occluded”, “Cyclists”, “Motorcyclist”, and “Scooterist” classes and merged them into one class. Such aggregation of the classes was needed because the SCUT FIR dataset includes only pedestrian-related classes (walk person, ride person, etc.).
The preparation of the SCUT dataset was performed in three stages. Firstly, we iterated through all SCUT training dataset and removed frames containing annotations of people groups and people annotations similar to the square shape. This step was needed because ZUT annotation methodology differs from SCUT annotation methodology. Secondly, we merged all classes into a single People class. Finally, we scaled down all the images to resolution of 640 × 480 pixels since SCUT dataset images have interpolated resolution of 720 × 576 pixels.
The summary of the number of video frames and a total number of annotations in selected datasets is given in
Table 1. From ZUT dataset we extracted 69,455 frames (88,624 annotations) for training and 40,103 frames (33,808 annotations) for testing. From the SCUT dataset, we took 78,942 frames (118,377 annotations) for training and 76,381 frames (122,537 annotations) for testing. To show the spatial distribution of image annotations among these datasets, We have generated a heat map (see
Figure 2) representing annotation location and size in image. From this heat map, it is visible, that most annotations are located on right side of the road (red and dark red color)—this is because China and Europe (where these FIR images were collected) are left-side drive countries. Also, we illustrate in
Figure 2 that the spatial distribution of annotations remains similar in the train and test subsets.
3.3. Selection of the Detector Architecture
Six well-known convolutional neural network architectures were selected to investigate the most accurate and real-time ready pedestrian detector: a conventional TinyV3 [
26], a TinyV3 with additional head (TinyL3 [
67]), YOLOv3, YOLOv4, ResNet50 [
27,
68] and Cross Stage Partial Network (CSPNet) [
25] applied on ResNeXt50 [
28,
69]. Also, we made the following modifications to the neural network configuration:
the input was set to 640 × 480;
annotations were auto-rotated by 5 degrees;
contrast and brightness left unchanged;
filter sizes were recalculated for single class use;
anchor ratios were recalculated using the k-means algorithm.
For selecting the best detector, we trained each detector until 300,000 steps by saving training weights every 1k step. After the training, we measured mAP at IoU = 50 for each saved step and the best result was used for further evaluation. The same methodology was used after augmentation, but the training steps were increased to 500,000 steps.
For evaluation of the detector performance we decided to measure Frames Per Second (FPS), mAP, average mAP, Average IoU, Re-call, Precision, and F1-score metrics. Also, we calculated True Positive (TP), False Positive (FP), and False Negative (FN) rates, using 50% of the IoU threshold. The FPS measurements were performed on Intel i7-8750H eighth-generation processor and NVIDIA RTX2070 8 GB graphics card. Training and validation were performed on Darknet Deep Neural Network (DNN) framework [
70].
3.4. Dataset Augmentation
The manual collection of additional images in severe weather conditions is complicated and time-consuming process, especially the annotating phase. We decided to investigate a synthesis option for FIR images.
By investigating the spatial distribution of annotations on the left side is less intensive on a heat map (see
Figure 2), we flipped images and their annotations horizontally. After mirroring the dataset images, the next step was to enrich a training dataset with severe weather samples.
A typical way to generate a wider variety of samples would be by using a Generative adversarial network (GAN). However, we have investigated an alternative approach. Since we are aiming to generate a severe weather features into an image that is visually close to noise and contains linear predefined features, we tried to invert the functionality of denoising DNN. DnCNN [
71], DRU-net [
72], FDnCNN [
73], and DDP [
74] are well known DNN-based denoisers, providing excellent Gaussian denoising, super-resolution transformation capabilities. For this reason we took DnCNN architecture, given in
Figure 3, and performed a modification of training input function
to
, where
x is an input image and
v is a random Gaussian noise.
To train a neural network dedicated to adding severe weather-related FIR image distortions, we took naturally distorted FIR images from the ZUT dataset. These natural images contain sequences of heavy rain, drizzle, and fog. We trained the slightly modified DnCNN until the loss function stopped converging. We applied DnCNN to generate distorted samples from images in the combined dataset, including the flipped ones.
The generated samples are visually similar to original situations where rain and dirt distort captured image. In
Figure 4 we have provided samples used for the training: input images (
Figure 4c,d), real images captures in heavy rain with wet and dirty sensor (
Figure 4a,b) and the output, modified by the DnCNN (
Figure 4e,f). From the sample, shown in
Figure 4c, we see that the pedestrian is cold and there is not much thermal radiation visible, but the corresponding sample in
Figure 4e, generated by DnCNN, shows that features of a cold pedestrian are kept. Similar behavior is noticed with warm pedestrians:
Figure 4d shows input image and
Figure 4f shows the generated output.
4. Results
In
Table 2 and
Table 3 we have presented initial results on a fused dataset. The most accurate detector, tested on initial dataset was YOLOv4. It reached 86.05 mAP and achieved 15.97 FPS on average. The second highest precision was received by ResNet50, with reached 81.00 mAP and achieved 19.82 FPS on average. Detector structures with a minimized Backbone, such as TinyL3, outperformed YOLOv3 (the predecessor of YOLOv4) by 0.34 mAP and reached 43.1 FPS on average. The fastest detector was based on TinyV3 architecture. It worked at 55.57 FPS on average. However, it was the least accurate and showed 73.25 mAP. ResNext50 did not outperform the other detectors in any metrics. Looking from the training overview, the fastest was ResNext50 where only 27,000 training steps were needed to get decent accuracy. The longest time for the training took YOLOv3, where 209,000 steps were needed.
In the
Table 4 we present detectors’ performance with the augmented dataset. The best performance was observed by YOLOv4, reaching an accuracy of 87.02 mAP. The next most accurate detector is ResNext50, which reached 86.45 mAP and gained the highest accuracy boost with the augmented dataset (9.38 mAP). YOLOv3 is the third most accurate detector (83.87 mAP), which outperformed ResNet50 by 1.15 mAP and TinyL3 by 1.89 mAP. The ResNet50 is the fourth most accurate detector (82.72 mAP), which outperformed TinyL3 by 0.74 mAP. The TinyL3 detector showed 81.98 mAP and is more accurate than TinyV3 by 3.73 mAP. Finally, the training process revealed that ResNext50 was one of the first detectors to achieve results the fastest. YOLOv3 took the longest time to train, where 416,000 steps were needed.
Furthermore, a spatial detector confidence distribution of FP and FN, visible in
Figure 5, revealed locations where the detector is failing to identify pedestrians or rather makes a false positive detection. This information could be a powerful way to dynamically adjust the detector’s confidence threshold based on the image object location. For this reason, we slightly modified the detector’s head to adjust the confidence threshold based on combined FP and FN heatmaps visible in
Figure 6, which we call confidence heat-map. A decision to accept or reject detection is made by taking a detected pedestrian rectangle center coordinates and compare probability in the confidence heat-map. If detected object probability is lover than heat-map value—we skip detection, but if it is bigger or equal—we accept detection. As the
Table 5 shows we additionally gained from 0.18 to 1.02 mAP where the most significant boost was observed by YOLOv3 detector.
In addition, we were interested to see how well detectors perform in severe weather conditions before augmentation and after. In
Figure 7 we present how well detectors recognize pedestrians and cyclist during the rain. As shown, YOLOv4, ResNet50 recognize all pedestrians with a probability larger than 50%. However, ResNext50, YOLOv3, TinyV3, and TinyL3 miss one or two pedestrians.
Figure 8 shows the results after augmentation and YOLOv4, TinyV3, ResNet50, and ResNext50 recognize all pedestrians where YOLOv3 and TinyL3 miss only one pedestrian. Also after augmentation we see increased probabilities for pedestrians, which identifies more accurate detectors.
5. Discussion
The main idea behind this paper was to propose an efficient data augmentation solution for simulating bad weather conditions that impact the image received from the FIR sensor. Fortunately, our expectations that DnCNN will perform augmentations with inverted functionality and cause experimental investigation results confirmed more efficient detector training. The performed research also showed that DnCNN could help solve histogram equalization tasks, brightness and contrast auto-tune, and contour segmentation, essential for pedestrian detection in the FIR domain.
The analysis of annotations’ heat-map in our fused FIR dataset with an exceptional amount of labeled frames and pedestrians gave us an idea to add a nonlinear decision threshold for the detector. This comparatively simple upgrade of detectors increased mAP for all tested state-of-the-art detectors (ready for real-time applications) without noticeable processing speed degradation.
The confidence heat-map could be extended for advanced driver-assistance system (ADAS) application usage in situations when severe weather conditions occur. For example, a dedicated confidence heat-map could be designed for rain, fog, frost, and snow conditions and applied to minimize false detections. In this way, a single neural network could benefit in multiple situations.
6. Conclusions
In the paper, we proposed a new field of DnCNN application. We demonstrated a novel approach of severe weather feature extraction and augmentation using DnCNN.
In our investigations, we merged the two biggest FIR domain datasets, ZUT and SCUT, into one. We analyzed the heat-maps taken from these datasets and employed them to identify the properties of annotations. Heat-maps, estimated from the combined dataset, revealed the detectors’ locations with errors. We have successfully applied this information for detector accuracy investigations, allowing us to modify a detector Head to minimize a false detection. Finally, accuracy increased by 9.38 mAP.
The DnCNN application for efficient severe weather feature extraction and existing sample transformation proved its value in pedestrian detection using state-of-the-art detectors, evaluated under wide variety of situations. The detectors’ training on merged and augmented SCUT and ZUT datasets demonstrated high potential. A wider variety of annotations resulted in a more robust detector capable of working in a broader range of weather conditions and situations, providing up to 87.2 mAP, ready for real-time applications. From the results presented, it can be concluded that data synthesis could contribute to other distortions generation, reflecting different weather conditions.


