Article

Influence of the Material Composition SMD Diodes on Their Environmental Impact

1
BSH Electrodomésticos España, S.A., Avda. de la Industria, 49, 50016 Zaragoza, Aragón, Spain
2
i+AITIIP, Department of Mechanical Engineering, University of Zaragoza, C/María de Luna, 3, 50018 Zaragoza, Aragón, Spain
3
Department of Chemical Engineering and Environmental Technologies, Environmental Sciences Institute (IUCA), University of Zaragoza, C/María de Luna, 3, 50018 Zaragoza, Aragón, Spain
*
Author to whom correspondence should be addressed.
Electronics 2021, 10(9), 1033; https://doi.org/10.3390/electronics10091033
Submission received: 24 February 2021 / Revised: 20 April 2021 / Accepted: 22 April 2021 / Published: 26 April 2021
(This article belongs to the Section Industrial Electronics)

Abstract

:
The influence of the material composition of surface-mount device (SMD) diodes on the environment has been analysed in this research. This impact assessment has been performed by means of an environmental impact calculation through a life cycle assessment (LCA), in which the EcoInvent dataset has been updated and customised, generating a more precise environmental impact analysis by considering the exact material composition provided by several suppliers of diodes and also recycling during the production stage. Considering the EcoInvent diode dataset as a reference, variations from nearly 1640% to only 8.5% of the environmental impact have been achieved. For example, the impact per 1 g of SMD diodes can change the global warming potential from 292 g CO2 eq up to 354 g CO2 eq, whereas for abiotic depletion, values can change from 9.9 × 10⁻⁷ up to 1.9 × 10⁻⁴ kg Sb eq. The presence of critical raw materials such as antimony, cobalt, or magnesium, together with precious metals as gold or silver, highly influences the environmental impact values obtained, demonstrating the considerable influence on the environmental impact of the material composition of the SMD diodes analysed.

1. Introduction

Nowadays, there is a substantial worldwide demand for producing goods while preserving environmental resources, reducing the environmental impact, and the amount of waste. The ecodesign concept emerged at the beginning of 1990s with the aim of focusing prevention on the design stage instead of subsequent corrective actions [1]. Also, due to the awareness of society towards environmental issues, the ecological criterion has become one of the main worries for most companies, clearly influencing their strategies, development processes and design thinking [2,3].
At the design stage, the main task from an environmental performance point of view is the selection of the material composition [4], as it will influence the entire product life cycle; ranging from raw material acquisition, when the type and quantity of material are determined, to the end of life [5], considering manufacturing processes and transportation [6,7]. Focusing on ecodesign, the European Union has implemented several policies to this end [8,9]. Furthermore, some standards have been implemented to develop products with minimum environmental impact criteria [10].
In the case of electrical and electronic products, with ecodesign development, waste of electrical and electronic equipment (WEEE) components could be reused in the industry of electronics [11,12]. Technological change has fostered the emergence and flourish of the electrical and electronic goods field. Devices are cheaper, accessible, and more efficient due to technology’s rapid advancement [13,14]. Consequently, vast quantities of WEEE are generated in little time. In Europe, around 9 million tons were generated in 2015 and more than 12 million tons were expected within 2020 [15], while around the world, a total of 65.4 million tons of WEEE were generated just in 2017 [16]. Thus, the separation, collection and recovery of WEEE is progressively growing to improve its environmental control. In 2013, roughly 3.5 million tons were treated in Europe [17]. Furthermore, the European Union implemented two legislations: the first one addressed to WEEE reduction [18], and a second one focused on the restriction of the use of certain hazardous substances in electrical and electronic equipment [19].
During the last years, society’s concern about environmental issues and materials with significant environmental impact has substantially increased. Focusing on society’s and administration’s worry about materials, the European Commission emitts periodical reports about critical raw materials. These materials labelled as critical, have a substantial economic importance to the EU due to the high risk associated with the shortage of supply, their economic vulnerability and the ecological risk they entail [20].
Technological changes have generated a sudden demand for specific materials and, consequently, a decrease for others, so all these factors must be taken into account when a material could be identified or denominated as critical [21,22,23].
That is the reason why this article is mainly focused on the influence of the material composition over the environmental impact regarding critical raw materials. Although the consumption of critical materials has been studied in several products such as cell or mobile phones [24], LCD screens, electrical and electronic devices [25,26]. However, despite some authors having studied methods to reduce and redesign the overall consumption of critical materials [27] no study has been performed until now analysing the life cycle assessment of diodes when considering the presence of critical raw materials and their influence over the environmental impact.
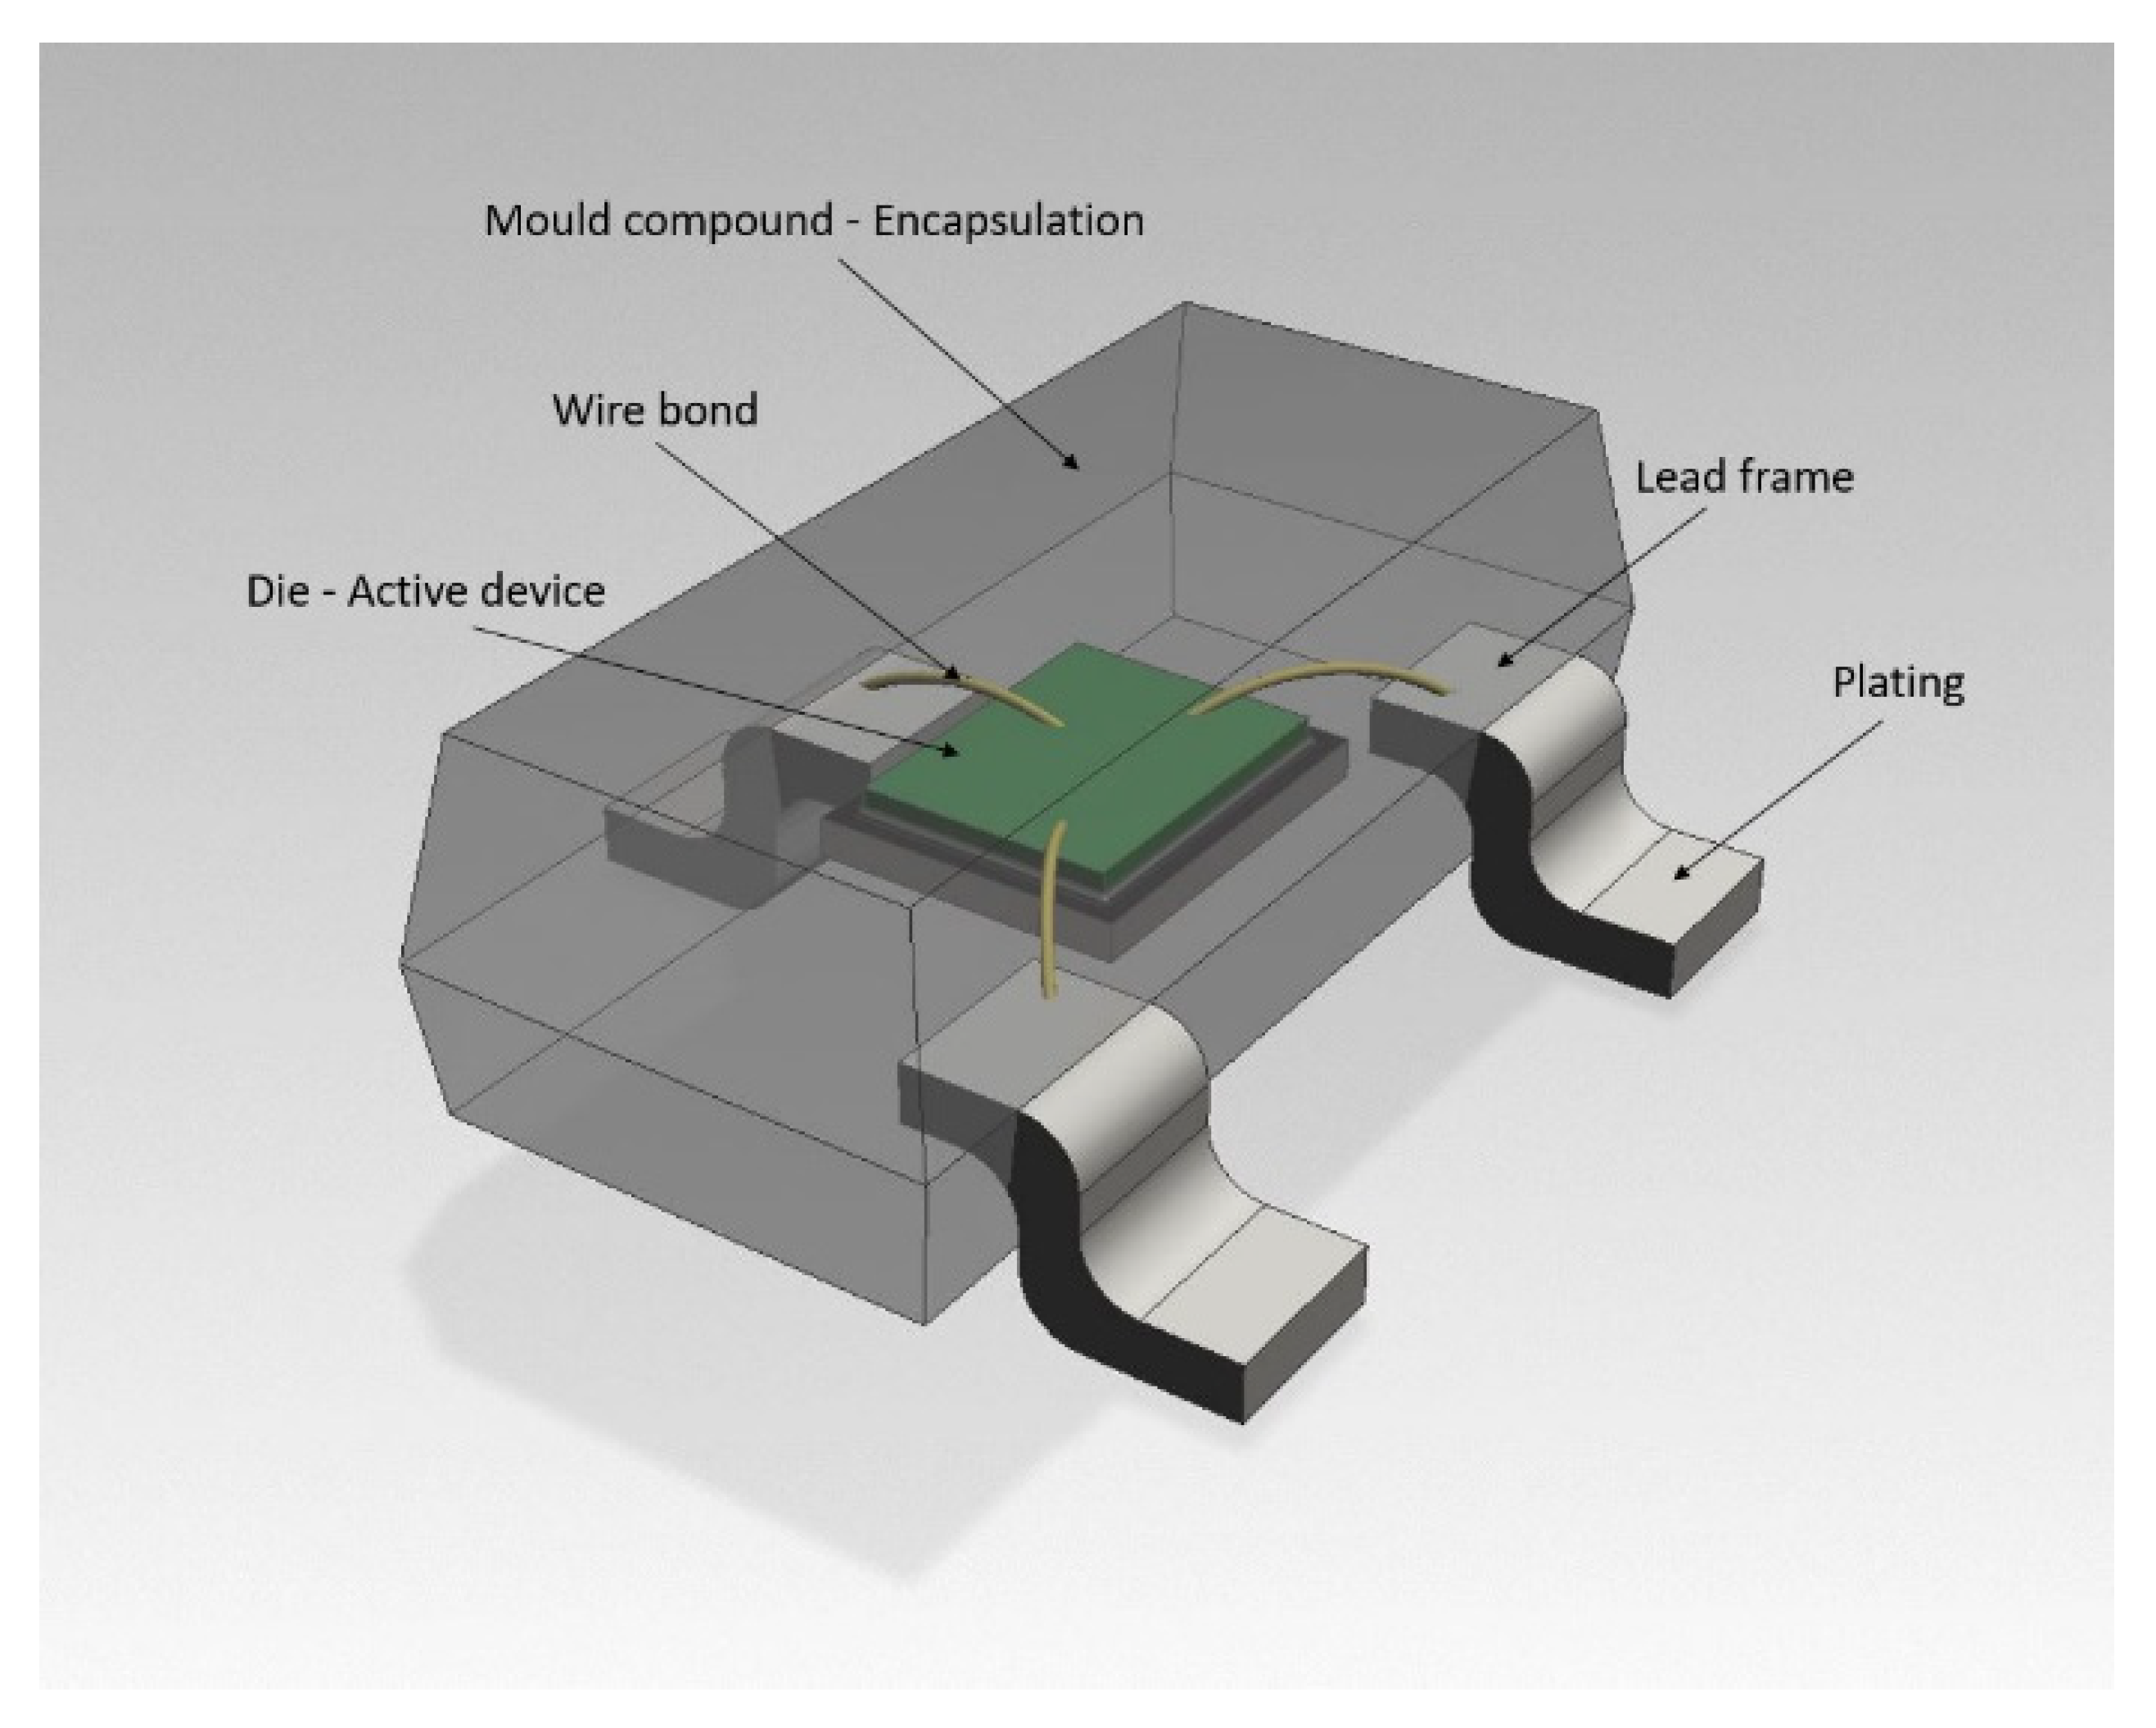
In this article, the SMD diodes’ composition has been studied considering the presence of the previously mentioned critical raw materials (CRMs). Diodes are one of the simplest components among semiconductor devices, consisting of two electrodes, called anode and cathode [28]. They are non-lineal devices that perform a non-lineal relation between current and voltage. When the voltage is lower than the power breakage, the diode current is negligible; otherwise, when the voltage is higher than the power breakage, the diode current increases remarkably quickly [29]. In particular, the SMD diode is a two-terminal, single-junction semiconductor diode that conducts electrical current only in one direction and, at the same time, provides a stable voltage between its terminals, usually between 0.7 V and 1.5 V [30]. The SMD diode is also considered the handiest electronic component that provides essential and relevant circuit design solutions [31,32,33,34,35,36].
Consequently, this study’s most important objective is to analyse how SMD diodes’ material composition influences the environmental impact. To perform it, the life cycle assessment (LCA) has been used to calculate the environmental impact, taking into account the main types of environmental impact throughout the overall life cycle.
Nowadays, many industries implement methodologies and standards such as LCA on their business [37] to get to know how their products affect to the environment. In the literature, LCA has been applied in a wide range of products and services, from plastic products [38,39,40], to electric vehicles [41,42,43], including electricity production and usage [44,45,46,47,48] or batteries [49,50,51,52]. In this field, many studies are focused on ecodesign [53] as it has been proven that applying a suitable ecodesign methodology is key from an environmental point of view [54,55].
Furthermore, diverse authors have written articles about electronic components such as diodes [56], printed circuit boards [57,58], even several studies including LCA on electronic devices as tablets [59], smartphones [60,61] or virtual reality devices [62], photovoltaic cells [63], lighting systems [64], or other electronic products [65,66] and electronic components [67,68].
However, this LCA study focuses on the material composition of several SMD diodes and their influence on the environmental impact taking into consideration several manufacturers’ information to perform this LCA, and considering also recycling in the production phase by applying the EcoInvent methodology.
Generic databases such as EcoInvent are mainly used to perform LCA studies on electronic products. SMD diodes are included in the EcoInvent database, providing a system characterisation that includes material composition and production efforts. Therefore, taking into consideration previous studies by Andrae and Andersen [69,70], who compared the environmental impacts of integrated circuit packaging technologies from manufacturers information; and also considering material composition datasheets that manufacturers of electronic components publish [71,72,73], our approach in this paper is similar to our previous one conducted about transistors [68].
The primary documents used as guides in this research have been a Technical Specification, published by the European Telecommunications Standards Institute (ETSI), to perform LCA of electronic products focused on ICT Equipment, Networks and Services [74], and a Technical Report, also published by the European Telecommunications Standards Institute (ETSI) about Environmental Engineering, Circular Economy and Communication Technology, including parameters such as recycled content, critical raw materials usage and reused parts’ proportion [75].
The researchers Yongguang and Andrae [76], based on the standard of LCA defined in ETSI EE TS 103 199, developed a system to perform a cost valuable LCA of an information and communication technology (ICT) device including data of raw material acquisition, production, use, and EoLT processes of the device
Therefore, in this paper, the LCAs of several SMD diodes will be evaluated, and a comparative analysis with the EcoInvent dataset makes it possible to evaluate the influence of material composition on the environmental impact. It is also important to emphasise the importance of adjusting the information supplied by manufacturers to the characterisation system of EcoInvent.

2. Materials and Methods

2.1. Dataset Improvement Methodology for Electronic Components

As previously explained, the manufacturers’ material composition has been used to update the dataset provided by EcoInvent. Therefore, to achieve a more precise environmental impact assessment, the production process and waste generation will be analysed using the EcoInvent methodology and applying the material composition from the specific datasheets of the component’s manufacturers.
In order to estimate the overall Raw Material Acquisition (RMA) in all the construction elements (e.g., electronic die, lead frame, encapsulation, or wiring), the material composition included in the diode end-product, as well as the overall material consumption and waste generation have been considered. Besides, “Diode, glass-, for surface-mounting {GLO}| market for | Alloc Def, U” has been applied to the studied diodes for the different elements that assembled them. Through the EcoInvent dataset, we will obtain the quantity of non-used raw materials needed to produce all diode manufacturing processes that will be considered as waste. Additionally, the EcoInvent dataset has been modified and updated with current diodes by considering lead-free solders. The production process of the diode is considered using Ecoinvent’s “Diode, auxiliaries and energy use {GLO}| production | Alloc Def, U”, that includes the use of auxiliary materials, consumption of energy, and emissions to environment in the production of SMD diodes.

2.2. LCA Methodology

2.2.1. Goal and Scope Definition

The aim of this LCA is to study how the material composition influences the environmental impact results of the analysed SMD diodes. Once the influence of the diodes’ material composition has been assessed, it can be used as an environmental impact comparative tool to improve diode selection. Diode production is considered based on Ecoinvent data.
For this study, we have obtained the material composition of several SMD diodes from their corresponding manufacturers. SMD diodes are constituted mainly by five parts, as shown in Figure 1, that is, die or active device, lead frame, mould compound or encapsulation, post-plating, and wire bond.

2.2.2. Functional Unit

Defining the functional unit is crucial in LCA performance. In this research, the functional unit has been defined as 1 g of SMD diode considering the electronic component’s material composition, the waste produced during the production process, the energy consumption, end-of-life treatment, and the raw material recycling. The chosen diode is a voltage regulator diode in small SOT23 plastic SMD package, with dimensions of around 3 mm × 2.5 mm × 1.1 mm and power consumption between 250 mW and 350 mW. This diode type is widely used in industrial applications such as half-wave and full-wave rectifiers, voltage multipliers, voltage dividers or LEDs. All nine diodes from manufacturers comply with the specification of the functional unit, and detailed information regarding the material composition was available from the producer. The EcoInvent dataset has also been selected to be used as a reference point.
The environmental impact has been calculated and analysed throughout the SMD diodes information provided by several manufacturers from their components datasheets and also by commercial databases such as EcoInvent. Besides, and constituting a crucial aspect, recycling of raw material during the production process has been considered to reduce RMA’s share in a closed-loop.

2.2.3. System Boundaries

As mentioned before, studying the environmental impact created by different SMD diodes models is the primary goal of this research; analysing the deviation on the environmental impact created by the diodes’ material composition.
An LCA model has been developed to study the environmental impact of each individual diode and make a comparative analysis between them (Figure 2). The following stages are included in the LCA: the extraction and processing of raw materials, energy, and fuel consumption (following ETSI nomenclature, Stage A), manufacturing and production processes of the diode (Stage B1, based on Ecoinvent data) and, finally, the ICT specific end of life treatment (Stage D2). Basic standard processes such as G1 (Transport and Travel), G2 (Electricity Supply), G3 (Fuel Supply), G4 (Other Energy Supply), G5 (Raw Material Acquisition), G6 (End of Life Treatment), and G7 (Raw Material Recycling) have also been included in the studied product system. Whereas, G1 (Distribution to Customers), C (Use Phase) and B.1.2 (Assembly) have been considered out of the limits of this system.

2.2.4. Inventory Data and Cut-Off Criteria

The inventory data and cut-off criteria are based on EcoInvent, one of the most used databases developed by the Swiss Centre for Life Cycle Inventories. Nevertheless, no cut-off has been applied regarding the material composition. Furthermore, EcoInvent v3.4 has been implemented in order to develop the life cycle inventory, completed with datasheets provided by several SMD diodes’ manufacturers.

2.2.5. Assumptions

The LCA model has been performed using SimaPro 8.4, developed by Pré Consultants, executed with CML—IA baseline V.3. methodology and the life cycle inventory has been carried out via the EcoInvent 3.4 database. In order to avoid subjectivity during the evaluation of the environmental impact assessment, we have used the following midpoint impact categories: abiotic depletion, abiotic depletion (fossil fuels), acidification, eutrophication, global warming (GWP 100), ozone layer depletion (ODP), human toxicity, freshwater aquatic ecotoxicity, marine aquatic ecotoxicity, terrestrial ecotoxicity, and photochemical oxidation.

3. Life Cycle Inventory

To analyse the environmental impact of SMD SOT23 diodes, the study has been performed based on material content datasheets provided by manufacturers. Ten diodes with different material compositions have been analysed, includying the SMD diode dataset provided by EcoInvent. Table 1 shows the results of the material composition according to 1 Kg, together with a detailed inventory data, including the material composition of each studied diode.
As it can be observed, the composition and materials quantities vary depending on suppliers. This is the case of materials such as antimony, cobalt, magnesium, or silica sand, considered critical raw materials by the European Commission, which are not integrated within the EcoInvent diode dataset but are, nevertheless, present in other analysed diodes in different quantities. In contrast, there are materials like aluminium oxide, funnel glass and molybdenum, whose presence is only included in the EcoInvent dataset.
The life cycle inventory of each SMD diode has been used achive a more accurate analysis of the material composition’s influence on the environmental impact. In this methodology, the quantity of 1.040622 g for each gram of diode manufactured (a waste amount of 0.040622 g of unused raw material) has been considered to develop the LCA of the diode by EcoInvent, as an input of raw material acquisition (RMA).
Table 2 shows the EcoInvent datasets used to characterise the mentioned diodes inputs following the EcoInvent guidelines. For the diode manufacturing, the use of auxiliary materials, consumption of energy, and emissions to environment in the process are considered using EcoInvent’s data.

4. Results and Discussion

In the present section, the life cycle inventory has been introduced in SimaPro and associated with the EcoInvent database to finally calculate the results of the analysed diodes’ environmental impact. Likewise, the influence of the raw material acquisition, production processes and end of life of each diode on the environmental impact has also been studied. To conclude, four of the ten studied diodes have been analysed to highlight their special unique characteristics or composition, even studying their influence on the total environmental impact.

4.1. Analysis of the Environmental Impact of All Diodes

The environmental impacts of each diode are shown in Table 3, including different midpoint impact categories. The table shows a comparison between each diode environmental impact versus the EcoInvent methodology, considering EcoInvent values as the 100% reference.
As shown in Table 3, the gold content has a decisive influence on all impact categories, especially in diode ESDA14V2L that, containing the highest quantity of gold, generates the highest environmental impact. In contrast, diodes without gold content show the lowest values of environmental impact, as is the case of diode BZX84B10LT1G.
There are materials such as chromium, manganese, silicon, cobalt, or phosphorus, which are included in the material composition of diode ESDA14V2L, but they are not included in the composition of diode BZX84B10LT1G. The first three ones—chromium, manganese, and silicon—were considered candidate materials to be labelled as critical by the European Commission, whilst cobalt was already considered as a critical one. All of them contribute to increase the environmental impact of diode ESDA14V2L.
In the following points, the environmental impacts created by the analysed diodes in each environmental midpoint category are included:
  • The highest value of environmental impact for the abiotic depletion category (resources) is created by the diode ESDA14V2L, with a value of 1633% (EcoInvent’s diode generates 1.16 × 10⁻⁵ kg Sb eq). In contrast, the lowest one belongs to BZX84B10LT1G diode, with only 8.5% of environmental impact versus the 100% of the EcoInvent dataset. The highest value of environmental impact for the abiotic depletion category is created by the diode ESDA14V2L, nearly 165 times higher than the EcoInvent dataset selected as the reference. The main reason for these values’ variation is the quantity of gold included in the composition, followed by its silver content. Regarding fossil fuels consumption, the differences are minor, with values between 96.5% and 118.9% versus the 100% of the EcoInvent dataset (3.44 MJ). These impacts, ranging from 80% to 98% depending on the component, are mainly caused by the diode part production, especially by the electricity consumption used for the manufacturing, followed by the use of liquid nitrogen.
  • For the following environmental impact categories: human toxicity, freshwater aquatic ecotoxicity, marine aquatic ecotoxicity, terrestrial ecotoxicity, and eutrophication, the impacts are constant among all the studied diodes. It means that a higher environmental impact is created by ESDA14V2L diode, followed by diodes CMPD1001A, BZX84C20, and AZ23C10. In contrast, the lowest environmental impact in the mentioned categories is created by BZX84B10LT1G and BAS17 diodes. Gold, silver, and part production processes are the inputs with the most significant influence on these environmental impact categories. As gold content in diodes ESDA14V2L, CMPD1001A, and BZX84C20 is higher, it generates a higher impact value on these categories. In contrast, there is no gold content in diodes BZX84B10LT1G and BAS17 creating, in consequence, lower environmental impact values. Similar behaviour and results are observed with silver. The diodes ESDA14V2L and AZ23C10 contain a higher quantity of silver and generatea higher environmental impact. When no silver content is included in diode BZX84B10LT1G, it generates the lowest environmental impact. In these categories, when regarding part production processes, electricity consumption is the main cause of impact, followed by liquid nitrogen and the electronic component factory. For Marine aquatic ecotoxicity and Human toxicity, the air emissions of Hydrogen fluoride during the production process is a significant cause of environmental impacts (EcoInvent´s diode generates 2.72 × 10³ kg 1.4-DB eq and 1.06 kg 1.4-DB eq, respectively).
  • In global warming (GWP100a) and ozone layer depletion (ODP) categories, the diode ESDA14V2L has the highest value of environmental impact (3.54 × 10⁻¹ kg CO2 eq and 2.45 × 10⁻⁸ kg CFC-11 eq, respectively), followed by CMPD1001A and AZ23C10 diodes. These values are mostly caused by the diode part production, especially by the electricity consumption used for the manufacturing, followed by liquid nitrogen, and ultra-pure water consumption in the case of ozone layer depletion; and also by its gold content.
  • In the case of photochemical oxidation and acidification categories, higher environmental impacts are mainly produced by the consumption of gold, nickel, and by the diode part production. Regarding the latter, electricity consumption, liquid nitrogen, the use of heat and the factory itself, are, in this order, the leading causes of environmental impacts. Diode ESDA14V2L creates the highest impacts, around 31% higher than EcoInvent (1.10 × 10⁻⁴ kg C2H4 eq and 2.63 × 10⁻³ kg SO2 eq, for each category). In contrast, EcoInvent and BAT17 diodes, without nickel content in their compositions, generate the lowest impact in these categories.

4.2. Study of the Life Cycle Stages of Each Diode

In the following subsections, the environmental impact has been analysed, focusing on the three life cycle stages over the whole life cycle: raw materials acquisition (stage A), part production (stage B1), and end of life (stage D2).

4.2.1. Environmental Impact of Raw Material Acquisition

Environmental impacts of the analysed diodes show substantial variations, mainly influenced by materials composition. Table 4 incorporates the environmental impact percentages depending on the raw material acquisition’s contribution to the whole life cycle. Generally speaking, the presence of gold, silver, nickel and tin, in this order, are the primary causes of environmental impacts.
As shown in Table 4, each diode has been analysed throughout the eleven environmental impact categories. In the abiotic depletion category, the percentages of the environmental impact created by the use of materials are the highest ones, around 99%, except in diode BZX84B10LT1G, in which the percentage is nearly half, a mere 48.5%. In contrast, lower percentages are achieved in the abiotic depletion (fossil fuels) and global warming (GWP100a) categories with percentages between 1.2% in diode BZX84B10LT1G and 20.0% in diode ESDA14V2L. They are followed by the following categories: ozone layer depletion (ODP), photochemical oxidation, and acidification. The percentages of the environmental impact created by raw material acquisition are between 1.6% and 37.2% for these last categories.
For human toxicity, freshwater aquatic ecotoxicity, and eutrophication categories, the environmental impact percentages are lower than the abiotic depletion. Nevertheless, they are higher than in ozone layer depletion (ODP), photochemical oxidation or acidification. Percentages of human toxicity are between 78.8% for diode BAT17 and 92.4% for diode ESDA14V2L, except for diode BZX84B10LT1G and diode BAS17 in which the impact values are much lower in all categories, ranging from 3.0% to 7.3% in diode BZX84B10LT1G, and from 11.5% to 18.1% in diode BAS17. As previously mentioned, human toxicity, freshwater aquatic ecotoxicity, and eutrophication categories are mainly influenced by their gold content. Likewise, diodes without gold content show the lowest percentages of the environmental impact created by the raw material acquisition.
Finally, for marine aquatic ecotoxicity and terrestrial ecotoxicity categories, environmental impact results are similar to those in eutrophication categories but slightly lower. General values are between 52.7% and 86.3%. In the case of diodes BZX84B10LT1G and BAS17, environmental impact contribution due to material acquisition is lower, approximately 1.6–6.4%, as there is no gold content in these diodes’ composition. In the EcoInvent diode dataset, something similar happens for the terrestrial ecotoxicity category, showing a lower environmental impact value than the rest, only 22.1%.
In general, analysing the environmental impact for each type of diode, lower values in almost all categories are achieved by diodes BZX84B10LT1G, BAS17 and EcoInvent.

4.2.2. Environmental Impact of Part Production

The results of environmental impacts created by part production processes are included in Table 5, shown as a percentage of the total impact. These percentages are, therefore, influenced both by material composition and the part production itself. Regarding this stage, the main causes of environmental impact are electricity consumption, the use of liquid nitrogen, heat, the electronic component factory, and the emissions of hydrogen fluoride. All the diode production inputs are based on Ecoinvent’s data, as prevoiusly explained in the paper. In general, environmental impacts created by part production processes are lower than raw material acquisition impacts. Nevertheless, as it will be explained, there are exceptions.
For the abiotic depletion category, the percentages of environmental impacts for the analysed diodes are the lowest of all categories: less than 8.2% of the total impact in all diodes, except in diode BZX84B10LT1G, with a higher percentage, 51.5%. However, abiotic depletion also shows the lowest impact of all categories in diode BZX84B10LT1G.
In contrast, abiotic depletion (fossil fuels) and global warming (GWP100a) categories generate the highest values for all diodes, from 98.6% in diode BZX84B10LT1G to 79.9% in diode ESDA14V2L, depending on their gold content and electricity consumption, as previously mentioned.
In between the maximum and minimum values of the part production’s environmental impact are found photochemical oxidation, acidification, and ozone layer depletion (ODP) categories, with values lower than the maximum, between 62.8% and 98.1%. The highest value of this range, 98.1%, belongs to BZX84B10LT1G for the ozone layer depletion (ODP) category, whereas the lowest of the range is a mere 62.8%, corresponding to the diode ESDA14V2L for the acidification category.
In the following categories: human toxicity, freshwater aquatic ecotoxicity, marine aquatic ecotoxicity, terrestrial ecotoxicity, and eutrophication, the percentages of environmental impact are also placed between the maximum and minimum set, with low values close to the minimum. In general, in these categories, environmental impact values are between 6.7% in ESDA14V2L and 47.2% in BAT17. However, there are some exceptions, with values not included in the mentioned range. It is the case of diodes BZX84B10LT1G and BAS17. Both diodes do not behave like the others for these categories showing, the first one, BZX84B10LT1G, a value around 95.0%, and the second one, BAS17, around the range of 90.0%.
Something similar happens in the EcoInvent dataset diode. The percentage for terrestrial ecotoxicity is 77.8%, higher than in human toxicity, freshwater aquatic ecotoxicity, marine aquatic ecotoxicity, and terrestrial ecotoxicity, and eutrophication categories for the same diode, for which percentages are between 13.0% and 36.0%4.2.3. Environmental Impact of the End of Life
The environmental impact created by the end of life treatments is the lowest one. Considering all categories, the impact is between 0.0% and 1.8% of the total. In this subsection, there is no table including all the end of life environmental impact values for each category, as they are obtained by subtracting from 100% the environmental impacts of the raw material acquisition, as shown in Table 4, and the environmental impact of the part production, as shown in Table 5.
Almost all environmental impact values derived from the end of life are lower than 1.0%, except for the freshwater aquatic ecotoxicity category. In the case of diode BZX84B10LT1G, the environmental impact created by the end of life is approximately 1.8%, and 1.6% in the case of diode BAS17; both values derived from the absence of gold content in those diodes, given the influence of gold attendance in the mentioned category.

4.3. Study of the Environmental Impact Generation of Four Selected Diodes

Once the influence of each life cycle stages over the environmental impact has been analysed, the impact of four selected diodes has been studied more in detail in this section. The criteria to analyze in more detail four diodes is based on environmental impact, and on material composition. On the one hand, the diode with higher environmental impacts and more gold content, and the diode with lower environmental impact, and no gold content, will be analyzed. On the other hand, two diodes with average environmental impact values will be analyzed, one without magnesium oxide, and the other one with magnesium oxide, which is a critical raw material that is used in some diodes. During this analysis, it can be observed how material composition influences the environmental impact results.
The four selected diodes analysed in this section are: ESDA14V2L, AZ23C10, PLVA650A, and BZX84B10LT1G. On the one hand, ESDA14V2L, has the highest environmental impact and the highest gold content. On the other hand, the last one, BZX84B10LT1G, shows the lowest environmental impact, as it does not include gold or silver in its composition. In between are included diodes AZ23C10 and PLVA650A; with intermediate environmental impact values between the maximum and minimum and, in any case, higher than those shown by the EcoInvent dataset. Comparing both, the diode AZ23C10 shows a more significant environmental impact value than diode PLVA650A, probably caused by the presence of magnesium oxide, considered as a critical raw material in the diode AZ23C10.

4.3.1. Environmental Impact of ESDA14V2L Diode

Table 6 shows the environmental impact of each category. In the case of gold, it produces most of the environmental impact for the ESDA14V2L diode in these categories: abiotic depletion, human toxicity, freshwater aquatic ecotoxicity, marine aquatic ecotoxicity, terrestrial ecotoxicity, and eutrophication; creating from 76.4% of the environmental impact in the marine aquatic ecotoxicity category (3.54 × 10³ kg 1.4-DB eq) up to 92.3% in the abiotic depletion one (1.75 × 10⁻⁴ kg Sb eq).
Moreover, the electricity consumption also generates a large amount of the environmental impact of this diode on abiotic depletion (fossil fuels), global warming (GWP100a), ozone layer depletion (ODP), photochemical oxidation, and acidification categories, obtaining values between 34.7% for photochemical oxidation (3.81 × 10⁻⁵ kg C2H4 eq) and 51.6% (1.83 × 10⁻¹ kg CO2 eq) in global warming (GWP100a) category.
The nickel contribution is remarkable for the photochemical oxidation and acidification categories, with 13.22% (1.45 × 10⁻⁵ kg C2H4 eq) and 13.86% (3.64 × 10⁻⁴ kg SO2 eq) of the environmental impact, respectively. However, the presence of silver or nitrogen elements is less relevant than previous percentages of the environmental impact results, less than 8.80%. Even in this diode, a low influence on the environmental impact is achieved by the electronic component factory category, with less than 3.68%; or by the heat one, with less than 9.61%. In the case of the EcoInvent’s assumption of the auxiliaries and energy use type, it creates up to 13.2% (6.10 × 10² kg 1.4-DB eq) of the marine aquatic ecotoxicity category’s impact.

4.3.2. Environmental Impact of AZ23C10 Diode

Table 7 shows the environmental impacts of diode AZ23C10 generated in each category. The environmental impact generated by gold in this diode varies considerably among the eleven categories, from 9.65% (3.21 × 10⁻² kg CO2 eq) in the global warming (GWP100a) category up to 93.0% (1.11 × 10⁻⁴ kg Sb eq) in the abiotic depletion. The considerable variation of environmental impact values is similar to the previous diode, as there are categories in which the presence of gold influences more than in others. In the abiotic depletion, freshwater aquatic ecotoxicity, human toxicity, eutrophication, terrestrial ecotoxicity and marine aquatic ecotoxicity categories, the highest environmental impact values generated by gold are achieved, ranging from 68.10% (2.24 × 10³ kg 1.4-DB eq) in the marine aquatic ecotoxicity category to 93% (1.11 × 10⁻⁴ kg Sb eq) in the abiotic depletion.
In contrast, categories such as photochemical oxidation, global warming (GWP100a), abiotic depletion (fossil fuels), acidification, and ozone layer depletion (ODP) show higher percentages of the environmental impact created due to electricity consumption in the production processes: between 36.9% (3.81 × 10⁻⁵ kg C2H4 eq) for photochemical oxidation and up to 54.9% (1.83 × 10⁻¹ kg CO2 eq) in global warming (GWP100a).
The following elements in order of importance are silver, nitrogen, and nickel. In silver, the percentage varies up to 5.99% for the marine aquatic ecotoxicity category, up to 9.00% in nitrogen for the abiotic depletion category (fossil fuels), and up to 15.20% in nickel for the acidification category. On the other hand, the processes or treatments that highly influence the environmental impact are auxiliaries and energy use (0.00–18.50%), electronic component factory (0.22–4.14%) and finally heat (0.002–10.20%).

4.3.3. Environmental Impact of PLVA650A Diode

The environmental impact generation of diode PLVA650A is analysed in Table 8. In this diode, the highest environmental impact values are generated in the abiotic depletion, freshwater aquatic ecotoxicity, human toxicity, eutrophication and terrestrial ecotoxicity categories due to its gold content, showing values between 91.1% (6.35 × 10⁻⁵ kg Sb eq) for the abiotic depletion and 68.0% (1.23 × 10⁻³ kg 1.4-DB eq) for the terrestrial ecotoxicity category.
The consumption of silver is relevant for the abiotic depletion category with 7.11% (4.95 × 10⁻⁶ kg Sb eq) of the environmental impact. In the case of nickel, its presence is relevant for the photochemical oxidation and acidification categories, with 14.8% (1.47 × 10⁻⁵ kg C2H4 eq) and 16.3% (3.69 × 10⁻⁴ kg SO2 eq), respectively.
The contribution of electricity consumption varies between 58.1% and 38.3% in global warming (GWP100a), abiotic depletion (fossil fuels), ozone layer depletion (ODP), acidification, and photochemical oxidation categories. In comparison, auxiliaries and energy use shows its major influence over the marine aquatic ecotoxicity group, with 26.3% (6.10 × 10² kg 1.4-DB eq).

4.3.4. Environmental Impact of BZX84B10LT1G Diode

This diode has the lowest environmental impact, and also, as it can be seen in Table 9, it does not include gold and silver in its material composition. Critical materials such as antimony, cobalt, or magnesium are also not included in the material composition of diode BZX84B10LT1G. Nevertheless, other critical materials such as silica sand are, but their environmental impact value is low, reducing the environmental impact generated by this diode.
As shown in Table 9, in diode BZX84B10LT1G its electricity consumption generates the highest environmental impacts for all categories except for the abiotic depletion. The electricity consumption of the production processes generates from 24.1% (2.40 × 10² kg 1.4-DB eq) in the marine aquatic ecotoxicity category up to 62.6% (1.83 × 10⁻¹ kg CO2 eq) in the global warming (GWP100a) one.
Nickel consumption highly influences the environmental impact: 17.6% (1.65 × 10⁻⁵ kg C2H4 eq) in the photochemical oxidation category and 19.9% (4.14 × 10⁻⁴ kg SO2 eq) for the acidification category. Finally, auxiliaries and energy use creates an essential impact in the marine aquatic ecotoxicity category, with 61.3% (6.10 × 10² kg 1.4-DB eq) of the impact.

5. Conclusions

The material compositions of 10 types of SMD diodes, including the EcoInvent diode dataset, have been analysed in order to determine the influence of the material composition over the whole environmental impact.
Considering the EcoInvent dataset results as the benchmark 100%, their environmental impact percentages vary from 8.5% up to 1632.8%, depending on the gold content included in their compositions. Analysing more in detail the diodes with the highest and the lowest values of environmental impact, besides gold, the materials with the highest influence in terms of environmental impact importance are silver and nickel, none of them considered as critical raw materials.
Nevertheless, they have a significant influence on the environmental impact. The presence of critical raw materials is also remarkable in SMD diodes with higher impacts, as it is the case of antimony, cobalt, magnesium, and silica sand; most of them present in diodes ESDA14V2L, CMPD1001A and AZ23C10.
Raw material acquisition generates the highest environmental impacts in the abiotic depletion category for all studied diodes, from 48.5% to 99.7% of the total impact. Also, in human toxicity, freshwater aquatic ecotoxicity, marine aquatic ecotoxicity, terrestrial ecotoxicity and eutrophication categories, high environmental impacts are achieved by raw material acquisition, while, in contrast, the environmental impact of the part production processes in the abiotic depletion category in most of the studied diodes is less than 1%. The highest environmental impacts due to part production processes are mainly created in all diodes for the following categories: abiotic depletion (fossil fuels), global warming (GWP100a), ozone layer depletion (ODP), photochemical oxidation, and acidification. The environmental impact created by end-of-life treatments is the lowest compared to raw materials acquisition or production processes, less than 1.85% of the total impact. Regarding the life cycle stages out of the system, as diodes are lightweight components, transportation to the users is not usually a relevant impact when compared to the rest of the LCA stages. Assembly (soldering) is usually not relevant when compared to the whole impact of the component. However, the use phase could be a significant part of the environmental impact, depending on the diode’s final application. This use phase should be studied on a product level in order to see the significance of this stage, as the energy consumption of one individual electronic component cannot be easily obtained.
This study has been performed employing information published by the manufacturers of SMD diodes, so data is available to analyse these electronic components’ environmental impact. Nevertheless, to further improve this comparison, manufacturers should provide information about their production processes and waste generation. In addition, from a circular economy point of view, it would be highly recommendable that manufacturers of electronics were able to publish the environmental impacts of their parts and, what is even more challenging, to get to know the precedence of the raw materials used.

Author Contributions

Conceptualization, D.E. and C.J.; Data curation, C.P. and P.G.; Formal analysis, C.P., D.E., P.G. and J.S.; Funding acquisition, C.P. and C.J.; Investigation, C.P., D.E. and J.S.; Methodology, D.E., P.G. and J.S.; Project administration, C.P. and C.J.; Resources, C.P. and C.J.; Software, D.E. and P.G.; Supervision, D.E. and C.J.; Validation, C.P., D.E. and P.G.; Visualization, C.P. and P.G.; Writing—Original draft, C.P., D.E., P.G. and J.S.; Writing—Review & Editing, C.P., D.E., P.G., J.S. and C.J. All authors have read and agreed to the published version of the manuscript.

Funding

The Spanish MICINN has partially supported the research in this paper under Project RTC-2014-1847-6, and the Spanish MINECO under Project RETO RTC-2017-5965-6. This article has been performed by members of the I+AITIIP (DGA-T08_20R) research group of the FEDER 2014-2020 ‘Building Europe from Aragón’ programme, recognised by the Regional Government of Aragon.

Conflicts of Interest

The authors declare no conflict of interest.

References

  1. McAloone, T.C.; Pigosso, D.C.A. From ecodesign to sustainable product/service-systems: A journey through research contributions over recent decades. In Sustainable Manufacturing. Sustainable Production, Life Cycle Engineering and Management; Stark, R., Seliger, G., Bonvoisin, J., Eds.; Springer: Cham, Switzerland, 2017; pp. 99–111. [Google Scholar]
  2. Mackenzie, D. Green Design: Design for the Environment; Laurence King: London, UK, 1991. [Google Scholar]
  3. Plouffe, S.; Lanoie, P.; Berneman, C.; Vernierd, M.F. Economic benefits tied to ecodesign. J. Clean. Prod. 2011, 19, 573–579. [Google Scholar] [CrossRef]
  4. Casamayor, J.L.L.; Su, D. Integration of eco-design tools into the development of eco-lighting products. J. Clean. Prod. 2013, 47, 32–42. [Google Scholar] [CrossRef]
  5. Charter, M.; Ursula, T. Sustainable Solutions: Developing Products and Services for the Future; Greenleaf Publishing: Sheffield, UK, 2001. [Google Scholar]
  6. Börkey, P. A Sustainable Materials Management Case Study. Critical Metals and Mobile Devices; Organisation for Economic Co-operation and Development: Paris, France, 2011. [Google Scholar]
  7. Elduque, A.; Javierre, C.; Elduque, D.; Fernández, Á. LCI databases sensitivity analysis of the environmental impact of the injection molding process. Sustainability 2015, 7, 3792–3800. [Google Scholar] [CrossRef] [Green Version]
  8. European Parliament. Directive 2005/32/EC of the European Parliament and of the Council of 6 July 2005 Establishing a Framework for the Setting of Ecodesign Requirements for Energy-Using Products; EU Publications Office: Luxembourg, 2005. [Google Scholar]
  9. European Parliament. Directive 2009/125/EC of the European Parliament and of the Council of 21 October 2009 Establishing a Framework for the Setting of Ecodesign Requirements for Energy-Related Products; EU Publications Office: Luxembourg, 2009. [Google Scholar]
  10. ISO. Environmental Management Systems—Guidelines for Incorporating Ecodesign. ISO 14006; International Organization for Standardization: Geneva, Switzerland, 2011. [Google Scholar]
  11. Gu, Y.; Wu, Y.; Xu, M.; Mu, X.; Zuo, T. Waste electrical and electronic equipment (WEEE) recycing for a sustainable resource supply in the electronics industry in China. J. Clean. Prod. 2016, 127, 331–338. [Google Scholar] [CrossRef]
  12. Andrae, A.S. Collection rate and reliability are the main sustainability determinants of current fast-paced, small, and short-lived ICT products. WSEAS Trans. Environ. Dev. 2018, 14, 531–540. [Google Scholar]
  13. Kaya, M. Recovery of metals and nonmetals from electronic waste by physical and chemical recycling processes. Waste Manag. 2016, 57, 64–90. [Google Scholar] [CrossRef]
  14. Sakunda, P. Strategy for Electronic Waste Management; UNDP: Kampala, Uganda, 2013. [Google Scholar]
  15. European Commision Web Site. Available online: http://ec.europa.eu/environment/waste/weee/index_en.htm (accessed on 12 November 2019).
  16. Lu, Y.; Xu, Z. Precious metals recovery from waste printed circuit boards: A review for current status and perspective. Resour. Conserv. Recycl. 2016, 113, 28–39. [Google Scholar] [CrossRef]
  17. Eurostat. Waste Statistics—Electrical and Electronic Equipment. Available online: http://ec.europa.eu/eurostat/statistics-explained/index.php/Waste_statistics_-_electrical_and_electronic_equipment (accessed on 10 February 2019).
  18. European Parliament. Directive 2012/19/Eu of the European Parliament and of the Council of 4 July 2012 on Waste Electrical and Electronic Equipment (WEEE); EU Publications Office: Luxembourg, 2012. [Google Scholar]
  19. European Parliament. Directive 2011/65/EU of the European Parliament and of the Council of 8 June 2011 on the Restriction of the Use of Certain Hazardous Substances in Electrical and Electronic Equipment Text with EEA Relevance; EU Publications Office: Luxembourg, 2011. [Google Scholar]
  20. European Commission. Study on the EU’s list of Critical Raw Materials (2020), Critical Raw Materials Profiles; Publications Office of the European Union: Luxembourg, 2020. [Google Scholar]
  21. Chapman, A.; Arendorf, J.; Castella, T.; Thompson, P.; Willis, P. Study on Critical Raw Materials at EU Level; Oakdene Hollins: Buckinghamshire, UK, 2013. [Google Scholar]
  22. Mancini, L.; Sala, S.; Recchioni, M.; Benini, L.; Goralczyk, M.; Pennington, D. Potential of life cycle assessment for supporting the management of critical raw materials. Int. J. Life Cycle Assess. 2015, 20, 100–116. [Google Scholar] [CrossRef]
  23. EASAC. Priorities for Critical Materials for a Circular Economy; The European Academies Science Advisory Council: Halle, Germany, 2016. [Google Scholar]
  24. Diaz, L.A.; Lister, T.E.; Parkman, J.A.; Clark, G. Comprehensive process for the recovery of value and critical materials from electronic waste. J. Clean. Prod. 2016, 125, 236–244. [Google Scholar] [CrossRef] [Green Version]
  25. Talens Peiro, L.; Villalba Méndez, G.; Ayres, R.U. Material flow analysis of scarce metals: Sources, functions, end-uses and aspects for future supply. Environ. Sci. Technol 2013, 46, 2939–2947. [Google Scholar] [CrossRef]
  26. Ylä-Mella, J.; Pongrácz, E. Drivers and constraints of critical materials recycling: The case of indium. Resources 2016, 5, 34. [Google Scholar] [CrossRef] [Green Version]
  27. Hagelüken, C. Recycling of (critical) metals. In Critical Metals Handbook; Gunn, G., Ed.; British Geological Survey: Keyworth, UK, 2014; pp. 41–69. [Google Scholar]
  28. Brindley, K. Starting Electronics, 4th ed.; Elviser: Amsterdam, The Netherlands, 2011. [Google Scholar]
  29. Malvino, A.P. Electronic Principles; Mc Graw Hill: New York, NY, USA, 1999. [Google Scholar]
  30. Harrison, L. Current Sources and Voltage References; Elviser: Melbourne, Australia, 2005. [Google Scholar]
  31. Oskay, W. Basic: Introduction to Zener Diodes. Available online: http://www.evilmadscientist.com/2012/basics-introduction-to-zener-diodes/ (accessed on 3 January 2017).
  32. Yang, X.; Cheng, Z.; Yu, Z.; Jia, L.; Zhang, L.; Zhang, Y. The influence of anode trench geometries on electrical properties of AlGaN/GaN schottky barrier diodes. Electronics 2020, 9, 282. [Google Scholar] [CrossRef] [Green Version]
  33. Powell, J.R.; Viegas, C.; Sanghera, H.S.S.; Huggard, P.G.; Alderman, B. Comparing novel MMIC and hybrid circuit high efficiency GaAs Schottky diode mm-wave frequency doublers. Electronics 2020, 9, 1718. [Google Scholar] [CrossRef]
  34. Wang, J.; Wang, J.; Xiao, B.; Gui, Z.; Jiang, W. Full range capacitor voltage balance PWM strategy for diode-clamped multilevel inverter. Electronics 2020, 9, 1263. [Google Scholar] [CrossRef]
  35. Qi, L.; Meng, J.; Liu, X.; Yang, C.; Zhou, J.; Zhang, D.; Jin, Z. Design of a Schottky metal-brim structure to optimise 180–220 GHz broadband frequency doubler MMIC. Electronics 2020, 9, 715. [Google Scholar] [CrossRef]
  36. Gutiérrez, J.; Zeljami, K.; Pascual, J.P.; Fernández, T.; Tazón, A. Comparison of microstrip W-band detectors based on zero bias Schottky-diodes. Electronics 2019, 8, 1450. [Google Scholar] [CrossRef] [Green Version]
  37. Rossi, M.; Germani, M.; Zamagni, A. Review of ecodesign methods and tools. Barriers and strategies for an effective implementation in industrial companies. J. Clean. Prod. 2016, 129, 361–373. [Google Scholar] [CrossRef]
  38. Deviatkin, I.; Khan, M.; Ernst, E.; Horttanainen, M. Wooden and plastic pallets: A review of life cycle assessment (LCA) studies. Sustainability 2019, 11, 5750. [Google Scholar] [CrossRef] [Green Version]
  39. Mannheim, V.; Simenfalvi, Z. Total life cycle of polypropylene products: Reducing environmental impacts in the manufacturing phase. Polymers 2020, 12, 1901. [Google Scholar] [CrossRef]
  40. Tua, C.; Biganzoli, L.; Grosso, M.; Rigamonti, L. Life cycle assessment of reusable plastic crates (RPCs). Resources 2019, 8, 110. [Google Scholar] [CrossRef] [Green Version]
  41. Kanz, O.; Reinders, A.; May, J.; Ding, K. Environmental impacts of integrated photovoltaic modules in light utility electric vehicles. Energies 2020, 13, 5120. [Google Scholar] [CrossRef]
  42. Marmiroli, B.; Messagie, M.; Dotelli, G.; Van Mierlo, J. Electricity generation in LCA of electric vehicles: A review. Appl. Sci. 2018, 8, 1384. [Google Scholar] [CrossRef] [Green Version]
  43. Dolganova, I.; Rödl, A.; Bach, V.; Kaltschmitt, M.; Finkbeiner, M. A review of life cycle assessment studies of electric vehicles with a focus on resource use. Resources 2020, 9, 32. [Google Scholar] [CrossRef] [Green Version]
  44. Andrae, A.S.G.; Edler, T. On global electricity usage of communication technology: Trends to 2030. Challenges 2015, 6, 117–157. [Google Scholar] [CrossRef] [Green Version]
  45. Gkantou, M.; Rebelo, C.; Baniotopoulos, C. Life cycle assessment of tall onshore hybrid steel wind turbine towers. Energies 2020, 13, 3950. [Google Scholar] [CrossRef]
  46. Piasecka, I.; Tomporowski, A.; Flizikowski, J.; Kruszelnicka, W.; Kasner, R.; Mroziński, A. Life cycle analysis of ecological impacts of an offshore and a land-based wind power plant. Appl. Sci. 2019, 9, 231. [Google Scholar] [CrossRef] [Green Version]
  47. Lunardi, M.M.; Alvarez-Gaitan, J.P.; Bilbao, J.I.; Corkish, R. Comparative life cycle assessment of end-of-life silicon solar photovoltaic modules. Appl. Sci. 2018, 8, 1396. [Google Scholar] [CrossRef] [Green Version]
  48. Parra, C.R.; Corrêa-Guimarães, A.; Navas-Gracia, L.M.; Narváez C., R.A.; Rivadeneira, D.; Rodríguez, D.; Ramirez, A.D. Bioenergy on islands: An environmental comparison of continental palm oil vs. local waste cooking oil for electricity generation. Appl. Sci. 2020, 10, 3806. [Google Scholar] [CrossRef]
  49. Yang, J.; Gu, F.; Guo, J.; Chen, B. Comparative life cycle assessment of mobile power banks with lithium-ion battery and lithium-ion polymer battery. Sustainability 2019, 11, 5148. [Google Scholar] [CrossRef] [Green Version]
  50. Salgado Delgado, M.A.; Usai, L.; Ellingsen, L.W.; Pan, Q.; Hammer Strømman, A. Comparative life cycle assessment of a novel al-ion and a li-ion battery for stationary applications. Materials 2019, 12, 3270. [Google Scholar] [CrossRef] [Green Version]
  51. Tolomeo, R.; De Feo, G.; Adami, R.; Sesti Osséo, L. Application of life cycle assessment to lithium ion batteries in the automotive sector. Sustainability 2020, 12, 4628. [Google Scholar] [CrossRef]
  52. Wang, Y.; Yu, Y.; Huang, K.; Tang, B. From the perspective of battery production: Energy–environment–economy (3e) analysis of lithium-ion batteries in China. Sustainability 2019, 11, 6941. [Google Scholar] [CrossRef] [Green Version]
  53. Dekoninck, E.A.; Domingo, L.; O’Hare, J.A.; Pigosso, D.C.; Reyes, T.; Troussier, N. Defining the challenges for ecodesign implementation in companies: Development and consolidation of a framework. J. Clean. Prod. 2016, 135, 410–425. [Google Scholar] [CrossRef] [Green Version]
  54. Gheorghe, R.; Ishii, K. Eco-design value alignment: Keys to success. Int. Mech. Eng. Congr. Expos. 2007, 15, 267–277. [Google Scholar]
  55. Fiksel, J.; Wapman, K. How to design for environment and minimise life cycle cost. In Proceedings of the 1994 IEEE International Symposium on Electronics and The Environment, San Francisco, CA, USA, 2–4 May 1994. [Google Scholar]
  56. Raypah, M.E.; Dheepan, M.K.; Devarajan, M.; Sulaiman, F. Investigation on thermal characterisation of low power SMD LED mounted on different substrate packages. Appl. Therm. Eng. 2016, 101, 19–29. [Google Scholar] [CrossRef]
  57. Wang, J.; Guo, J.; Xu, Z. An environmentally friendly technology of disassembling electronic components from waste printed circuit boards. Waste Manag. 2016, 53, 218–224. [Google Scholar] [CrossRef]
  58. Andrae, A.S.G.; Hu, L.; Liu, L.; Spear, J.; Rubel, K. Delivering tangible carbon emission and cost reduction through the ICT supply chain. Int. J. Green Technol. 2017, 3, 1–10. [Google Scholar] [CrossRef] [Green Version]
  59. Andrae, A.S.G.; Samuli Vaija, M. The life cycle assessments of an optical network terminal and a tablet: Experiences of the product environmental footprint methodology. Adv. Environ. Res. 2017, 55, 31–46. [Google Scholar]
  60. Samuli Vaija, M. Precision of a streamlined life cycle assessment approach used in eco-rating of mobile phones. Challenges 2017, 8, 21. [Google Scholar]
  61. Andrae, A.S.G.; Xia, M.; Zhang, J.; Tang, X. Practical eco-design and eco-innovation of consumer electronics—The case of mobile phones. Challenges 2016, 7, 3. [Google Scholar] [CrossRef] [Green Version]
  62. Andrae, A.S.G. Life cycle assessment of a virtual reality device. Challenges 2017, 8, 15. [Google Scholar] [CrossRef]
  63. Andersen, O.; Gilpin, G.; Andrae, A.S. Cradle-to-gate life cycle assessment of the dry etching step in the manufacturing of photovoltaic cells. AIMS Energy 2014, 2, 410–423. [Google Scholar] [CrossRef]
  64. Bertin, K.; Canale, L.; Ben Abdellah, O.; Méquignon, M.A.; Zissis, G. Life cycle assessment of lighting systems and light loss factor: A case study for indoor workplaces in France. Electronics 2019, 8, 1278. [Google Scholar] [CrossRef] [Green Version]
  65. Matuštík, J.; Kočí, V. A comparative life cycle assessment of electronic retail of household products. Sustainability 2020, 12, 4604. [Google Scholar] [CrossRef]
  66. Quintana-Pedraza, G.A.; Vieira-Agudelo, S.C.; Muñoz-Galeano, N. A cradle-to-grave multi-pronged methodology to obtain the carbon footprint of electro-intensive power electronic products. Energies 2019, 12, 3347. [Google Scholar] [CrossRef] [Green Version]
  67. Andrae, A.; Zou, G.; Liu, J. LCA of electronic products. Int. J. Life Cycle Assess. 2004, 9, 45–52. [Google Scholar] [CrossRef]
  68. Gómez, P.; Elduque, D.; Sarasa, J.; Pina, C.; Javierre, C. Influence of the material composition on the environmental impact of SMD transistors. J. Clean. Prod. 2015, 107, 722–730. [Google Scholar] [CrossRef]
  69. Andrae, A.; Andersen, O. Life cycle assessment of integrated circuit packaging technologies. Int. J. Life Cycle Assess. 2011, 16, 258–267. [Google Scholar] [CrossRef]
  70. Andrae, A. Method based on market changes for improvement of comparative attributional life cycle assessment. Int. J. Life Cycle Assess. 2015, 20, 263–275. [Google Scholar] [CrossRef]
  71. Fairchild, Power Management IC and Semiconductor Company. Available online: https://www.fairchildsemi.com/ (accessed on 3 January 2020).
  72. Diodes Incorporated: Diode Semiconductor, Discrete Devices. Available online: http://www.diodes.com/ (accessed on 3 January 2020).
  73. NXP. NXP Semiconductors. Available online: http://www.nxp.com/ (accessed on 3 January 2020).
  74. ETSI. ETSI ES 203 199 V1.3.1: Environmental Engineering (EE); Methodology for Environmental Life Cycle Assessment (LCA) of Information and Communication Technology (ICT) Goods, Networks and Services; European Telecommunications Standards Institute: Sophia Antipolis, France, 2015. [Google Scholar]
  75. ETSI. Etsi Tr 103 476 V1.1.2: Environmental Engineering (EE); Circular Economy (CE) in Information and Communication Technology (ICT); Definition of Approaches, Concepts and Metrics; European Telecommunications Standards Institute: Sophia Antipolis, France, 2018. [Google Scholar]
  76. Yongguang, Z.; Andrae, A. System and Method of Life-Cycle Assessment for Equipment of Information and Communication Technology. Patent WO 2014012590 A1, 23 January 2014. [Google Scholar]
Figure 1. Schematic view of the parts of an SMD diode.
Electronics 10 01033 g001
Figure 2. System boundaries.
Electronics 10 01033 g002
Table 1. Material composition for 1 g of studied SMD diodes.
EcoInventBAT17BZX84B10LT1GBZX84C20CMPD1001APLVA650AAZ23C10BAS17DDZX10CESDA14V2L
Aluminium hydroxide0.00 × 100.00 × 108.86 × 10−20.00 × 100.00 × 100.00 × 100.00 × 100.00 × 100.00 × 100.00 × 10
Aluminium oxide3.06 × 10−10.00 × 100.00 × 100.00 × 100.00 × 100.00 × 100.00 × 100.00 × 100.00 × 100.00 × 10
Aluminium0.00 × 100.00 × 100.00 × 100.00 × 100.00 × 102.93 × 10−40.00 × 102.93 × 10−40.00 × 100.00 × 10
Antimony0.00 × 101.32 × 10−20.00 × 100.00 × 106.80 × 10−38.00 × 10−60.00 × 108.00 × 10−60.00 × 100.00 × 10
Bromine0.00 × 100.00 × 100.00 × 100.00 × 106.80 × 10−30.00 × 100.00 × 100.00 × 100.00 × 100.00 × 10
Carbon black0.00 × 106.62 × 10−33.05 × 10−36.96 × 10−30.00 × 102.04 × 10−31.26 × 10−33.38 × 10−31.35 × 1031.28 × 10−3
Chromium0.00 × 109.27 × 10−40.00 × 100.00 × 100.00 × 107.17 × 10−42.86 × 10−47.17 × 10−42.88 × 10−42.33 × 10−4
Cobalt0.00 × 100.00 × 100.00 × 101.37 × 10−30.00 × 101.40 × 10−31.43 × 10−31.40 × 10−31.44 × 10−31.40 × 10−3
Copper2.40 × 10−13.08 × 10−15.04 × 10−20.00 × 100.00 × 103.71 × 10−20.00 × 103.76 × 10−20.00 × 100.00 × 10
Epoxy resin2.11 × 10−21.52 × 10−16.11 × 10−21.39 × 10−11.35 × 10−10.00 × 108.85 × 10−29.74 × 10−29.43 × 10−23.41 × 10⁻²
Funnel glass2.51 × 10−10.00 × 100.00 × 100.00 × 100.00 × 100.00 × 100.00 × 100.00 × 100.00 × 100.00 × 10
Gold0.00 × 108.39 × 10−40.00 × 102.29 × 10−32.42 × 10−31.10 × 10−31.92 × 10−30.00 × 109.66 × 10−43.02 × 10⁻³
Iron0.00 × 100.00 × 101.83 × 10−11.53 × 10−11.47 × 10−11.56 × 10−11.65 × 10−11.56 × 1011.66 × 10−11.64 × 10⁻¹
Lead0.00 × 100.00 × 100.00 × 100.00 × 104.04 × 10−32.70 × 10−60.00 × 102.70 × 10−60.00 × 100.00 × 10
Magnesium oxide0.00 × 100.00 × 100.00 × 100.00 × 100.00 × 100.00 × 105.05 × 10−20.00 × 105.39 × 10−20.00 × 10
Manganese0.00 × 100.00 × 100.00 × 102.18 × 10−30.00 × 102.80 × 10−31.71 × 10−32.80 × 1031.73 × 10−31.74 × 10⁻³
Molybdenum1.54 × 10−10.00 × 100.00 × 100.00 × 100.00 × 100.00 × 100.00 × 100.00 × 100.00 × 100.00 × 10
Nickel0.00 × 100.00 × 101.32 × 10−11.14 × 10−11.02 × 10−11.18 × 10−11.17 × 10−11.18 × 10−11.18 × 10−11.16 × 10⁻¹
Phenolic resin0.00 × 100.00 × 106.11 × 10−20.00 × 106.76 × 10−21.82 × 10−14.42 × 10−26.49 × 10−24.71 × 10−23.12 × 10⁻²
Phosphorus0.00 × 100.00 × 100.00 × 100.00 × 100.00 × 106.52 × 10−50.00 × 103.31 × 10−30.00 × 101.56 × 10−2
Silicon electronics4.60 × 10−30.00 × 106.23 × 10−35.56 × 10−32.65 × 10−29.31 × 10−35.00 × 10−29.32 × 10−37.62 × 10−33.41 × 10⁻²
Silica sand0.00 × 104.90 × 10−13.97 × 10−15.50 × 10−14.60 × 10−14.51 × 10−14.36 × 10−14.67 × 10−14.65 × 10−15.44 × 10⁻¹
Silicon metallurgical0.00 × 106.20 × 10−50.00 × 108.17 × 10−40.00 × 108.47 × 10−40.00 × 108.48 × 10−40.00 × 104.65 × 10−4
Silver0.00 × 101.12 × 10−20.00 × 109.53 × 10−46.92 × 10−38.37 × 10−31.21 × 10−28.38 × 10−31.22 × 10−22.28 × 10⁻²
Sulfur0.00 × 100.00 × 100.00 × 100.00 × 100.00 × 106.52 × 10−50.00 × 106.52 × 10−50.00 × 100.00 × 10
Tin2.26 × 10−21.70 × 10−21.75 × 10−22.37 × 10−23.52 × 10−22.79 × 10−22.99 × 10−22.79 × 10−23.01 × 10−22.98 × 10⁻²
Titanium0.00 × 103.09 × 10−40.00 × 100.00 × 100.00 × 100.00 × 100.00 × 100.00 × 100.00 × 100.00 × 10
TOTAL1.00 × 101.00 × 101.00 × 101.00 × 101.00 × 101.00 × 101.00 × 101.00 × 101.00 × 101.00 × 10
Table 2. EcoInvent dataset selection for the Diode LCI.
InputDataset
Aluminium hydroxideAluminium hydroxide {GLO}|market for|Alloc Def, U
Aluminium oxideAluminium oxide {GLO}|market for|Alloc Def, U
AluminiumAluminium, wrought alloy {GLO}|market for|Alloc Def, U
AntimonyAntimony {GLO}|market for|Alloc Def, U
BromineBromine {GLO}|market for|Alloc Def, U
Carbon blackCarbon black {GLO}|market for|Alloc Def, U
ChromiumChromium {GLO}|market for|Alloc Def, U
CobaltCobalt {GLO}|market for|Alloc Def, U
CopperCopper {GLO}|market for|Alloc Def, U
Epoxy resinEpoxy resin, liquid {GLO}|market for|Alloc Def, U
Funnel glassFunnel glass, for cathode ray tube display {GLO}|market for|Alloc Def, U
GoldGold {GLO}|market for|Alloc Def, U
IronPig iron {GLO}|market for|Alloc Def, U
LeadLead {GLO}|market for|Alloc Def, U
Magnesium oxideMagnesium oxide {GLO}|market for|Alloc Def, U
ManganeseManganese {GLO}|market for|Alloc Def, U
MolybdenumMolybdenum {GLO}|market for|Alloc Def, U
NickelNickel, 99.5% {GLO}|market for|Alloc Def, U
Phenolic resinPhenolic resin {GLO}|market for|Alloc Def, U
PhosphorusPhosphorus, white, liquid {GLO}|market for|Alloc Def, U
Silicon electronicsSilicon, electronics grade {GLO}|market for|Alloc Def, U
Silica sandSilica sand {GLO}|market for|Alloc Def, U
Silicon metallurgicalSilicon, metallurgical grade {GLO}|market for|Alloc Def, U
SilverSilver {GLO}|market for|Alloc Def, U
SulfurSulfur {GLO}|market for|Alloc Def, U
TinTin {GLO}|market for|Alloc Def, U
TitaniumTitanium, primary {GLO}|market for|Alloc Def, U
Diode base Ecoinvent datasetDiode, glass, for surface mounting {GLO}|production|Alloc Def, U
Diode production processesDiode, auxiliaries and energy use {GLO}|production|Alloc Def, U
Table 3. Environmental impact of all studied diodes.
Impact CategoryUnitEcoInventBAT17BZX84B10LT1GBZX84C20CMPD1001APLVA650AAZ23C10BAS17DDZX10CESDA14V2L
Abiotic depletionkg Sb eq1.16 × 10−55.65 × 10−59.90 × 10−71.34 × 10−41.46 × 10−46.97 × 10−51.19 × 10−46.19 × 10−66.43 × 10−51.90 × 10⁻⁴
Abiotic depletion (fossil fuels)MJ3.44 × 103.56 × 103.32 × 103.81 × 103.90 × 103.61 × 103.83 × 103.37 × 103.59 × 104.09 × 10
Global warming (GWP100a)kg CO2 eq3.04 × 10−13.11 × 10−12.92 × 10−13.30 × 10−13.37 × 10−13.14 × 10−13.33 × 10−12.96 × 10−13.13 × 10−13.54 × 10⁻¹
Ozone layer depletion (ODP)kg CFC-11 eq1.87 × 10−82.06 × 10−81.66 × 10−82.11 × 10−82.21 × 10−81.96 × 10−82.18 × 10−81.75 × 10−81.94 × 10−82.45 × 10⁻⁸
Human toxicitykg 1.4-DB eq1.06 × 107.08 × 10−11.60 × 10−11.50 × 101.60 × 108.26 × 10−11.31 × 101.80 × 10−17.50 × 10−11.98 × 10
Freshwater aquatic ecotox.kg 1.4-DB eq7.10 × 10−14.79 × 10−11.02 × 10−11.05 × 101.11 × 105.69 × 10−19.12 × 10−11.15 × 10−15.18 × 10−11.38 × 10
Marine aquatic ecotoxicitykg 1.4-DB eq2.72 × 1032.07 × 1039.95 × 1023.67 × 1033.86 × 1032.32 × 1033.30 × 1031.04 × 1032.18 × 1034.63 × 103
Terrestrial ecotoxicitykg 1.4-DB eq7.02 × 10−41.56 × 10−35.68 × 10−43.14 × 10−33.30 × 1031.82 × 10−32.74 × 10−35.84 × 10−41.67 × 10−34.00 × 10−3
Photochemical oxidationkg C2H4 eq8.52 × 10−58.69 × 10−59.39 × 10−51.02 × 10−41.03 × 10−49.96 × 10−51.03 × 10−49.43 × 10−59.86 × 10−51.10 × 10⁻⁴
Acidificationkg SO2 eq1.98 × 10−31.96 × 10−32.08 × 10−32.41 × 10−32.43 × 10−32.27 × 10−32.42 × 10−32.09 × 10−32.25 × 10−32.63 × 10⁻³
Eutrophicationkg PO4 eq3.01 × 10−32.11 × 10−36.12 × 10−44.34 × 10−34.61 × 10−32.46 × 10−33.82 × 10−36.71 × 10−42.26 × 10−35.68 × 10⁻³
Table 4. Percentage of environmental impact due to materials.
Impact CategoryEcoInventBAT17BZX84B10LT1GBZX84C20CMPD1001APLVA650AAZ23C10BAS17DDZX10CESDA14V2L
Abiotic depletion95.6%99.1%48.5%99.6%99.6%99.3%99.6%91.8%99.2%99.7%
Abiotic depletion (fossil fuels)4.8%8.0%1.4%14.0%15.9%9.2%14.5%2.9%8.7%20.0%
Global warming (GWP100a)5.1%7.2%1.2%12.8%14.6%8.3%13.4%2.7%8.0%18.6%
Ozone layer depletion (ODP)12.6%20.5%1.6%22.6%26.0%16.7%24.8%6.3%15.6%33.1%
Human toxicity85.8%78.8%5.9%90.0%90.6%81.8%88.5%16.7%80.0%92.4%
Freshwater aquatic ecotox.86.7%80.3%7.3%91.0%91.5%83.4%89.6%18.1%81.7%93.2%
Marine aquatic ecotoxicity63.9%52.7%1.6%73.3%74.7%57.8%70.3%5.5%55.0%78.9%
Terrestrial ecotoxicity22.1%64.9%3.7%82.6%83.5%69.9%80.1%6.4%67.3%86.3%
Photochemical oxidation10.3%12.0%18.6%25.1%25.8%23.3%26.1%18.9%22.5%30.4%
Acidification16.6%15.6%20.7%31.3%32.0%27.2%31.6%21.1%26.6%37.2%
Eutrophication80.3%71.9%3.0%86.3%87.1%75.9%84.5%11.5%73.7%89.6%
Table 5. Percentage of environmental impact created due to part production.
Impact CategoryEcoInventBAT17BZX84B10LT1GBZX84C20CMPD1001APLVA650AAZ23C10BAS17DDZX10CESDA14V2L
Abiotic depletion4.4%0.9%51.5%0.4%0.4%0.7%0.4%8.2%0.8%0.3%
Abiotic depletion (fossil fuels)95.1%91.8%98.5%85.9%84.0%90.7%85.4%96.9%91.1%79.9%
Global warming (GWP100a)94.7%92.6%98.6%87.0%85.2%91.5%86.4%97.1%91.8%81.2%
Ozone layer depletion (ODP)87.1%79.3%98.1%77.2%73.8%83.1%75.0%93.5%84.2%66.7%
Human toxicity14.2%21.1%93.8%10.0%9.4%18.1%11.4%83.1%20.0%7.6%
Freshwater aquatic ecotox.13.0%19.4%90.8%8.8%8.3%16.3%10.2%80.3%17.9%6.7%
Marine aquatic ecotoxicity36.0%47.2%98.3%26.6%25.3%42.1%29.7%94.3%44.9%21.1%
Terrestrial ecotoxicity77.8%35.1%96.2%17.4%16.5%30.1%19.9%93.5%32.7%13.7%
Photochemical oxidation89.6%87.8%81.2%74.7%74.1%76.6%73.7%80.9%77.3%69.5%
Acidification83.4%84.3%79.2%68.6%68.0%72.8%68.3%78.9%73.3%62.8%
Eutrophication19.7%28.1%96.9%13.6%12.9%24.1%15.5%88.4%26.2%10.4%
Table 6. Detailed study of environmental impact of diode ESDA14V2L (impacts for 1 g of diode).
Impact CategoryUnitGoldAuxiliaries and Energy UseElectricity ConsumptionSilverNitrogenElectronic Component FactoryHeatNickelOthersTotal
Abiotic depletionkg Sb eq1.75 × 10−40.00 × 107.22 × 10−81.35 × 10−58.23 × 10−92.57 × 10−72.56 × 10−91.09 × 10−77.56 × 10−71.90 × 10⁻⁴
Abiotic depletion (fossil fuels)MJ6.36 × 10−10.00 × 102.01 × 101.13 × 10−16.42 × 10−26.80 × 10−22.67 × 10−11.38 × 10−26.38 × 10−14.09 × 10
Global warming (GWP100a)kg CO2 eq5.06 × 10−20.00 × 101.83 × 10−19.50 × 10−35.35 × 10−37.21 × 10−33.14 × 10−21.33 × 10−34.04 × 10−23.54 × 10⁻¹
Ozone layer depletion (ODP)kg CFC-11 eq5.92 × 10−90.00 × 108.92 × 10−91.57 × 10−96.26 × 10−19.00 × 10−16.17 × 10−11.02 × 10−14.87 × 10−92.45 × 10⁻⁸
Human toxicitykg 1.4-DB eq1.77 × 104.28 × 10−25.33 × 10−24.49 × 10−22.03 × 10−32.35 × 10−27.92 × 10−37.03 × 10−31.53 × 10−21.98 × 10
Freshwater aquatic ecotox.kg 1.4-DB eq1.25 × 107.01 × 10−55.89 × 10−23.18 × 10−22.76 × 10−31.01 × 10−24.87 × 10−35.91 × 10−31.21 × 10−21.38 × 10
Marine aquatic ecotoxicitykg 1.4-DB eq3.54 × 1036.10 × 1022.40 × 1029.64 × 1018.14 × 103.18 × 1012.49 × 1011.17 × 1013.80 × 1014.63 × 103
Terrestrial ecotoxicitykg 1.4-DB eq3.40 × 10−34.42 × 10−83.52 × 10−42.90 × 10−51.69 × 10−54.42 × 10−53.29 × 10−51.43 × 10−56.56 × 10−54.00 × 10⁻³
Photochemical oxidationkg C2H4 eq1.37 × 10−59.20 × 10−63.81 × 10−53.58 × 10−61.11 × 10−63.25 × 10−61.05 × 10−51.45 × 10−51.04 × 10−51.10 × 10⁻⁴
Acidificationkg SO2 eq4.90 × 10−48.41 × 10−59.37 × 10−49.18 × 10−52.56 × 10−56.02 × 10−52.25 × 10−43.64 × 10−42.18 × 10−42.63 × 10⁻³
Eutrophicationkg PO4 eq4.93 × 10−32.28 × 10−53.64 × 10−41.36 × 10−41.59 × 10−53.15 × 10−53.67 × 10−51.29 × 10−58.75 × 10−55.68 × 10⁻³
Table 7. Detailed study of the environmental impact of diode AZ23C10 (impacts for 1 g of diode).
Impact CategoryUnitGoldAuxiliaries and Energy UseElectricity ConsumptionSilverNitrogenElectronic Component FactoryHeatNickelOthersTotal
Abiotic depletionkg Sb eq1.11 × 10−40.00 × 107.22 × 10−87.15 × 10−61.48 × 10−82.57 × 10−72.56 × 10−91.10 × 10−73.93 × 10−71.19 × 10⁻⁴
Abiotic depletion (fossil fuels)MJ4.03 × 10−10.00 × 102.01 × 105.98 × 10−23.45 × 10−16.80 × 10−22.67 × 10−11.39 × 10−26.63 × 10−13.83 × 10
Global warming (GWP100a)kg CO2 eq3.21 × 10−20.00 × 101.83 × 10−15.05 × 10−33.11 × 10−27.21 × 10−33.14 × 10−21.34 × 10−34.18 × 10−23.33 × 10⁻¹
Ozone layer depletion (ODP)kg CFC-11 eq3.76 × 10−90.00 × 108.92 × 10−98.33 × 10−11.56 × 10−99.00 × 10−16.17 × 10−11.03 × 10−15.11 × 10−92.18 × 10⁻⁸
Human toxicitykg 1.4-DB eq1.13 × 104.28 × 10−25.33 × 10−22.39 × 10−29.22 × 10−32.35 × 10−27.92 × 10−37.08 × 10−31.23 × 10−21.31 × 10
Freshwater aquatic ecotox.kg 1.4-DB eq7.92 × 10−17.01 × 10−55.89 × 10−21.69 × 10−21.01 × 10−21.01 × 10−24.87 × 10−35.95 × 10−31.31 × 10−29.12 × 10⁻¹
Marine aquatic ecotoxicitykg 1.4-DB eq2.24 × 1036.10 × 1022.40 × 1025.12 × 1014.08 × 1013.18 × 1012.49 × 1011.18 × 1014.95 × 1013.30 × 103
Terrestrial ecotoxicitykg 1.4-DB eq2.16 × 10−34.42 × 10−83.52 × 10−41.54 × 10−56.03 × 10−54.42 × 10−53.29 × 10−51.44 × 10−56.08 × 10−52.74 × 10⁻³
Photochemical oxidationkg C2H4 eq8.66 × 10−69.20 × 10−63.81 × 10−51.90 × 10−66.51 × 10−63.25 × 10−61.05 × 10−51.46 × 10−51.03 × 10−51.03 × 10⁻⁴
Acidificationkg SO2 eq3.11 × 10−48.41 × 10−59.37 × 10−44.88 × 10−51.60 × 10−46.02 × 10−52.25 × 10−43.67 × 10−42.27 × 10−42.42 × 10⁻³
Eutrophicationkg PO4 eq3.13 × 10−32.28 × 10−53.64 × 10−47.23 × 10−56.19 × 10−53.15 × 10−53.67 × 10−51.30 × 10−58.78 × 10−53.82 × 10⁻³
Table 8. Detailed study of the environmental impact of diode PLVA650A (impacts for 1 g of diode).
Impact CategoryUnitGoldAuxiliaries and Energy UseElectricity ConsumptionSilverNitrogenElectronic Component FactoryHeatNickelOthersTotal
Abiotic depletionkg Sb eq6.35 × 10−50.00 × 107.22 × 10−84.95 × 10−61.48 × 10−82.57 × 10−72.56 × 10−91.11 × 10−77.92 × 10−76.97 × 10⁻⁵
Abiotic depletion (fossil fuels)MJ2.31 × 10−10.00 × 102.01 × 104.15 × 10−23.45 × 10−16.80 × 10−22.67 × 10−11.40 × 10−26.34 × 10−13.61 × 10
Global warming (GWP100a)kg CO2 eq1.84 × 10−20.00 × 101.83 × 10−13.50 × 10−33.11 × 10−27.21 × 10−33.14 × 10−21.35 × 10−33.80 × 10−23.14 × 10⁻¹
Ozone layer depletion (ODP)kg CFC-11 eq2.15 × 10−90.00 × 108.92 × 10−95.77 × 10−11.56 × 10−99.00 × 10−16.17 × 10−11.03 × 10−14.77 × 10−91.96 × 10⁻⁸
Human toxicitykg 1.4-DB eq6.44 × 10−14.28 × 10−25.33 × 10−21.65 × 10−29.22 × 10−32.35 × 10−27.92 × 10−37.12 × 10−32.16 × 10−28.26 × 10⁻¹
Freshwater aquatic ecotox.kg 1.4-DB eq4.54 × 10−17.01 × 10−55.89 × 10−21.17 × 10−21.01 × 10−21.01 × 10−24.87 × 10−35.99 × 10−31.33 × 10−25.69 × 10⁻¹
Marine aquatic ecotoxicitykg 1.4-DB eq1.28 × 1036.10 × 1022.40 × 1023.55 × 1014.08 × 1013.18 × 1012.49 × 1011.19 × 1014.51 × 1012.32 × 103
Terrestrial ecotoxicitykg 1.4-DB eq1.23 × 10−34.42 × 10−83.52 × 10−41.07 × 10−56.03 × 10−54.42 × 10−53.29 × 10−51.45 × 10−57.54 × 10−51.82 × 10⁻³
Photochemical oxidationkg C2H4 eq4.96 × 10−69.20 × 10−63.81 × 10−51.32 × 10−66.51 × 10−63.25 × 10−61.05 × 10−51.47 × 10−51.11 × 10−59.96 × 10⁻⁵
Acidificationkg SO2 eq1.78 × 10−48.41 × 10−59.37 × 10−43.38 × 10−51.60 × 10−46.02 × 10−52.25 × 10−43.69 × 10−42.23 × 10−42.27 × 10⁻³
Eutrophicationkg PO4 eq1.79 × 10−32.28 × 10−53.64 × 10−45.01 × 10−56.19 × 10−53.15 × 10−53.67 × 10−51.31 × 10−58.99 × 10−52.46 × 10⁻³
Table 9. Detailed study of the environmental impact of diode BZX84B10LT1G (impacts for 1 g of diode).
Impact CategoryUnitGoldAuxiliaries and Energy UseElectricity ConsumptionSilverNitrogenElectronic Component FactoryHeatNickelOthersTotal
Abiotic depletionkg Sb eq0.00 × 100.00 × 107.22 × 10−80.00 × 101.48 × 10−82.57 × 10−72.56 × 10−91.24 × 10−75.19 × 10−79.90 × 10⁻⁷
Abiotic depletion (fossil fuels)MJ0.00 × 100.00 × 102.01 × 100.00 × 103.45 × 10−16.80 × 10−22.67 × 10−11.57 × 10−26.14 × 10−13.32 × 10
Global warming (GWP100a)kg CO2 eq0.00 × 100.00 × 101.83 × 10−10.00 × 103.11 × 10−27.21 × 10−33.14 × 10−21.51 × 10−33.78 × 10−22.92 × 10⁻¹
Ozone layer depletion (ODP)kg CFC-11 eq0.00 × 100.00 × 108.92 × 10−90.00 × 101.56 × 10−99.00 × 10−16.17 × 10−11.16 × 10−14.49 × 10−91.66 × 10⁻⁸
Human toxicitykg 1.4-DB eq0.00 × 104.28 × 10−25.33 × 10−20.00 × 109.22 × 10−32.35 × 10−27.92 × 10−37.99 × 10−31.53 × 10−21.60 × 10⁻¹
Freshwater aquatic ecotox.kg 1.4-DB eq0.00 × 107.01 × 10−55.89 × 10−20.00 × 101.01 × 10−21.01 × 10−24.87 × 10−36.72 × 10−31.12 × 10−21.02 × 10⁻¹
Marine aquatic ecotoxicitykg 1.4-DB eq0.00 × 106.10 × 1022.40 × 1020.00 × 104.08 × 1013.18 × 1012.49 × 1011.33 × 1013.42 × 1019.95 × 102
Terrestrial ecotoxicitykg 1.4-DB eq0.00 × 104.42 × 10−83.52 × 10−40.00 × 106.03 × 10−54.42 × 10−53.29 × 10−51.62 × 10−56.24 × 10−55.68 × 10⁻⁴
Photochemical oxidationkg C2H4 eq0.00 × 109.20 × 10−63.81 × 10−50.00 × 106.51 × 10−63.25 × 10−61.05 × 10−51.65 × 10−59.84 × 10−69.39 × 10⁻⁵
Acidificationkg SO2 eq0.00 × 108.41 × 10−59.37 × 10−40.00 × 101.60 × 10−46.02 × 10−52.25 × 10−44.14 × 10−42.00 × 10−42.08 × 10⁻³
Eutrophicationkg PO4 eq0.00 × 102.28 × 10−53.64 × 10−40.00 × 106.19 × 10−53.15 × 10−53.67 × 10−51.47 × 10−58.04 × 10−56.12 × 10⁻⁴
Publisher’s Note: MDPI stays neutral with regard to jurisdictional claims in published maps and institutional affiliations.

