
Evaluate the Cooling Performance of Transmit/Receive Module Cooling System in Active Electronically Scanned Array Radar


Abstract
:1. Introduction
2. Materials and Methods
2.1. Research Subject and Model
2.2. Methods
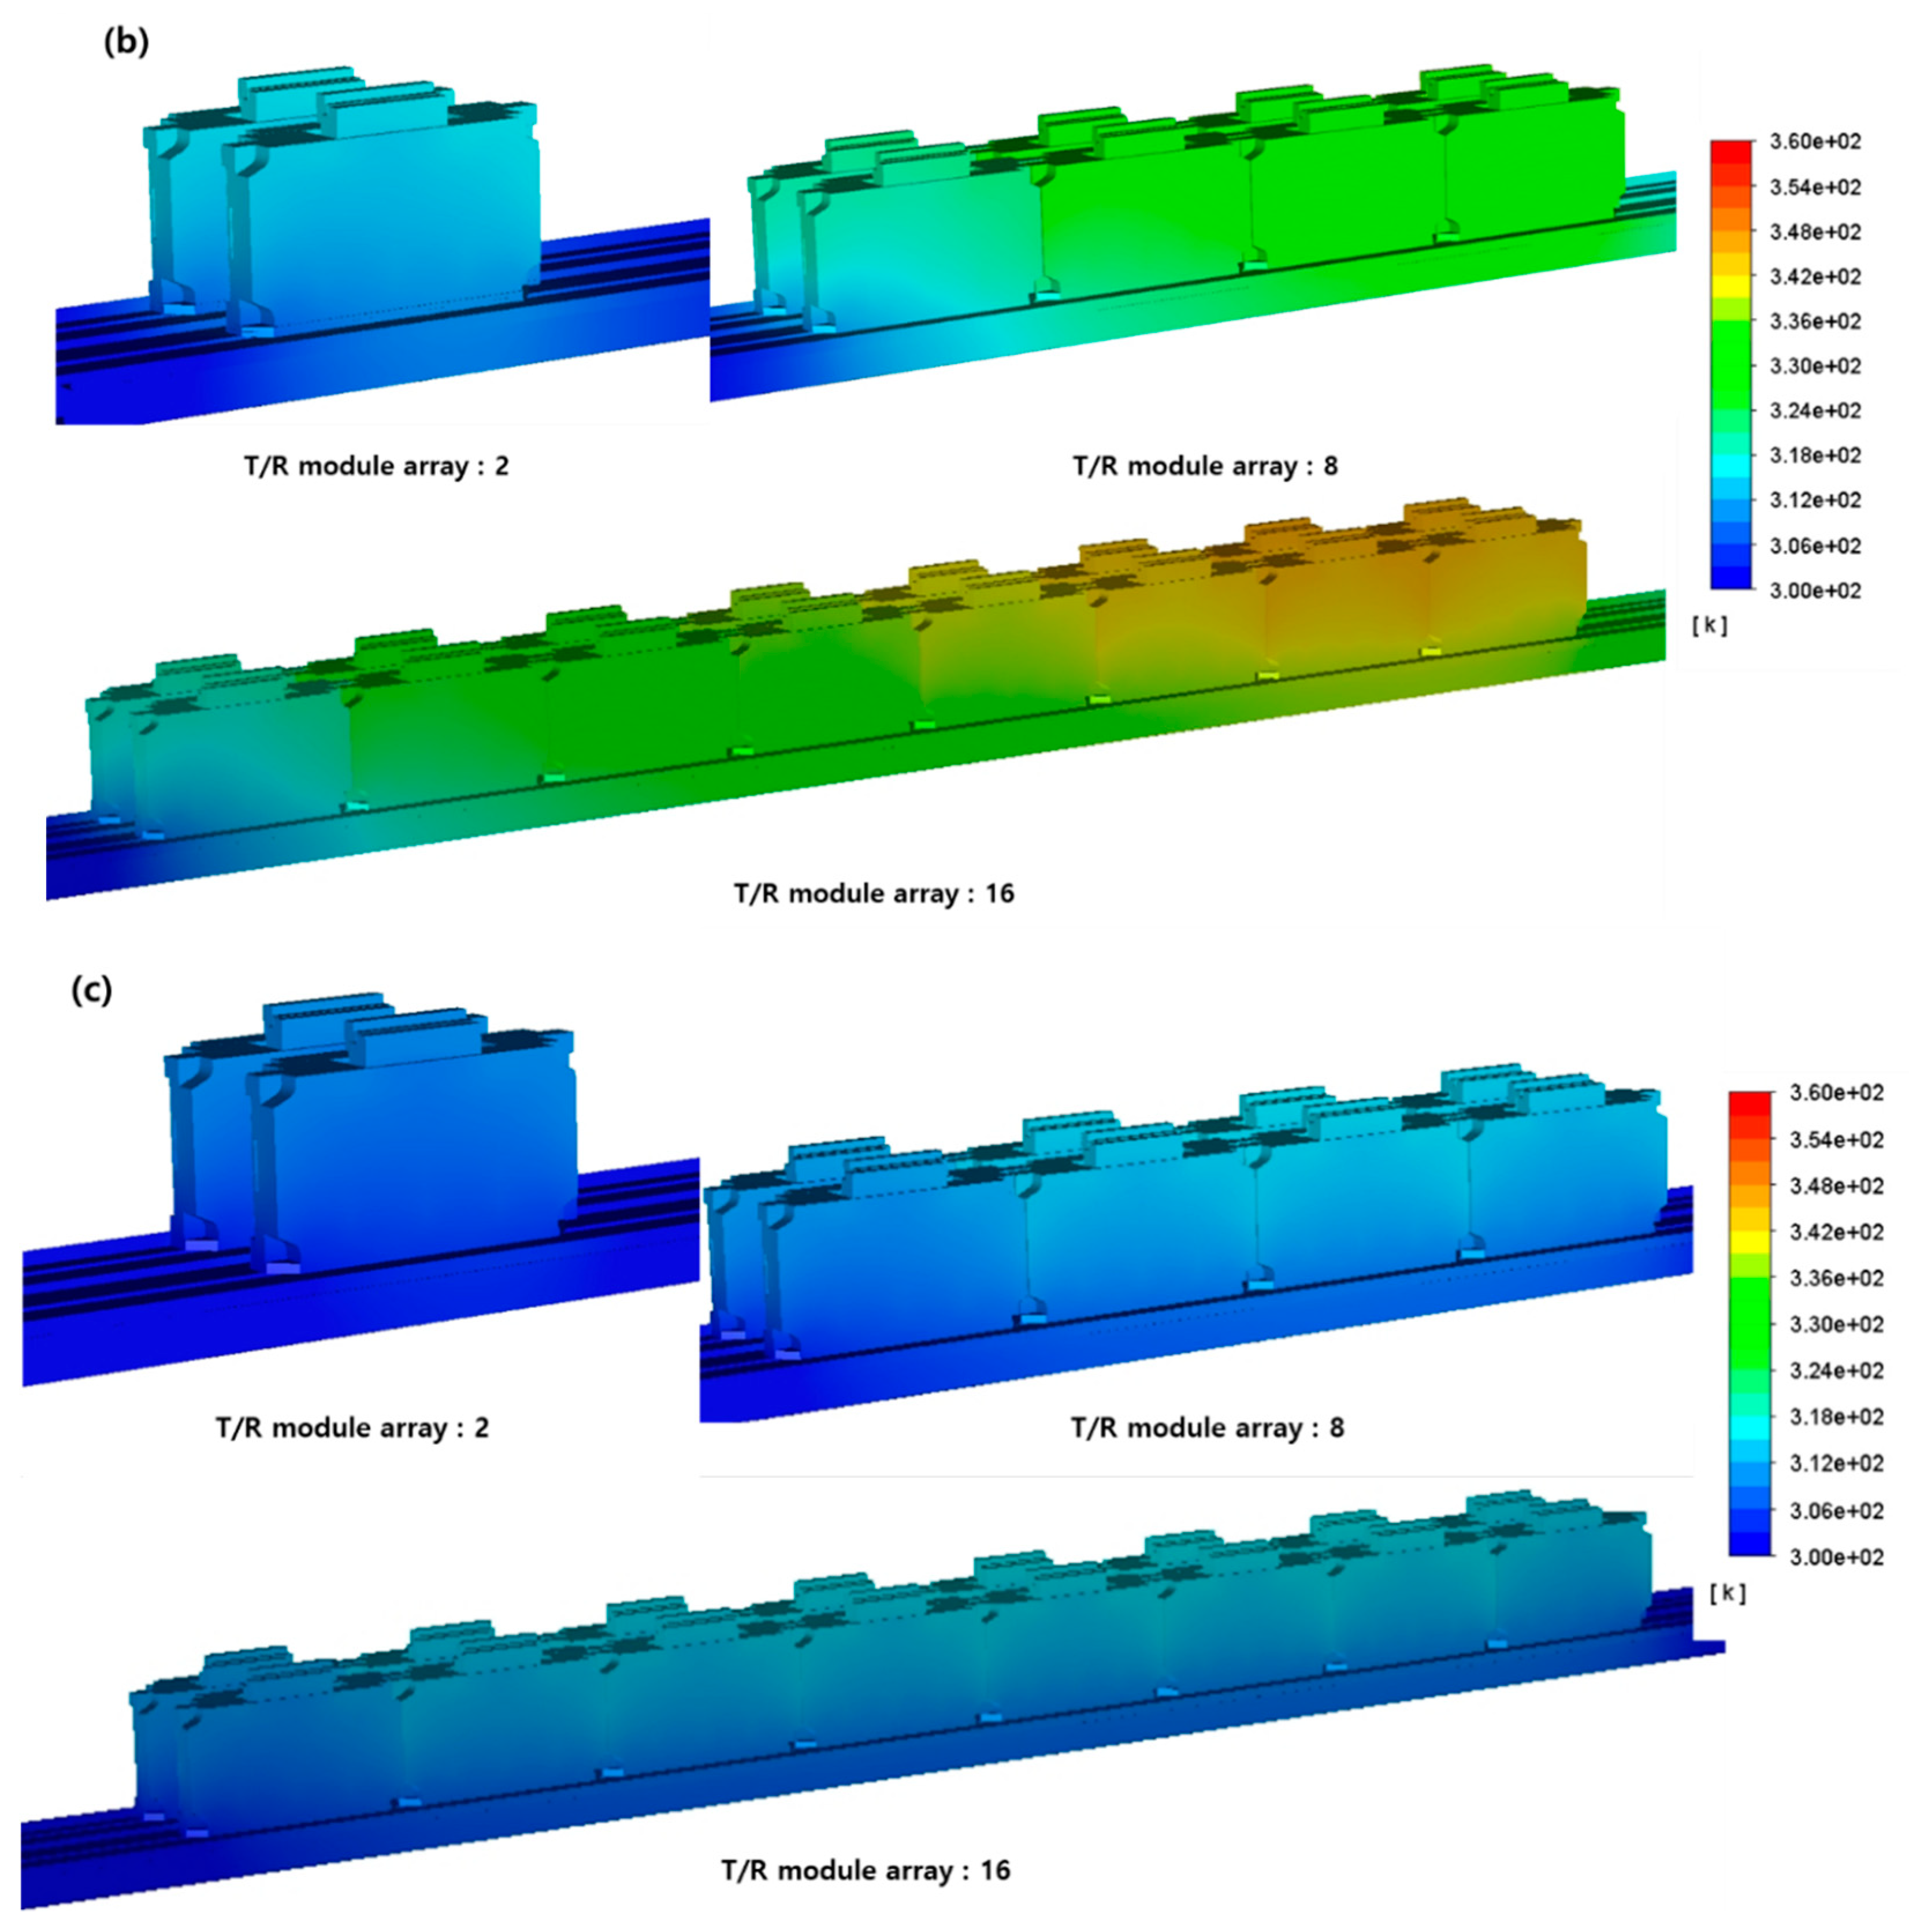
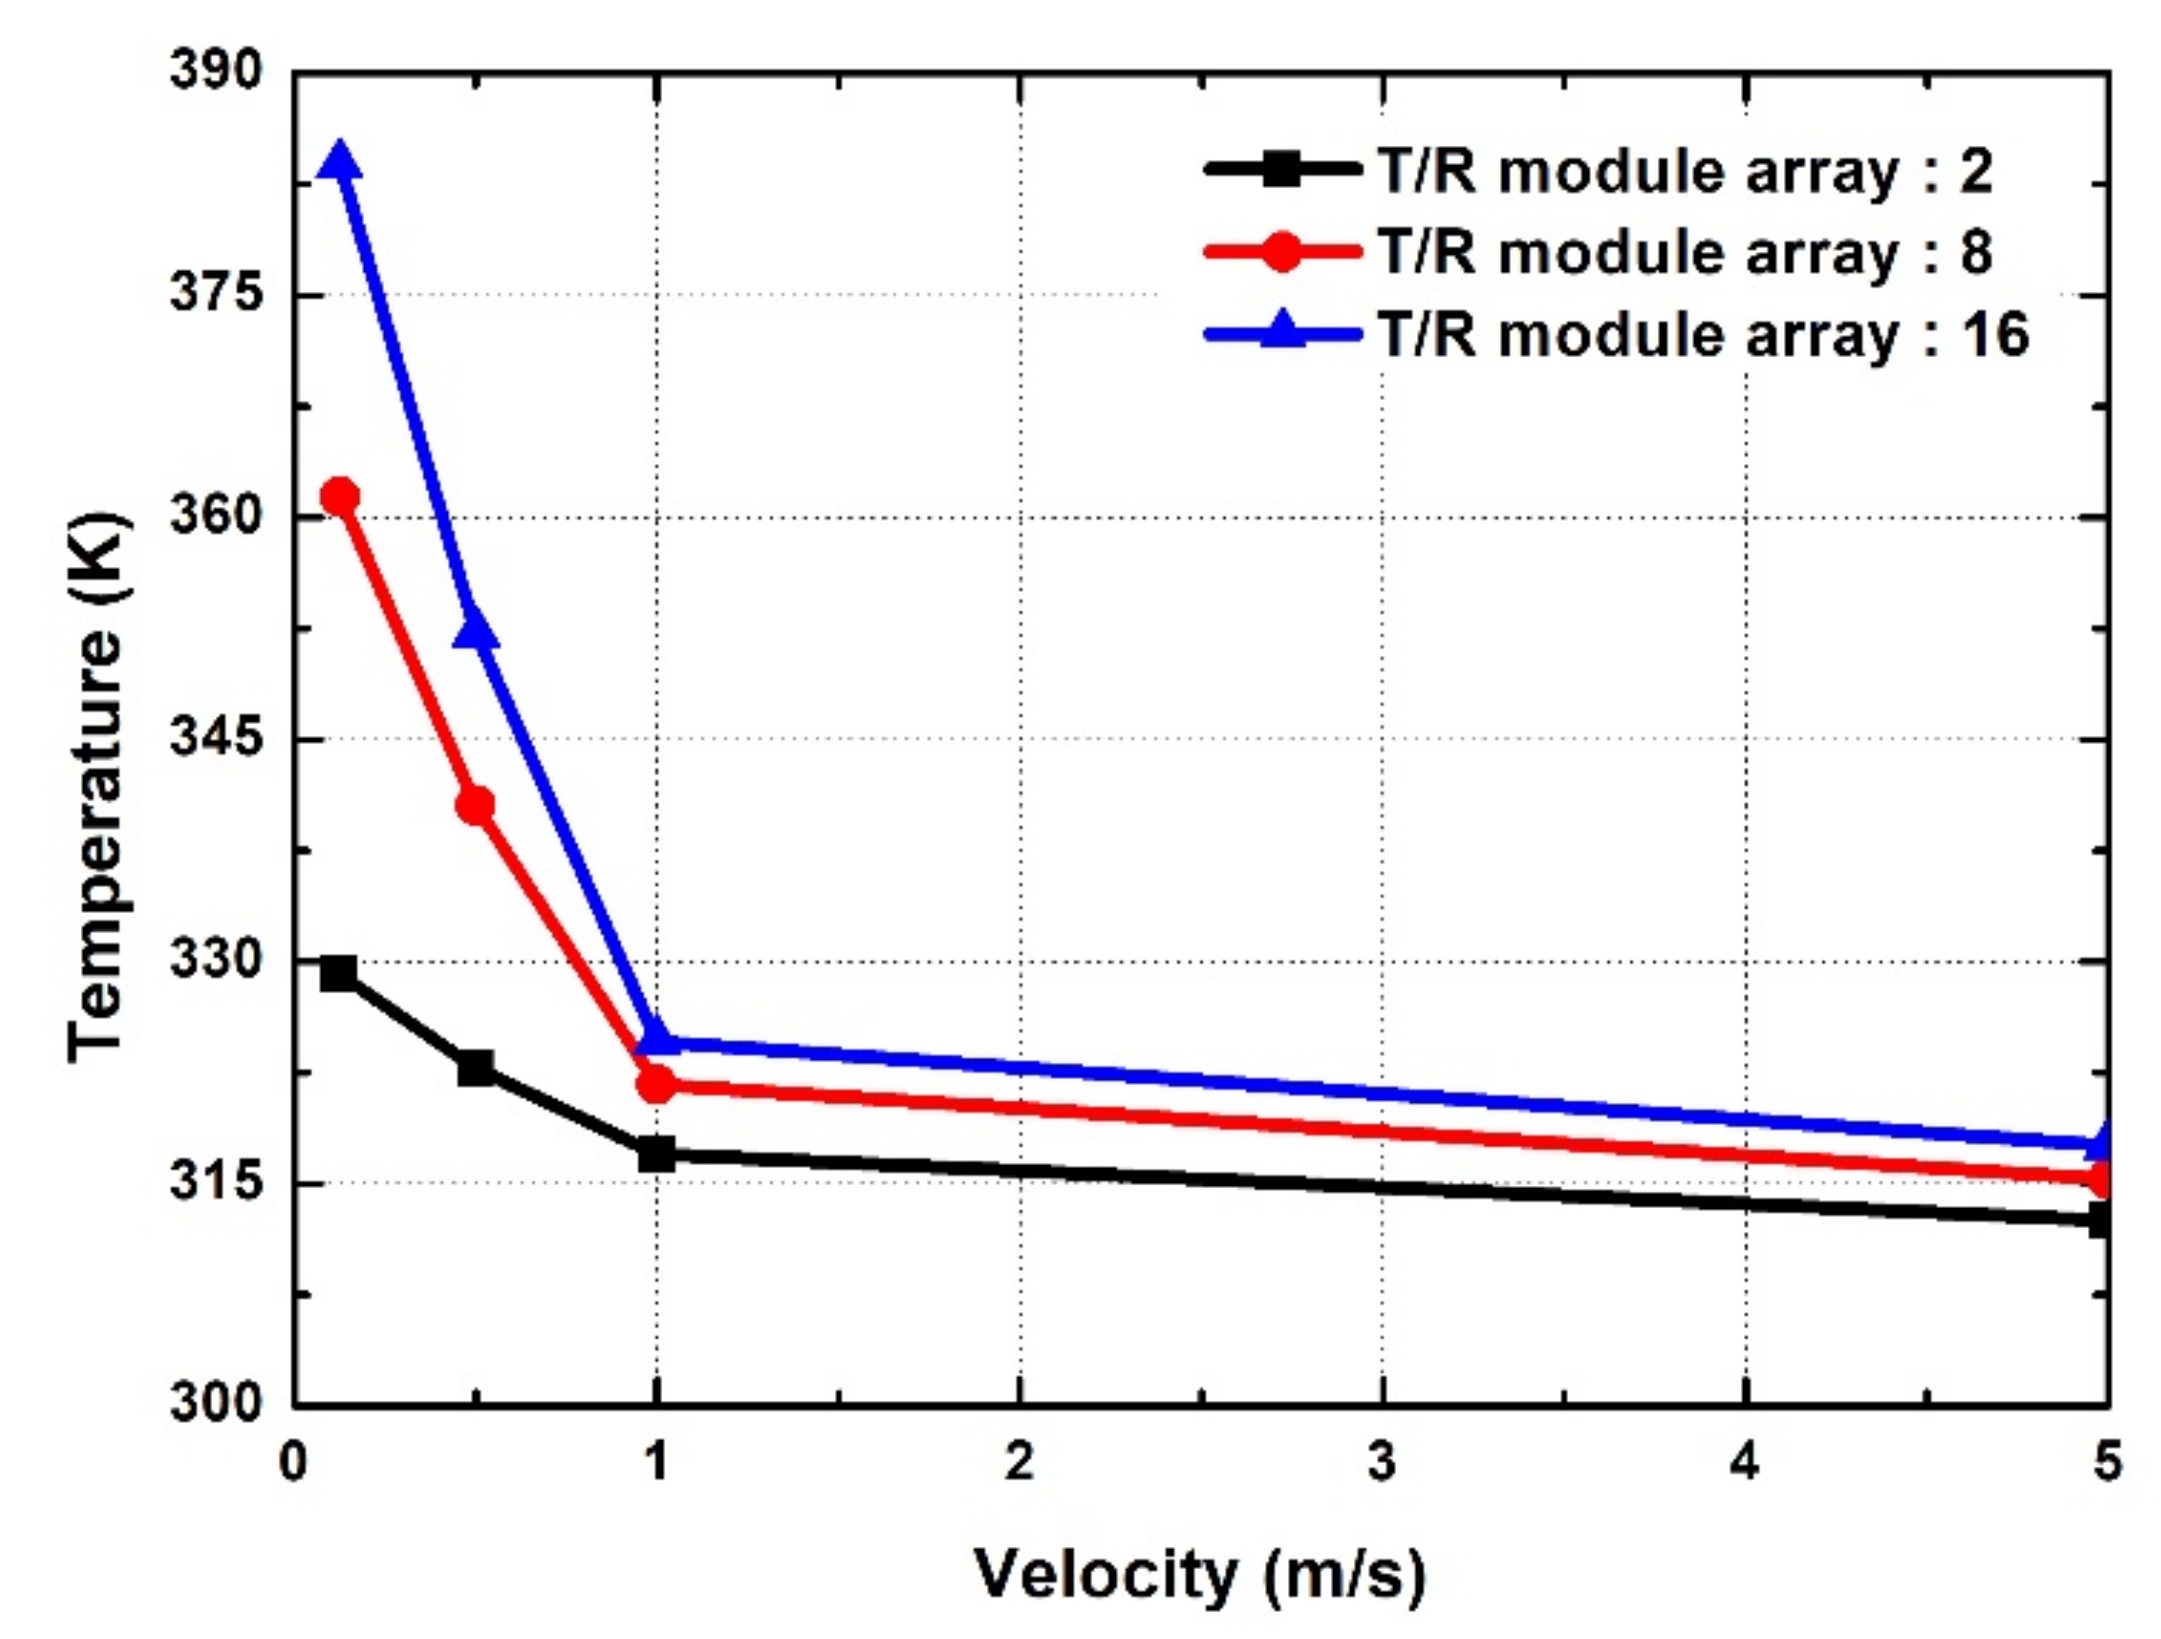
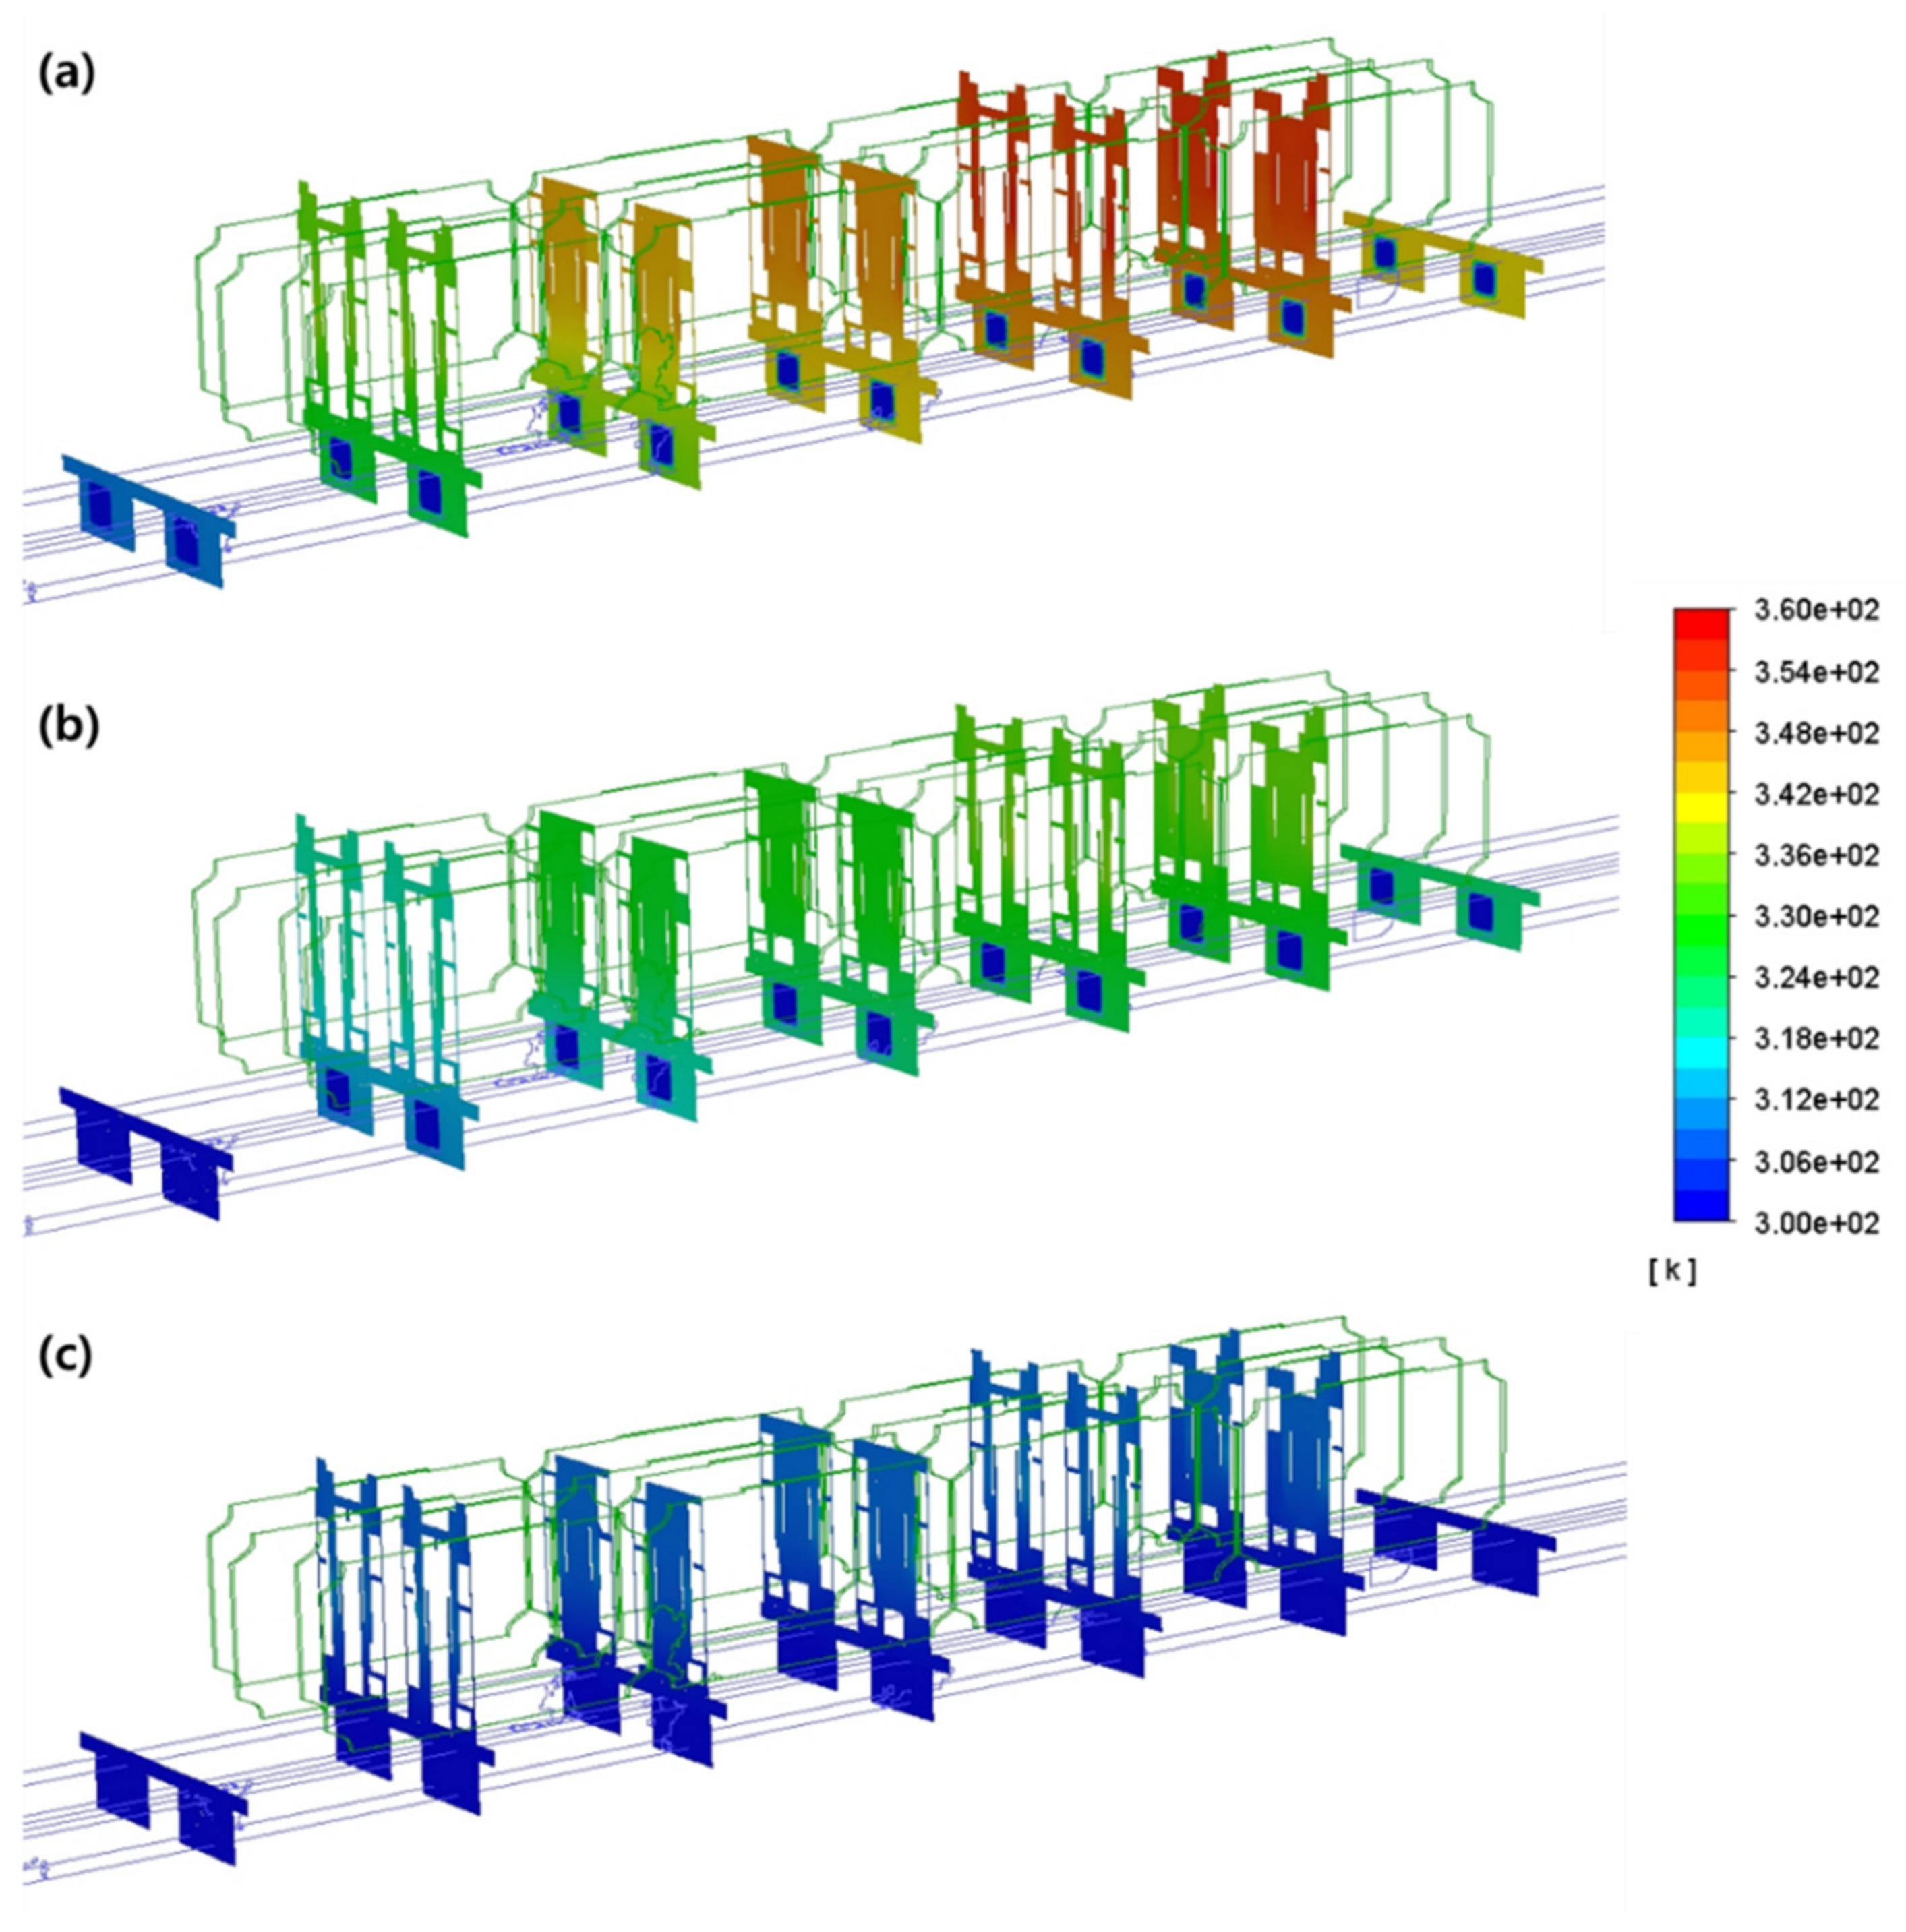
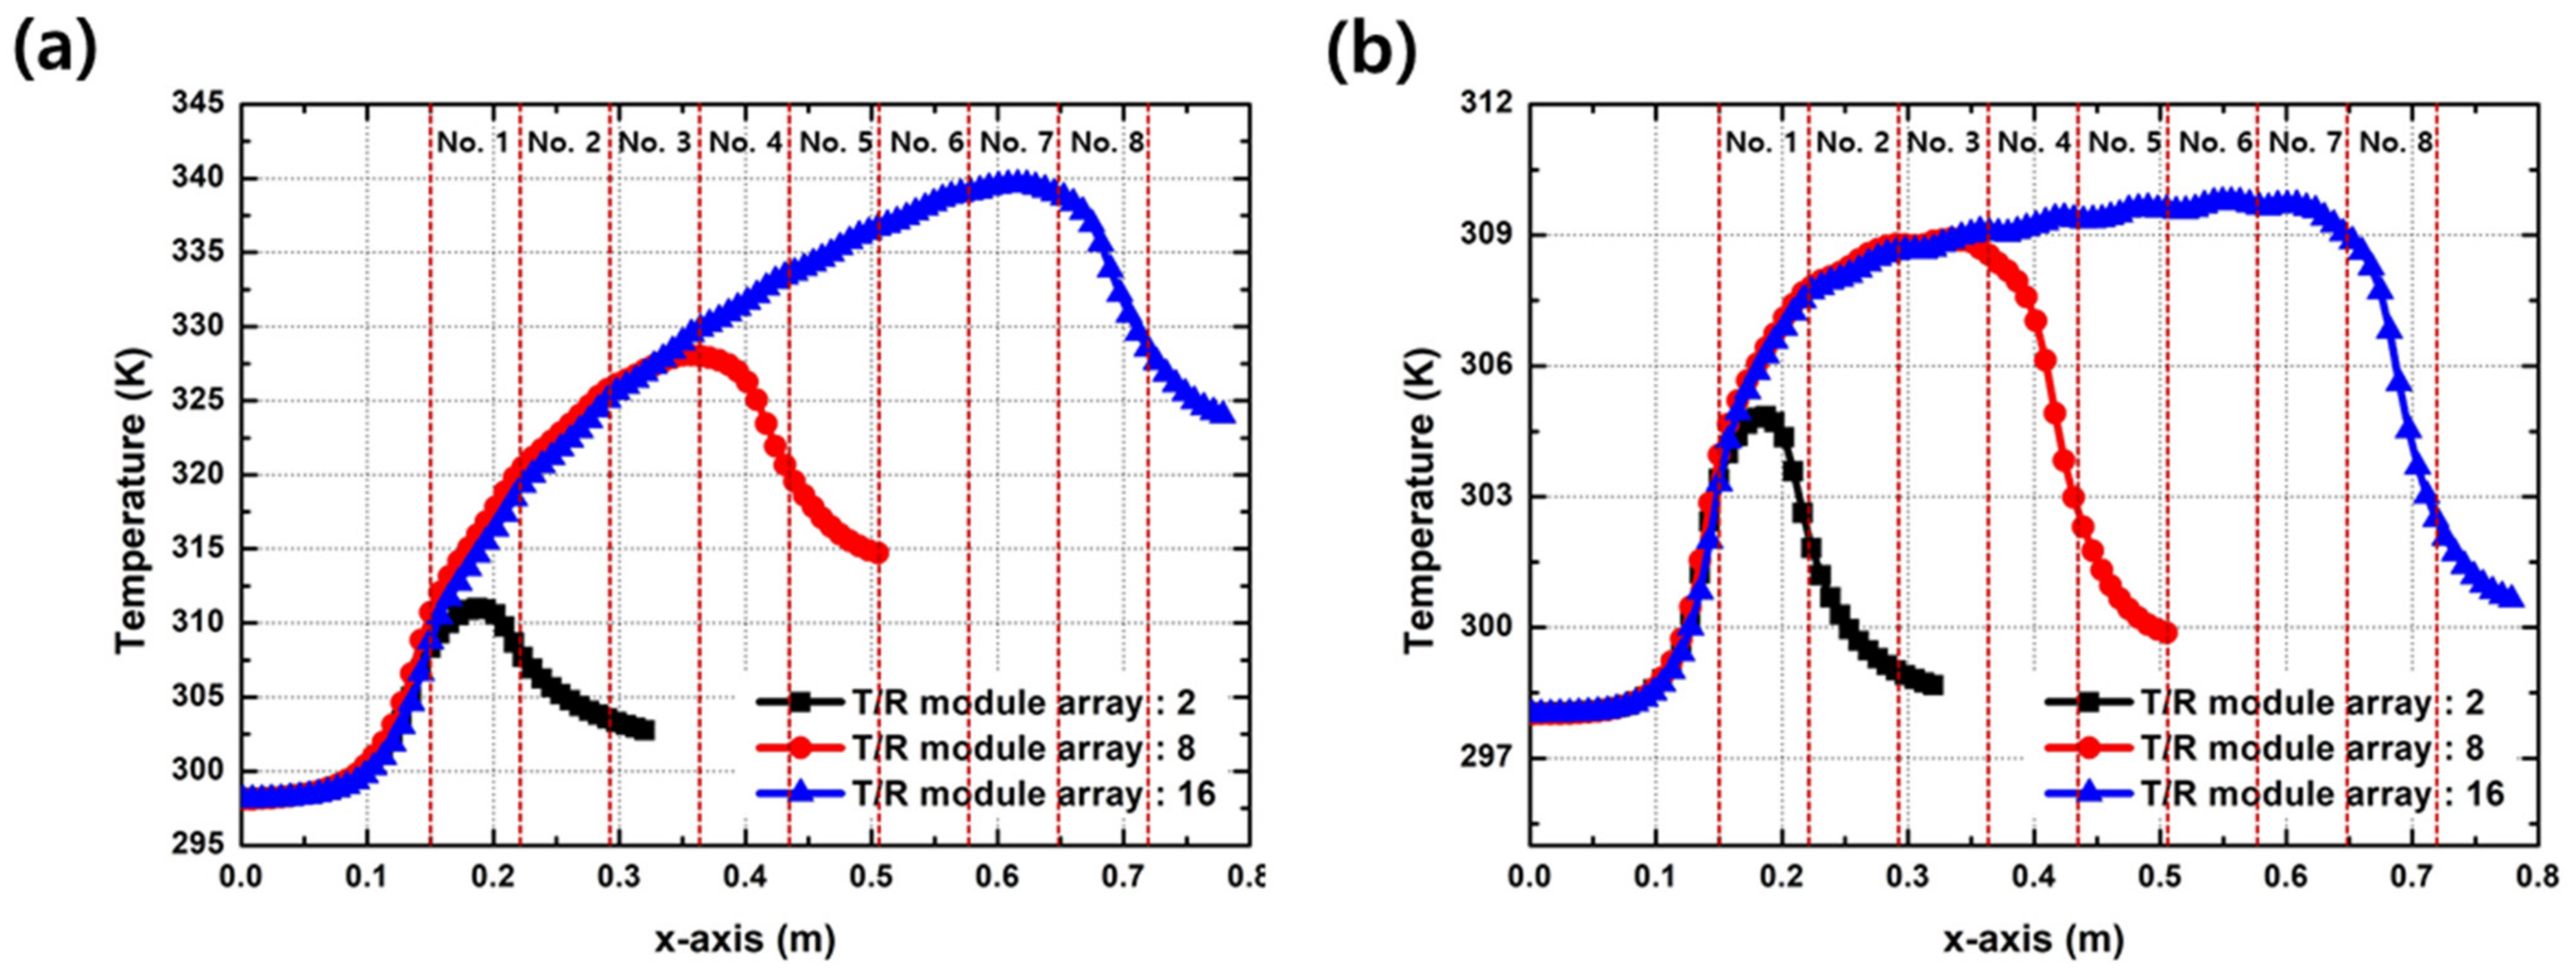
3. Results
4. Conclusions
Author Contributions
Funding
Conflicts of Interest
Abbreviations
| AESA | Active electronically scanned array |
| CIWS | Close-in weapon system |
| DRA | Digital radar array |
| HPA | High-power amplifier |
| LNA | Low-noise amplifier |
| PCB | Printed circuit board |
| T/R | Transmit/receive |
Nomenclature
| g | Gravitational acceleration (m/s2) |
| L | T/R device length (m) |
| Nu | Nusselt number |
| Pr | Prandtl number |
| Rate of heat (W) | |
| Heat flux (W/m2) | |
| Ra | Rayleigh number |
| Re | Reynolds number |
| Ts | Surface temperature of T/R device (°C) |
| T∞ | Ambient temperature (°C) |
| V | Coolant flow rate (kg/s) |
| x | x-direction |
| y | y-direction |
| z | z-direction |
| β | Air thermal expansion coefficient (1/deg) |
| v | Kinematic viscosity coefficient (m2/s) |
References
- Kim, D.Y.; Chong, M.K.; Kim, S.K.; Chon, S.M.; Na, H.G.; Baik, S.H.; Ahn, C.S.; Kim, S.J. T/R Module Development for X-Band Active Phased-Array Radar. J. Korean Inst. Electromagn. Eng. Sci. 2009, 20, 1243–1251. [Google Scholar] [CrossRef]
- Moore, D.S. Review of the state of the art of UK AESA technology and the future challenges faced. In Proceedings of the IEEE Radar Conference, Rome, Italy, 26–30 May 2008; pp. 1–6. [Google Scholar] [CrossRef]
- Milin, J.; Moore, S.; Bürger, W.; Triboulloy, P.; Royden, M.; Gerster, J. AMSAR—A European success story in AESA radar. In Proceedings of the International Radar Conference “Surveillance for a Safer World” (RADAR 2009), Bordeaux, France, 12–16 October 2009; pp. 1–6. [Google Scholar]
- Wang, Y.; Wang, C.; Lian, P.; Xue, S.; Liu, J.; Gao, W.; Shi, Y.; Wang, Z.; Yu, K.; Peng, X.; et al. Effect of Temperature on Electromagnetic Performance of Active Phased Array Antenna. Electronics 2020, 9, 1211. [Google Scholar] [CrossRef]
- Brookner, E. Active electronically scanned array (AESA) system noise temperature. In Proceedings of the 2013 IEEE International Symposium on Phased Array Systems and Technology, Waltham, MA, USA, 15–18 October 2013; pp. 760–767. [Google Scholar]
- Rummel, K.A.; Schaefer, G.; Chen, K.W.; Allen, B.H.; Weissman, D.J. Remote Cooling of a Phased Array Antenna. U.S. Patent Application No. 11,865,475, 4 February 2009. [Google Scholar]
- Brookner, E.; Howell, J.M. Right way to calculate reflector and active-phased-array antenna system noise temperature taking into account antenna mismatch. In Proceedings of the IEEE International Symposium on Phased Array Systems and Technology, Boston, MA, USA, 14–17 October 2003; pp. 130–135. [Google Scholar]
- Przemysław, S.; Sławomir, P. A review of the capabilities of high heat flux removal by porous materials, microchannels and spray cooling techniques. Appl. Therm. Eng. 2016, 104, 636–646. [Google Scholar]
- Agrawa, A.K.; Kopp, B.A.; Luesse, M.H.; O’Haver, K.W. Active Phased Array Antenna Development for Modern Shipboard Radar System. Johns Hopkins APL Tech. Dig. 2001, 22, 600–613. [Google Scholar]
- Josefsson, L.; Erhage, L.; Emanuelson, T. An AESA development model for next generation fighter aircraft radar. In Proceedings of the International Symposium on Phased Array Systems and Technology, Boston, MA, USA, 15–18 October 1996; pp. 454–457. [Google Scholar] [CrossRef]
- Bergman, T.L.; Incropera, F.P.; DeWitt, D.P.; Lavine, A.S. Fundamentals of Heat and Mass Transfer; John Wiley & Sons: New York, NY, USA, 2002. [Google Scholar]


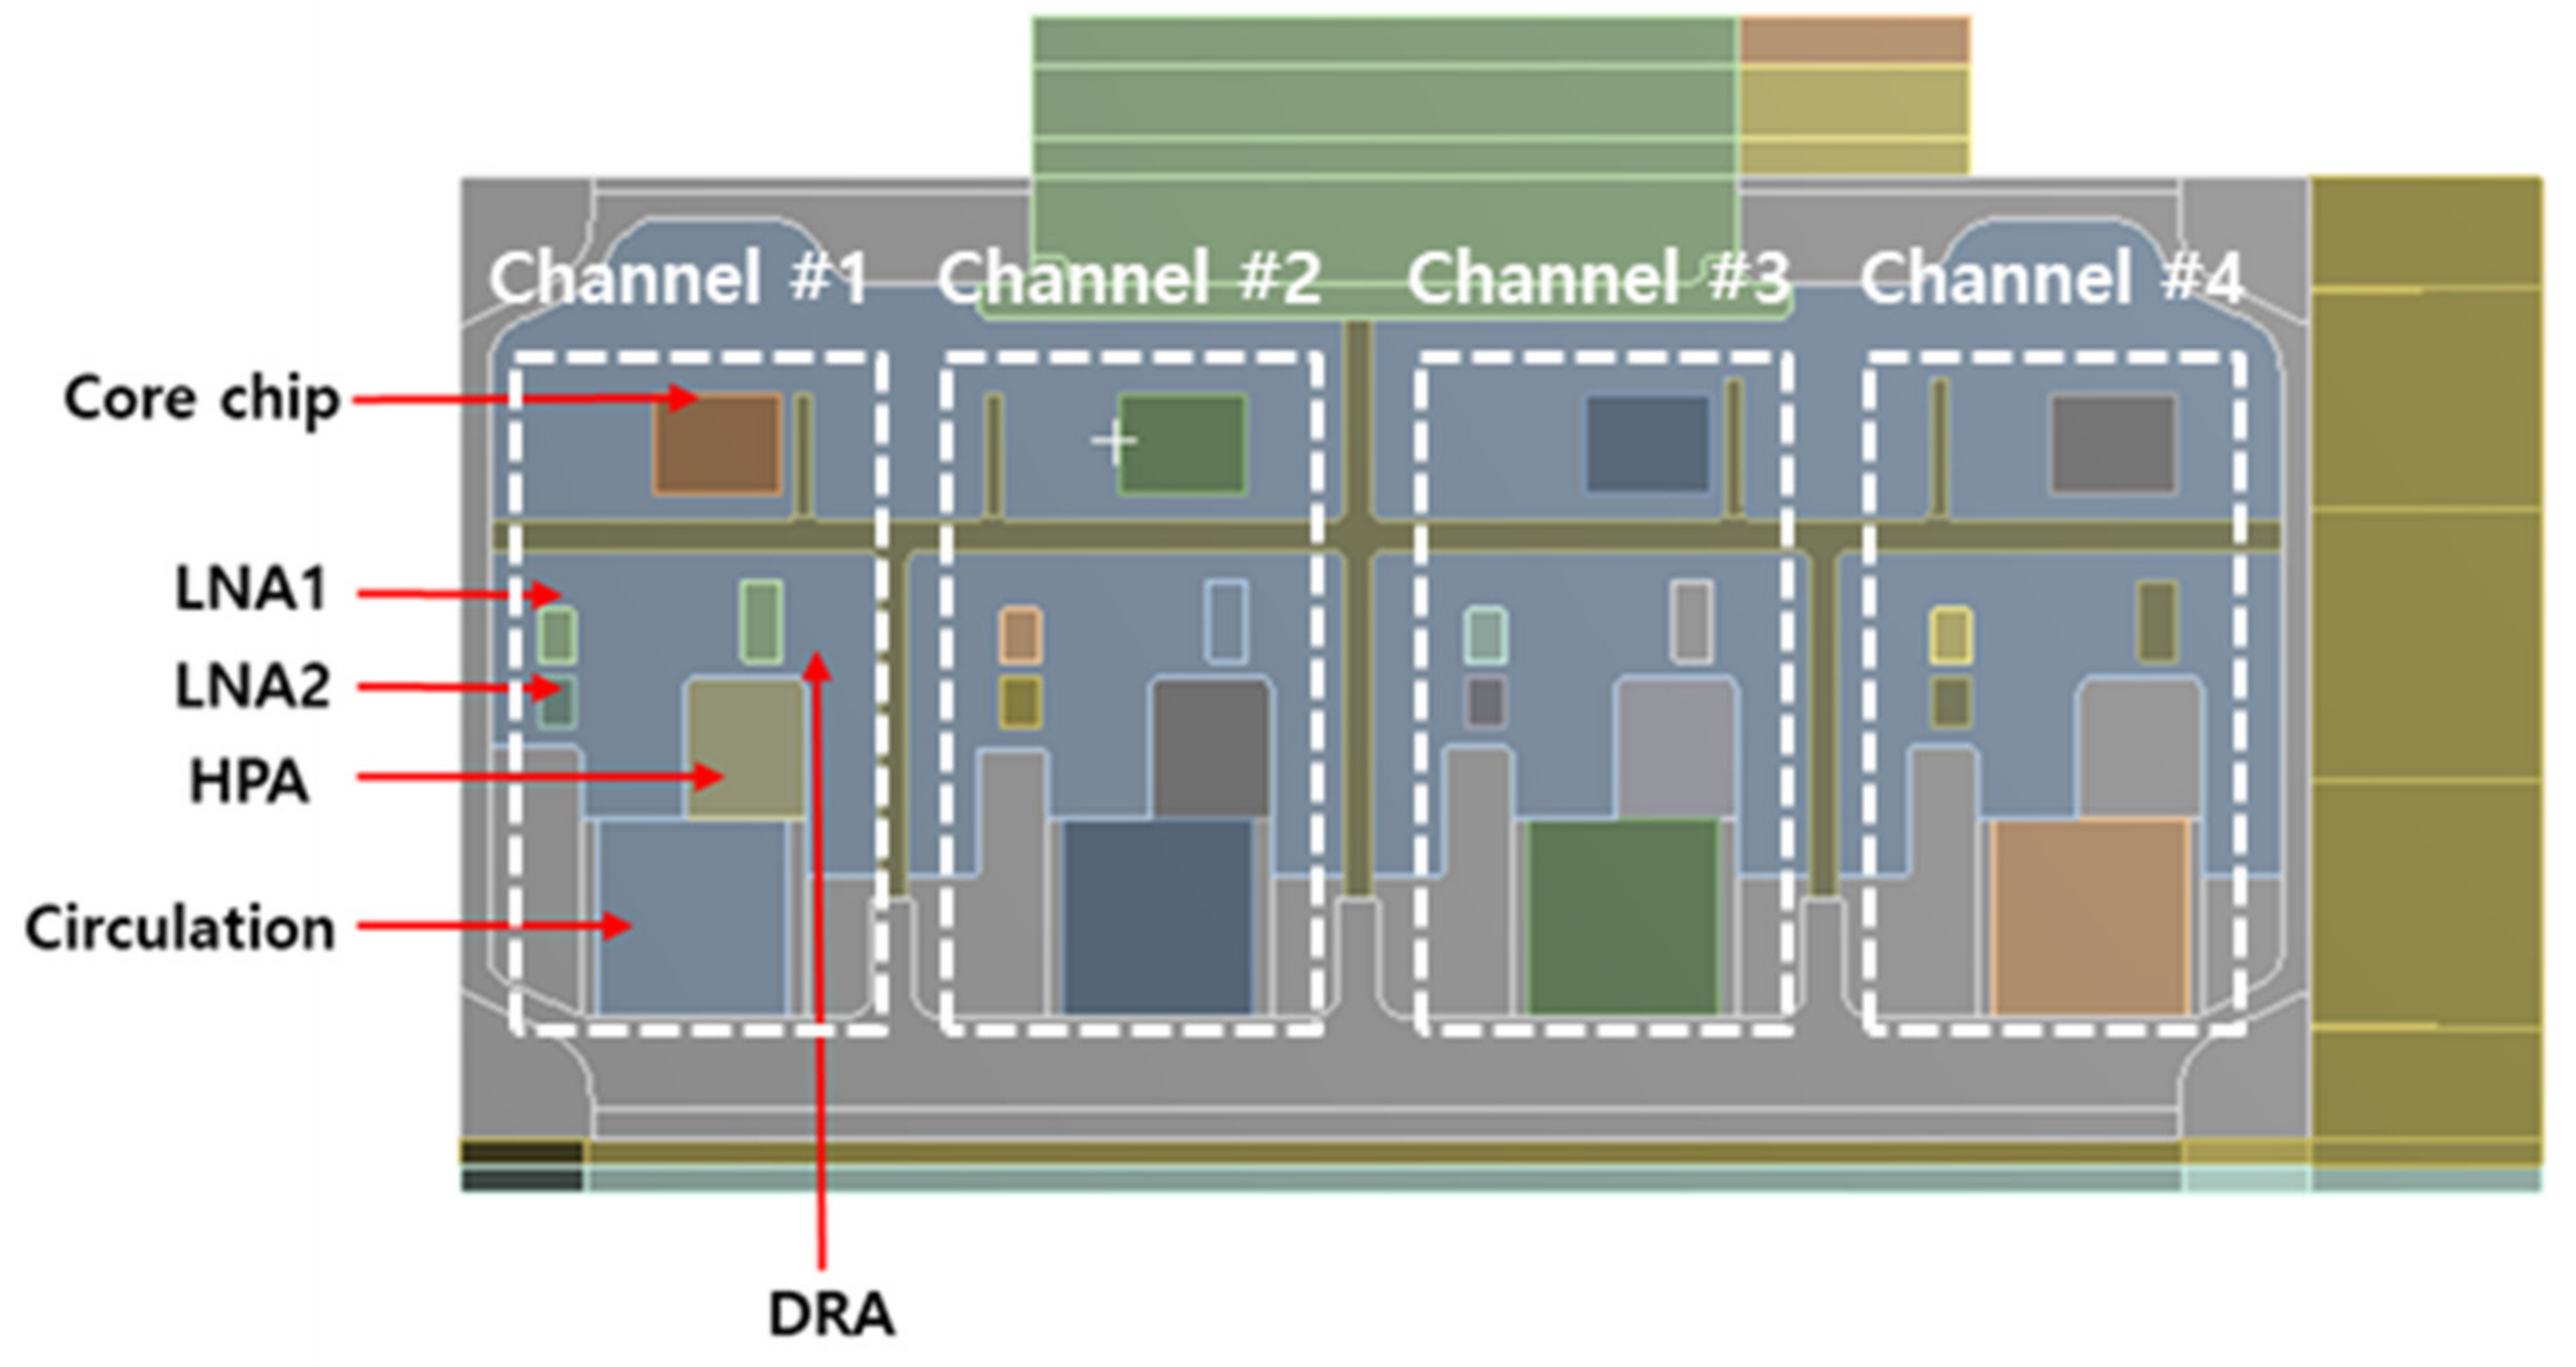
| Device Name | Size (mm) | Device Contact Surface | ||
|---|---|---|---|---|
| Circulator | 0.47 | 7.0 × 7.0 | 9592 | Housing |
| Core chip | 0.42 | 3.6 × 4.7 | 24,823 | Housing |
| DRA (Digital radar array) | 0.33 | 2.9 × 1.4 | 81,281 | PCB (Printed circuit board) |
| HPA (High-power amplifier) | 6.58 | 5.0 × 2.8 | 470,000 | CuW |
| LNA 1 (Low-noise amplifier) | 0.22 | 1.9 × 1.3 | 89,069 | Housing |
| LNA 2 (Low-noise amplifier) | 0.22 | 1.9 × 1.3 | 89,069 | PCB |
| Component | Material | Density (kg/m3) | Specific Heat (J/(kg∙K)) | Conductivity (W/(m∙K)) | Viscosity (kg/(m∙s)) |
|---|---|---|---|---|---|
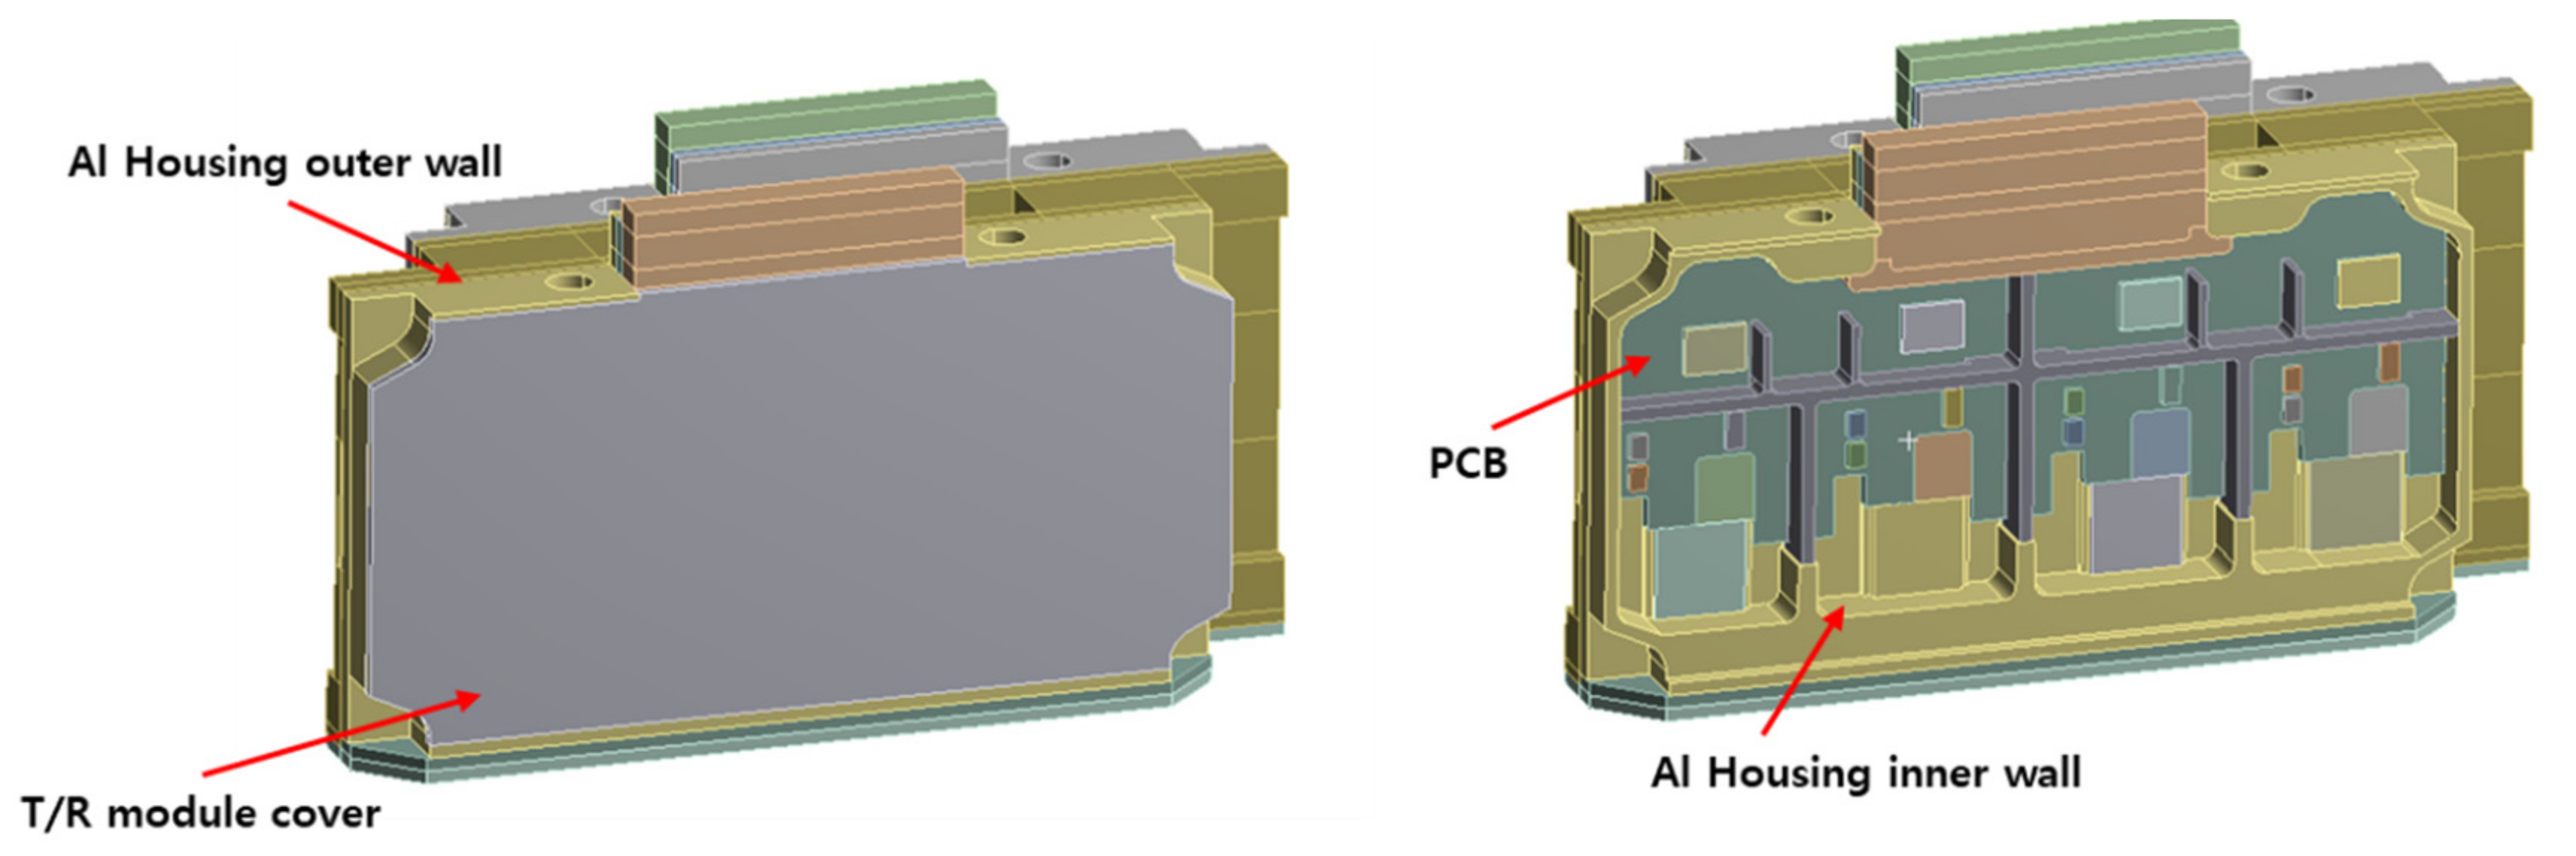
| Housing | Aluminum | 2700 | 896 | 167 | |
| PCB | FR4 | 1900 | 600 | 0.2 | |
| Electronic device | SIC | 3210 | 750 | 120 | |
| Coolant | EGW55 at 25 °C | 1070 | 3204 | 0.4016 | 0.003 85 |
| (Pr = 29.85) | EGW55 at 30 °C | 1067 | 3235 | 0.4012 | 0.003 31 |
| Inlet Flow (m/s) | Mass Flow Rate (kg/s) | Reynolds No. (Re) | Nu-Verified Results | |
|---|---|---|---|---|
| Calculation | Reference [11] | |||
| 0.125 | 0.008 56 | 277.92 | 4.78 | 3.61 ( |
| 0.5 | 0.034 24 | 1111.69 | 6.63 | 3.61 ( |
| 1 | 0.068 48 | 2223.38 | 44.63 | Transient |
| 5 | 0.3424 | 11,116.88 | 152.26 | 154.34 ( |
| Ambient Temperature (T∞) | 28 ℃ | Prandtl Number (Pr) | 0.73 |
| Surface Temperature (Ts) | 70 ℃ | Coefficient of Kinematic Viscosity (υ) | 0.000 017 5 (m2/s) |
| Thermal Expansion Coefficient (β) | 0.003 671/deg | L (mm) | 1.9–7.0 |
| Rayleigh Number (Ra) | 32.58 (L = 1.9 mm) to 1629.17 (L = 7.0 mm) | ||
| Velocity Inlet | 0.125 to 5 m/s | Coolant Inlet Temp. | 25 °C |
| Pressure Outlet | 0 Pa | Ambient Temp. | 28 °C |
| Circulator | 9592 W/m2 | HPA | 470,000 W/m2 |
| Core Chip | 24,823 W/m2 | LNA 1 | 89,069 W/m2 |
| DRA | 81,281 W/m2 | LNA 2 | 89,069 W/m2 |
| Other Walls | 0.02461 W/(m∙K), and 28 °C | ||
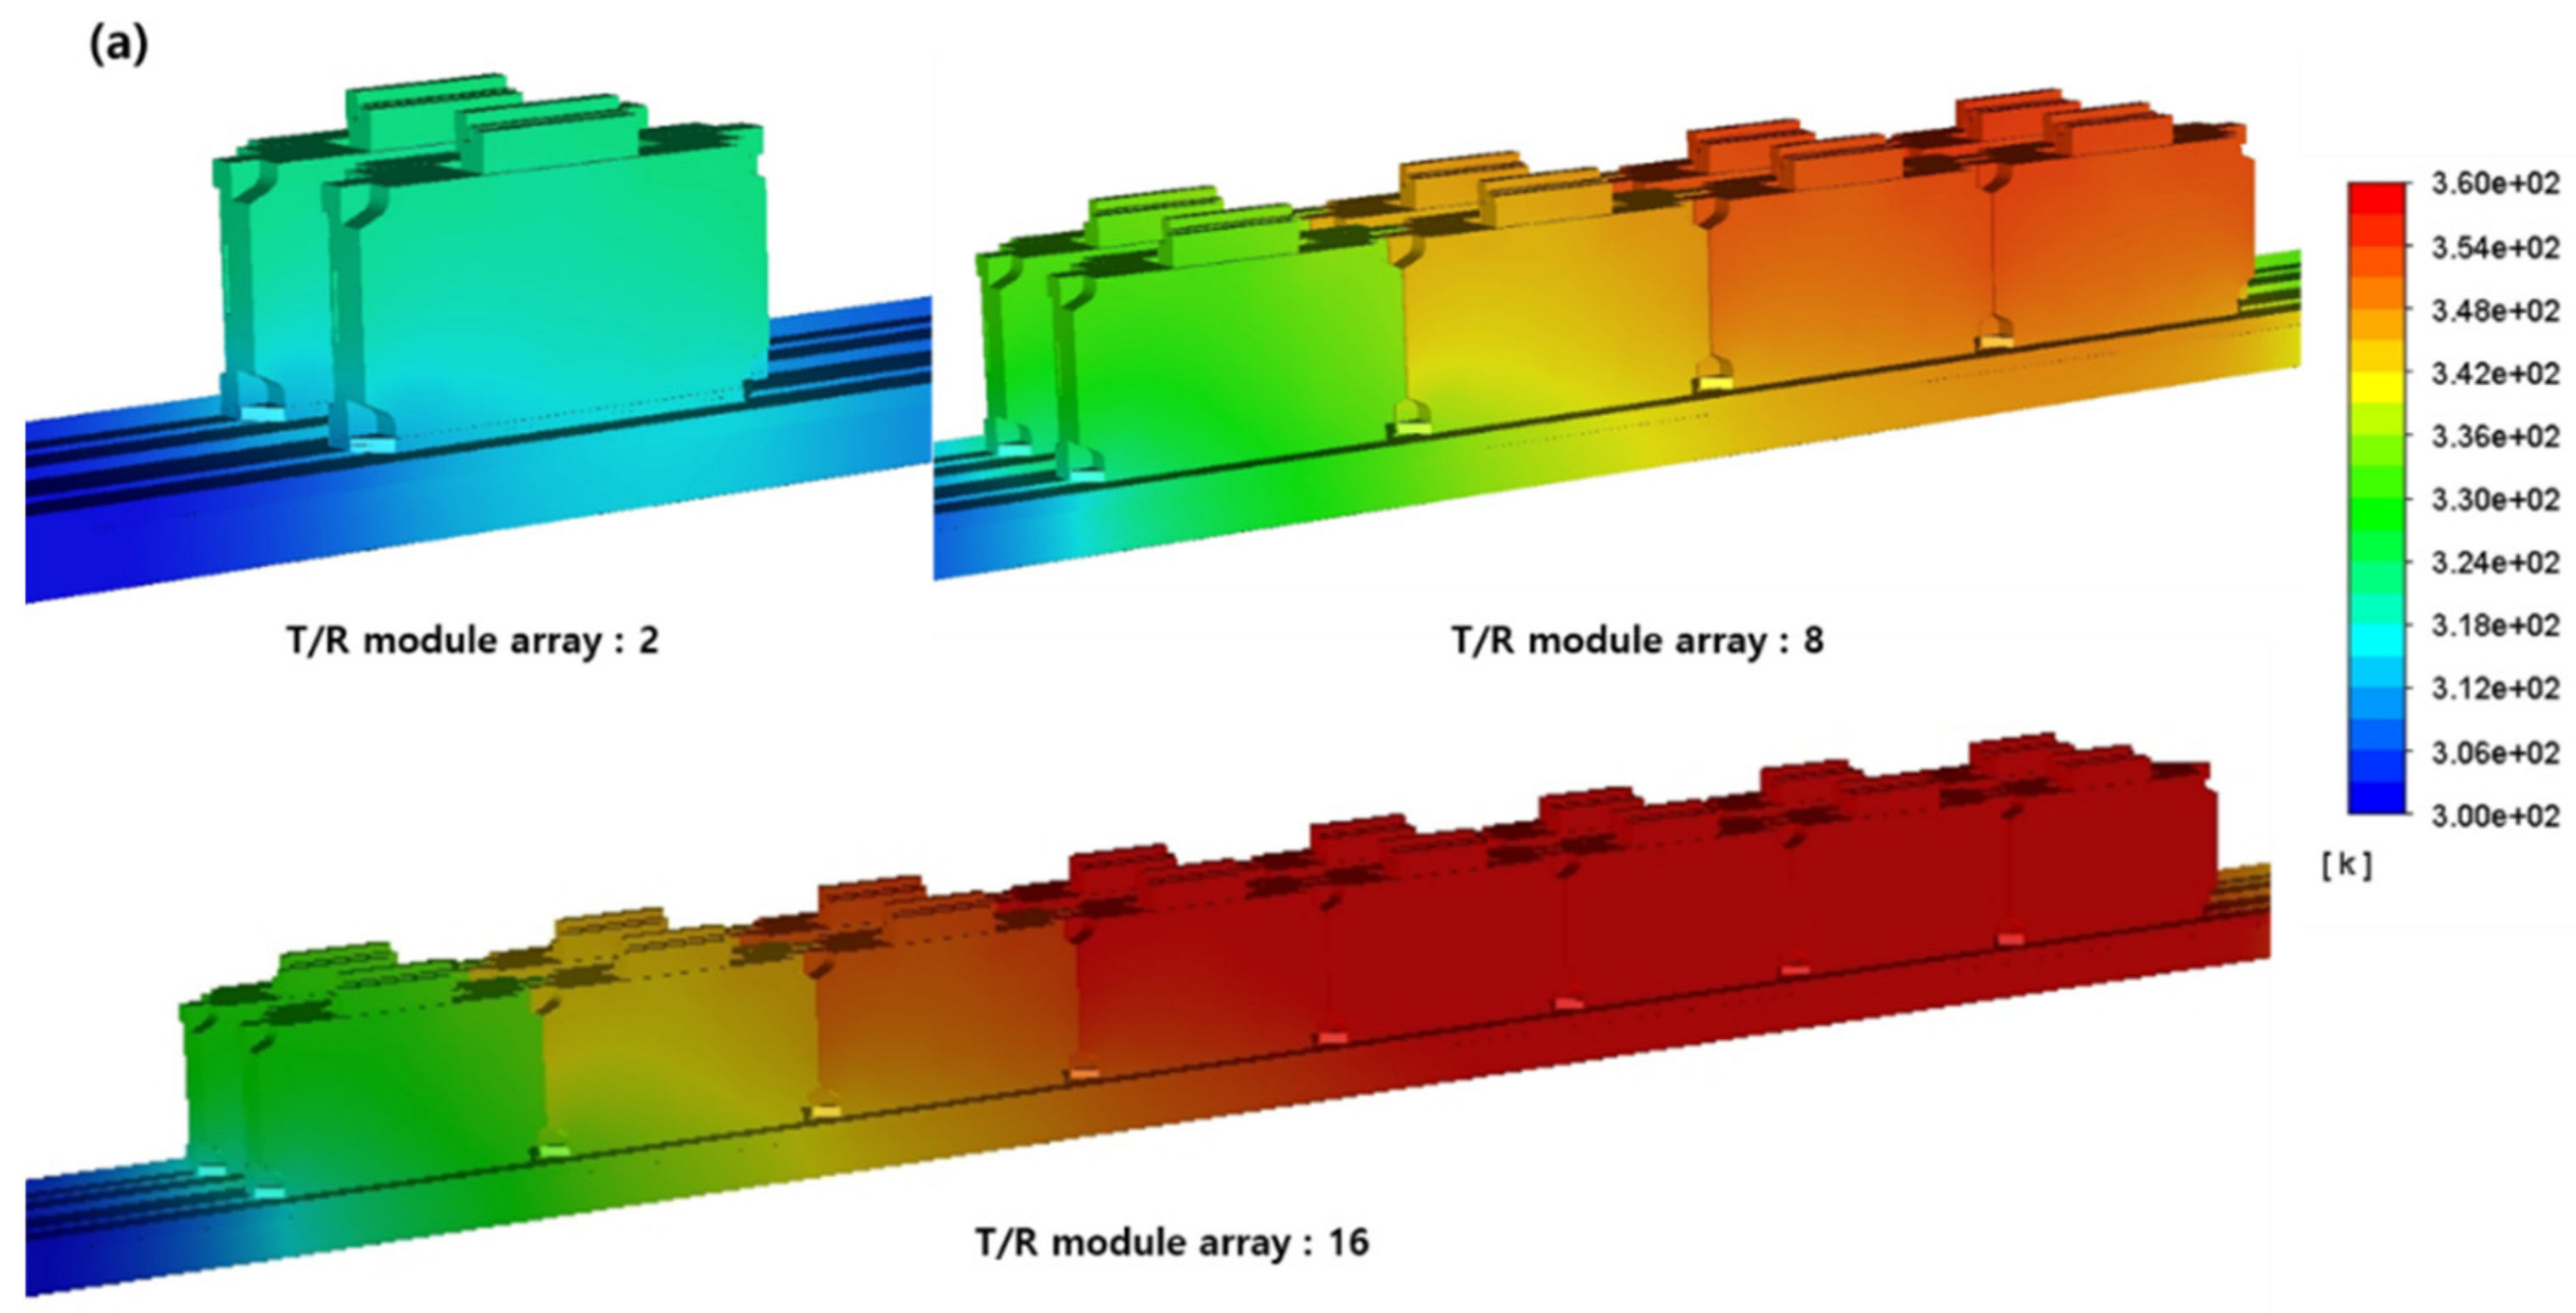
| Velocity | Number of T/R Modules: 2 | Number of T/R Modules: 8 | Number of T/R Modules: 16 | ||||||||||
|---|---|---|---|---|---|---|---|---|---|---|---|---|---|
| Name | 0.125 | 0.5 | 1 | 5 | 0.125 | 0.5 | 1 | 5 | 0.125 | 0.5 | 1 | 5 | |
| Circulator | 324.7 | 318.4 | 312.5 | 308.0 | 357.0 | 336.1 | 317.2 | 310.8 | 379.5 | 347.7 | 320.1 | 313.1 | |
| Core chip | 325.2 | 318.9 | 313.1 | 308.7 | 357.5 | 336.7 | 317.9 | 311.5 | 379.9 | 348.4 | 320.8 | 313.8 | |
| DRA | 329.1 | 322.8 | 317.0 | 312.5 | 361.4 | 340.6 | 321.7 | 315.3 | 383.8 | 352.2 | 324.6 | 317.6 | |
| HPA | 327.1 | 320.9 | 315.0 | 310.5 | 359.5 | 338.6 | 319.7 | 313.3 | 381.8 | 350.2 | 322.6 | 315.5 | |
| LNA 1 | 325.6 | 319.3 | 313.5 | 309.1 | 357.9 | 336.8 | 318.3 | 311.9 | 380.3 | 348.7 | 321.2 | 314.1 | |
| LNA 2 | 327.2 | 320.9 | 315.2 | 310.8 | 359.4 | 338.6 | 320.0 | 313.6 | 382.0 | 350.4 | 322.9 | 315.8 | |
Publisher’s Note: MDPI stays neutral with regard to jurisdictional claims in published maps and institutional affiliations. |
© 2021 by the authors. Licensee MDPI, Basel, Switzerland. This article is an open access article distributed under the terms and conditions of the Creative Commons Attribution (CC BY) license (https://creativecommons.org/licenses/by/4.0/).
Share and Cite
Park, J.S.; Shin, D.-J.; Yim, S.-H.; Kim, S.-H. Evaluate the Cooling Performance of Transmit/Receive Module Cooling System in Active Electronically Scanned Array Radar. Electronics 2021, 10, 1044. https://doi.org/10.3390/electronics10091044
Park JS, Shin D-J, Yim S-H, Kim S-H. Evaluate the Cooling Performance of Transmit/Receive Module Cooling System in Active Electronically Scanned Array Radar. Electronics. 2021; 10(9):1044. https://doi.org/10.3390/electronics10091044
Chicago/Turabian StylePark, Jun Su, Dong-Jun Shin, Sung-Hwan Yim, and Sang-Hyun Kim. 2021. "Evaluate the Cooling Performance of Transmit/Receive Module Cooling System in Active Electronically Scanned Array Radar" Electronics 10, no. 9: 1044. https://doi.org/10.3390/electronics10091044