Article

DGG: A Novel Framework for Crowd Gathering Detection

1
School of Information Engineering, Nanchang University, Nanchang 330031, China
2
School of Software, Nanchang University, Nanchang 330047, China
3
Jiangxi Key Laboratory of Smart City, Nanchang 330047, China
*
Author to whom correspondence should be addressed.
Electronics 2022, 11(1), 31; https://doi.org/10.3390/electronics11010031
Submission received: 11 November 2021 / Revised: 11 December 2021 / Accepted: 21 December 2021 / Published: 23 December 2021
(This article belongs to the Section Artificial Intelligence)

Abstract

:
Crowd gathering detection plays an important role in security supervision of public areas. Existing image-processing-based methods are not robust for complex scenes, and deep-learning-based methods for gathering detection mainly focus on the design of the network, which ignores the inner feature of the crowd gathering action. To alleviate such problems, this work proposes a novel framework Detection of Group Gathering (DGG) based on the crowd counting method using deep learning approaches and statistics to detect crowd gathering. The DGG mainly contains three parts, i.e., Detecting Candidate Frame of Gathering (DCFG), Gathering Area Detection (GAD), and Gathering Judgement (GJ). The DCFG is proposed to find the frame index in a video that has the maximum people number based on the crowd counting method. This frame means that the crowd has gathered and the specific gathering area will be detected next. The GAD detects the local area that has the maximum crowd density in a frame with a slide search box. The local area contains the inner feature of the gathering action and represents that the crowd gathering in this local area, which is denoted by grid coordinates in a video frame. Based on the detected results of the DCFG and the GAD, the GJ is proposed to analyze the statistical relationship between the local area and the global area to find the stable pattern for the crowd gathering action. Experiments based on benchmarks show that the proposed DGG has a robust representation of the gathering feature and a high detection accuracy. There is the potential that the DGG can be used in social security and smart city domains.

1. Introduction

The development of surveillance systems is an important research topic in the computer field. Therefore, it is necessary to develop an automatic monitoring program suitable for various applications such as fault detection and event detection in sensors to detect patterns that do not conform to the established normal behavior. At the same time, one of the most interesting and active research topics in computer vision is the analysis of crowd behavior [1]. Obviously, crowd gathering belongs to such abnormal action. Crowd gathering detection aims to detect the crowd gathering actions in videos that always happen in public spaces [2]. When people appearing in an area, they may be scattered or gathered together. The crowd gathering action is dangerous in a crowded place as it may probably cause people to fall or may inflict injuries.
This technology can be used in social surveillance systems to supervise the crowd and prevent people from treading, rioting, and so on. For policymakers, this technology can also help them maintain social order and stability. Crowd gathering action has evident features compared with other human behaviors, such as quick running of crowds, crowd loitering, and crowd dispersal. Specifically, if crowd gathering events can be detected early and the relevant supervised agency can take appropriate actions towards mitigating the dangers, accidental injury can be prevented or the incident can be contained [3].
The way to solve the crowd gathering detection problem is based on image processing algorithms, and several papers have done excellent work. The stillness model, the optical flow algorithm, and the foreground segment methods are used widely in this domain. Ref. [4] proposed a stillness model and a motion model based on the improved background subtraction and the optical flow feature. The crowd gathering action can be detected by the threshold with the long-term stillness level. Ref. [5] proposed a foreground stillness model based on the foreground object mask and dense optical flow to measure the instantaneous crowd stillness level. The methods in [6,7,8] mainly used optical flow algorithms to calculate the related crowd feature, and feature analyses were performed to detect the crowd gathering action, which can achieve some effect. However, the common methods mainly use image processing approaches, which are limited to improve the detection accuracy due to complex crowd scenes. In addition, some Artificial Intelligence (AI) frameworks also obtain excellent results due to the strong generalization ability of deep-learning algorithms.
To alleviate such problems, this work proposes a novel framework DGG based on the crowd counting method using deep learning approaches and statistics for crowd gathering detection. The DGG mainly contains three parts, i.e., Detecting Candidate Frame of Gathering (DCFG), Gathering Area Detection (GAD), and Gathering Judgement (GJ). The DCFG is proposed to find the frame index that has the maximum people number based on the crowd counting method. This frame means that the crowd has gathered and the specific gathering area will be detected next. The GAD detects the local area that has the maximum crowd density in frames with a 3 × 3 slide search box. This local area means that crowd gathering happened in this area. Based on the detected results of the DCFG and the GAD, the GJ is proposed to analyze the statistical relationship between the local area and the global area to find the stable pattern for crowd gathering detection. Experimental results show that the proposed DGG has a good representation of the gathering feature and has high detection accuracy. In the experimental section, some other abnormal crowd actions are also compared and analyzed to prove the efficiency of the proposed method. This method considers the inner feature of the crowd gathering action, which can help to improve the detection accuracy and results. Compared with the existing crowd gathering detection methods, the DGG has a stronger ability when used in complex environments and has good accuracy.
The main contributions of this study are summarized as follows.
  • DGG, a novel framework is proposed to solve the crowd gathering detection problem, which tries to find the gathering action in complex environments with the help of the inner feature of the crowd.
  • The DCFG and the GAD are proposed as the global and local crowd gathering feature extractors, which are used to detect the candidate frame and the gathering area in a video frame.
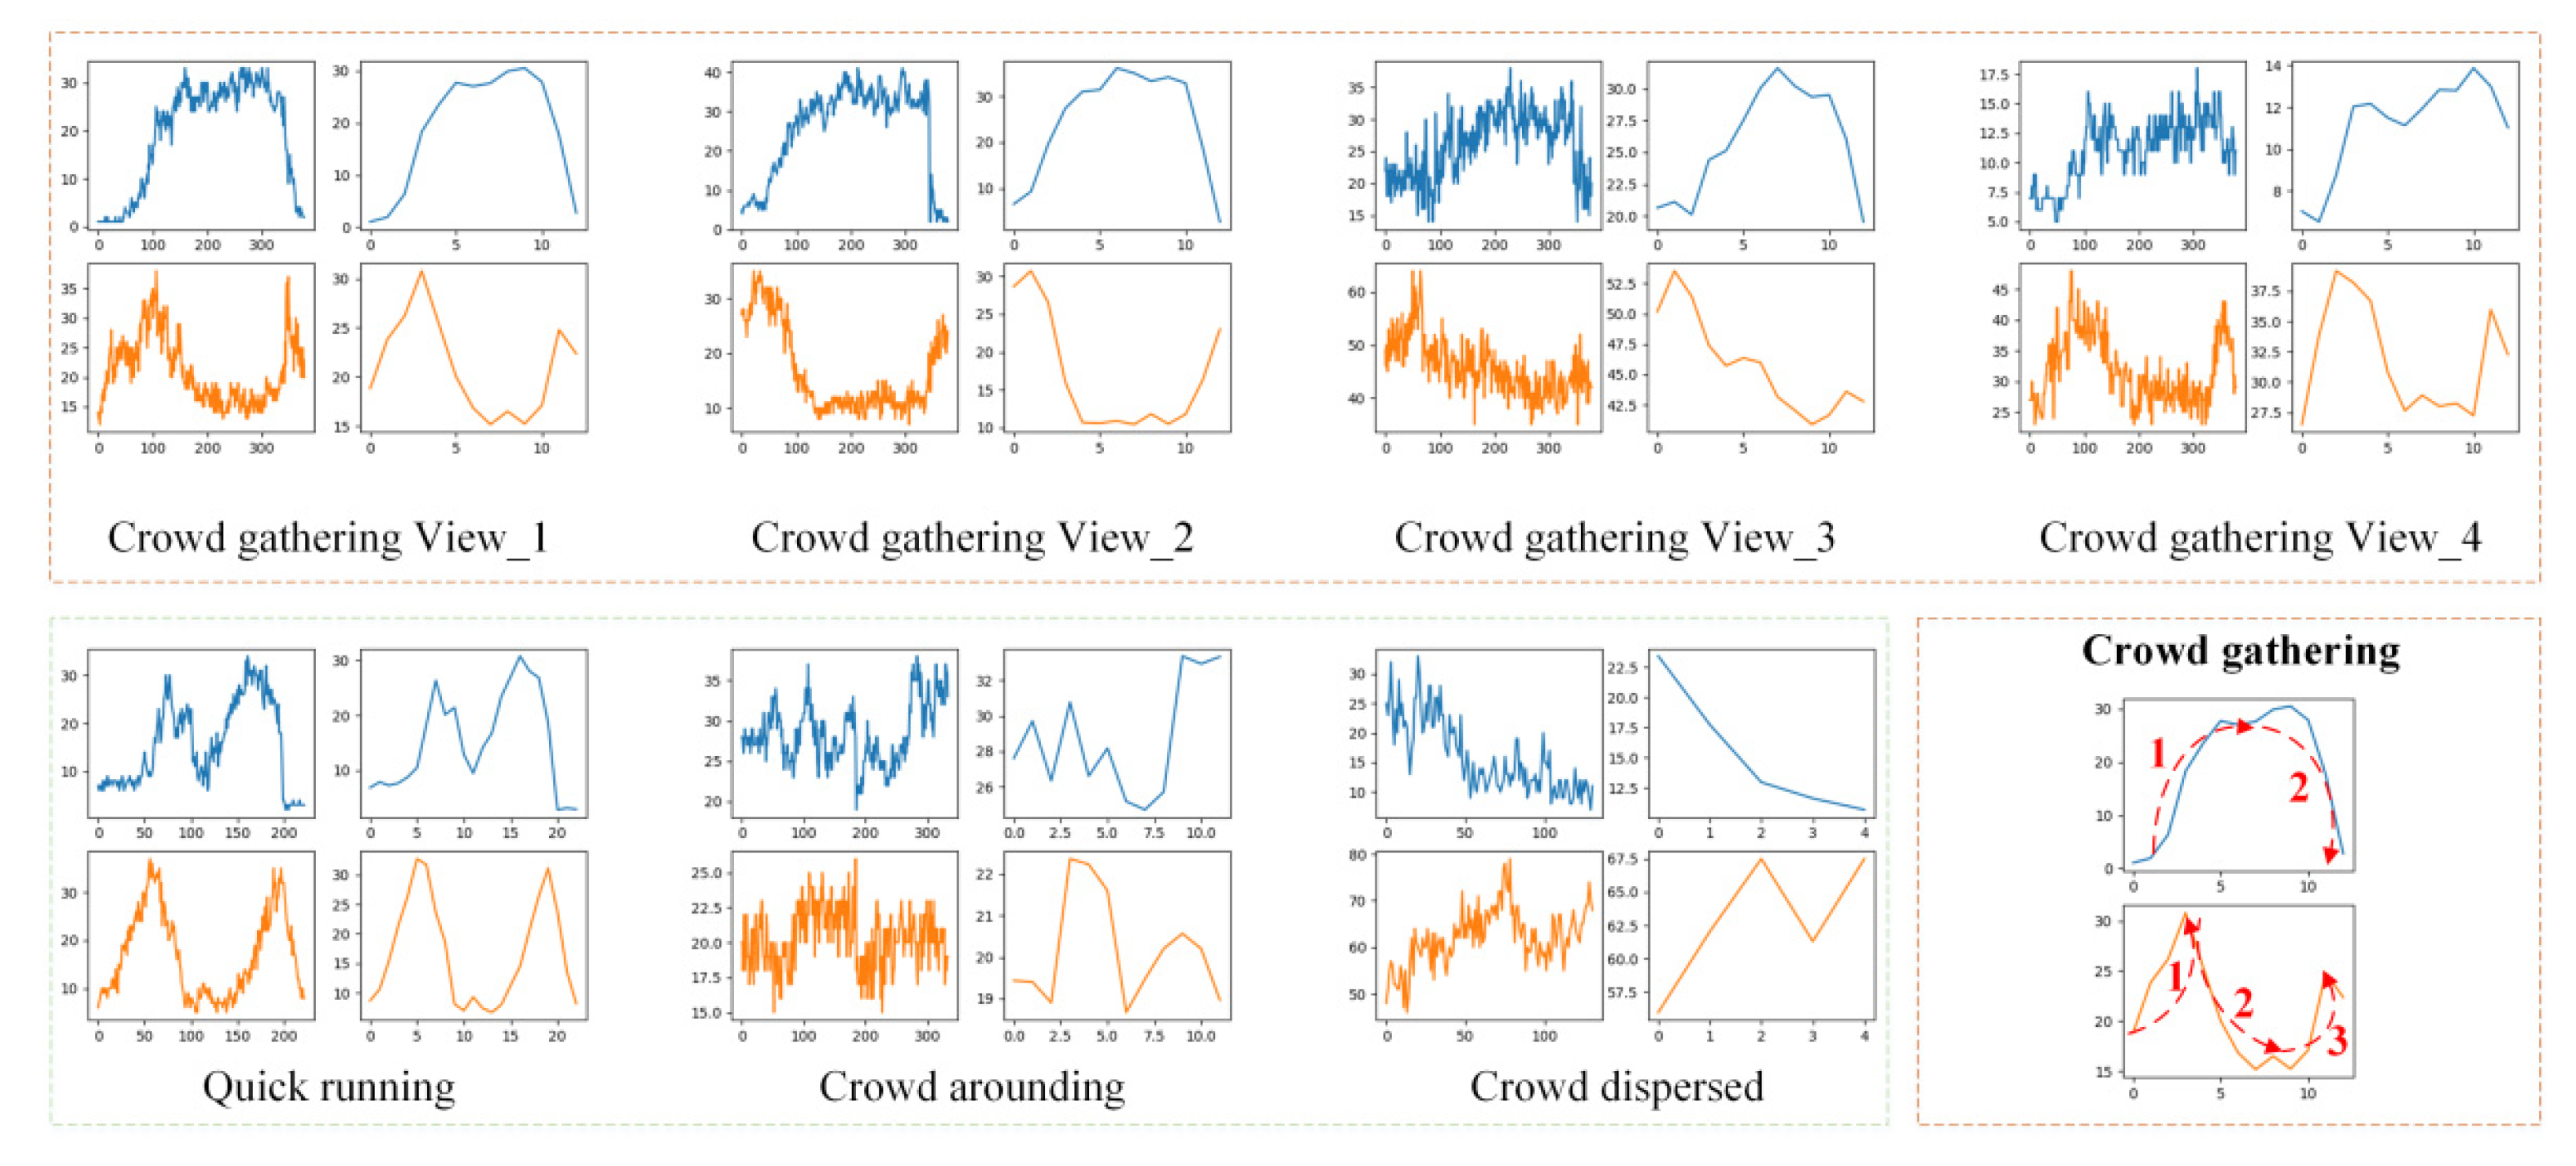
  • To detect the gathering action, the GJ is designed to analyze the statistical feature of the crowd and it can obtain a stable pattern for gathering action. This statistical pattern can be used to find the crowd gathering action in a complex scene.
The rest of this paper is organized as follows. Section 2 discusses related works. Section 3 introduces the structure of the proposed framework DGG for crowd gathering detection. Section 4 shows the structure of the proposed DCFG, GAD, and GJ. Section 5 is the experimental results, and Section 6 gives the conclusions and future research directions.

2. Related Work

2.1. The Image Processing-Based Methods

Several works have researched abnormal crowd action and behavior detection. Early works mainly used the energy model or the time series analysis method to process the image or video. In [9], a threshold was set with crowd entropy to represent the spatial distribution of a crowd, but this method relies on a reasonable threshold and lacks operability in practice. Ref. [10] proposed a system that can automatically detect abnormal, violent actions. These actions are performed by individual subjects and are witnessed by passive crowds. Ref. [11] discovered motion-changed rules to detect and localize abnormal behavior in crowd videos. They measured the similarity between motion-changed rules and the incoming video data to examine whether the actions were anomalous. A motion-based estimation method was proposed in [12] to measure the weighted temporal difference between consecutive frames by using spatial mean-sigma observations. Ref. [13] proposed an approach that consists of modeling time-varying dynamics of the crowd using local features. Although these methods can analyze the abnormal crowd actions, they mainly used manually designed standards to measure actions. Some researchers have used machine learning methods to solve this problem. Refs. [14,15] used a support vector machine to handle the input video to detect the crowd gathering action. In [16], a model was used to improve the representation of user behavior patterns and behavior profiles, adopting a new similarity assignment method, but this method lacks robustness, and the processing speed needs to be improved.
The image-processing-based methods mainly use image processing, optical flow or time series approaches, which are limited in improving the detection accuracy due to the complex crowd scenes. The DGG considers the advantages of these methods in morphology and tries to analyze the stable pattern of the crowd gathering action.

2.2. The Deep-Learning-Based Methods

With the development of deep learning and other advanced technologies [17,18,19], some people also tried to detect the crowd gathering action with deep-learning-based methods. Ref. [20] used the LSTM model to analyze abnormal behavior due to the formality of the video media. These methods extracted the features of human action from video frames, but such an LSTM model may not detect the complex actions in some special environments, such as large shopping malls that have high amounts of interference. Ref. [21] proposed a method of abnormal crowd behavior recognition based on a three-dimensional spatiotemporal convolution neural network. Ref. [22] considered crowd psychology and other factors and established a static basic model of crowd gathering patterns. In [23], a framework named CrowdVAS-Net was proposed for crowd-motion analysis that considered velocity, acceleration, and salient features in video frames of a moving crowd, but this method did not focus on multi-view analysis for more effective systems. Ref. [24] constructed a dual-channel convolutional neural network (DCCNN) for efficiently processing scene-related and motion-related crowd information inherited from raw frames and compound descriptor instances. Ref. [25] analyzed the multi-point crowd, and [26] used the fuzzy neural network method to analyze and extract the main crowd scenario features. In addition, some researchers also employed hardware, such as cell sensors [27] to detect crowd gathering. These methods mainly used the CNN algorithm and rely on the generalization of CNNs, which consider few inner features of gathering action. Besides the above methods that directly solve the crowd gathering problem, some crowd counting methods also refer to the crowd density and crowd behavior analyses. Ref. [28] estimated the scale variation of pedestrians in a crowd image and conducted a comprehensive analysis of the depth embedding module in CNNs. A detection framework of crowds based on the LSC-CNN model was proposed in [29]. This method can help to predict crowd density in an image, which can be used to analyze the crowd gathering distribution. Ref. [30] tried to estimate the number of pedestrians in crowd images and proposed a CNN-based method that employs a third adaption branch to model the dynamic scenarios implicitly. Ref. [31] proposed a two-stage strategy that includes pre-classification of density levels and subsequent regression with overlapped operational ranges.
In summary, the deep-learning-based methods mainly focus on the design of the network and rely on the generalization ability of CNNs. Table 1 shows the comparative results among the existing methods and ours. The DGG has the most advantages that can be used in complex scenes and has good robustness. Most of these methods ignore the inner feature of the crowd gathering action, which will reduce the detection accuracy. The DGG not only employs the deep-learning-based method, but also fuses such inner features in the detection pattern for gathering.

3. Overview of the DGG

To detect the crowd gathering action in public areas, this work proposes a novel framework DGG with the crowd counting method. The overview of the proposed DGG is shown as Figure 1.
It can be seen that the DGG contains DCFG, GAD, and GJ. The DCFG aims to find the frame with the most people, which employs crowd counting methods to count the number of people. Different from the standard traditional methods, the DGG considers the inner feature of the crowd gathering action that can used to analyze the gathering pattern. It is also more flexible and robust than image-processing-based methods in complex environments. Crowd counting methods [32,33,34,35] mainly use the density map estimation to automatically determine the number of people in a crowd. In this work, two of them, CANNet [36] and CSRNet [37], are chosen to test the performance of the framework. The GAD uses the 3 × 3 sliding window to find the maximum area in a frame based on the results of the first part. The maximum area means that the area has the maximum crowd density in an image. After the GAD, a video frame is divided into two areas, (i.e., the maximum crowd density area and others). The GJ adds the maximum crowd density values and other area values separately from all the frames. From the statistical results, the crowd gathering action can be detected. In the Experimental part, the evaluation metrics, ‘True Positive’, the ‘False Positive’, the ‘True Negative’, the ‘False Negative’, and so on, are considered used to prove the efficiency of the DGG based on the same data sampling method used in [4,5].
The DGG is an end-to-end approach that is easy to train and can obtain satisfactory results. The details of the above approach will be introduced in Section 4.

4. The Details of the Proposed DGG

This section introduces the three parts of the proposed DGG for crowd gathering detection, i.e., Detecting Candidate Frame of Gathering (DCFG), Gathering Area Detection (GAD), and Gathering Judgement (GJ). This work assumes that when crowd gathering action occurs, the crowd density in a local area in image will go through a period of regular change. It can be imagined that people appear on some sides and gradually converge in a local area. Based on the above assumption, this work tries to analyze the statistical results of the whole crowd density and the local crowd density to find the gathering feature and detect the crowd gathering action.

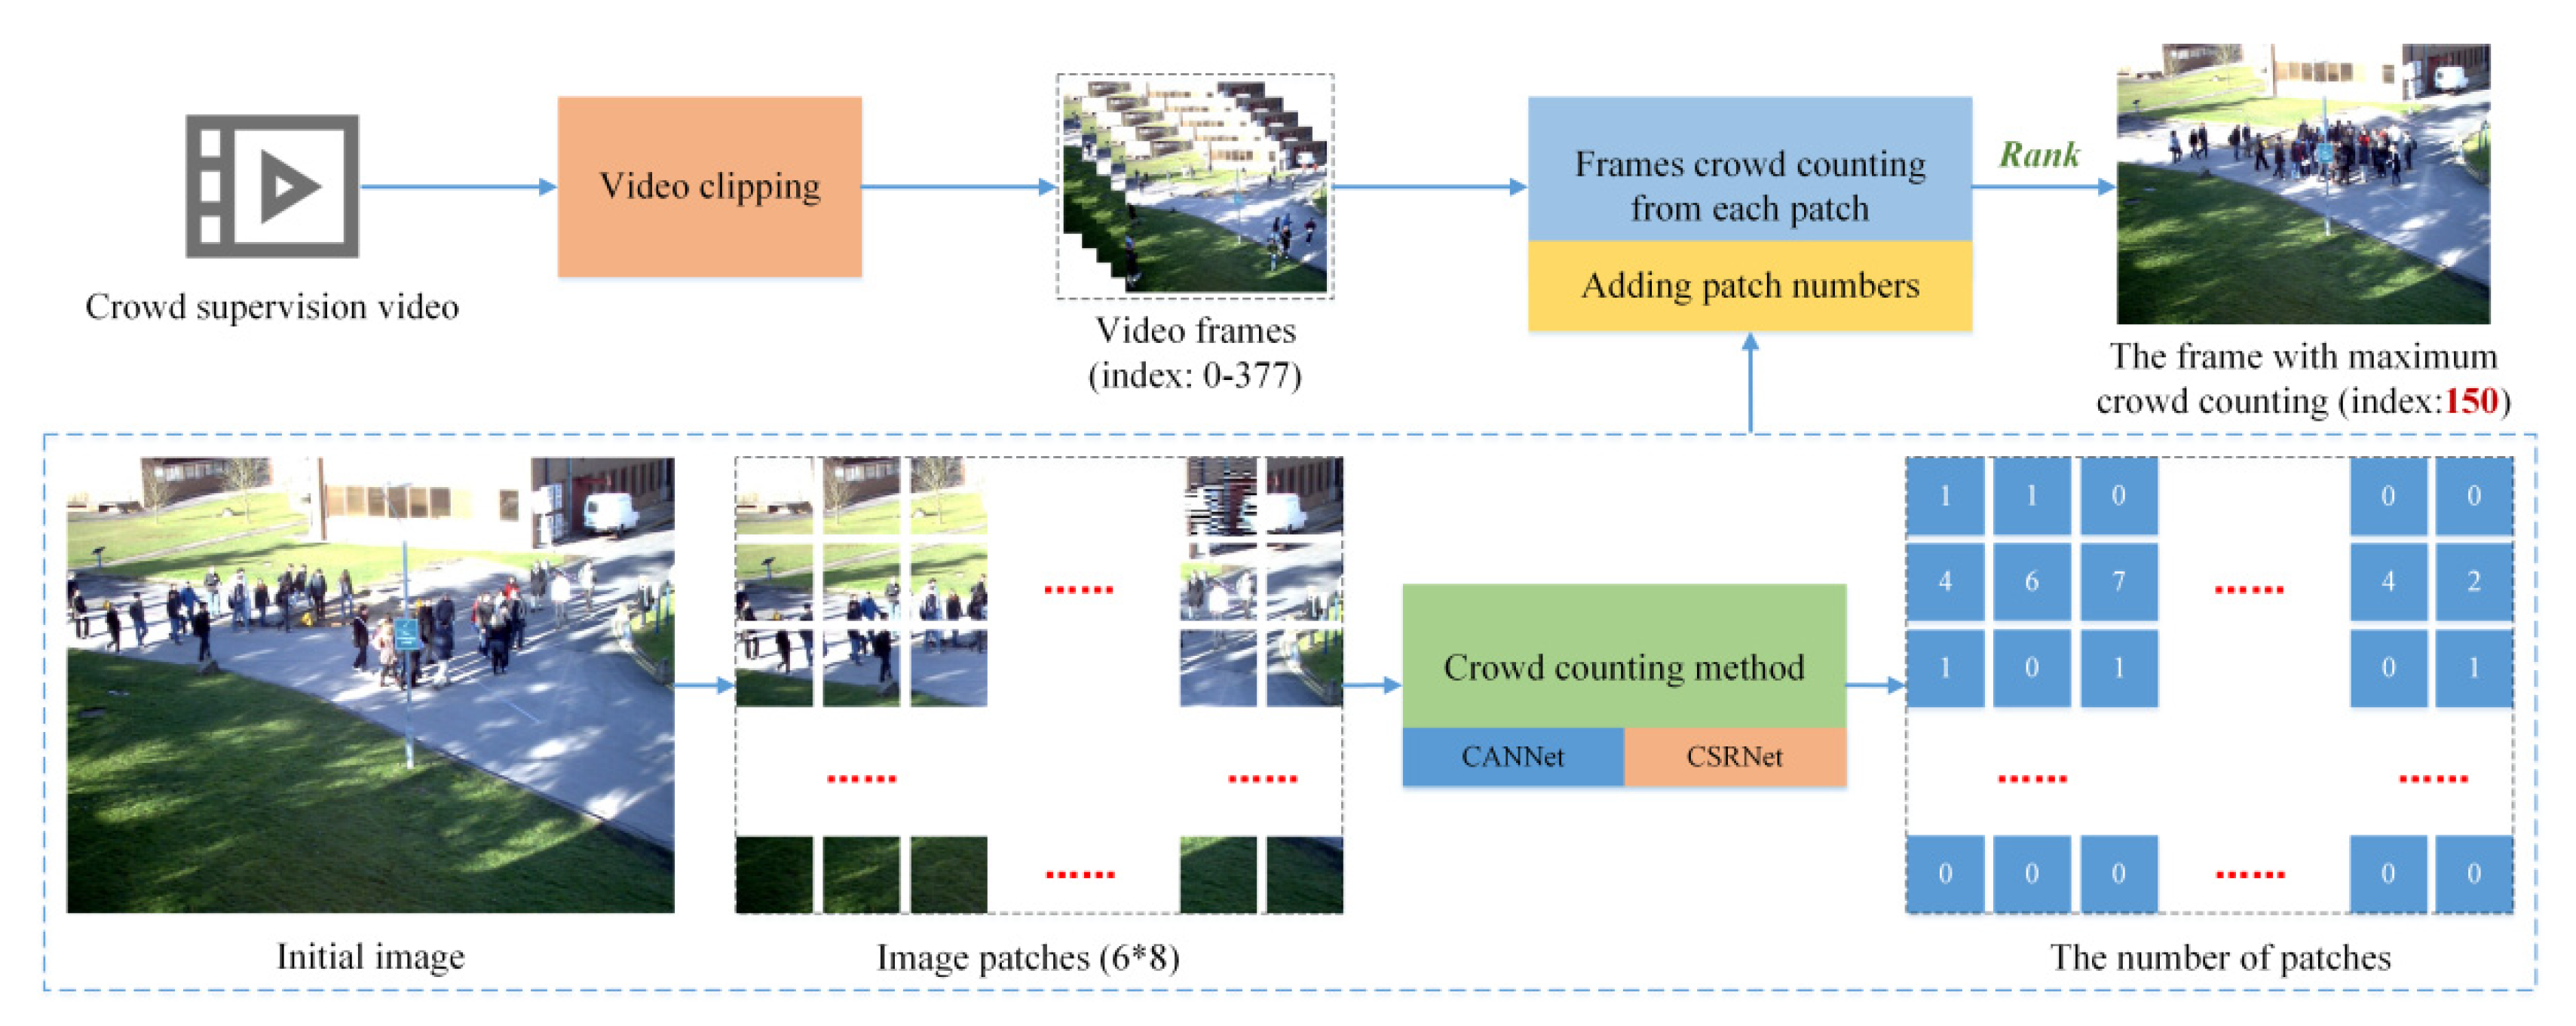
4.1. The Detecting Candidate Frame of Gathering (DCFG)

The DCFG aims to find the frame index that has the maximum crowd number in a video. The structure of the DCFG can be seen in Figure 2. This work segments the original frame into several image patches. The advantage of this operation is that it can obtain the whole crowd number and a different local crowd number in an image conveniently. To decide the patch’s size, the PETS2009 dataset [38] is researched. This dataset includes some crowd gathering videos that can clip into frames. Each video contains the whole action of crowd gathering, from people appearing on all sides to converging in a local area. The size of the frames of the PETS2009 dataset is 768 × 576. The size of every patch was chosen as 96 × 96, and 48 patches were obtained from one frame. Except the PETS2009, some other datasets are also explored [39] which tried to detect the abnormal behavior using 3D-CNN method.
There are several methods to determine the crowd number. These methods can be divided into two aspects, one is based on detection approaches, and the other is based on density estimation. The limitation of the detection-based methods is they cannot handle a dense crowd situation. The limitation of the density-based methods is they cannot locate the crowd in images. In this work, to determine the global and local crowd number, density-based methods are employed, such as CANNet [36] and CSRNet [37]. As Figure 2 shows, the image patches are handled by the crowd counting method. The crowd counting methods can count the people number of each image patch directly. The CANNet and the CSRNet methods are constructed based on a convolutional neural network that includes a multi-column structure. In the experiments, both CANNet and CSRNet are tested, and CANNet has better precision. After the crowd counting methods are used on frame patches, the number of each patch and the number of the whole image that corresponding patches belong to can be obtained.
The n th frame f n is divided into 48 smaller patches, which can be represented as p n m . n m denotes the m th patch in the n th frame. After each frame is handled by crowd counting methods, the number N p n m of p n m can be obtained. The whole number of f n can be obtained with Equation (1).
N f n = i = 0 m N p n m , m [ 1 , 48 ]  
With the crowd number of each frame, the frame index f m a x that has the maximum crowd number can be detected with the ranking function r a n k ( ) . As Figure 2 shows, the maximum crowd number appears in the frame with index 150. f m a x indicates the crowd has gathered in a local area and the next step is to find this area.

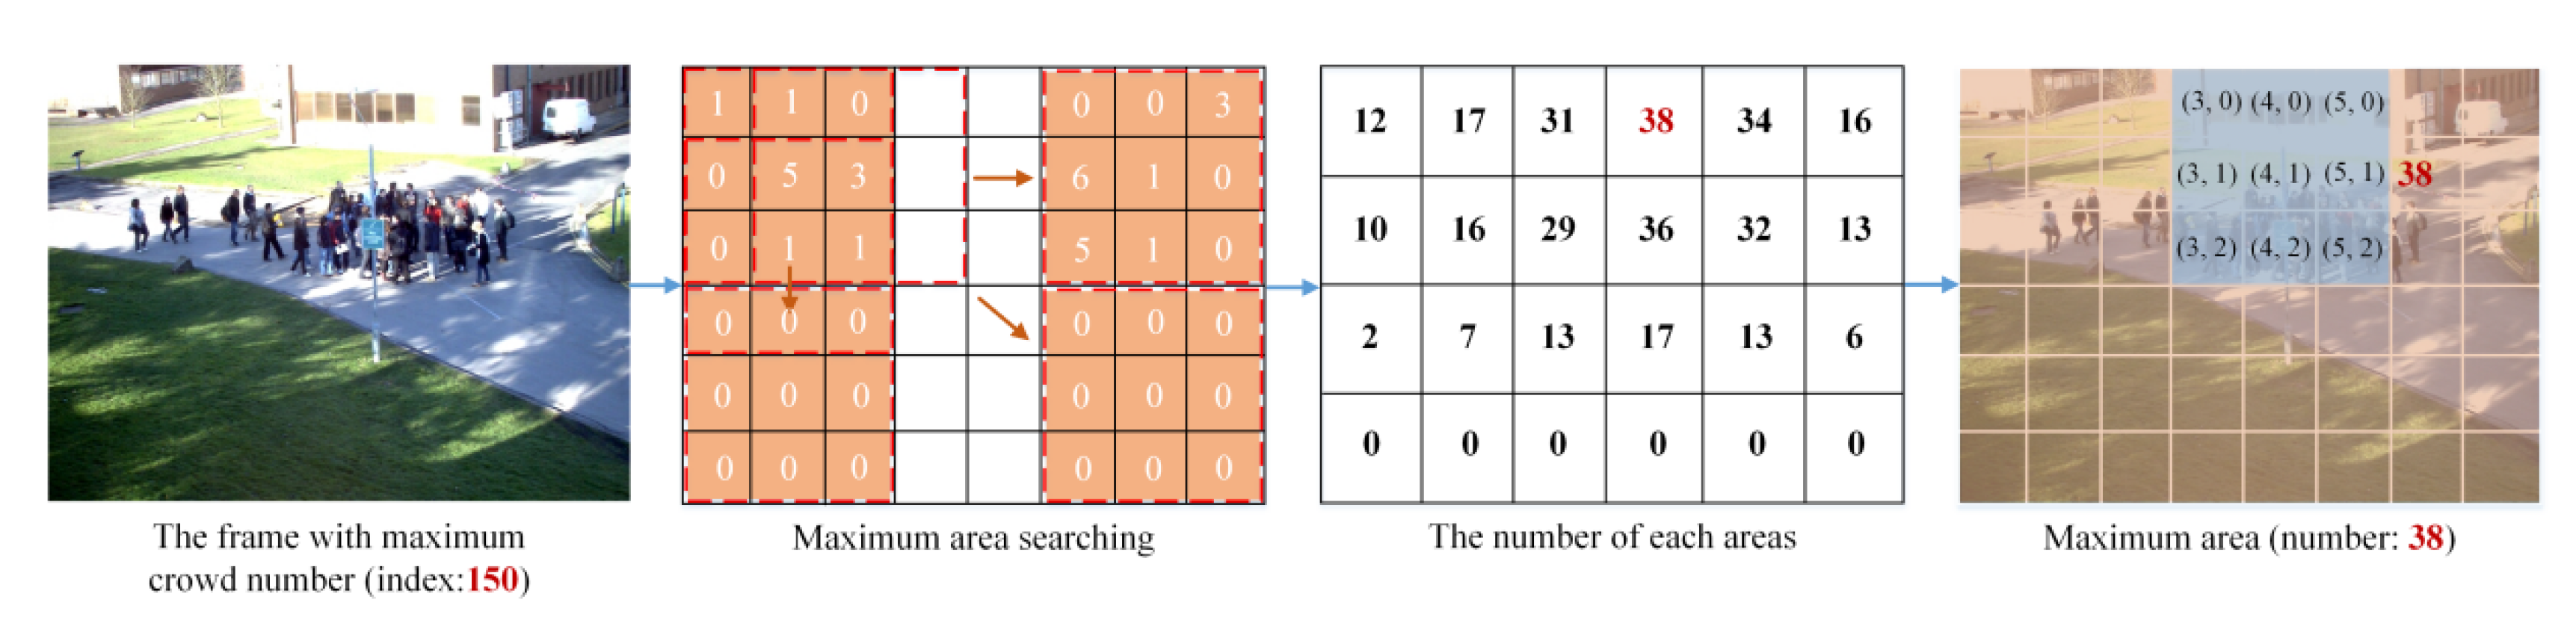
4.2. The Gathering Area Detection (GAD)

After the DCFG part, the frame f m a x that has the maximum crowd number, is detected. The GAD is proposed in this section to find the local area A m a x . In terms of mathematical statistics, A m a x has the maximum crowd number in all patches in a frame. In terms of image semantics, A m a x represents the crowd gathering area in a frame. It means that people come from all sides and gather in this area. Based on the assumption of this work, the crowd gathering feature can be calculated in a statistical way. To locate A m a x in a frame, this work uses a 3 × 3 slide search box to obtain the number for each area. The size of this search box is also used in many convolutional neural networks, such as in [22,23,24,28,30]. Considering that DCFG divides the video frame into 6 × 8 patches, the 3 × 3 size can locate the gathered crowd exactly rather than the larger search box size. The structure of the proposed GAD is shown in Figure 3.
Each area A n consists of nine image patches, which can be seen as the red dotted box in Figure 3. To calculate the crowd number of A n , the 3 × 3 slide search box starts at patch [ i , j ] . The people number of N A n of A n is computed with Equation (2):
N A n = i = 0 n j = 0 m N p [ i , j ] ; n [ 0 , 3 ) , m [ 0 , 3 )  
Because one frame contains 6 × 8 image patches, patch [ i , j ] is controlled by the value of i and j . In the 6 × 8 grid, the 3 × 3 slide search box can move six times in row and move four times in line. Then, the crowd numbers of A n , n [ 0 , 24 ) can be obtained, and A m a x can be obtained by ranking function r a n k ( ) .
As the fourth sub-image in Figure 3 shows, the blue area, the A m a x area, contains nine smaller image patches. This area has the x-axis from [ 3 , 5 ] and the y-axis from [ 0 , 2 ] . The crowd number in A m a x is 38, which is the maximum value in frame with index 150. A m a x will be handled in the next section.

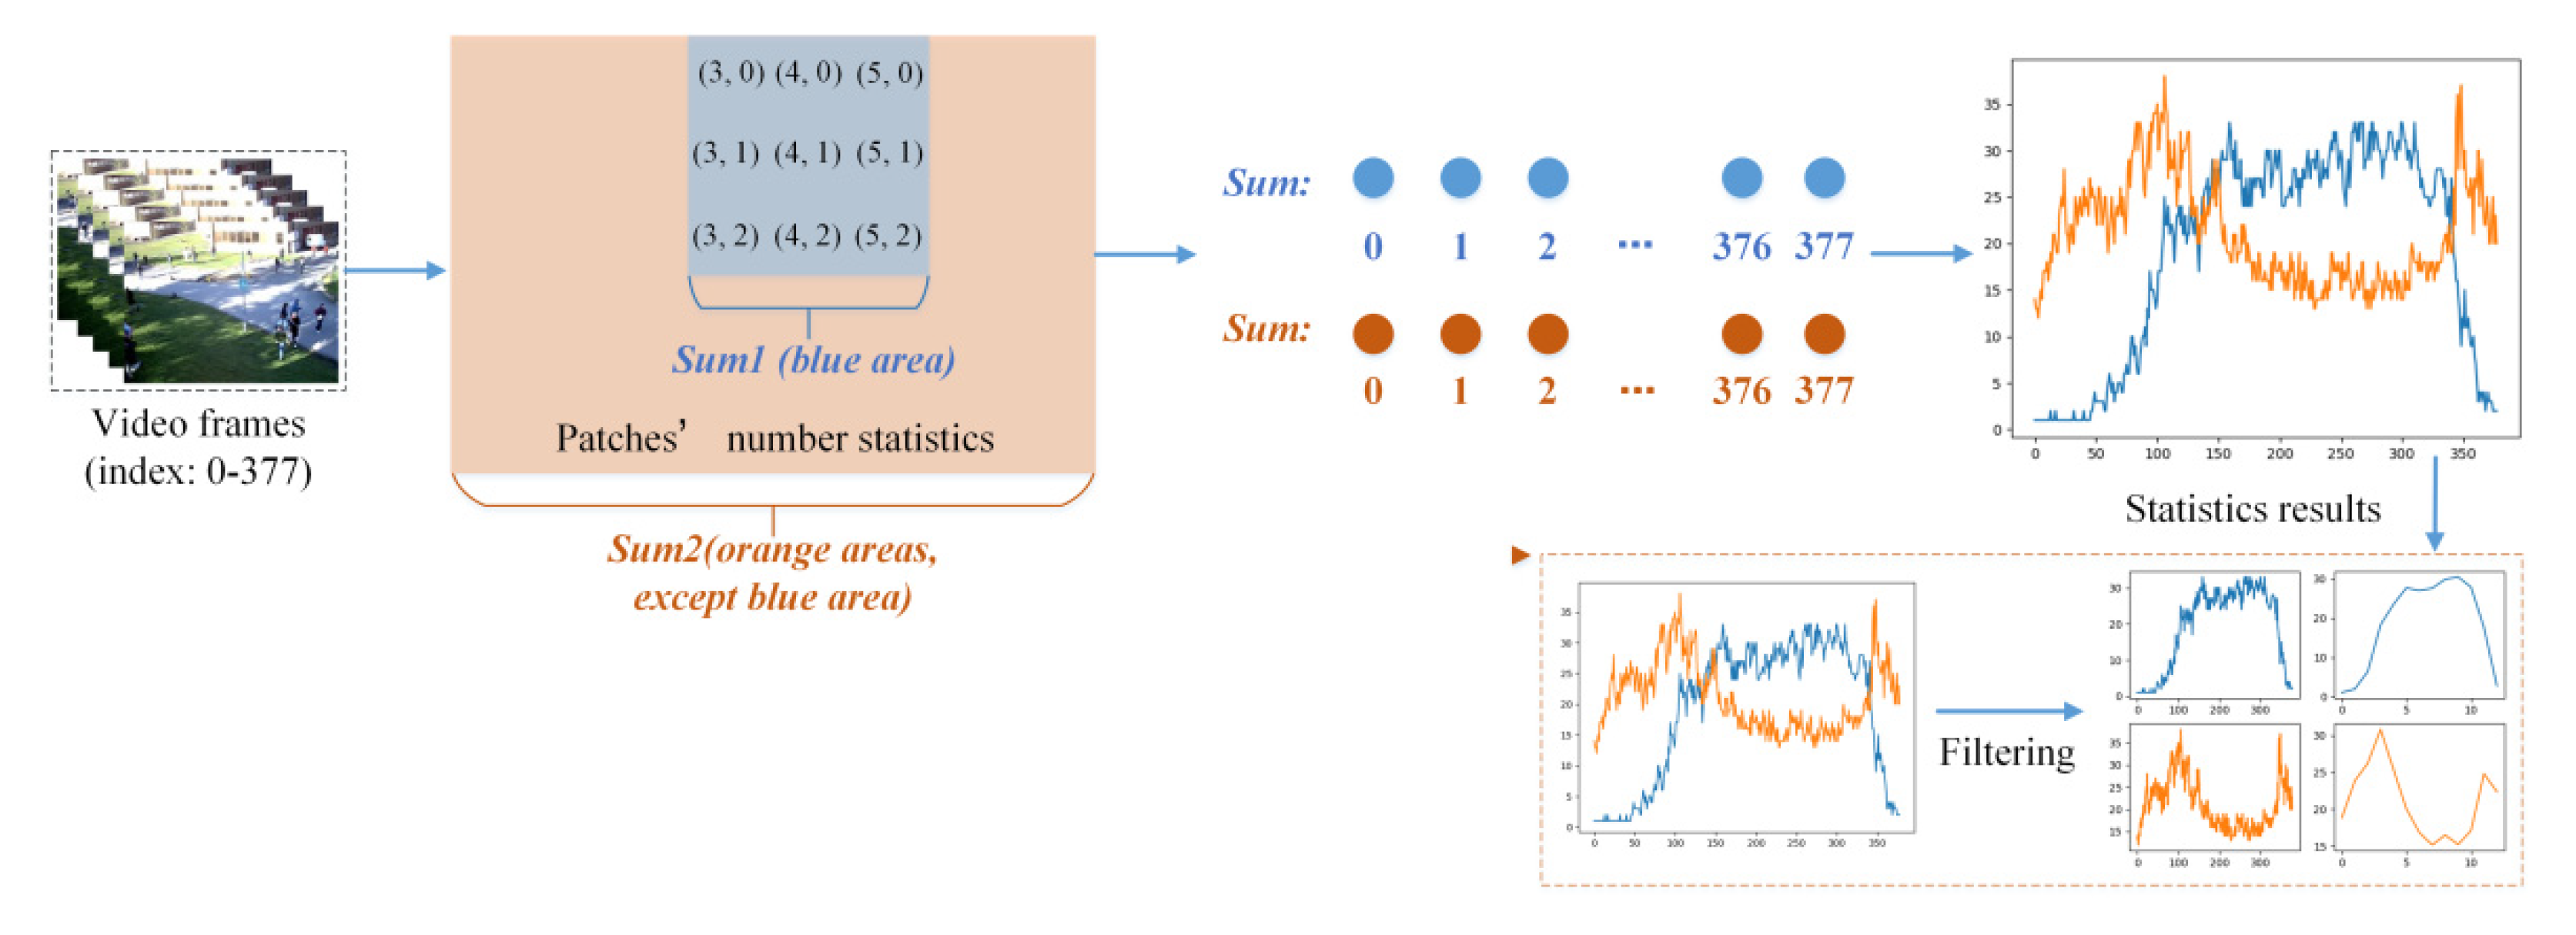
4.3. The Gathering Judgement (GJ)

After the GAD, the maximum local area A m a x in the maximum global frame f m a x can be obtained. For the description, this work denotes other areas in f m a x as A o t h e r s . This section proposes a novel approach GJ based on statistics to detect the feature of crowd gathering. The statistical results will be helpful to distinguish the crowd gathering action and other crowd actions, such as quick running, crowd loitering, and crowd dispersal. The structure of the proposed GJ is shown in Figure 4.
As Figure 4 shows, A m a x is colored blue, and A o t h e r s is colored orange. The crowd number in A m a x is counted as s u m 1 , and the crowd number in A o t h e r s is counted as s u m 2 . The analyses of Figure 4 are based on one video in the PETS2009 dataset. The video is divided into 387 frames (0–377). This work counts the crowd numbers in the same position of A m a x and A o t h e r s in each frame, and two significant vectors V m a x and V o t h e r s will be obtained, as Equation (3) shows.
{ V m a x = { S u m 1 0 , S u m 1 1 , , S u m 1 n } V o t h e r s = { S u m 2 0 , S u m 2 1 , , S u m 2 n } , n [ 0 , 378 )  
The vector V m a x represents the numbers that are counted in the A m a x area, and the vector V o t h e r s represents the numbers that are counted in A o t h e r s . V m a x (blue curve) and V o t h e r s (orange curve) drawn as a sequential curve chart are shown as in Figure 4. The blue curve increases and then decreases. At the same time, when the blue curve increases, the orange curve declines. This phenomenon is reasonable and explainable. When people appeared on all sides, they firstly appeared in the A o t h e r s area and a few appeared in A m a x directly. As time went on, the crowd gathered in a local area V m a x . In this process, the crowd number of V m a x increased and the number of A o t h e r s decreased. Because crowd gathering is a procedural step, people gather first and then disperse. The curves in Figure 4 have a good representation of this step.
Based on above analyses, this work chose the statistical feature to detect the crowd gathering action. More comparisons will be demonstrated in the experimental section. To compute the detection accuracy, this work filters the curves in Figure 4 and selects two points as the crowd gathering beginning and ending points-in-time. The frames between these two time-points are regarded as the crowd gathering action and the others are not.

5. Experiments

The DGG was implemented using Linux Ubuntu 16.04 systems and Pytorch 1.4 deep-learning environments. The hard environments were an Inter Core i5-6500 3.20 GHz processor and Quadro P4000, 8 G RAM.

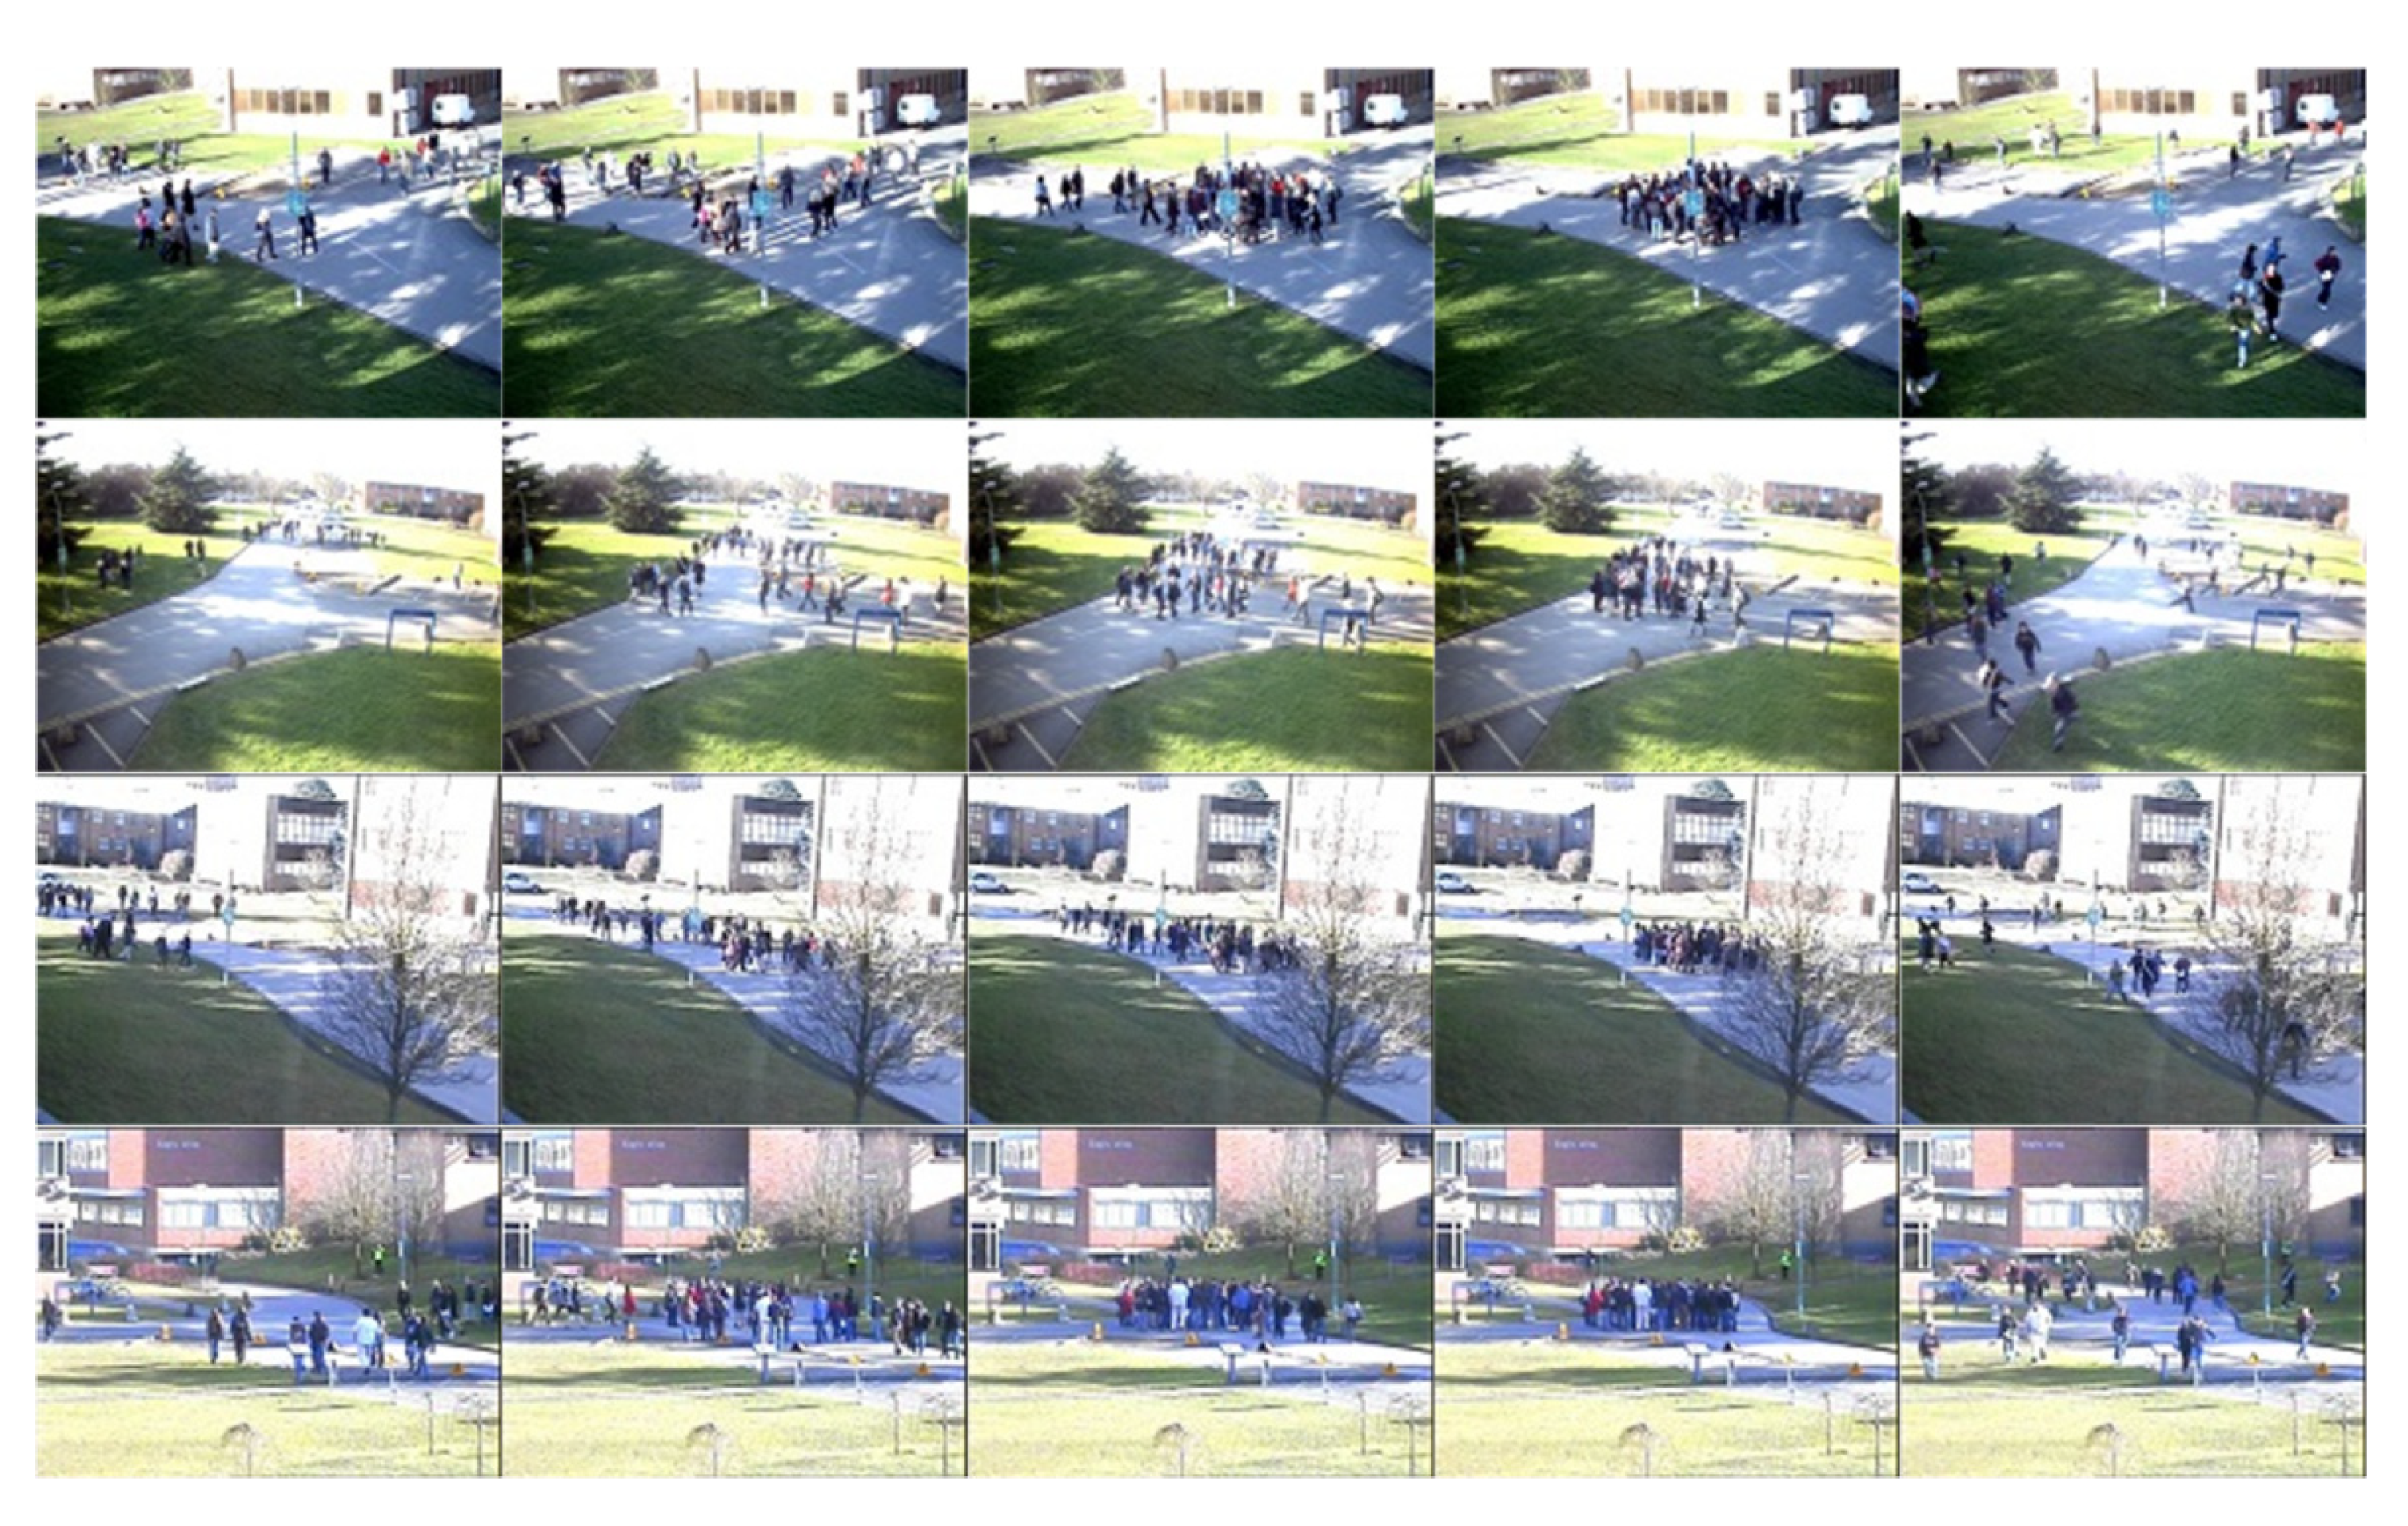
5.1. The Dataset for Evaluation

PETS2009. The PETS2009 dataset [38] was built for abnormal behavior detection. The dataset contains several videos that are collected from multiple cameras and involve up to approximately forty actors. The video resolution is 768 × 576, and the frame rate is 7 fps. There are four crowd gathering videos in the different scenes [5], (i.e., view 1~4 in Time_14–33), and every video can be divided into 378 images. Each video includes normal people walking and abnormal crowd gathering frames. Some examples are shown in Figure 5.
As shown in Figure 5, four rows represent four different views of the crowd. Each row has five images that include walking actions and gathering actions. The five images represent the sequential process of the crowd counting; people appeared from all sides, and then gathered in a local area, and finally dispersed. The aim of this work is to detect the gathering actions from the video frames.

5.2. The Results of the Abnormal Action Statistical Analyses

In Section 4, this work finds that the crowd local and global statistical analyses can reflect the motion tendency and can be used to detect the crowd gathering action. This section exhibits some statistical results to prove this conclusion. Firstly, the curve results of vectors V m a x and V o t h e r s in four crowd gathering views are exhibited. The curves are shown in Figure 6.
From Figure 6, it can be found that four views have the same curve tendencies. The blue curves (represent the crowd gathering area) increase and then decrease. The orange curves (represent the other areas) decrease and then increase. At the same time, between these two curves, it can be found that there are two points that can be regarded as the crowd gathering beginning time and the crowd gathering ending time. The crowd gathering beginning time happens when the blue curve increases and the orange curve decreases. The crowd gathering ending time happens when the blue curve decreases and the orange curve increases.
To prove this phenomenon, this work also compares three other abnormal crowd actions from the PETS2009 dataset. They are quick running, crowd loitering, and crowd dispersal. The quick running denotes the crowd appearing as a group that moves together with a quick motion. Crowd loitering means the crowd stands somewhere and each person moves in a very small range at a particular time. Crowd dispersal means that people walk or run to all sides from a local area, which is the opposite of the crowd gathering action. Figure 7 shows some examples of the three actions, and this work does the same statistical analyses, which are also shown in the bottom of Figure 7.
From Figure 7, it can be found that the statistical results demonstrate the obvious differences compared with the crowd gathering results, such as the quick running action: the blue curve and the orange curve tend to change together. When the blue curve increases, the orange curve also increases, i.e., people gather together, and the crowd numbers in local and global areas have the same motion character. More results are shown in Figure 8.
Figure 8 shows the comparisons among the crowd gathering action, quick running, crowd loitering, and crowd dispersal. In addition, the curves after filtering are also shown. The filtered results are more obvious to see the tendency of the corresponding action. In crowd gathering views 1–4, the blue curves increase and then decrease. This work calls the increasing step 1 and the decreasing step 2. Correspondingly, the orange curves have three steps at the same time, step 1, step 2, and step 3. When the blue curve is in step 1, the orange curve will go through step 1 and step 2.
The curves of quick running and crowd loitering seem very similar. The blue curve and the orange curve have the same change tendency. When blue curve increases or decreases, the orange will also increase or decrease at the same time. The curves of the crowd dispersal action look simpler than those of other actions. The blue curve decreases all the time and the orange curve increases. The statistical results of other actions are different from those of the crowd gathering action, which can be used to detect the crowd gathering action.
From the above analyses, the major finding is that this work finds a stable statistical pattern for crowd gathering action. Some previous works [29,31] also introduced related contents by analyzing the crowd density of an area to find abnormal behaviors. The difference between them and this work is that this work considers such inner feature as an important clue to detect the crowd gathering actions. With the development of developing countries, such as China, there are more and more shopping malls and central business districts, and this technology can help policymakers to maintain regional stability.

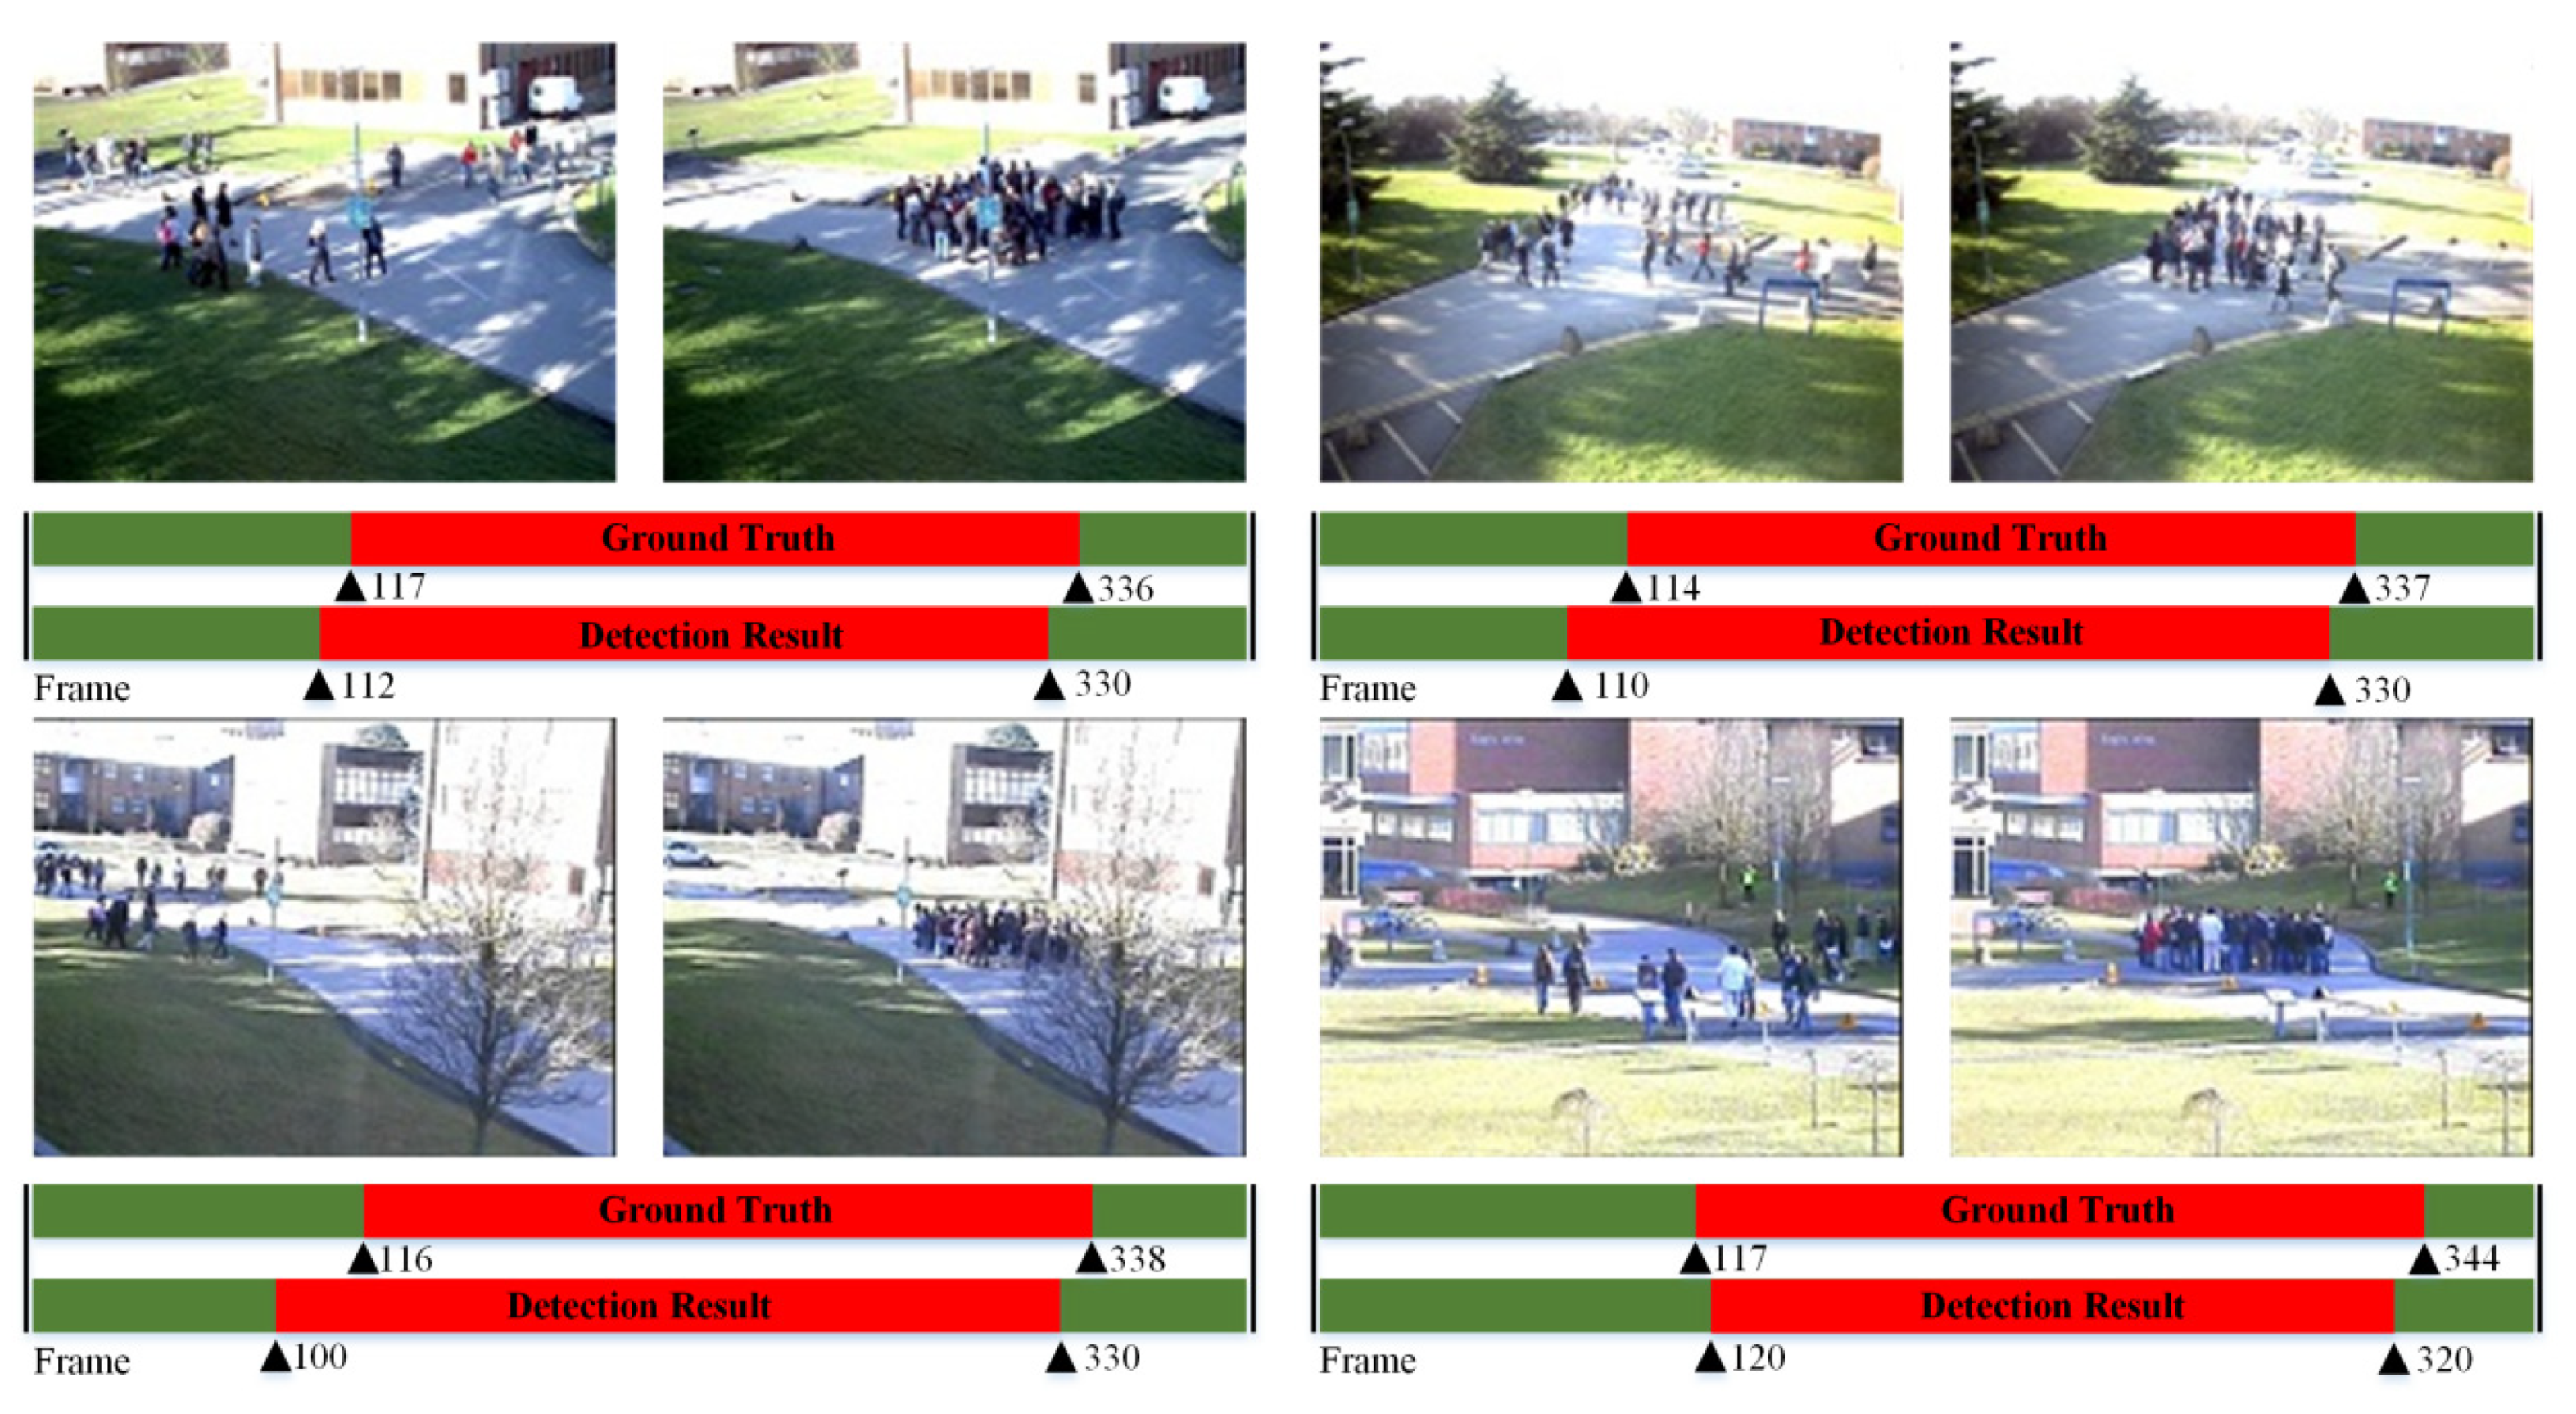
5.3. The Performances of the Proposed Method

To demonstrate the performance of the proposed method, this work tested the DGG on the PETS2009 dataset. The DGG is implemented with CANNet [36]. The results of four different views in one place are shown in Table 1. Seven evaluation indexes were used to measure the model performance, i.e., ‘TP (True Positive)’, ‘TN (False Positive)’, ‘FP (True Negative)’, ‘FN (False Negative)’, ‘TPR (True Positive Rate)’, ‘FPR (False Positive Rate)’, ‘ACC (Accuracy)’, Recall, Precision, and F1 values. The model had a low value of ‘FP’ and ‘FN’ and good performance of ‘TP’, ‘TN’, and ‘ACC’. Specially, the DGG reached 97.09% ACC in view 1 and view 2. From Figure 5, the video frame in view 1 and view 2 was clearer than that in view 3 and view 4, where there are some surrounding interferences around the crowd that result in mistakes.
This work also shows the visualization results of DGG for the PETS2009 dataset, which can be found in Figure 9. The four groups of experimental video frames denote the four different views. The red bars indicate the ground truth and the detection result of DGG, such as the upper-left group, the ground truth is from the 117th frame to the 336th frame, and the detection result is from the 112th frame to the 330th frame. The closer the range of numbers on the two red bars, the higher accuracy of the DGG.
In addition, this work also compares data with the SOTA methods [4,5,40,41] that are two excellent works for crowd gathering detection. The comparisons are shown in Table 2. On average, the proposed DGG can reach 95.17% ACC, compared with [40], i.e., 78.49%, [41], i.e., 79.90%, [5], i.e., 88.66%, and [4], i.e., 91.05%. View 1 to view 4 [4,5,40,41] were also lower than ours. Methods [4,5,40,41] mainly used foreground segmentation, optical flow estimation, and still models, which are not robust and do not consider the inner feature of the crowd action, leading to imprecise estimation.
In conclusion, from Table 1 and Table 2, the proposed DGG has good performance for crowd gathering detection. This results relies on the inner feature of the crowd gathering that is extracted by the GJ part in DGG. Methods [4,5] used the stillness model and foreground segment algorithm mainly based on the global feature of crowd images and ignored the local information of the crowd gathering action. Besides the inner feature, the stable gathering recognition pattern is also important for this problem. Some ablation experiments were also done.

5.4. Ablation Studies and Extreme Conditions

Because the proposed DGGs are built based on crowd density estimation, this analyzes the effect of different crowd counting methods, CANNet [36] and CSRNet [37]. The ‘ACC’ results of the framework with the two crowd counting methods are shown in Table 3.
From Table 3, the results shows that the framework DGG based on CANNet has better performance than the framework based on CSRNet. Because the detection accuracy of CANNet is better than that of CSRNet, the high ‘ACC’ results from DGG-CANNet are reasonable.
This work also considers some extreme conditions, especially the darkness condition. Figure 10 shows the normal illumination, darkness, and the illumination-improved images. The normal illumination image was selected from the PETS2009 dataset. After reducing the brightness of the normal illumination image, the image with darkness can be obtained. It was found that some visual clues were hidden in the darkness. To solve the crowd gathering detection problem under such extreme conditions, image illumination-improved methods [42,43] were researched. The two methods can recover the illumination information to some extent. This step is considered data pre-processing.
In this work, method [42] was used to obtain the illumination-improved image, as the third image in Figure 10 shows. In the DGG framework, the darkness will affect the counting results of DCFG. Table 4 demonstrates the ‘ACC’ differences among the darkness, the illumination-improved, and the normal bright images. The ‘DGG-Darkness’ denotes the test of DGG in darkness. The ‘DGG-illumination-improved’ denotes the test of DGG under bright conditions. The ‘DGG-Normal-Illumination’ denotes the test of DGG under normal bright conditions.
From Table 5, it can be found that the illumination-improved image has higher detection accuracy than that observed for the darkness. When in dark environments, the DGG needs extra illumination-improved algorithms to obtain better quality images.

6. Conclusions

This work proposes a novel framework DGG based on crowd counting methods using deep learning approaches and statistics to detect crowd gathering. The DGG includes three different parts, i.e., DCFG, GAD, and GJ. The DCFG is proposed to find the frame index that has the maximum number based on the crowd counting method. This frame means that the crowd has gathered and the specific gathering area will be detected next. The GAD detects the local area that has the maximum crowd density in frames with a 3 × 3 slide search box. This local area is represented by grid coordinates, which means the crowd gathering happened in this area. Based on the detected results of the DCFG and the GAD, the GJ is proposed to analyze the statistical relationship between the local area and the global area to find the stable pattern for crowd gathering detection. Experiments show that the proposed framework has a good representation of gathering features and high detection accuracy.
Limitation and Future work. The DGG is as a data-driven method that can be combined with other abnormal human action analysis approaches to improve the detection accuracy. Although it had good performance for existing datasets, it still has many challenges in real world scenes. There are some similar actions with crowd gathering, such as people passing the road in two opposite directions, which needs to be distinguished. In the future, the stable pattern for human crowd gathering may be transferred to other animal gathering detection and animal protection approaches.

Author Contributions

Conceptualization, J.X., H.Z. and W.M.; methodology, J.X., H.Z. and W.M.; software, J.X., H.Z. and Y.Z.; formal analysis, J.X., H.Z. and Q.F.; writing—original draft preparation, J.X., H.Z. and Y.Z.; writing—review and editing, H.Z., Y.Z. and Q.F.; supervision, W.M. All authors have read and agreed to the published version of the manuscript.

Funding

This work was supported by the National Natural Science Foundation of China (Grant No. 62076117 and No. 61762061) and Jiangxi Key Laboratory of Smart City (Grant No. 20192BCD40002).

Institutional Review Board Statement

Not applicable.

Informed Consent Statement

Not applicable.

Data Availability Statement

Not applicable.

Conflicts of Interest

The authors declare no conflict of interest.

References

  1. Swathi, H.Y.; Shivakumar, G.; Mohana, H.S. Crowd behavior analysis: A survey. In Proceedings of the 2017 International Conference on Recent Advances in Electronics and Communication Technology (ICRAECT), Bangalore, India, 16–17 March 2017; pp. 169–178. [Google Scholar]
  2. Li, T.; Chang, H.; Wang, M.; Ni, B.; Hong, R.; Yan, S. Crowded scene analysis: A survey. IEEE Trans. Circuits Syst. Video Technol. 2015, 25, 367–386. [Google Scholar] [CrossRef] [Green Version]
  3. Hsu, W.; Wang, Y.; Lin, C. Abnormal crowd event detection based on outlier in time series. In Proceedings of the 2014 International Conference on Machine Learning and Cybernetics (ICMLC), Lanzhou, China, 13–16 July 2014; pp. 359–363. [Google Scholar]
  4. Yang, D.; Liu, C.; Liao, W.; Ruan, S. Crowd gathering and commotion detection based on the stillness and motion model. Multimed. Tools Appl. 2020, 79, 19435–19449. [Google Scholar] [CrossRef]
  5. Liu, C.; Liao, W.; Ruan, S. Crowd gathering detection based on the foreground stillness model. IEICE Trans. Inf. Syst. 2018, 101, 1968–1971. [Google Scholar] [CrossRef] [Green Version]
  6. Alqaysi, H.; Sasi, S. Detection of abnormal behavior in dynamic crowded gatherings. In Proceedings of the 2013 IEEE Applied Imagery Pattern Recognition Workshop (AIPR), Washington, DC, USA, 23–25 October 2013; pp. 1–6. [Google Scholar]
  7. Sang, H.; Chen, Y.; He, D. Crowd gathering and running behavior detection based on overall features. J. Optoelectron. Laser. 2016, 27, 52–60. [Google Scholar]
  8. Xiong, G.; Wu, X.; Chen, Y.; Ou, Y. Abnormal crowd behavior detection based on the energy model. In Proceedings of the 2011 IEEE International Conference on Information and Automation (ICIA), Shenzhen, China, 6–8 June 2011; pp. 495–500. [Google Scholar]
  9. Xiong, G.; Cheng, J.; Wu, X.; Chen, Y.; Ou, Y.; Xu, Y. An energy model approach to people counting for abnormal crowd behavior detection. Neurocomputing 2012, 83, 121–135. [Google Scholar] [CrossRef]
  10. Moria, K.; Albu, A.; Wu, K. Computer vision-based detection of violent individual actions witnessed by crowds. In Proceedings of the 2016 Conference on Computer and Robot Vision (CRV), Victoria, BC, Canada, 1–3 June 2016; pp. 303–310. [Google Scholar]
  11. Liu, S.; Xue, H.; Xu, C.; Fang, K. Abnormal behavior detection based on the motion-changed rules. In Proceedings of the 2020 IEEE International Conference on Signal Processing (ICSP), Beijing, China, 6–9 December 2020; pp. 146–149. [Google Scholar]
  12. Chondro, P.; Liu, C.; Chen, C.; Ruan, S. Detecting abnormal massive crowd flows: Characterizing fleeing en masse by analyzing the acceleration of object vectors. IEEE Consum. Electron. Mag. 2019, 8, 32–37. [Google Scholar] [CrossRef]
  13. Fradi, H.; Dugelay, J. Spatial and temporal variations of feature tracks for crowd behavior analysis. J. Multimodal User Interfaces 2016, 10, 307–317. [Google Scholar] [CrossRef]
  14. Phule, S.; Sawant, S. Abnormal activities detection for security purpose unattainded bag and crowding detection by using image processing. In Proceedings of the 2017 International Conference on Intelligent Computing and Control Systems (ICICCS), Madurai, India, 15–16 June 2017; pp. 1069–1073. [Google Scholar]
  15. Liao, H.; Xiang, J.; Sun, W.; Feng, Q.; Dai, J. An abnormal event recognition in crowd scene. In Proceedings of the 2011 International Conference on Image and Graphics (ICIG), Anhui, China, 12–15 August 2011; pp. 731–736. [Google Scholar]
  16. Xie, S.; Zhang, X.; Cai, J. Video crowd detection and abnormal behavior model detection based on machine learning method. Neural Comput. Appl. 2018, 31, 175–184. [Google Scholar] [CrossRef]
  17. Zhao, H.; Min, W.; Xu, J.; Han, Q.; Wang, Q.; Yang, Z.; Zhou, L. SPACE: Finding key-speaker in complex multi-person scenes. IEEE Trans. Emerg. Topics Comput. 2021. [Google Scholar] [CrossRef]
  18. Zhao, H.; Min, W.; Xu, J.; Wang, Q.; Zou, Y.; Fu, Q. Scene-adaptive crowd counting method based on meta learning with dual-input network DMNet. Front. Comput. Sci. 2021. [Google Scholar] [CrossRef]
  19. Wang, Q.; Min, W.; Han, Q.; Liu, Q.; Zha, C.; Zhao, H.; Wei, Z. Inter-domain adaptation label for data augmentation in vehicle re-identification. IEEE Trans. Multimed. 2021. [Google Scholar] [CrossRef]
  20. Tay, N.; Tee, C.; Ong, T.; Teh, P. Abnormal behavior recognition using CNN-LSTM with attention mechanism. In Proceedings of the 2019 International Conference on Electrical, Control and Instrumentation Engineering (ICECIE), Kuala Lumpur, Malaysia, 25–25 November 2019; pp. 1–5. [Google Scholar]
  21. Cao, B.; Xia, H.; Liu, Z. A video abnormal behavior recognition algorithm based on deep learning. In Proceedings of the 2021 Advanced Information Management, Communicates, Electronic and Automation Control Conference (IMCEC), Chongqing, China, 18–20 June 2021; pp. 755–759. [Google Scholar]
  22. Bai, L.; Wu, C.; Xie, F.; Wang, Y. Crowd density detection method based on crowd gathering mode and multi-column convolutional neural network. Image Vis. Comput. 2021, 105, 104084. [Google Scholar] [CrossRef]
  23. Gupta, T.; Nunavath, V.; Roy, S. CrowdVAS-net: A deep-CNN based framework to detect abnormal crowd-motion behavior in videos for predicting crowd disaster. In Proceedings of the 2019 international conference on Systems, Man and Cybernetics (SMC), Bari, Italy, 6–9 October 2019; pp. 2877–2882. [Google Scholar]
  24. Xu, Y.; Lu, L.; Xu, Z.; He, J.; Zhou, J.; Zhang, C. Dual-channel CNN for efficient abnormal behavior identification through crowd feature engineering. Mach. Vis. Appl. 2019, 30, 945–958. [Google Scholar] [CrossRef] [Green Version]
  25. Gao, Z.; Wang, Y.; Liu, X.; Li, T.; Li, B.; He, J. On the analysis of multi-point crowd gathering in designated areas. In Proceedings of the 2019 International Conference on Intelligent Computing, Automation and Systems (ICICAS), Chongqing, China, 6–8 December 2019; pp. 344–349. [Google Scholar]
  26. Zhao, R.; Liu, Q.; Li, C.; Dong, D.; Hu, Q.; Ma, Y. Fuzzy neural network based scenario features extraction and mapping model for crowd evacuation stability analysis. In Proceedings of the 2018 International Seminar on Computer Science and Engineering Technology (SCSET), Shanghai, China, 17–19 December 2018; p. 032022. [Google Scholar]
  27. Liu, S.; Xie, K. Research on crowd gathering risk identification based on cell sensor and face recognition. In Proceedings of the 2015 International Conference on Industrial Informatics-Computing Technology, Intelligent Technology, Industrial Information Integration, Wuhan, China, 3–4 December 2015; pp. 201–204. [Google Scholar]
  28. Zhao, M.; Zhang, C.; Zhang, J.; Porikli, F.; Ni, B.; Zhang, W. Scale-aware crowd counting via depth-embedded convolutional neural networks. IEEE Trans. Circuits Syst. Video Technol. 2019, 30, 3651–3662. [Google Scholar] [CrossRef]
  29. Sam, D.; Peri, S.; Sundararaman, M.; Kamath, A.; Radhakrishnan, V. Locate, size and count: Accurately resolving people in dense crowds via detection. IEEE Trans. Pattern Anal. Mach. Intell. 2021, 43, 2739–2751. [Google Scholar]
  30. Wu, X.; Zheng, Y.; Ye, H.; Hu, W.; Ma, T.; Yang, J.; He, L. Counting crowds with varying densities via adaptive scenario discovery framework. Neurocomputing 2020, 397, 127–138. [Google Scholar] [CrossRef]
  31. Zheng, H.; Lin, Z.; Cen, J.; Wu, Z.; Zhao, Y. Cross-line pedestrian counting based on spatially-consistent Two-stage local crowd density estimation and accumulation. IEEE Trans. Circuits Syst. Video Technol. 2019, 29, 787–799. [Google Scholar] [CrossRef]
  32. Yang, B.; Zhan, W.; Wang, N.; Liu, X.; Lv, J. Counting crowds using a scale-distribution-aware network and adaptive human-shaped kernel. Neurocomputing 2020, 390, 207–216. [Google Scholar] [CrossRef]
  33. Zou, Z.; Cheng, Y.; Qu, X.; Ji, S.; Guo, X.; Zhou, P. Attend to count crowd counting with adaptive capacity multi-scale CNNs. Neurocomputing 2019, 367, 75–83. [Google Scholar] [CrossRef] [Green Version]
  34. Jiang, S.; Lu, X.; Lei, Y.; Liu, L. Mask-aware networks for crowd counting. IEEE Trans. Circuits Syst. Video Technol. 2020, 30, 3119–3129. [Google Scholar] [CrossRef] [Green Version]
  35. Liu, Y.; Wen, Q.; Chen, H.; Liu, W.; He, S. Crowd counting via cross-stage refinement Networks. IEEE Trans. Image Process 2020, 29, 6800–6812. [Google Scholar] [CrossRef]
  36. Liu, W.; Salzmann, M.; Fua, P. Context-aware crowd counting. In Proceedings of the IEEE/CVF Conference on Computer Vision and Pattern Recognition (CVPR), Long Beach, CA, USA, 15–20 June 2019; pp. 5094–5103. [Google Scholar]
  37. Li, Y.; Zhang, X.; Chen, D. CSRNet: Dilated convolutional neural networks for understanding the highly congested scenes. In Proceedings of the IEEE/CVF Conference on Computer Vision and Pattern Recognition (CVPR), Salt Lake City, UT, USA, 18–23 June 2018; pp. 1091–1100. [Google Scholar]
  38. Ferryman, J.; Shahrokni, A. PETS2009: Dataset and challenge. In Proceedings of the 12th IEEE International Workshop on Performance Evaluation of Tracking and Surveillance (W PETS), Snowbird, UT, USA, 7–9 December 2009; pp. 1–6. [Google Scholar]
  39. Guan, Y.; Hu, W.; Hu, X. Abnormal behavior recognition using 3D-CNN combined with LSTM. Multimed. Tools Appl. 2021, 80, 18787–18801. [Google Scholar] [CrossRef]
  40. Xu, F.; Rao, Y.; Wang, Q. An unsupervised abnormal crowd behavior detection algorithm. In Proceedings of the 2017 International Conference on Security, Pattern Analysis, and Cybernetics (SPAC), Shenzhen, China, 15–17 December 2017; pp. 219–223. [Google Scholar]
  41. Gu, X.; Cui, J.; Zhu, Q. Abnormal crowd behavior detection by using the particle entropy. Optik 2014, 125, 3428–3433. [Google Scholar] [CrossRef]
  42. Zhang, Q.; Nie, Y.; Zheng, W. Dual illumination estimation for robust exposure correction. Comput. Graph. 2019, 38, 243–252. [Google Scholar] [CrossRef] [Green Version]
  43. Guo, X.; Li, Y.; Ling, H. LIME: Low-light image enhancement via illumination map estimation. IEEE Trans. Image Process 2017, 26, 982–993. [Google Scholar] [CrossRef]
Figure 1. The overview of the proposed DGG for crowd gathering detection.
Electronics 11 00031 g001
Figure 2. DCFG for finding the candidate frame.
Electronics 11 00031 g002
Figure 3. GAD for finding the gathering area.
Electronics 11 00031 g003
Figure 4. GJ for detecting the gathering action.
Electronics 11 00031 g004
Figure 5. The examples of the PETS2009 dataset.
Electronics 11 00031 g005
Figure 6. The curves of crowd gathering areas and other areas in four views. The blue curve denotes the crowd gathering area and the orange curve denotes the other areas.
Electronics 11 00031 g006
Figure 7. The examples and the statistical results of three abnormal crowd actions.
Electronics 11 00031 g007
Figure 8. The original and final filtering results of crowd gathering and other crowd actions.
Electronics 11 00031 g008
Figure 9. The detection results of DGG on the PETS2009 dataset. (Upper-left): view 1; (Upper-right): view 2; (Bottom-left): view 3; (Bottom-right): view 4.
Electronics 11 00031 g009
Figure 10. The examples of the normal illumination, darkness, and the illumination-improved image.
Electronics 11 00031 g010
Table 1. The comparative results of different methods in considering the inner feature of crowds, fitting in complex scenes, and the robustness.
Methods Inner-Feature of Crowd Fitting in Complex Scenes Robustness
[4]××
[5]××
[11]×
[13]××
[21]×
[23]××
[24]××
[25]×
DGG
Table 2. The detection results for four views of the proposed methods.
ViewTPTNFPFNTPRFPRACCRecallPrecisionF1
12131545697.26%3.14%97.09%97.26%97.71%97.48%
22161514796.86%2.58%97.09%96.86%98.18%97.52%
321414016896.40%10.26%93.65%96.40%93.04%94.69%
420015102788.11%092.86%88.11%193.68%
Table 3. Comparisons with the SOTAs.
ACC
MethodsView 1View 2View 3View 4Average
[40]84.39%82.28%68.79%\78.49%
[41]82.01%\77.78%\79.90%
[5]89.92%91.24%87.79%85.67%88.66%
[4]93.90%94.16%88.33%87.80%91.05%
Ours97.09%97.09%93.65%92.86%95.17%
Table 4. The ‘ACC’ results of two different crowd counting methods.
MethodsView 1View 2View 3View 4
DGG-CSRNet93.92%95.24%91.27%88.62%
DGG-CANNet97.09%97.09%93.65%92.86%
Table 5. The ‘ACC’ results among the darkness, illumination-improved, and the normal bright conditions for View 1 of the PETS2009 dataset.
MethodsAverage
DGG-Darkness72.75%
DGG-Illumination-improved83.33%
DGG-Normal-Illumination97.09%
Publisher’s Note: MDPI stays neutral with regard to jurisdictional claims in published maps and institutional affiliations.

