Abstract
Detecting anomalous inputs is essential in many mission-critical systems in various domains, particularly cybersecurity. In particular, deep neural network-based anomaly detection methods have been successful for anomaly detection tasks with the recent advancements in deep learning technology. Nevertheless, the existing methods have considered somewhat idealized problems where it is enough to learn a single detector based on a single dataset. In this paper, we consider a more practical problem where multiple hosts in an organization collect their input data, while data sharing among the hosts is prohibitive due to security reasons, and only a few of them have experienced abnormal inputs. Furthermore, the data distribution of the hosts can be skewed; for example, a particular type of input can be observed by a limited subset of hosts. We propose the federated hypersphere classifier (FHC), which is a new anomaly detection method based on an improved hypersphere classifier suited for running in the federated learning framework to perform anomaly detection in such an environment. Our experiments with image and network intrusion detection datasets show that our method outperforms the state-of-the-art anomaly detection methods trained in a host-wise fashion by learning a consensus model as if we have accessed the input data from all hosts but without communicating such data.
1. Introduction
Anomaly detection is a task to identify and detect abnormal instances dissimilar to normal instances and therefore not conforming to expected patterns in normal situations [1]. Anomaly detection plays a crucial role in various mission-critical applications such as network intrusion detection [2,3,4], system behavior monitoring [5,6,7], disease detection in medical domains [8,9,10,11], and defect detection in manufactured projects [12,13,14], just to name a few. Anomaly detection is attracting more attention, especially in cybersecurity, as the necessity and importance of related research are increasing as cyber-attacks evolve rapidly in their volume, velocity, and variety, where attacks tend to become harder to detect [15,16].
Before the advent of machine learning, statistical methods such as profile-based [17] and rule-based methods [18] had been widely used for anomaly detection. Machine learning methods are now replacing classical anomaly detection methods. In particular, the one-class SVM (OC-SVM) [19] is one of the first trials to adapt binary classifiers for anomaly detection, finding the optimal hyperplane that characterizes normal data. The support vector data description (SVDD) [20] changes the shape of the decision function from a hyperplane to a hypersphere and finds the optimal hypersphere that circumscribes the normal data. Other popular approaches include isolation forest based on random forest [21] and PCA-based anomaly detection [22].
More recently, anomaly detection methods based on deep neural networks (DNNs) [23] have been successful, outperforming their predecessors in various domains. In particular, Ruff et al. [24] suggested a new idea to substitute the kernel function in SVDD with a DNN to provide the necessary input transformation for optimal decision making. This work has initiated a new wave of related research to design new anomaly detection methods benefiting from the advancement of deep learning research. In particular, anomaly detection based on deep learning has been studied and applied quite actively recently in the cybersecurity domain, for example, intrusion detection for cyber-physical systems [25,26,27], attack detection in smart grids [28,29], and vehicle network intrusion detection [30,31,32], to name a few.
Most of the existing works on anomaly detection focus on an environment where all training data exist in one place in a single host or a storage unit of a data center. However, recent technologies such as smart grids [16,33,34] or IoT devices [35,36] have increased the need for training AI models in a distributed fashion. In particular, the data centralization can cause considerable network traffic and monetary cost for data storage [37]. Another issue of data centralization is that it can impair confidentiality or data privacy [38].
Therefore, this paper proposes a novel anomaly detection method suitable for such distributed environments where training data can exist in multiple hosts where sharing training data is not plausible. To be more specific, each host in such an environment tends to have a minimal number of data compared to the case where one may gather data from all hosts into one location [39,40]. In addition, we assume that abnormal inputs are scarce; in particular, a large number of hosts may not have experienced any intrusion and therefore have no abnormal instances in their data set. In addition, a host may not have experienced all types of inputs, having a skewed distribution of training instances [41]. Our method is based on federated learning [42] and an improved version of the hypersphere classifier (HSC) [43] we have tailored for the federated learning environment so that we can learn a better anomaly detector in the multi-host environment discussed above. Our contribution can be summarized as follows:
- We propose the federated hypersphere classifier (FHC), which is a novel federated learning-based anomaly detection method for a multi-host environment where data sharing is limited, the data distributions of hosts are skewed, and only a few hosts contain anomaly data.
- We introduce a new version of the hypersphere classifier suited for federated learning. By modifying the objective function to include the radius variable, it is possible to find an optimal consensus radius, which is necessary for decision making in anomaly detection.
- We demonstrate our proposed method in a multi-host environment where the data distributions of hosts are skewed, and only a few hosts contain anomaly data. The results show that our method detects anomalies far more accurately than the state-of-the-art single-host alternatives.
2. Related Works
This section briefly introduces related works in anomaly detection and the federated learning framework.
2.1. Anomaly Detection
We discuss anomaly detection methods, grouping them into two categories depending on whether they have used deep learning technology.
2.1.1. Classical Anomaly Detection
In the early days, statistical profiling methods [17] and rule-based methods [18] were frequently used as anomaly detection methods. The statistical profile-based anomaly detection method profiles normal behaviors and detects anomalies or uncharted behaviors if they deviate from normal behaviors with statistical significance. The rule-based anomaly detection method is a method that captures suspicious circumstances with data or patterns that differ from normality based on predetermined rules, and it has been widely applied to intrusion detection systems.
Before deep learning came into the spotlight, there were studies on machine learning-based anomaly detection methodologies. Scholkopf et al. [19] proposed the one-class SVM (OC-SVM) based on the support vector machine algorithm (SVM) [44] with kernel function to position the normal data away from the origin and find the hyperplane that distinguishes the normal from the anomaly. Tax and Duin [20] proposed the support vector data description (SVDD), which uses a kernel function to map normal data into a hypersphere with a minimum radius. SVDD suggested the direction of anomaly detection technique based on the minimum enclosing ball (MEB) problem minimizing the hypersphere circumscribing normal data in the latent space. In another direction, the isolation forest [21] based on a random forest has been proposed. Isolation forest takes advantage of the fact that abnormal data in each tree are separated as outer leaves than normal data. Furthermore, there were studies on anomaly detection methods based on principal component analysis (PCA) [45]. Given a high-dimensional input, PCA finds a subspace that maintains the highest variance, and one can find anomalies if the reconstructed data from the subspace is far from the original data. Lakhina et al. [22] and Ringberg et al. [46] used PCA for modeling the normal traffic and detecting the outliers.
2.1.2. Deep Learning-Based Anomaly Detection
Recently, as deep neural networks have achieved remarkable success in various domains, numerous anomaly detection methods based on deep neural networks are being studied. One direction is to use deep auto-encoders (AEs) [47]. AE-based anomaly detection methods use the AE learned only with normal data, for which the reconstruction error will be high when the given input does not fit the characteristic of normal inputs. This type of method has further developed, for example, to use the variational autoencoders [48], apply the Gaussian mixture model to a neural network [49], and learn normality regularized by a memory network in the AE [50]. On the other hand, Ruff et al. [24] proposed DeepSVDD, which uses a neural network in place of the feature mappings of SVDD so that a suitable representation of normal data can be learned directly without relying on kernel tricks [51] to represent feature mappings implicitly. Based on DeepSVDD, Hojjati and Armanfard [52] proposed DASVDD recently, which is the unsupervised anomaly detector that optimizes AE and the hypersphere simultaneously.
Furthermore, deep generative models have been adopted for robust anomaly detection. For example, Schlegl et al. [53] proposed AnoGAN, using the generative adversarial nets (GANs) [54] to learn a generator that can create new examples similar to the normal data. Despite its benefits, AnoGAN needs to find the optimal latent vector that generates a sample most similar to a given input for detection; this procedure is inherently iterative and computationally expensive. Schlegl et al. [55] tried to improve the computation issue of AnoGAN by using an auxiliary AE to perform the inversion from an input to a latent vector. Audibert et al. [7] tried to address an issue of AE-based anomaly detection that reconstruction error-based detection is not sensitive enough to find anomalies similar to normal data. Goyal et al. [56] proposed DROCC, which augments anomaly data using adversarial perturbation [57]. However, the method requires tuning various hyperparameters so that generated samples will work as abnormal data.
More recently, several methods tried to bring the idea of semi-supervised learning [58,59,60] into anomaly detection. Hendrycks et al. [61] proposed the outlier exposure (OE) that uses an auxiliary dataset of outliers to train the model to detect unseen anomalies. The trend has been followed by the DeepSAD [62] and the hypersphere classifier (HSC) [43] methods. DeepSAD uses a modified objective function of DeepSVDD, adding a loss term on the anomaly data and adjusting the balance between the loss terms for the anomaly and normal data. HSC reformulates the objective for finding the minimum enclosing ball of normal data into another form similar to the binary cross-entropy loss [63] by adding a loss term for abnormal data and applying the radial basis function [64]. However, both DeepSAD and HSC heavily depend on hyperparameters for decision making (such as the center and the radius of the hypersphere) that require anomaly data for tuning. Therefore, when hosts without anomaly data exist, as in the multi-host environment we consider in this paper, one needs to make a good guess about these hyperparameters to apply these methods to those hosts. This paper suggests transforming the objective of HSC (we chose HSC since it performed better than DeepSAD in the multi-host setting) to include its hyperparameters as training variables so that they can be learned by federated learning.
2.2. Federated Learning
Federated learning [42,65] is a machine learning framework that allows multiple hosts to train a global model under the orchestration of a central server while keeping the training data of each host locally. Each host participating in federated learning shares the same learning objective and optimizes local model weights with their local data, and the central server aggregates local weights to compute global model weights.
FedAvg [42] is one of the most popular federated learning algorithms aggregating global model weights by averaging updated model weights from participating hosts. Let denote the local dataset composed of input data and the corresponding true labels , denote the neural network to train, and denote the local weight of the h-th client. Each host solves the following learning problem:
where is a loss function. Here, we assume there are H different hosts; then, the objective of federated learning becomes:
where denotes the number of instances in the h-th host and N is the number of whole data instances contained in the H hosts.
Since the concept of federated learning has emerged, research on more advanced federated learning techniques has been conducted. Specifically, FedOpt [66] advanced the FedAvg algorithm to the federated version of adoptive optimizers such as Adagrad [67] or Adam [68], and FedNova [69] added the normalized averaging method in the aggregation stage. These works focused on overcoming the heterogeneity of clients’ data participating in federated learning in common. Furthermore, there were attempts to overcome issues from non-IID data distributions with federated learning optimized for individual client data through model personalization. For example, FedProx [70] introduced the proximal term to the federated learning in order to minimize the distance between the global model weight and local model weight. In addition, there were trials to modify the model structure into a suitable form for personalization, such as personalized models [71] or using hypernetworks [72]. Nevertheless, the basic framework of those works does not deviate much from the concept of FedAvg.
Some studies have considered federated learning for anomaly detection. DIoT [73] applied federated learning for detecting compromised IoT devices from their behavior profiles. MT-DNN-FL [74] is a multi-task network anomaly detection based on federated learning to deal with the scarcity of available learning data. P2PK-SMOTE [75] suggested anomaly detection for the IoT environment where host data may not follow the identical distribution or sampling may not be independent. They focused on balancing the number of normal and abnormal instances using the SMOTE method [76]. However, none of these research studies has considered transforming the underlying anomaly detection method to fit for finding an optimal global detector by federated learning in the multi-host environment, where many hosts cannot optimize some variables critical for decision making due to the lack of anomaly data. To the best of our knowledge, no study exists addressing the issues in the existing single-host anomaly detectors when applied to the multi-host environment where only a few hosts include anomalous data. Table 1 compares the existing federated learning frameworks and anomaly detection methods with our method in several perspectives.

Table 1.
Comparison of anomaly detection methods.
3. Methods
This section formally describes our proposed method FHC, a novel hypersphere classifier for anomaly detection in the multi-host environment based on federated learning.
3.1. Multi-Host Environment
We consider the multi-host environment with the following characteristics:
- Multiple hosts store a certain type of data available to train anomaly detectors to detect normal and abnormal inputs or activities.
- The hosts are connected in a network, where exchanging training data is prohibited for privacy or security reasons.
- All hosts contain normal data, whereas only a few hosts have abnormal samples due to the rarity of such events. Furthermore, the distribution can be skewed; for example, normal samples from a host may not cover all types of normal data.
3.2. Notation
Let denote the local data of the h-th host with and , where and indicate normal and abnormal instances, whose numbers are and , respectively. Our method tries to learn the global model consisting of an embedding neural network and a hypersphere mapping neural network , where and are learning parameters. For the simplicity of our discussion in the sequel, we use a short-hand notation in place of considering and also drop the subscript h in and .
3.3. Hypersphere Classifier
The hypersphere classifier (HSC) [43] is one of the latest anomaly detection methods that uses the minimum enclosing ball (MEB) of normal data for decision making as in SVDD [20] while adopting the idea of outlier exposure [61] to use anomaly samples in training to improve detection performance. In particular, HSC uses a loss function similar to the regular binary cross-entropy loss function: HSC replaces the sigmoid function in the regular binary cross-entropy loss with the radial basis function in order to obtain a spherical decision boundary. The HSC objective function is as follows:
If there are no abnormal data (with ) in a host, the expression (1) simplifies to the same objective function of DeepSVDD [24] with the center . When abnormal data exist in the training data, the second term of (1) maximizes the distance between the center and abnormal data to be mapped to outside the hypersphere. Still, a radius hyperparameter R needs to be tuned, which determines the boundary between normal and abnormal data: this task usually requires some abnormal data in the validation set for good detection performance. However, as discussed in Section 2.1.2, if some hosts do not have abnormal data, it becomes difficult to tune the radius hyperparameter.
3.4. Proposed Method: Federated Hypersphere Classifier
In the multi-host environment discussed in Section 3.1, a straightforward approach will be to learn an anomaly detector for each host separately. However, this approach may not be ideal: first, each host cannot benefit from data stored in other hosts. The detection performance of machine-learning methods tends to increase as the size of the training set increases. In particular, a host may encounter unseen normal and abnormal types of data in the future. Therefore, it will be beneficial to use training data with various types of possible normal and abnormal data. Secondly, if a host has not experienced an anomaly, it becomes hard to tune some critical learning parameters for the host, such as the radius of the HSC classifier. One may use a detector trained by another host, but the detector may still suffer from the first issue discussed above.
As we have seen in Section 2.2, we believe that federated learning can serve as a good solution for the multi-host environment so that each host can benefit from data stored in other hosts without communicating with them directly. We modified the objective of HSC for the federated learning environment as follows:
where n and m denote the number of normal and abnormal instances of a host, respectively, and is the distance between the latent vector of and the center c. Our idea is to include both the center c and the radius R of the minimum enclosing ball in the training objective, and therefore, these parameters can be learned by federated learning benefiting from data in all hosts. The first term in the objective is to force for normal data, and the second term is to satisfy for abnormal data so that the detection can be done accurately using the distance from the center c in the latent space with the threshold R.
Algorithm 1 shows the federated learning algorithm based on FedAvg [42] and the modified HSC loss (2) to learn our proposed federated hypersphere classifier (FHC). Our algorithm trains a global model in an iterative manner, where each iteration consists of two parts. In the first part, each host updates the local versions of learning parameters using their training data, minimizing the objective function (2). When a host includes both normal and abnormal instances, we update the learning parameters in an alternating fashion repeating the following steps:
- Step 1. We fix the radius R and update the model parameter and the center c so that is minimized for normal instances and maximized for abnormal instances.
- Step 2. We fix the model parameter and the center c and update the radius R.
In this case, we use the fact that the optimal c and R can be determined by and to reduce computational cost.
| Algorithm 1 The federated hypersphere classifier (FHC) algorithm |
| Require: hosts , host datasets , number of abnormal instances in each host , global model |
| Initialize: |
| global model ; global hypersphere center ; global hypersphere radius |
| procedure ServerUpdate |
| for each round do |
| for each host h in parallel do |
| Host update: |
| end for |
| Global model aggregation: |
| Global hyersphere center aggregation: |
| Global hyersphere radius aggregation: |
| end for |
| end procedure |
| procedure HostUpdate() |
| if then ▹ host with abnormal data |
| for each local epoch do |
| for batch do |
| (Step 1) |
| Fix the radius: |
| Optimize the model parameter: |
| Optimize the center: |
| (Step 2) |
| Fix the model parameter and the center: |
| Optimize the radius: |
| end for |
| end for |
| else ▹ host with no abnormal data |
| Compute the center: |
| Compute the radius: |
| end if |
| return |
| end procedure |
The second part of Algorithm 1 is the global model aggregation at the federation server. After the local training in each host, the server receives local optimal , , and , and it creates the consensus versions of , , and by aggregating their host-wise versions. In particular, the consensus versions are computed as weighted averages in the following way:
where N denotes the number of total training instances in all hosts and denotes the number of the h-th host’s training instances. Figure 1 shows the overall training process of our proposed method.
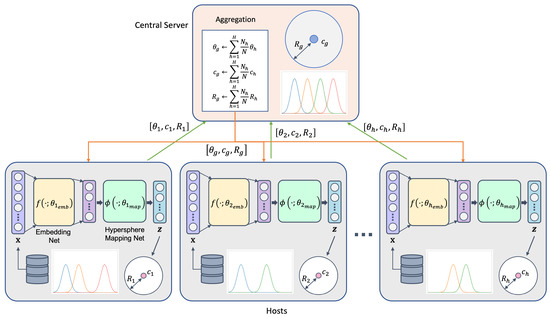
Figure 1.
An overview of training the proposed method, federated hypersphere classifier, based on the federated learning framework.
3.5. Computational Cost Analysis
Algorithm 1 is based on the FedAvg [42] algorithm. The original FedAvg uses H hosts from the total of hosts in each aggregation, repeated for the total of C rounds. Each host runs a minibatch SGD [77] with B local steps per round. The convergence result of FedAvg [65] requires assuming the convexity and the K-smoothness of the training objective function. When the variance of stochastic gradients is bounded above by , the convergence rate of FedAvg is .
In federated learning, we also need to consider computation and communication costs. The computation cost of each host differs depending on whether the host contains only normal data or it has both normal and abnormal data. When a host contains abnormal instances, we compute SGD twice to update , c, and R. On the other hand, if no abnormal instance is available, a host can skip one SGD run and explicitly compute c and R. As a result, we can reduce the total computational cost from of the original FedAvg to , where denotes the total number of hosts and is the number of hosts with abnormal instances.
To discuss communication cost, let be the dimension of all parameters combined and be the dimension of c, which we need to communicate. FedAvg communicates model parameters two times per round: a central server receives updated model parameters from each host, sending the aggregated parameters back to all hosts. The resulting communication cost is . In our case, if a host does not include abnormal instances, it only transmits the updated c and R. Therefore, the communication cost of FHC is .
4. Experiments
In this section, we demonstrate the benefits of our proposed method FHC by experiments in the multi-host environment discussed in Section 3.1.
4.1. Data Preparation
For our experiments, we use four popular benchmark datasets, consisting of two image datasets and two network intrusion detection datasets. Here, we provide brief explanations about each dataset:
- The MNIST [78] dataset consists of 10 classes of handwritten digits, and each data instance is a gray-scale image with pixels. The total number of the training set is 60,000, and the total number of the evaluation set is 10,000.
- CIFAR-10 [79] consists of 10 different classes of RGB-color images of objects and animals. It consists of 50,000 training and 10,000 evaluation examples.
- CICIDS-2017 [80] is a network traffic data collected for five days composed of 14 different types of attacks. There are a total of 655,364 attack instances and 2,271,397 benign instances.
- TON-IoT [81] is the Internet of Things dataset that comprises heterogeneous sources such as network data, telemetry data, and operating system logs. We use network traffic data with nine attack types, including DoS, DDoS, and backdoor attacks. The dataset contains 21,523,641 malicious and 796,380 benign instances.
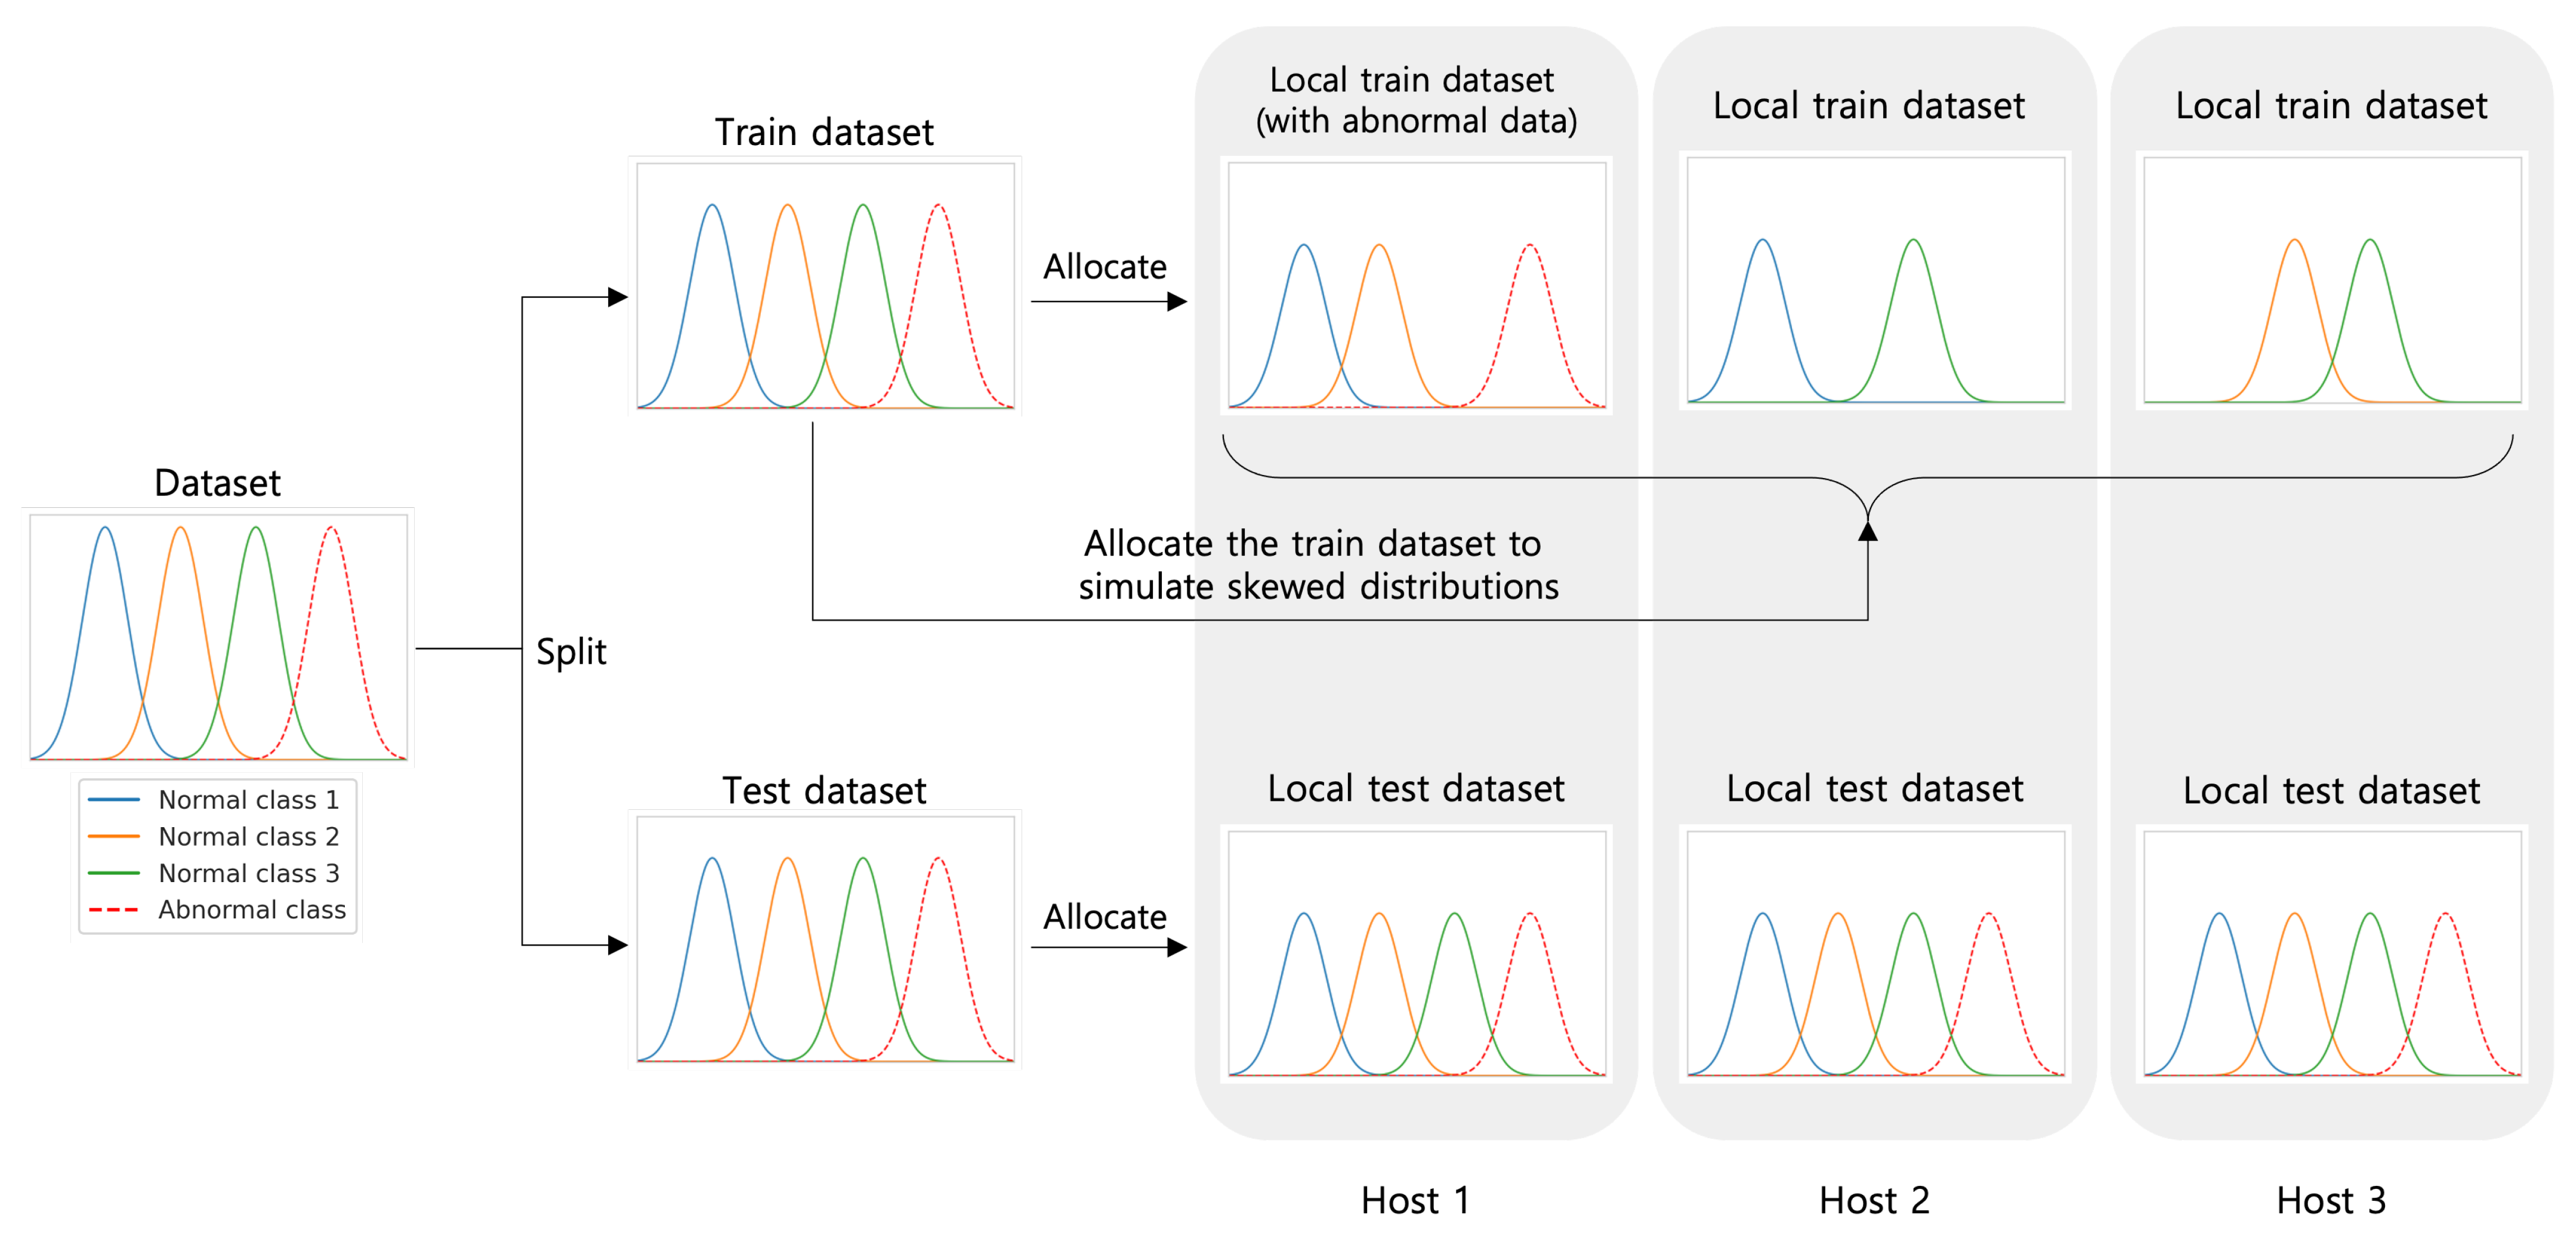
We use the original datasets to create anomaly detection problems, reflecting the multi-host environment discussed in Section 3.1. We create normal and abnormal data from the original datasets in the following fashion. MNIST and CIFAR-10: We select the class with the furthermost mean KL divergence from other classes in the original datasets as the abnormal data. The rest of the classes are considered normal data. As a result, the digit 1 of MNIST and the ‘Automobile’ class of CIFAR-10 were chosen as the abnormal data. CICIDS-2017 and TON-IoT: The datasets are composed of multiple attack classes and one benign class. Therefore, we combine all attack classes and use them as abnormal data. Furthermore, we use the k-means clustering algorithm [82] on the benign class to divide them into multiple groups of normal data, which we need to distribute normal classes among the hosts with minimal overlaps.
Finally, we distribute normal data among all hosts, choosing two (normal) classes for each host. We also assign abnormal data to only of the total number of hosts, adjusting their proportion to normal data in a selected host to be of the normal data, in order to simulate the rarity of abnormal instances. Finally, the testset for each host is created to have all normal and abnormal samples from the same distribution to test their detection performance against all possible types of future instances. Figure 2 shows an overview of our data preparation process. In addition, we summarize in Table 2 the average numbers of normal data of each host, also showing the average number of abnormal data for each selected host to contain abnormal data.
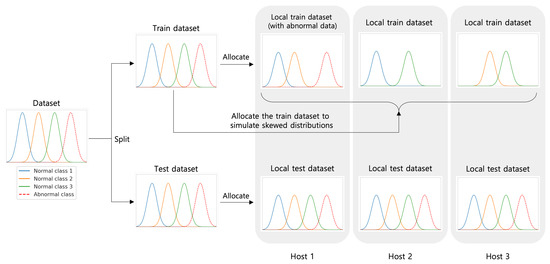
Figure 2.
An overview of host data preparation in our experiments. Training data: the original classes of benign samples are distributed among the hosts minimizing their overlap to simulate the heterogeneity of data distribution. Test data: all hosts experience the test data from the same distribution.
Table 2.
The average number of train, test, and validation data points in each host used for experiments.
4.2. Comparisons and Other Settings
We compare our proposed method FHC with the four latest deep anomaly detection methods: DeepSVDD [24], DeepSAD [62], DROCC [56], DASVDD [52], and HSC [43], where the former two are unsupervised, and the latter two are semi-supervised anomaly detection methods that take advantage of labeled abnormal data. These competing methods are trained host-wise; that is, a separate model is trained for each host using the training dataset of each host. Since anomaly detection methods are often hard to train with no anomaly data, we select the best model among the host-wise models based on the validation F1-score [83] and use it for evaluation in the hosts without abnormal data. For evaluation metrics, we use the area under the receiver operating characteristic curve (AUC) [84] and F1-score values.
For embedding data points, we use a convolutional neural network (CNN) model in the image datasets [24] and use the CNN-LSTM model [85] for the cybersecurity datasets. In addition, we use several fully connected (FC) layers to map embedded data to the hypersphere of our anomaly detector. Details of these networks and learning hyperparameters are described in Table 3.
Table 3.
Experimental settings of FHC for each dataset.
4.3. Experimental Results
In order to demonstrate the performance of our proposed method FHC, we report the mean AUC and F1-score on all hosts’ testsets in a multi-host environment we discussed in Section 4.1. Table 4 shows the performance of FHC and four competing anomaly detection methods on MNIST, CIFAR-10, CICIDS-2017, and TON-IoT datasets. Overall, the performance of FHC is higher than the other competing methods on all datasets. In particular, the AUC and F1-score of FHC are and higher than the second-best models on average, respectively. This shows that FHC is more effective than other methods in the multi-host environment. Since FHC can learn the consensus versions of c and R by benefiting from the data in all hosts, FHC has a good chance to achieve higher performance than other anomaly detection methods trained host-wise, even in the environment where the host data distributions are irregular. In addition, Table 4 reports the standard deviations of the AUC and F1-score. Since all hosts experience the test data from the same distribution, it is desirable that the detection model shows small variability in testing performance. The results show that FHC achieves the smallest deviation in almost all cases.
Table 4.
The detection performance evaluation on the MNIST, CIFAR-10, CICIDS-2017, and TON-IoT test datasets. The average values and the standard deviation in parentheses over hosts are shown. For each metric, the best result is shown in bold.
Furthermore, we observe that the AUC values of some competing methods are close to , which happens when the prediction results are almost uniformly random. For instance, in the case of the CICIDS-2017 dataset, the AUC values of competing methods are close to , which means that the models trained host-wise do not discriminate abnormal from normal data well in the multi-host environments. On the other hand, FHC records higher AUC than other methods. Specifically, the AUC values of FHC are , , , and higher than the second-best models on MNIST, CIFAR-10, CICIDS-2017, and TON-IoT, respectively, showing the advantage of our approach. We observe a similar trend in F1-score, where FHC achieved , , , and higher scores than the second-best models on MNIST, CIFAR-10, CICIDS-2017, and TON-IoT, respectively.
Nevertheless, insufficient training examples or a small proportion of hosts with abnormal data can prevent any method from achieving high prediction performance. Therefore, we further investigate the effect of these two factors in the following sections, focusing on the CICIDS-2017 dataset.
4.3.1. The Effect of the Number of Training Instances
We investigate the change in detection performance on the testset of each method with different numbers of training examples, using the CICIDS-2017 dataset. Here, we fix the proportion of hosts containing abnormal data to .
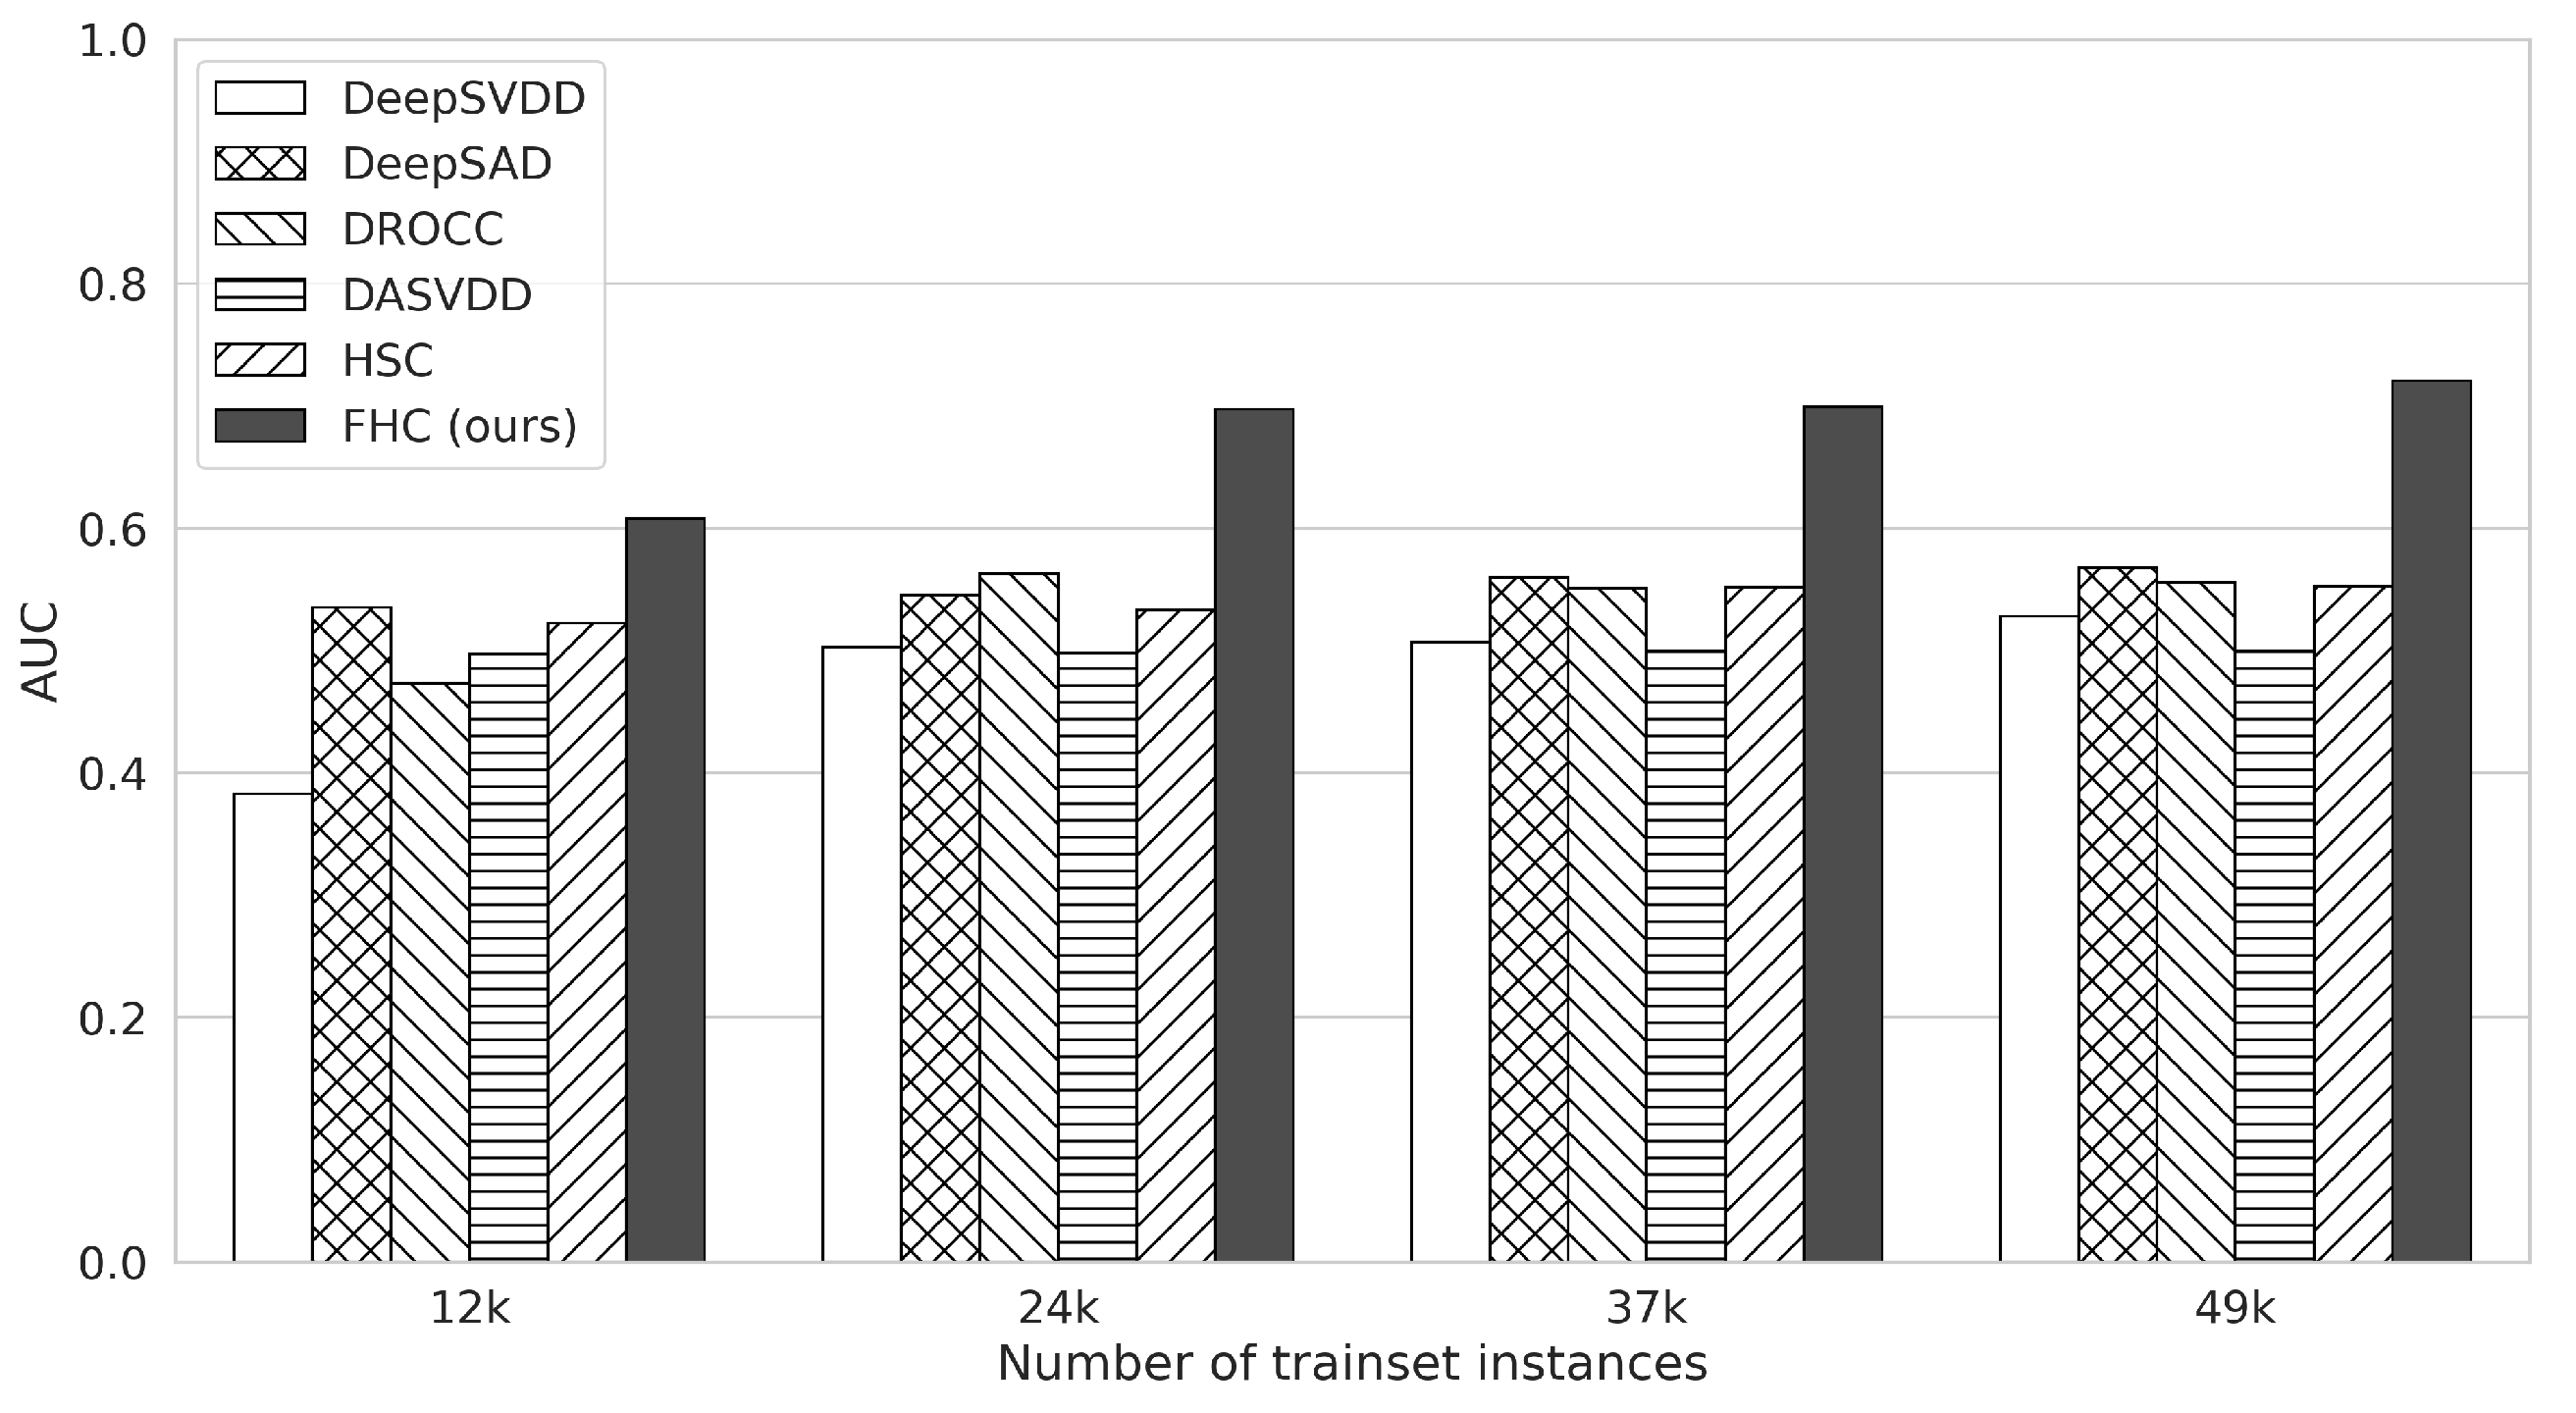
Figure 3 shows the AUC values of detection methods as we change the total number of training instances in the range of 12 k∼49 k, where 1 k is 1000. Here, FHC performs higher than the second-best competing method on average in all cases. In addition, our method shows more noticeable improvement than other methods with more training data: in particular, the average AUC of FHC increases by as the training examples increases from 12 k to 49 k, whereas the average increment of other methods is . This result shows that (i) FHC shows better performance even with a few training examples than other methods, and (ii) FHC can better use more training instances than other methods. However, we can also observe that the performance increase of FHC is marginal from the point where the number of training examples is 24 k. It turns out that the relatively small number of abnormal instances is one of the issues, as we discuss in the next section.

Figure 3.
The AUC results of each anomaly detection method according to different numbers of the training instances for the CICIDS-2017 dataset. The x-axis represents the total number of training instances in all hosts.
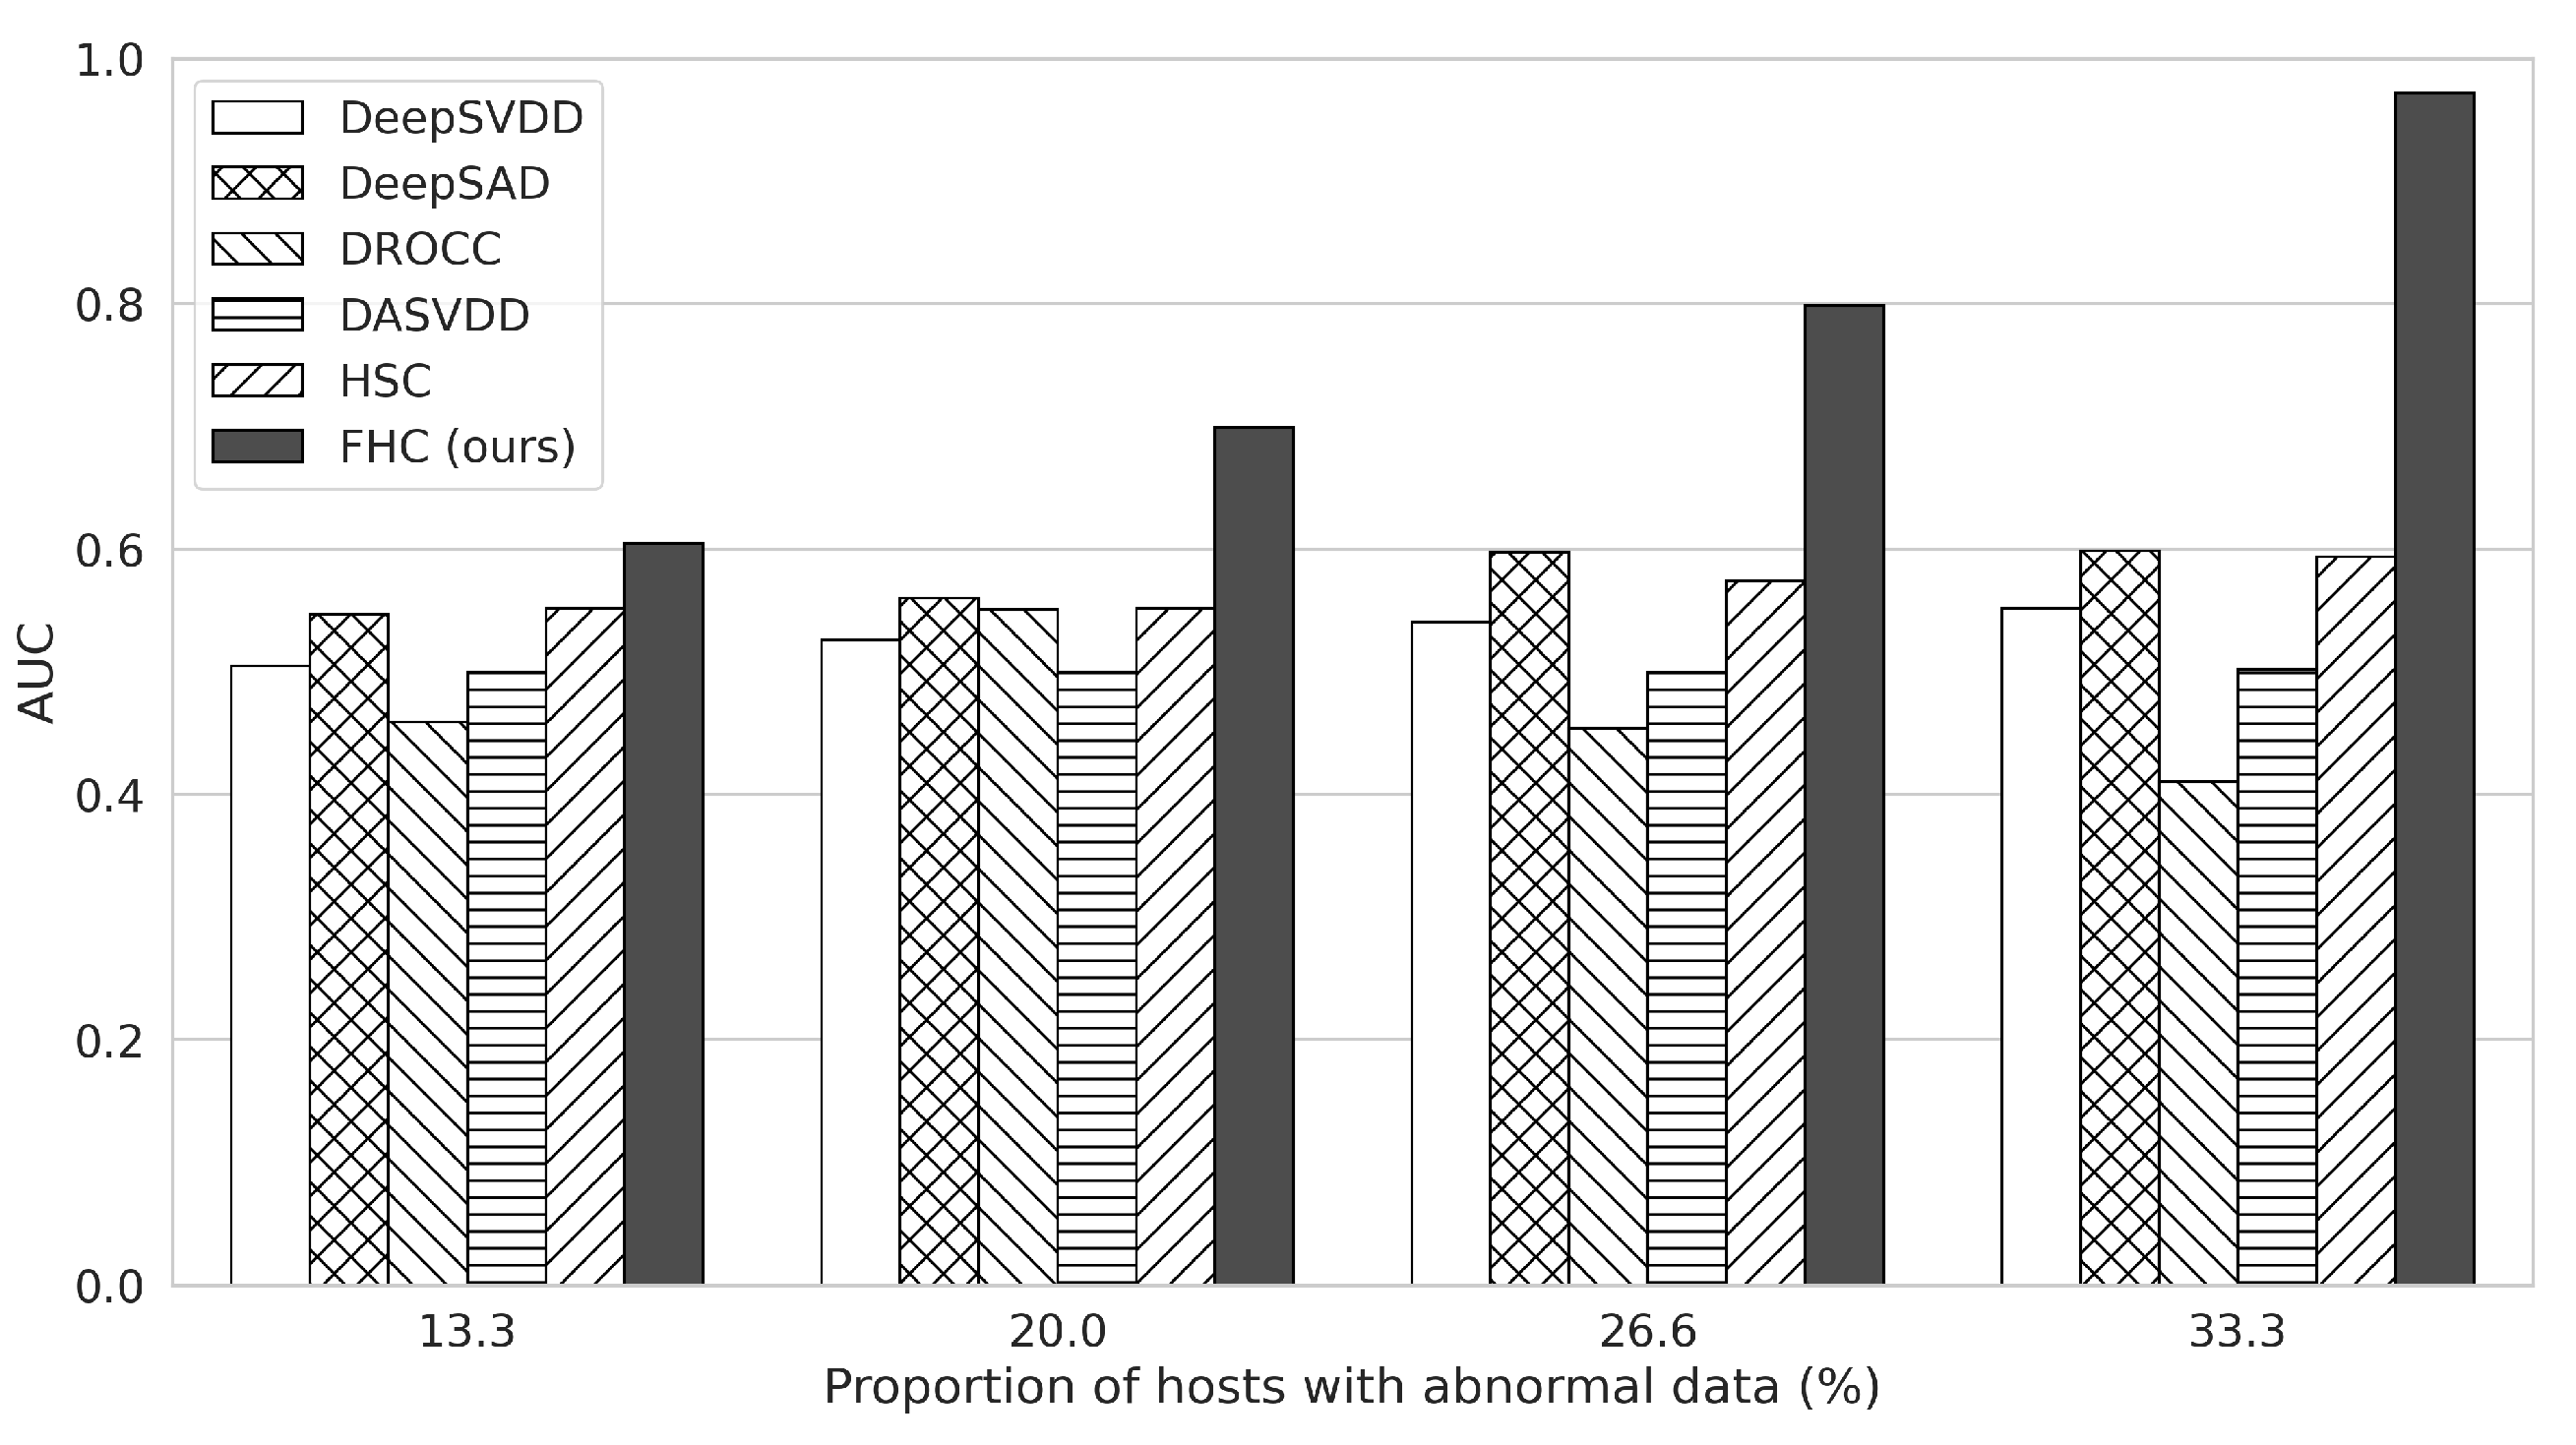
4.3.2. The Effect of the Proportion of Hosts with Abnormal Data
Figure 4 shows the trends of AUC values as we change the proportion of hosts containing abnormal data. We can check that the performance of FHC increases almost linearly as more hosts contain abnormal data, where such a trend is not observed in the competing methods. In particular, AUC is improved from to as the proportion of the hosts with abnormal data increases from to , whereas the other methods show almost no improvement. Overall, the AUC of FHC is higher than the second-best methods on average and higher than the second-best when of the hosts have abnormal data.

Figure 4.
The AUC results of each anomaly detection method according to the ratio of hosts including abnormal data for the CICIDS-2017 dataset. The x-axis represents the proportion of hosts containing abnormal data.
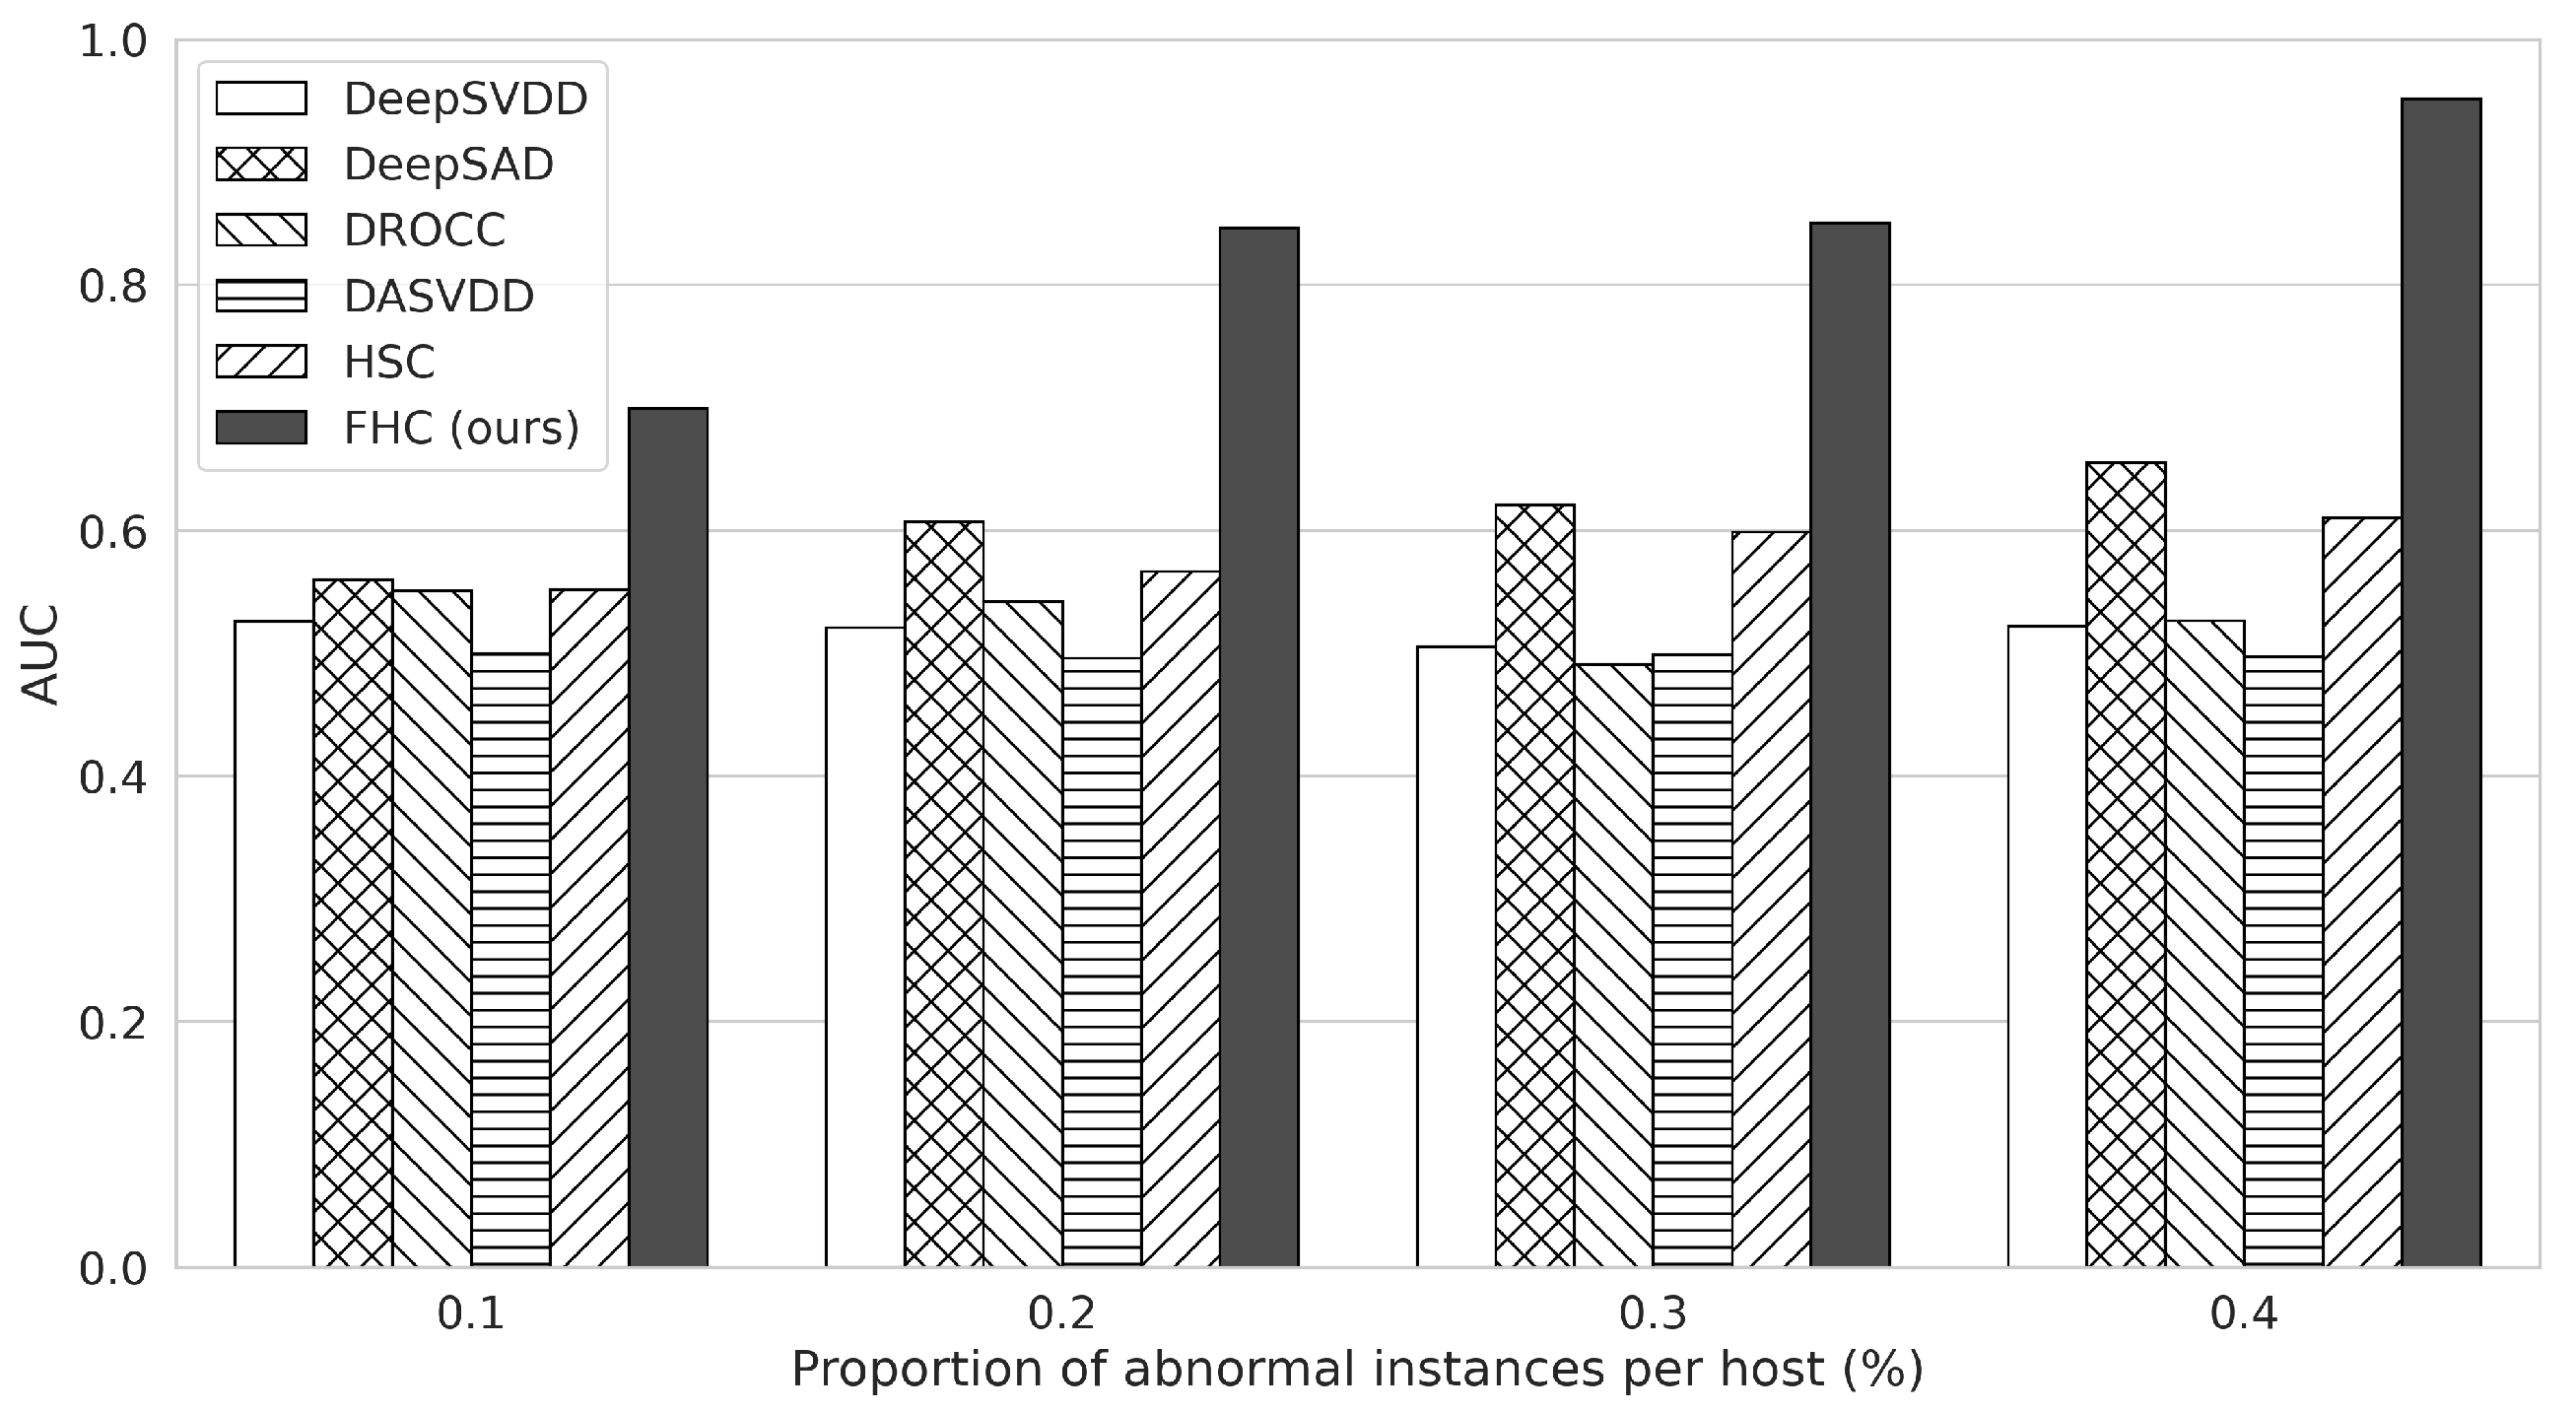
4.3.3. The Effect of the Proportion of Abnormal Instances per Hosts
Figure 5 demonstrates the AUC values according to the different proportions of abnormal data in each host. As the ratio of abnormal data increases from to , FHC’s AUC is improved from to , whereas other methods do not show noticeable improvements. In particular, the AUC of FHC is higher than the second-best method when the proportion of abnormal data is . This result indicates that FHC utilizes abnormal data better than other single-host anomaly detectors since FHC benefits from data in all hosts through global model aggregation and, consequently, shows the highest performance.
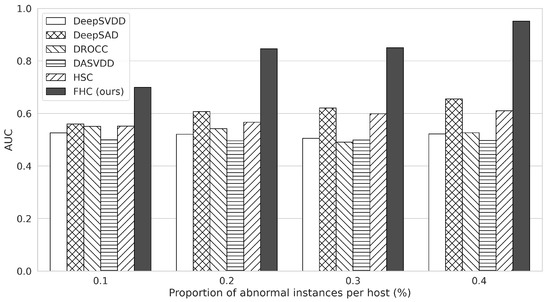
Figure 5.
The AUC results of each anomaly detection method according to the ratio of abnormal data in the training dataset for the CICIDS-2017 dataset. The x-axis represents the proportion of abnormal data in each host.
5. Conclusions
This paper proposed FHC, a novel anomaly detection method based on a re-designed HSC and the federated learning framework, designed for the multi-host environment where the exchange of training data is limited, data distribution of the hosts can be irregular, and only a few hosts have abnormal instances.
One of the issues in the existing anomaly detectors we address in our paper is that they rely on hyperparameter tuning to determine critical parameters (for example, the radius R in the original HSC), which cannot be effectively done when there is no anomaly data. In addition, some methods such as DROCC have been very sensitive to the choice of hyperparameter values. Therefore, we suggested a re-designed version of HSC to include R as a learning parameter that can be optimized using the training data from all participating hosts based on federated learning.
Furthermore, our results in Section 4.3.1 and Section 4.3.2 indicate that larger training examples will help improve the performance of FHC, in particular when the proportion of abnormal instances increases and the class imbalance issue between the normal and abnormal data is alleviated. Our experiment has been done by increasing the number of hosts with abnormal examples, but it may not be plausible in a real environment. Therefore, we can instead consider data augmentation such as GAN [54] and VAE [48] to increase the proportion of abnormal instances.
Nevertheless, the experiments in our paper have been performed in simplified settings, where multiple hosts in a real environment would have more irregular data distribution among the hosts. Therefore, it would be desirable to consider more realistic configurations of multi-host environments, where it would be beneficial to consider more advanced FL techniques such as FedProx [70] or FedOpt [66].
Finally, the experiment setting in this paper reflects one case of irregular data distribution among the hosts, where there can be many possible configurations of host data distributions. Still, we hope our research can be a stepping stone for the research of anomaly detection methods in multi-host environments. Our method is implemented based on PyTorch, which is available as an open source at https://github.com/sanglee/FHC (accessed on 5 April 2022).
Author Contributions
Conceptualization, J.K., B.J. and S.L.; methodology, J.K., B.J. and S.L.; validation, J.K., B.J. and H.L.; writing—original draft preparation, J.K., B.J. and H.L.; writing—review and editing, S.L.; visualization, B.J. and H.L.; supervision, S.L. All authors have read and agreed to the published version of the manuscript.
Funding
This research has been supported by the Agency for Defense Development under the contract (UD210010ED).
Data Availability Statement
All datasets used in this paper are publicly available, MNIST at http://yann.lecun.com/exdb/mnist/ (accessed on 28 February 2022), CIFAR-10 at https://www.cs.toronto.edu/~kriz/cifar.html (accessed on 28 February 2022), Ton-IoT at https://research.unsw.edu.au/projects/toniot-datasets (accessed on 3 March 2022), and CICIDS-2017 at https://www.unb.ca/cic/datasets/ids-2017.html (accessed on 3 March 2022).
Conflicts of Interest
The authors declare no conflict of interest.
References
- Chandola, V.; Banerjee, A.; Kumar, V. Anomaly detection: A survey. ACM Comput. Surv. 2009, 41, 15:1–15:58. [Google Scholar] [CrossRef]
- Ten, C.W.; Hong, J.; Liu, C.C. Anomaly Detection for Cybersecurity of the Substations. IEEE Trans. Smart Grid 2011, 2, 865–873. [Google Scholar] [CrossRef]
- Goh, J.; Adepu, S.; Tan, M.; Lee, Z.S. Anomaly detection in cyber physical systems using recurrent neural networks. In Proceedings of the 2017 IEEE 18th International Symposium on High Assurance Systems Engineering (HASE), Singapore, 12–14 January 2017; pp. 140–145. [Google Scholar]
- Shone, N.; Ngoc, T.N.; Phai, V.D.; Shi, Q. A Deep Learning Approach to Network Intrusion Detection. IEEE Trans. Emerg. Top. Comput. Intell. 2018, 2, 41–50. [Google Scholar] [CrossRef] [Green Version]
- Du, M.; Li, F.; Zheng, G.; Srikumar, V. Deeplog: Anomaly detection and diagnosis from system logs through deep learning. In Proceedings of the 2017 ACM SIGSAC Conference on Computer and Communications Security, Dallas, TX, USA, 30 October–3 November 2017; pp. 1285–1298. [Google Scholar]
- Meng, W.; Liu, Y.; Zhu, Y.; Zhang, S.; Pei, D.; Liu, Y.; Chen, Y.; Zhang, R.; Tao, S.; Sun, P.; et al. LogAnomaly: Unsupervised Detection of Sequential and Quantitative Anomalies in Unstructured Logs. In Proceedings of the Twenty-Eighth International Joint Conference on Artificial Intelligence, IJCAI-19. International Joint Conferences on Artificial Intelligence Organization, Macao, China, 10–16 August 2019; pp. 4739–4745. [Google Scholar] [CrossRef] [Green Version]
- Audibert, J.; Michiardi, P.; Guyard, F.; Marti, S.; Zuluaga, M.A. USAD: UnSupervised Anomaly Detection on Multivariate Time Series. In Proceedings of the 26th ACM SIGKDD International Conference on Knowledge Discovery and Data Mining, Virtual Event, 6–10 July 2020; ACM: New York, NY, USA, 2020. [Google Scholar] [CrossRef]
- Anwar, S.M.; Majid, M.; Qayyum, A.; Awais, M.; Alnowami, M.; Khan, M.K. Medical Image Analysis using Convolutional Neural Networks: A Review. J. Med. Syst. 2018, 42, 226. [Google Scholar] [CrossRef] [Green Version]
- Sato, D.; Hanaoka, S.; Nomura, Y.; Takenaga, T.; Miki, S.; Yoshikawa, T.; Hayashi, N.; Abe, O. A primitive study on unsupervised anomaly detection with an autoencoder in emergency head CT volumes. In Medical Imaging 2018: Computer-Aided Diagnosis. International Society for Optics and Photonics; International Society for Optics and Photonics location: Bellingham, DC, USA, 2018; Volume 10575, p. 105751P. [Google Scholar]
- Shvetsova, N.; Bakker, B.; Fedulova, I.; Schulz, H.; Dylov, D.V. Anomaly detection in medical imaging with deep perceptual autoencoders. IEEE Access 2021, 9, 118571–118583. [Google Scholar] [CrossRef]
- Han, C.; Rundo, L.; Murao, K.; Noguchi, T.; Shimahara, Y.; Milacski, Z.Á.; Koshino, S.; Sala, E.; Nakayama, H.; Satoh, S. MADGAN: Unsupervised medical anomaly detection GAN using multiple adjacent brain MRI slice reconstruction. BMC Bioinform. 2021, 22, 31. [Google Scholar] [CrossRef]
- Tootooni, M.S.; Liu, C.; Roberson, D.; Donovan, R.; Rao, P.K.; Kong, Z.J.; Bukkapatnam, S.T. Online non-contact surface finish measurement in machining using graph theory-based image analysis. J. Manuf. Syst. 2016, 41, 266–276. [Google Scholar] [CrossRef]
- Hajizadeh, S.; Núnez, A.; Tax, D.M. Semi-supervised rail defect detection from imbalanced image data. IFAC-PapersOnLine 2016, 49, 78–83. [Google Scholar] [CrossRef]
- Atha, D.J.; Jahanshahi, M.R. Evaluation of deep learning approaches based on convolutional neural networks for corrosion detection. Struct. Health Monit. 2018, 17, 1110–1128. [Google Scholar] [CrossRef]
- Siddiqui, M.A.; Stokes, J.W.; Seifert, C.; Argyle, E.; McCann, R.; Neil, J.; Carroll, J. Detecting Cyber Attacks Using Anomaly Detection with Explanations and Expert Feedback. In Proceedings of the ICASSP 2019—2019 IEEE International Conference on Acoustics, Speech and Signal Processing (ICASSP), Brighton, UK, 12–17 May 2019; pp. 2872–2876. [Google Scholar] [CrossRef]
- Karimipour, H.; Dehghantanha, A.; Parizi, R.M.; Choo, K.K.R.; Leung, H. A Deep and Scalable Unsupervised Machine Learning System for Cyber-Attack Detection in Large-Scale Smart Grids. IEEE Access 2019, 7, 80778–80788. [Google Scholar] [CrossRef]
- Denning, D.; Neumann, P.G. Requirements and Model for IDES-a Real-Time Intrusion-Detection Expert System; SRI International Menlo Park: Menlo Park, CA, USA, 1985; Volume 8. [Google Scholar]
- Ilgun, K.; Kemmerer, R.A.; Porras, P.A. State Transition Analysis: A Rule-Based Intrusion Detection Approach. IEEE Trans. Softw. Eng. 1995, 21, 181–199. [Google Scholar] [CrossRef]
- Scholkopf, B.; Williamson, R.C.; Smola, A.J.; Shawe-Taylor, J.; Platt, J.C. Support Vector Method for Novelty Detection. In Proceedings of the Advances in Neural Information Processing Systems 12, NIPS Conference, Denver, CO, USA, 29 November–4 December 1999; Solla, S.A., Leen, T.K., Müller, K., Eds.; The MIT Press: Cambridge, MA, USA, 1999; pp. 582–588. [Google Scholar]
- Tax, D.M.J.; Duin, R.P.W. Support Vector Data Description. Mach. Learn. 2004, 54, 45–66. [Google Scholar] [CrossRef] [Green Version]
- Liu, F.T.; Ting, K.M.; Zhou, Z. Isolation Forest. In Proceedings of the 8th IEEE International Conference on Data Mining (ICDM 2008), Pisa, Italy, 15–19 December 2008; pp. 413–422. [Google Scholar] [CrossRef]
- Lakhina, A.; Papagiannaki, K.; Crovella, M.; Diot, C.; Kolaczyk, E.D.; Taft, N. Structural Analysis of Network Traffic Flows. In Proceedings of the Joint International Conference on Measurement and Modeling of Computer Systems (SIGMETRICS ’04/Performance ’04), New York, NY, USA, 10–14 June 2004; Association for Computing Machinery: New York, NY, USA, 2004; pp. 61–72. [Google Scholar] [CrossRef] [Green Version]
- Chalapathy, R.; Chawla, S. Deep Learning for Anomaly Detection: A Survey. arXiv 2019, arXiv:1901.03407v2. Available online: https://arxiv.org/abs/1901.03407 (accessed on 1 March 2022).
- Ruff, L.; Vandermeulen, R.; Goernitz, N.; Deecke, L.; Siddiqui, S.A.; Binder, A.; Müller, E.; Kloft, M. Deep One-Class Classification. In Proceedings of the 35th International Conference on Machine Learning, Stockholm, Sweden, 10–15 July 2018; Dy, J., Krause, A., Eds.; International Conference on Machine Learning (ICML): Baltimore, MD, USA, 2018; Volume 80, pp. 4393–4402. [Google Scholar]
- Potluri, S.; Henry, N.F.; Diedrich, C. Evaluation of hybrid deep learning techniques for ensuring security in networked control systems. In Proceedings of the 2017 22nd IEEE International Conference on Emerging Technologies and Factory Automation (ETFA), Limassol, Cyprus, 12–15 September 2017; pp. 1–8. [Google Scholar] [CrossRef]
- Kravchik, M.; Shabtai, A. Detecting Cyber Attacks in Industrial Control Systems Using Convolutional Neural Networks. In Proceedings of the 2018 Workshop on Cyber-Physical Systems Security and PrivaCy, (CPS-SPC ’18), Toronto, ON, Canada, 19 October 2018; Association for Computing Machinery: New York, NY, USA, 2018; pp. 72–83. [Google Scholar] [CrossRef] [Green Version]
- Yan, W.; Mestha, L.K.; Abbaszadeh, M. Attack Detection for Securing Cyber Physical Systems. IEEE Internet Things J. 2019, 6, 8471–8481. [Google Scholar] [CrossRef]
- Wang, H.; Ruan, J.; Wang, G.; Zhou, B.; Liu, Y.; Fu, X.; Peng, J. Deep Learning-Based Interval State Estimation of AC Smart Grids Against Sparse Cyber Attacks. IEEE Trans. Ind. Inform. 2018, 14, 4766–4778. [Google Scholar] [CrossRef]
- Wang, J.; Shi, D.; Li, Y.; Chen, J.; Ding, H.; Duan, X. Distributed Framework for Detecting PMU Data Manipulation Attacks With Deep Autoencoders. IEEE Trans. Smart Grid 2019, 10, 4401–4410. [Google Scholar] [CrossRef]
- Kang, M.J.; Kang, J.W. Intrusion detection system using deep neural network for in-vehicle network security. PLoS ONE 2016, 11, e0155781. [Google Scholar] [CrossRef]
- Song, H.M.; Woo, J.; Kim, H.K. In-vehicle network intrusion detection using deep convolutional neural network. Veh. Commun. 2020, 21, 100198. [Google Scholar] [CrossRef]
- Ashraf, J.; Bakhshi, A.D.; Moustafa, N.; Khurshid, H.; Javed, A.; Beheshti, A. Novel Deep Learning-Enabled LSTM Autoencoder Architecture for Discovering Anomalous Events From Intelligent Transportation Systems. IEEE Trans. Intell. Transp. Syst. 2021, 22, 4507–4518. [Google Scholar] [CrossRef]
- Moslehi, K.; Kumar, R. A Reliability Perspective of the Smart Grid. IEEE Trans. Smart Grid 2010, 1, 57–64. [Google Scholar] [CrossRef]
- Gunduz, M.Z.; Das, R. Cyber-security on smart grid: Threats and potential solutions. Comput. Netw. 2020, 169, 107094. [Google Scholar] [CrossRef]
- Rodríguez-Valenzuela, S.; Holgado-Terriza, J.A.; Gutiérrez-Guerrero, J.M.; Muros-Cobos, J.L. Distributed service-based approach for sensor data fusion in IoT environments. Sensors 2014, 14, 19200–19228. [Google Scholar] [CrossRef] [PubMed] [Green Version]
- Bhuvaneswari Amma, N.G.; Selvakumar, S. Anomaly detection framework for Internet of things traffic using vector convolutional deep learning approach in fog environment. Future Gener. Comput. Syst. 2020, 113, 255–265. [Google Scholar]
- Wang, X.; Han, Y.; Wang, C.; Zhao, Q.; Chen, X.; Chen, M. In-Edge AI: Intelligentizing Mobile Edge Computing, Caching and Communication by Federated Learning. IEEE Netw. 2019, 33, 156–165. [Google Scholar] [CrossRef] [Green Version]
- Alazab, M.; RM, S.P.; M, P.; Maddikunta, P.K.R.; Gadekallu, T.R.; Pham, Q.V. Federated Learning for Cybersecurity: Concepts, Challenges, and Future Directions. IEEE Trans. Ind. Inform. 2022, 18, 3501–3509. [Google Scholar] [CrossRef]
- Caragea, D.; Silvescu, A.; Honavar, V. Analysis and synthesis of agents that learn from distributed dynamic data sources. In Emergent Neural Computational Architectures Based on Neuroscience; Springer: Berlin/Heidelberg, Germany, 2001; pp. 547–559. [Google Scholar]
- Peteiro-Barral, D.; Guijarro-Berdiñas, B. A survey of methods for distributed machine learning. Prog. Artif. Intell. 2013, 2, 1–11. [Google Scholar] [CrossRef] [Green Version]
- Liu, A.; Wang, Y.; Li, T. SFE-GACN: A novel unknown attack detection under insufficient data via intra categories generation in embedding space. Comput. Secur. 2021, 105, 102262. [Google Scholar] [CrossRef]
- McMahan, B.; Moore, E.; Ramage, D.; Hampson, S.; y Arcas, B.A. Communication-Efficient Learning of Deep Networks from Decentralized Data. In Proceedings of the 20th International Conference on Artificial Intelligence and Statistics, AISTATS 2017, Fort Lauderdale, FL, USA, 20–22 April 2017; Singh, A., Zhu, X.J., Eds.; PMLR: Cambridge MA, USA, 2017; Volume 54, pp. 1273–1282. [Google Scholar]
- Ruff, L.; Vandermeulen, R.A.; Franks, B.J.; Müller, K.; Kloft, M. Rethinking Assumptions in Deep Anomaly Detection. arXiv 2020, arXiv:2006.00339v2. Available online: https://arxiv.org/abs/2006.00339 (accessed on 3 March 2022).
- Cortes, C.; Vapnik, V. Support-vector networks. Mach. Learn. 1995, 20, 273–297. [Google Scholar] [CrossRef]
- Hotelling, H. Analysis of a complex of statistical variables into principal components. J. Educ. Psychol. 1933, 24, 417. [Google Scholar] [CrossRef]
- Ringberg, H.; Soule, A.; Rexford, J.; Diot, C. Sensitivity of PCA for Traffic Anomaly Detection. SIGMETRICS Perform. Eval. Rev. 2007, 35, 109–120. [Google Scholar] [CrossRef]
- Sakurada, M.; Yairi, T. Anomaly Detection Using Autoencoders with Nonlinear Dimensionality Reduction. In Proceedings of the MLSDA 2014 2nd Workshop on Machine Learning for Sensory Data Analysis (MLSDA’14), Gold Coast, QLD, Australia, 2 December 2014; Association for Computing Machinery: New York, NY, USA, 2014; pp. 4–11. [Google Scholar] [CrossRef]
- Kingma, D.P.; Welling, M. Auto-Encoding Variational Bayes. In Proceedings of the 2nd International Conference on Learning Representations, ICLR 2014, Banff, AB, Canada, 14–16 April 2014; Conference Track Proceedings. Bengio, Y., LeCun, Y., Eds.; DBLP: Trier, Germany, 2014. [Google Scholar]
- Zong, B.; Song, Q.; Min, M.R.; Cheng, W.; Lumezanu, C.; Cho, D.K.; Chen, H. Deep Autoencoding Gaussian Mixture Model for Unsupervised Anomaly Detection. In Proceedings of the 6th International Conference on Learning Representations, ICLR 2018, Vancouver, BC, Canada, 30 April–3 May 2018. [Google Scholar]
- Gong, D.; Liu, L.; Le, V.; Saha, B.; Mansour, M.R.; Venkatesh, S.; van den Hengel, A. Memorizing Normality to Detect Anomaly: Memory-Augmented Deep Autoencoder for Unsupervised Anomaly Detection. In Proceedings of the 2019 IEEE/CVF International Conference on Computer Vision, ICCV 2019, Seoul, Korea, 27 October–2 November 2019; pp. 1705–1714. [Google Scholar] [CrossRef] [Green Version]
- Vapnik, V. The Nature of Statistical Learning Theory; Springer Science & Business Media: Berlin/Heidelberg, Germany, 1999. [Google Scholar]
- Hojjati, H.; Armanfard, N. DASVDD: Deep Autoencoding Support Vector Data Descriptor for Anomaly Detection. arXiv 2021, arXiv:2106.05410. [Google Scholar]
- Schlegl, T.; Seeböck, P.; Waldstein, S.M.; Schmidt-Erfurth, U.; Langs, G. Unsupervised Anomaly Detection with Generative Adversarial Networks to Guide Marker Discovery. In Proceedings of the Information Processing in Medical Imaging—25th International Conference, Boone, NC, USA, 25–30 June 2017. [Google Scholar]
- Goodfellow, I.J.; Pouget-Abadie, J.; Mirza, M.; Xu, B.; Warde-Farley, D.; Ozair, S.; Courville, A.C.; Bengio, Y. Generative Adversarial Nets. In Proceedings of the Advances in Neural Information Processing Systems 27: Annual Conference on Neural Information Processing Systems 2014, Montreal, QC, Canada, 8–13 December 2014; Ghahramani, Z., Welling, M., Cortes, C., Lawrence, N.D., Weinberger, K.Q., Eds.; Association for Computing Machinery: New York, NY, USA, 2014; pp. 2672–2680. [Google Scholar]
- Schlegl, T.; Seeböck, P.; Waldstein, S.M.; Langs, G.; Schmidt-Erfurth, U. f-AnoGAN: Fast unsupervised anomaly detection with generative adversarial networks. Med. Image Anal. 2019, 54, 30–44. [Google Scholar] [CrossRef]
- Goyal, S.; Raghunathan, A.; Jain, M.; Simhadri, H.V.; Jain, P. DROCC: Deep Robust One-Class Classification. In Proceedings of the 37th International Conference on Machine Learning, ICML 2020, Virtual Event, 13–18 July 2020; Volume 119, pp. 3711–3721. [Google Scholar]
- Goodfellow, I.J.; Shlens, J.; Szegedy, C. Explaining and harnessing adversarial examples. arXiv 2014, arXiv:1412.6572. [Google Scholar]
- Wang, J.; Neskovic, P.; Cooper, L.N. Pattern classification via single spheres. In Proceedings of the International Conference on Discovery Science, Singapore, 8–11 of October 2005; pp. 241–252. [Google Scholar]
- Liu, Y.; Zheng, Y.F. Minimum enclosing and maximum excluding machine for pattern description and discrimination. In Proceedings of the 18th International Conference on Pattern Recognition (ICPR’06), Hong Kong, China, 20–24 August 2006; Volume 3, pp. 129–132. [Google Scholar]
- Görnitz, N.; Kloft, M.; Rieck, K.; Brefeld, U. Toward supervised anomaly detection. J. Artif. Intell. Res. 2013, 46, 235–262. [Google Scholar] [CrossRef]
- Hendrycks, D.; Mazeika, M.; Dietterich, T.G. Deep Anomaly Detection with Outlier Exposure. In Proceedings of the 7th International Conference on Learning Representations, ICLR 2019, New Orleans, LA, USA, 6–9 May 2019. [Google Scholar]
- Ruff, L.; Vandermeulen, R.A.; Görnitz, N.; Binder, A.; Müller, E.; Müller, K.; Kloft, M. Deep Semi-Supervised Anomaly Detection. In Proceedings of the 8th International Conference on Learning Representations, ICLR 2020, Addis Ababa, Ethiopia, 26–30 April 2020. [Google Scholar]
- Rubinstein, R. The Cross-Entropy Method for Combinatorial and Continuous Optimization. Methodol. Comput. Appl. Probab. 1999, 1, 127–190. [Google Scholar] [CrossRef]
- Park, J.; Sandberg, I.W. Approximation and Radial-Basis-Function Networks. Neural Comput. 1993, 5, 305–316. Available online: https://direct.mit.edu/neco/article-pdf/5/2/305/812543/neco.1993.5.2.305.pdf (accessed on 28 February 2022). [CrossRef]
- Kairouz, P.; McMahan, H.B.; Avent, B.; Bellet, A.; Bennis, M.; Bhagoji, A.N.; Bonawitz, K.; Charles, Z.; Cormode, G.; Cummings, R.; et al. Advances and Open Problems in Federated Learning. Found. Trends Mach. Learn. 2021, 14, 1–210. [Google Scholar] [CrossRef]
- Reddi, S.J.; Charles, Z.; Zaheer, M.; Garrett, Z.; Rush, K.; Konečný, J.; Kumar, S.; McMahan, H.B. Adaptive Federated Optimization. In Proceedings of the 9th International Conference on Learning Representations, ICLR 2021, Virtual Event, 3–7 May 2021. [Google Scholar]
- Duchi, J.C.; Hazan, E.; Singer, Y. Adaptive Subgradient Methods for Online Learning and Stochastic Optimization. J. Mach. Learn. Res. 2011, 12, 2121–2159. [Google Scholar]
- Kingma, D.P.; Ba, J. Adam: A Method for Stochastic Optimization. In Proceedings of the 3rd International Conference on Learning Representations, ICLR 2015, San Diego, CA, USA, 7–9 May 2015; Bengio, Y., LeCun, Y., Eds.; DBLP: Trier, Germany, 2015. [Google Scholar]
- Wang, J.; Liu, Q.; Liang, H.; Joshi, G.; Poor, H.V. Tackling the Objective Inconsistency Problem in Heterogeneous Federated Optimization. In Proceedings of the Advances in Neural Information Processing Systems 33: Annual Conference on Neural Information Processing Systems 2020, NeurIPS 2020, Virtual, 6–12 December 2020; Larochelle, H., Ranzato, M., Hadsell, R., Balcan, M., Lin, H., Eds.; Curran Associates, Inc.: Red Hook, NY, USA, 2020. [Google Scholar]
- Li, T.; Sahu, A.K.; Zaheer, M.; Sanjabi, M.; Talwalkar, A.; Smith, V. Federated Optimization in Heterogeneous Networks. In Proceedings of the Machine Learning and Systems 2020, MLSys 2020, Austin, TX, USA, 2–4 March 2020; Dhillon, I.S., Papailiopoulos, D.S., Sze, V., Eds.; DBLP: Trier, Germany, 2020. [Google Scholar]
- Liang, P.P.; Liu, T.; Liu, Z.; Salakhutdinov, R.; Morency, L. Think Locally, Act Globally: Federated Learning with Local and Global Representations. arXiv 2020, arXiv:2001.01523v3. Available online: http://arxiv.org/abs/2001.01523 (accessed on 8 February 2022).
- Shamsian, A.; Navon, A.; Fetaya, E.; Chechik, G. Personalized Federated Learning using Hypernetworks. In Proceedings of the 38th International Conference on Machine Learning, ICML 2021, Virtual Event, 18–24 July 2021; Meila, M., Zhang, T., Eds.; PMLR: Cambridge MA, USA, 2021; Volume 139, pp. 9489–9502. [Google Scholar]
- Nguyen, T.D.; Marchal, S.; Miettinen, M.; Fereidooni, H.; Asokan, N.; Sadeghi, A. DÏoT: A Federated Self-learning Anomaly Detection System for IoT. In Proceedings of the 39th IEEE International Conference on Distributed Computing Systems, ICDCS 2019, Dallas, TX, USA, 7–10 July 2019; pp. 756–767. [Google Scholar] [CrossRef] [Green Version]
- Zhao, Y.; Chen, J.; Wu, D.; Teng, J.; Yu, S. Multi-Task Network Anomaly Detection using Federated Learning. In Proceedings of the Tenth International Symposium on Information and Communication Technology, Ha Noi, Ha Long Bay, Vietnam, 4–6 December 2019; ACM: New York, NY, USA, 2019; pp. 273–279. [Google Scholar] [CrossRef]
- Wang, H.; Muñoz-González, L.; Eklund, D.; Raza, S. Non-IID data re-balancing at IoT edge with peer-to-peer federated learning for anomaly detection. In Proceedings of the WiSec’21: 14th ACM Conference on Security and Privacy in Wireless and Mobile Networks, Abu Dhabi, United Arab Emirates, 28 June–2 July 2021; Pöpper, C., Vanhoef, M., Batina, L., Mayrhofer, R., Eds.; ACM: New York, NY, USA, 2021; pp. 153–163. [Google Scholar] [CrossRef]
- Chawla, N.V.; Bowyer, K.W.; Hall, L.O.; Kegelmeyer, W.P. SMOTE: Synthetic Minority over-Sampling Technique. J. Artif. Int. Res. 2002, 16, 321–357. [Google Scholar] [CrossRef]
- Robbins, H.; Monro, S. A stochastic approximation method. Ann. Math. Stat. 1951, 22, 400–407. [Google Scholar] [CrossRef]
- LeCun, Y.; Cortes, C.; Burges, C. MNIST Handwritten Digit Database. ATT Labs [Online] 2010, 2. Available online: http://yann.lecun.com/exdb/mnist (accessed on 28 February 2022).
- Krizhevsky, A. Learning Multiple Layers of Features from Tiny Images. 2009. Available online: https://www.cs.toronto.edu/~kriz/cifar.html (accessed on 28 February 2022).
- Sharafaldin, I.; Lashkari, A.H.; Ghorbani, A.A. Toward Generating a New Intrusion Detection Dataset and Intrusion Traffic Characterization. In Proceedings of the 4th International Conference on Information Systems Security and Privacy, ICISSP 2018, Funchal; Madeira, Portugal, 22–24 January 2018, Mori, P., Furnell, S., Camp, O., Eds.; SciTePress: Setubal, Portugal, 2018; pp. 108–116. [Google Scholar] [CrossRef]
- Alsaedi, A.; Moustafa, N.; Tari, Z.; Mahmood, A.N.; Anwar, A. TON_IoT Telemetry Dataset: A New Generation Dataset of IoT and IIoT for Data-Driven Intrusion Detection Systems. IEEE Access 2020, 8, 165130–165150. [Google Scholar] [CrossRef]
- Lloyd, S. Least squares quantization in PCM. IEEE Trans. Inf. Theory 1982, 28, 129–137. [Google Scholar] [CrossRef] [Green Version]
- Powers, D.M. Evaluation: From precision, recall and F-measure to ROC, informedness, markedness and correlation. arXiv 2020, arXiv:2010.16061. [Google Scholar]
- Bradley, A.P. The use of the area under the ROC curve in the evaluation of machine learning algorithms. Pattern Recognit. 1997, 30, 1145–1159. [Google Scholar] [CrossRef] [Green Version]
- Zhang, Y.; Chen, X.; Jin, L.; Wang, X.; Guo, D. Network Intrusion Detection: Based on Deep Hierarchical Network and Original Flow Data. IEEE Access 2019, 7, 37004–37016. [Google Scholar] [CrossRef]

Publisher’s Note: MDPI stays neutral with regard to jurisdictional claims in published maps and institutional affiliations. |
© 2022 by the authors. Licensee MDPI, Basel, Switzerland. This article is an open access article distributed under the terms and conditions of the Creative Commons Attribution (CC BY) license (https://creativecommons.org/licenses/by/4.0/).