Abstract
The quality of the input text image has a clear impact on the output of a scene text recognition (STR) system; however, due to the fact that the main content of a text image is a sequence of characters containing semantic information, how to effectively assess text image quality remains a research challenge. Text image quality assessment (TIQA) can help in picking a hard sample, leading to a more robust STR system and recognition-oriented text image restoration. In this paper, by arguing that the text image quality comes from character-level texture feature and embedding robustness, we propose a learning-based fine-grained, sharp, and recognizable text image quality assessment method (FSR–TIQA), which is the first TIQA scheme to our knowledge. In order to overcome the difficulty of obtaining the character position in a text image, an attention-based recognizer is used to generate the character embedding and character image. We use the similarity distribution distance to evaluate the character embedding robustness between the intra-class and inter-class similarity distributions. The Haralick feature is used to reflect the clarity of the character region texture feature. Then, a quality score network is designed under a label–free training scheme to normalize the texture feature and output the quality score. Extensive experiments indicate that FSR-TIQA has significant discrimination for different quality text images on benchmarks and Textzoom datasets. Our method shows good potential to analyze dataset distribution and guide dataset collection.
1. Introduction
Scene text recognition is a significantly well-researched topic [1,2,3,4,5]. Current text recognizers have achieved impressive results on clear text images [6,7]; however, their performance drops dramatically in unconstrained conditions dealing with low-quality text images [4]. Text image quality has gradually become an important factor for high-performance STR systems. Recent works improve the recognition performance on super-resolution (SR) dataset Textzoom [6] and benchmarks by introducing SR methods as a pre-processing procedure before recognition [6,8,9,10,11] or joint training [4,12].
However, few researchers pay attention to text image quality assessment. The goal of TIQA is to predict the quality of a text image, which is helpful for picking hard samples and leads to a more robust STR system and recognition-oriented text image restoration.
A large number of image quality assessment (IQA) studies [13] have been proposed during recent years, which are widely applied to various modalities: 2D image [14,15,16,17], stereoscopic image [18], 3D point cloud [19], etc. Our work is inspired by face image quality assessment (FIQA). Both face images and text images contain special textures and semantic information. The performance of face recognition and scene text recognition is affected by the quality of the input image. Different from IQA, TIQA should be more relevant to character texture feature and recognizability for the STR system. The main influencing factors of text image quality include image properties (such as low-resolution (LR), blurriness, contrast, and background) and text properties (such as sloped, curved, and irregular shapes). This is why character position [8], character skeleton [10], and character stoke [11] are essential for recovering text images with more details.
In this work, we evaluate the quality of scene text images with characters as the main content. High-quality and low-quality text images are shown in Figure 1. Each character contributes to understanding the whole word in the text image. Some text images are easy to read, some can be vaguely recognize a few characters, some are even completely invisible. Scoring each character allows for a more fine-grained assessment of the text image quality. Due to the difficulty of labeling, character position in the text image is expensive to obtain. The attention-based STR systems can solve this problem implicitly by predicting the attention map of sequence characters, which is the most relevant region of the feature map to identify the character. To some extent, it can also indicate the position of each character. In addition, the position-aware module in [8], which is actually used to generate the attention map, is proposed to constrain the image recovery.
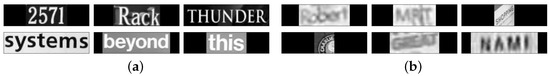
Figure 1.
Examples of text images. (a): high-quality text images. (b): low-quality text images. The height of the input image is set to 32 and the width is calculated with the original aspect ratio (up to 128). Due to the degree of blur, low-resolution, and irregular shape, some images may become impossible to recognize. Text image quality assessment aims to design a novel method that is adaptive to text image quality.
For low-quality text images, humans often try to find easily recognizable characters and then make semantic assumptions [20]. In [8], the content-aware module is proposed to pave the way for distinguishing confusable characters. TIQA should measure the recognizability of each character. Inspired by face embedding [21], we define the 512-dimensional feature before the last fully connected layer in the STR attention decoder as the character embedding. The uncertainty of character embedding is the key factor in accurately classifying the character.
For high-quality text images, the easily legible characters have similar texture feature: character color is uniform and differentiated from the background. Meanwhile, the boundary between character and background is clear. The sharpness of character edge is an important factor in TIQA. The clearer the character edge, the more accurate the character skeleton information prediction [10], and the more readable the characters; however, the edge information of the whole text image contains useless background information, which interferes with the clarity assessment of the text content area. With the help of the attention map, the sharpness of each character can be calculated on the character region cropped from the original text image.
Text image quality is strongly correlated with the sharpness and recognizability of each character. In this paper, we propose a learning-based fine-grained, sharp, and recognizable text image quality assessment method.
We split the text image into character images, character embeddings and corresponding recognition results in the fine-grained manner by attention-based STR system. In order to calculate the intra-class similarity distribution and inter-class similarity distribution of the test character embedding, the character embedding library (CEL) is established using the correctly recognized character embedding. Then the Wasserstein distance between intra-class and inter-class similarity distribution is calculated as character recognizability. We present a new approach for assessing character edge sharpness by use of the Haralick feature (dissimilarity) extracted from the gray level co-occurrence matrix (GLCM) [22]. The dissimilarity values reflect the degree and clarity of the textured grooves of the character region, which is one of the thirteen Haralick features. A quality score network is trained under the recognition accuracy of the whole batch to normalize the dissimilarity values. In order to distribute the scores evenly, we propose a data sampling method based on the random proportion of the recognition results. Our method can accurately predict the text image quality score in a label-free manner.
To sum up, this paper introduces three main contributions:
- We are the first to propose the text image quality assessment framework from three perspectives: character-level-based evaluation, sharp texture feature, and embedding robustness.
- We propose a learning-based fine-grained, sharp, and recognizable text image quality assessment method. The Wasserstein distance between the intra-class and inter-class similarity distributions is used to evaluate embedding robustness. The multiscale Haralick feature reflects the degree and clarity of the texture feature of character region. A quality score network is designed under the label-free training manner to normalize the texture feature and output the quality score.
- Extensive experiments indicate that FSR-TIQA has significant discrimination for different quality text images on benchmarks and Textzoom. Meanwhile, our method shows good potential to analyze dataset distribution and guide dataset collection.
2. Analysis and Comparison on Related Work
2.1. Image Quality Assessment
Image quality assessment is a fundamental problem in the field of image processing. Many learning-based IQA methods for various image multi-modalities are proposed. In the image field, a deep neural network [14] with hierarchical multi-scale features is proposed to tackle the challenging problem of distorted image quality prediction. In the field of 3D vision, StereoQANet [18] proposed a novel general-purpose architecture that contains the multi-layer network interaction between the left and right view of sub-networks for no-reference stereoscopic image quality assessment. For omnidirectional images, VGCN [23] presented a viewport-oriented graph convolutional neural network to estimate the perceptual quality of omnidirectional images. There are also some deep neural networks for evaluating the quality of knowledge representations for 3D point cloud processing [19] and the perceptual quality of SR images [24].
2.2. Low-Quality Scene Text Image Recovery
Recent works have noticed the text image degradation problem. TextZoom [6] is the first real paired scene text image super-resolution dataset, which is divided into three difficulty levels with different focal lengths. A lot of SR methods are proposed as pre-processing modules before recognition. TSRN [6] used sequential residual block and gradient profile loss to improve the context information and sharper edge of refined images. The position-aware module and content-aware module in [8] are proposed to focus on text-level layouts and character-level details. In addition, more fine-grained text detail constraints are proposed. Such as character skeleton loss [10] and stroke-focused module [11].
We arrive at the conclusion that the above methods strive to recover character details and character semantic information. In this work, we believe that the text image quality assessment should focus on character-level texture feature and embedding robustness.
2.3. Face Image Quality Assessment
The FIQA works can be categorized into factor-specific FIQA approaches and monolithic FIQA approaches [25]. The factor-specific branch [26,27] subdivides methods into size, blur, illumination, pose, and so on. The monolithic approaches produce comparatively opaque quality scores, which can indicate overall FR utility. It is unrealistic to consider all factors artificially. More current methods focus on learning-based approaches [15,16,28,29]. Ref. [28] was the first to propose the learning-based FIQA method. SER-FIQA [16] proposed a learnable estimation of face image quality, which calculated the variations of embeddings coming from the random subnetworks of a face recognition model as quality scores. SDD-FIQA [15] considered the Wasserstein distance between intra-class and inter-class recognition similarity distributions as the scores. Furthermore, Magface [29] proposed a category of losses that learns a universal feature embedding whose magnitude can measure the quality of the given face.
Through the observation of FIQA, we propose a monolithic TIQA method with our two kinds of quality inputs: character-level texture feature and embedding robustness.
3. Methodology
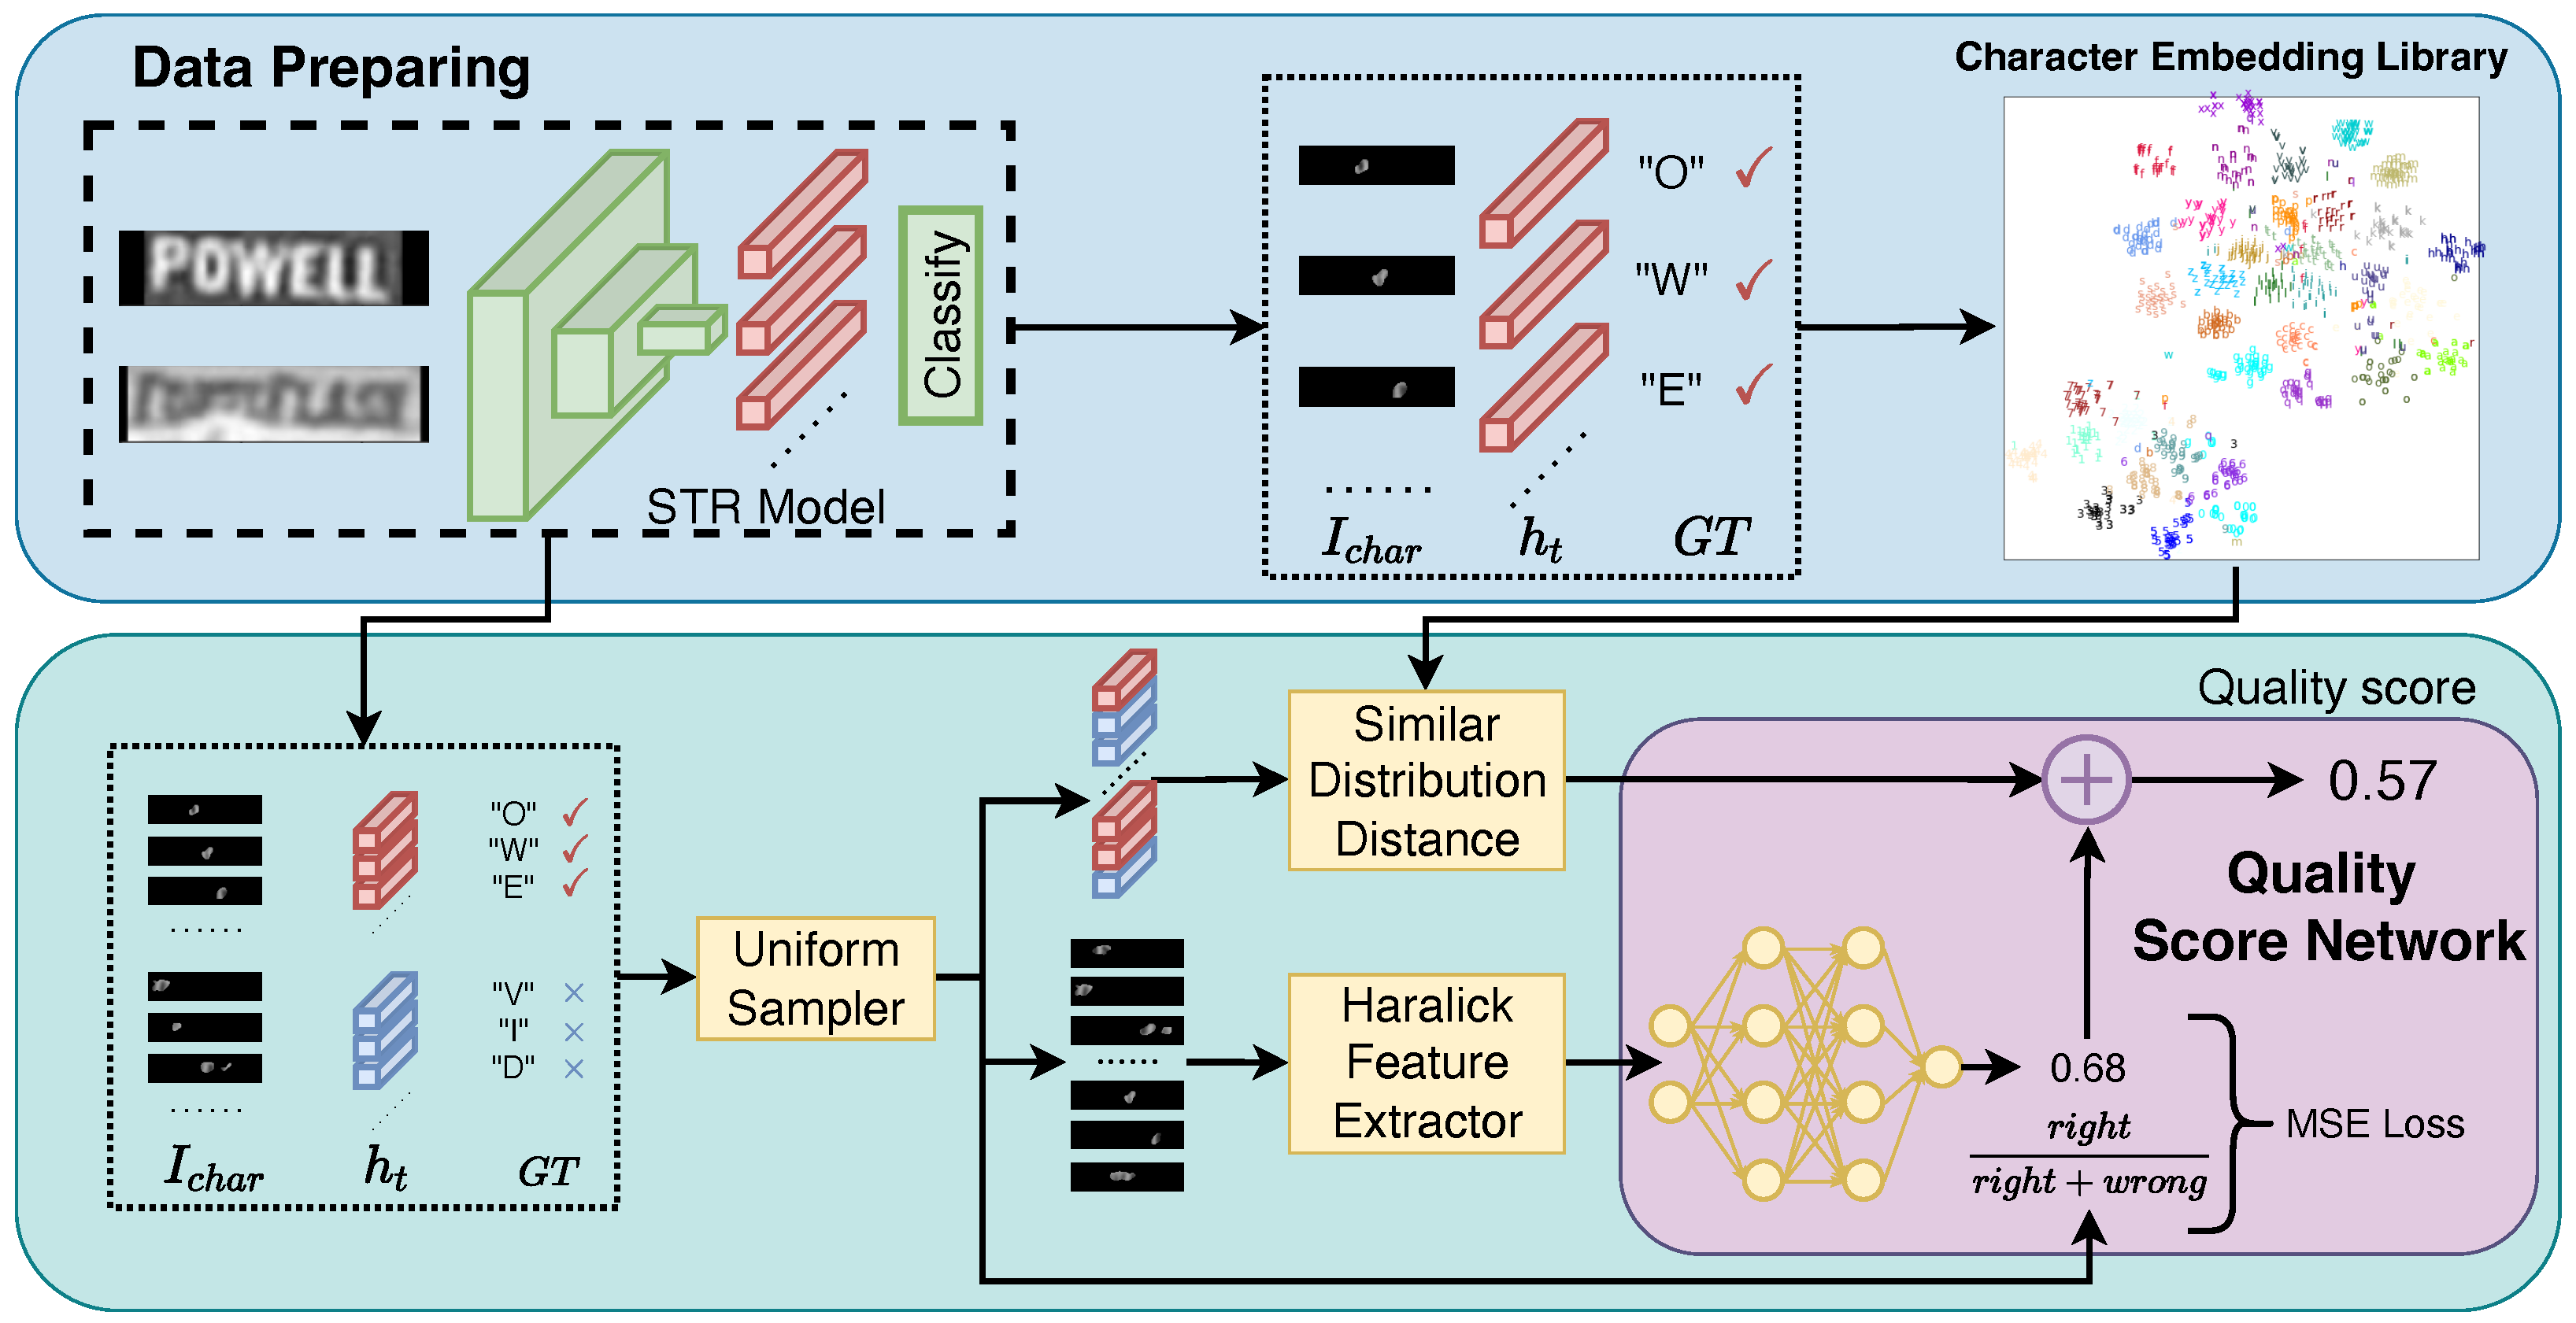
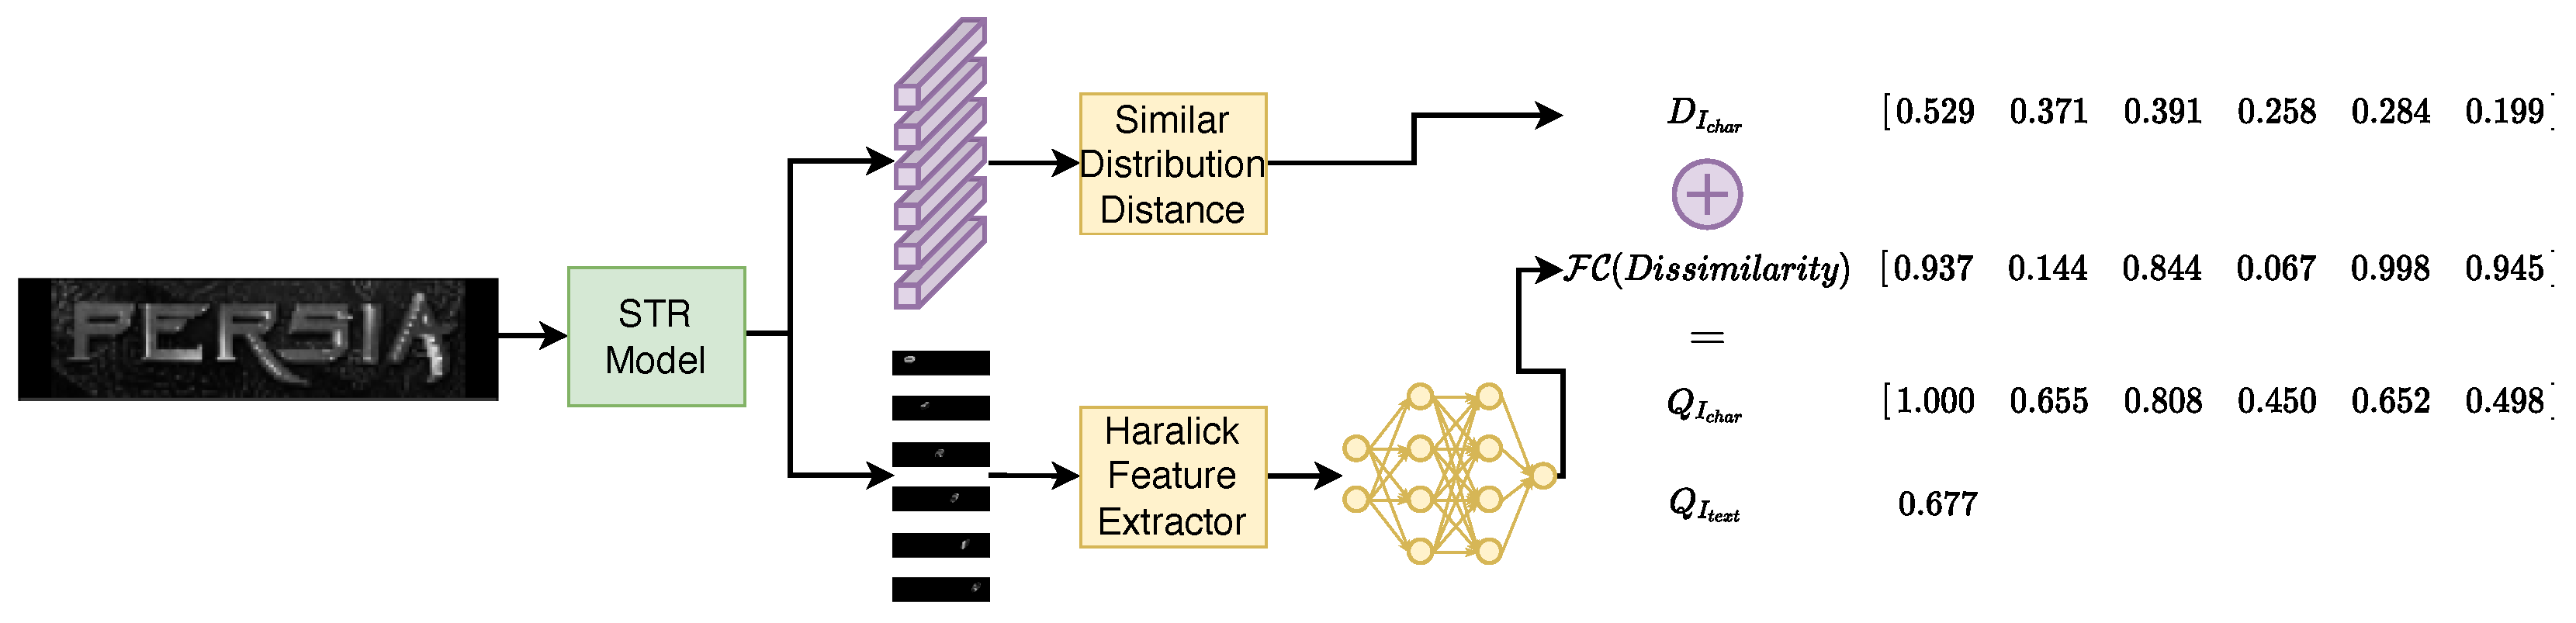
Text image quality assessment aims at excavating the relationship between the quality score of a text image and the clarity and recognition performance of each character. The framework of the proposed FSR-TIQA is shown in Figure 2.
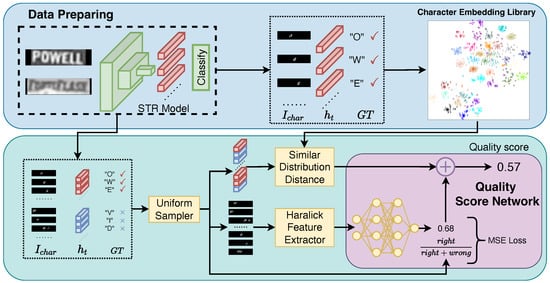
Figure 2.
An overview of FSR-TIQA. Step 1: The character embedding and the corresponding character image region are obtained by traversing the real-world text images in the pre-trained STR model. The character embedding library is collected. Step 2: The paired data obtained by the uniform sampler are used to extract the Haralick feature and Wasserstein distance, respectively. Step 3: The score network is trained under the constraints of the whole batch recognition accuracy.
3.1. Data Preparing
Under the fine-grained principle, we introduce the text image to character-level transformation by extracting the character embedding and character region using the attention-based STR system. In this work, we choose DAN [3] as our STR model. For text image of size , the feature encoder has multi-scale visual features . The convolutional alignment module (CAM) takes F as input and generates attention maps with a fully convolutional network [30] in the channel-wise manner. The attention maps effectively indicate the importance of every character in the visual feature. Then, the decoupled text decoder takes visual features and attention maps as input. It works iteratively for steps, producing a character sequence. The context vector fed into the GRU at each step is computed as: . The feature map region relevant to each character will be extracted by attention map A. After GRU models context global semantics, character embeddings are represented by a hidden layer: , is an embedding vector of the previous decoding result. Finally, the classifier output: . In this way, we can obtain the paired attention maps , character embeddings , character recognition results, and the corresponding order of the ground truth.
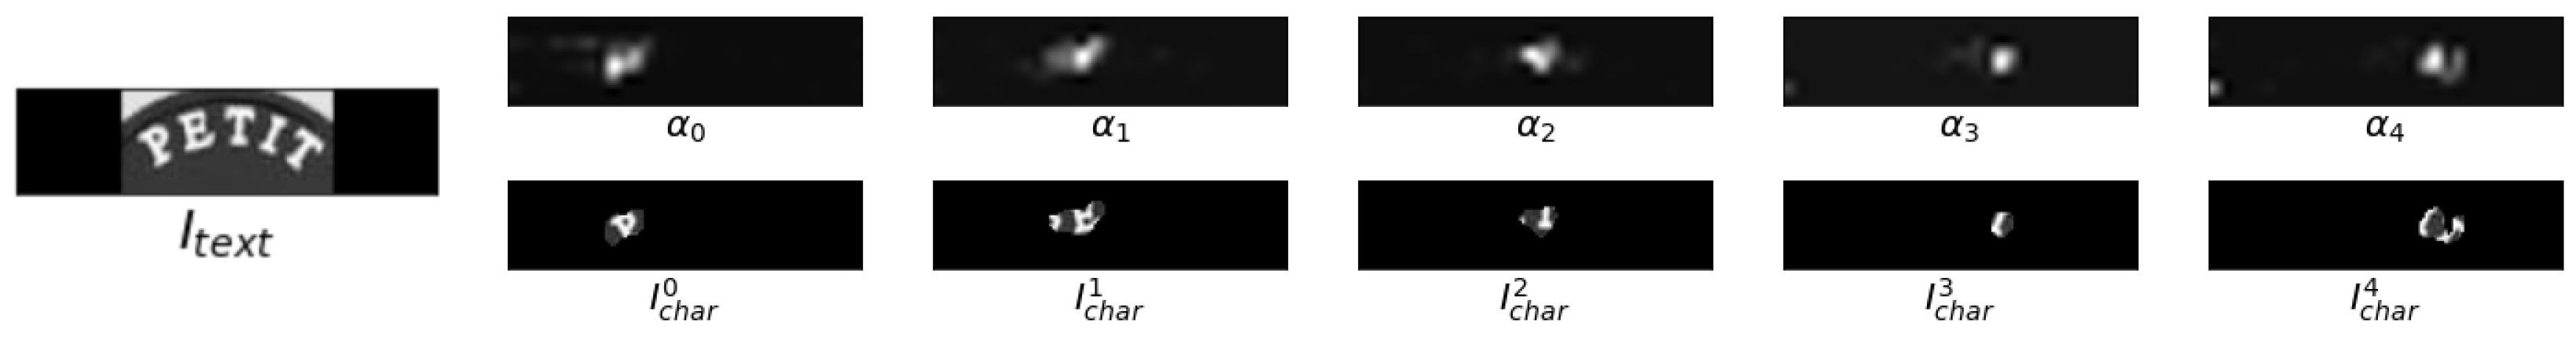
Our FSR-TIQA focuses on evaluating each character region. As shown in Figure 3, the attention maps of sequence characters are the most relevant region of the feature map to identify the character. To some extent, it can also indicate the position of each character; however, attention maps contain decimals between 0 and 1. In order to preserve the pixel information of the original text image, a binary algorithm named OTSU [31] is used to maximize the preservation of the most important location regions in the attention map. is cropped by the upsampled binary attention map from the text image: . As such, the assessment of the character texture feature is not affected by background pixels in Section 3.3.

Figure 3.
An overview of character image cropped by the upsampled binary attention map from text image. The attention maps generated from DAN are shown in the first line. In the second line, the character image is cropped by the upsampled binary attention maps.
Meanwhile, the character embedding library consists of the correctly recognized character embeddings from the benchmark. For each character class, CEL represents the high-quality character embedding set in the real scene, which is used to calculate the character recognizability in Section 3.2.
3.2. Similarity Distribution Distance
In order to assist the stability and reliability of STR system performance in an unconstrained scenario, TIQA should consider the recognizability of the text image. Inspired by a lot of FIQA works [15,16,29], we aim to estimate the pair-wise similarity as a part of the text image quality score. In this work, we argue that a high-quality character embedding should be similar to its intra-class samples and dissimilar to its inter-class samples.
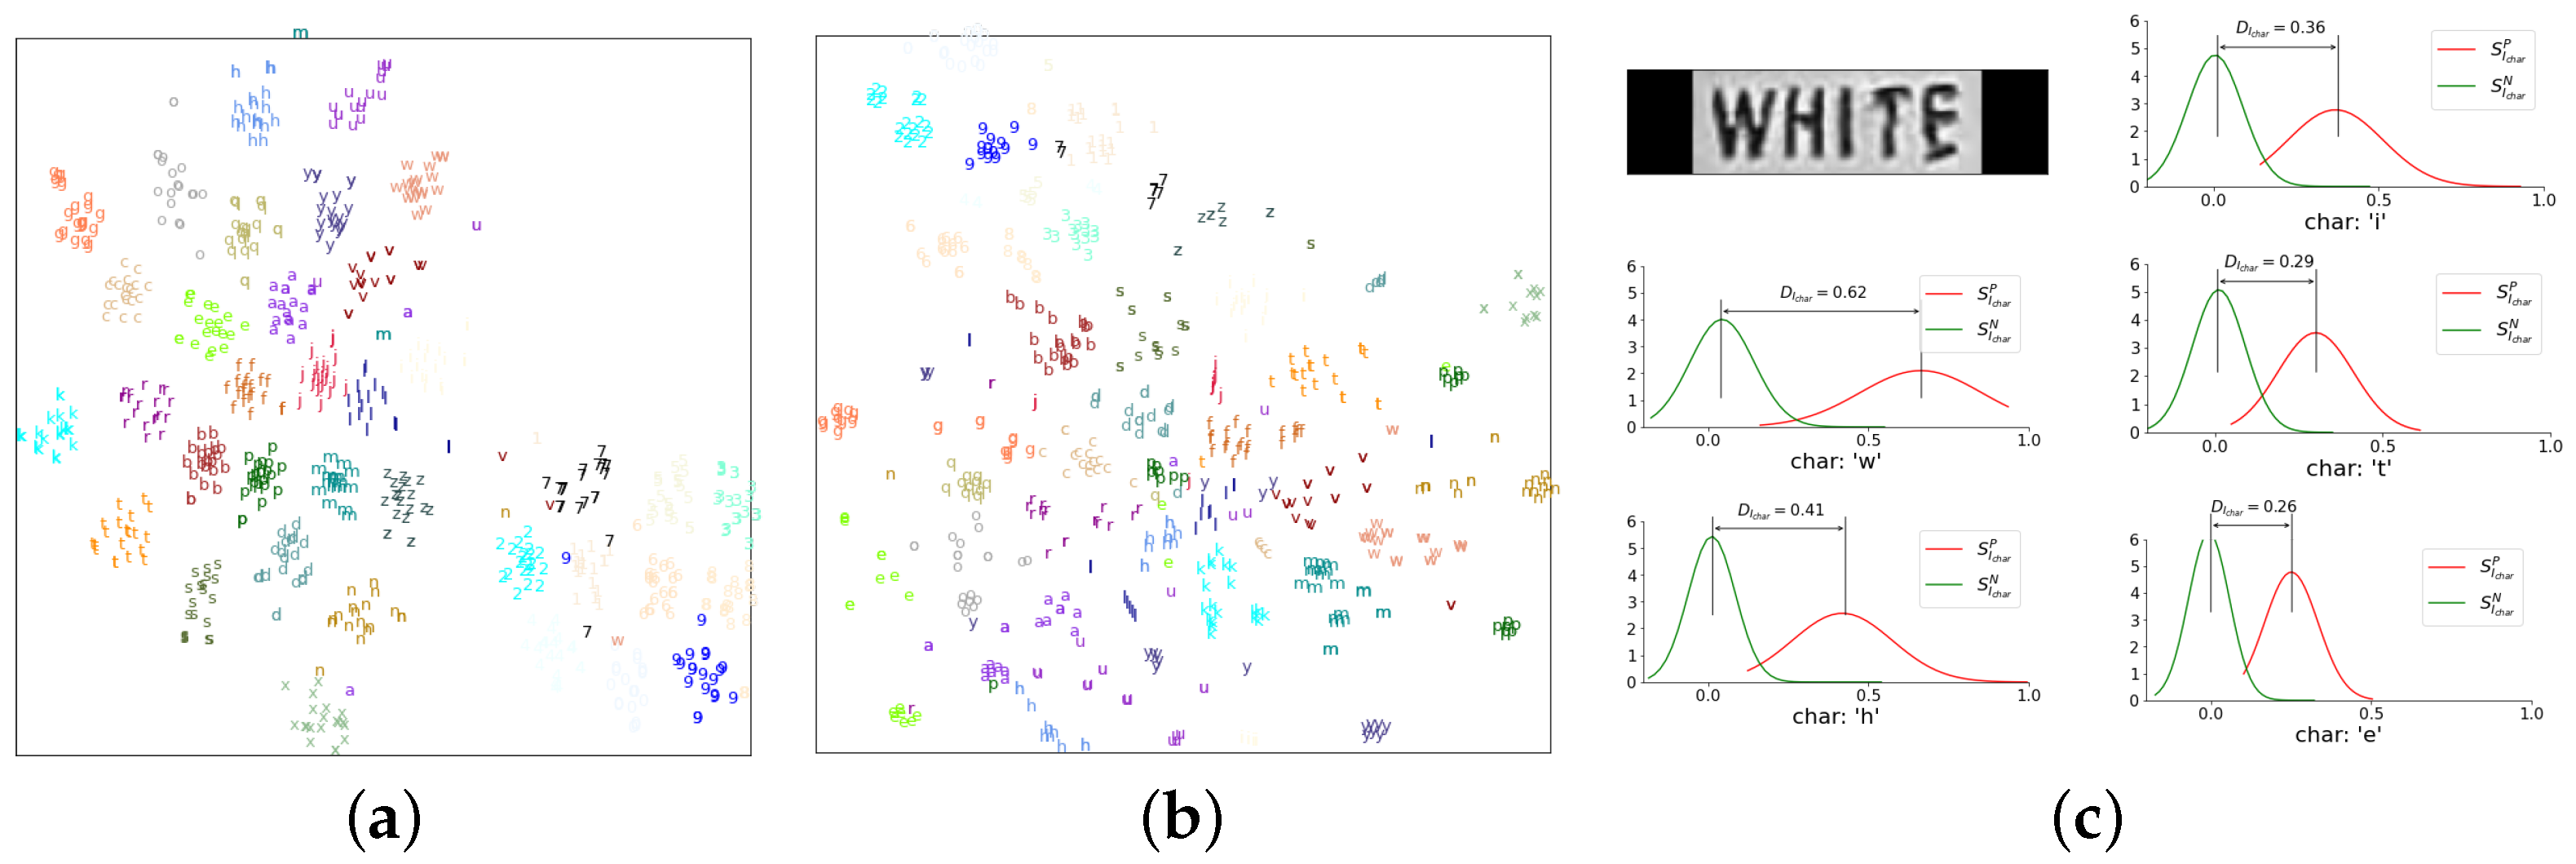
Similar to face recognition, we discover that the character embedding robustness can be well described by the similarity distribution distance [15]. As shown in Figure 4a, the samples distribute more compactly in each class with high-quality character embeddings. High quality encourages better intra-class compactness. Such discovery can also be explained intuitively. For example, a high-quality character image is always easily recognized, which means the character embedding of a high-quality character image is close to the intra-class samples and far from inter-class samples. In other words, the distance between the intra-class similarity distribution and the inter-class similarity distribution is large. Inversely, the low-quality character produces a small distance. Specifically, we assume that and are the set of Euclidean distance between the character embedding and same or different category embeddings in CEL. As shown in Figure 4c, we use the Wasserstein metric to measure the distance between and as , which is expressed by:
where denotes Wasserstein distance. Each step of the proposed similarity distribution distance is explained in Algorithm 1.
| Algorithm 1 Pseudocode of Similarity Distribution Distance |
|
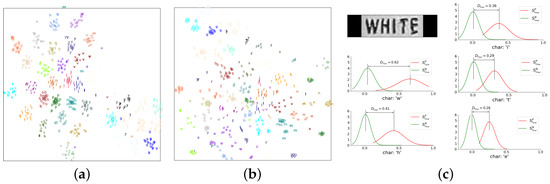
Figure 4.
Embedding plot of 36 character classes from STR benchmark. (a): character embedding in the benchmark training set. (b): character embedding in the Hard high-resolution (HR) subset of Textzoom. The embeddings are dimension reduced using t-SNE. (c): illustration of the character similarity distribution distance.
3.3. Haralick Feature Extractor
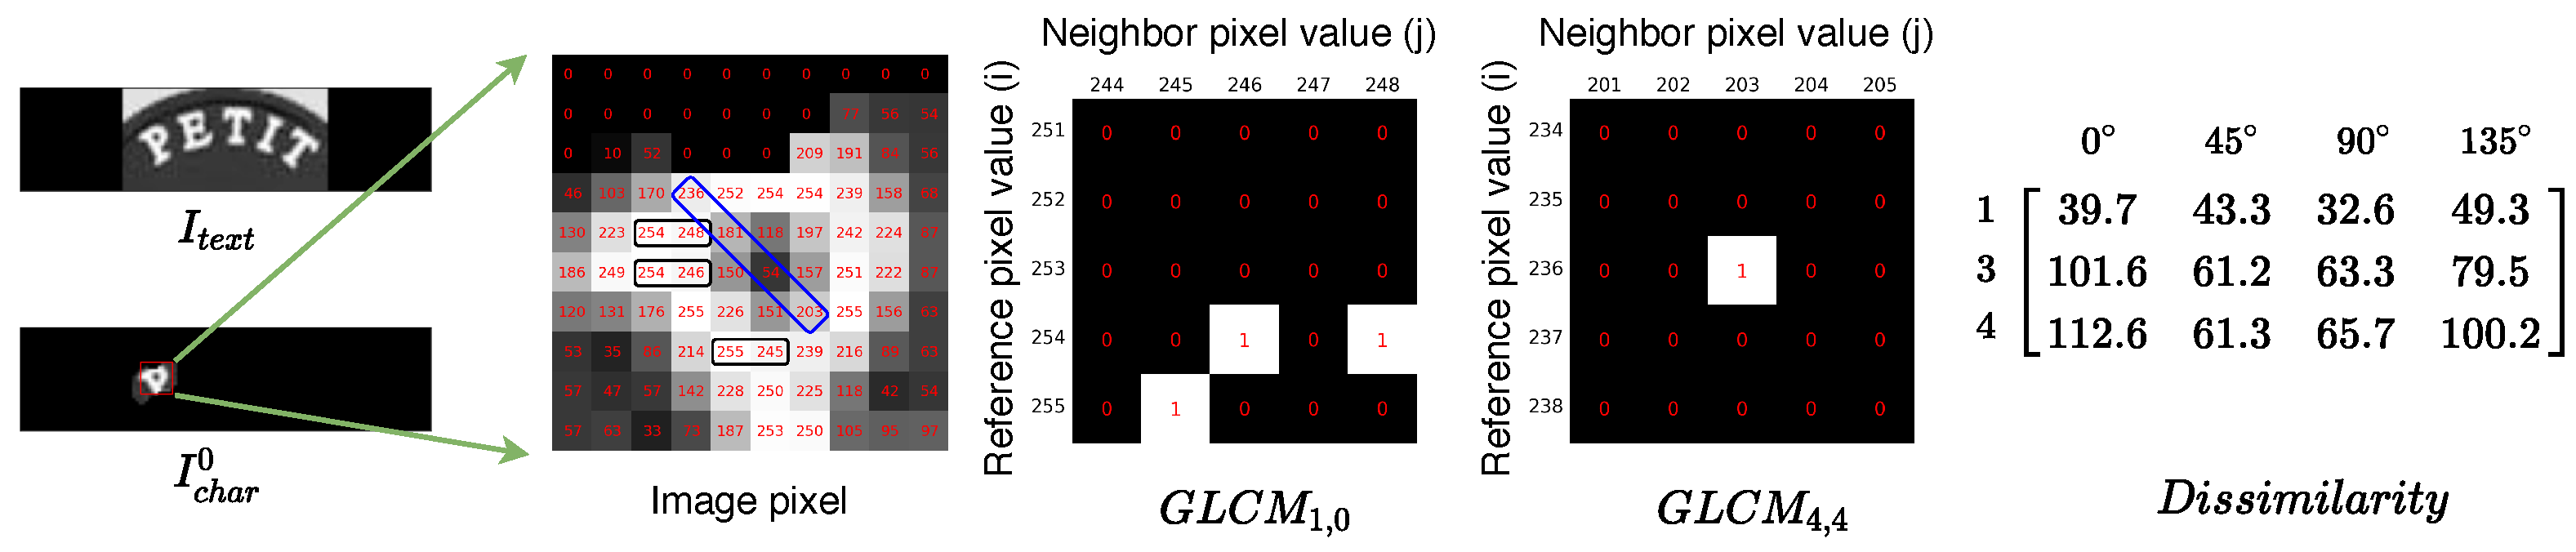
Given a character image, character edge sharpness is an important factor in character texture feature, which is measured by one of the Haralick features: dissimilarity [22] extracted from the gray level co-occurrence matrix (GLCM). GLCM is a statistical method of examining the texture of a grayscale image, which is used to calculate the degree of correlation between the gray levels of two pixels at a certain distance and direction. Character image with 256 different pixel values produces a co-occurrence matrix for the given offset :
The value of gives the number of times in the image that the i and j pixel values occur in the relation given by the offset. As shown in Figure 5, the GLCM is computed on a character image. The in Equation (2) are then normalized to express the matrix elements as probability measures:
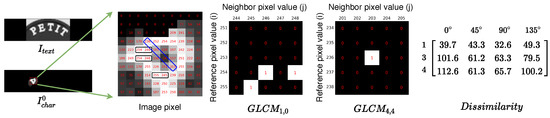
Figure 5.
An illustration of how the GLCM is computed. A character image is cropped from the text image; 256 gray-levels are represented by numerical values from 0 to 255. Pixel values are displayed in the non-zero area of the character. As shown in the image pixel, there are three instances of a reference pixel with a neighbor pixel: (indicated in three black rectangles). In addition, there is an instance: (indicated in the blue rectangle).
We use the normalized co-occurrence matrices to calculate the particular Haralick feature as defined below:
gives pixels with similar gray-level values a low weight but pixels with dissimilar gray-levels a high weight along the direction, which is closely related to character edge sharpness. In this work, we analyze four different angular () and three offsets () to assess character edge sharpness, which in turn produces 12 dissimilarity features. As shown in Figure 5, the GLCM is computed on a character image and the texture feature is shown on the left. The GLCM is similar to a counter for every combination of gray-level pairs in the image. For each pixel, its value and the neighboring pixel at a certain distance and direction are counted in a specific GLCM.
3.4. Quality Score Network
A quality score network is designed to normalize the texture features . We use a simple fully connected network for regression quality scores. Then, we employ a dropout operator with 0.5 probability to avoid overfitting during training. To match the predictions of the quality score network with the recognition system, the recognition result of each character is collected to supervise the network training. As shown in Figure 2, the output quality score of the entire batch is supervised under the recognition accuracy of the whole batch. We use the mean squared error (MSE) loss function to train the quality score network. In order to uniformly sample from the fixed quantity true and false dataset, we propose a uniform sampler to randomly generate the quality score and sample from the true and false subset. During training stage, the data score of each batch is randomly distributed between 0 to 1, which can avoid the network directly fitting to the average score of all training data. The final character quality score is defined as:
We set balanced factors and .
For the testing stage, Figure 6 shows the scoring process of a text image. Unlike the training process, each text image contains a different number of characters. The quality score for a text image is defined by:
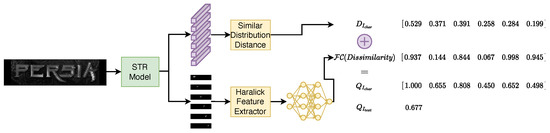
Figure 6.
Predicting text image quality scores in the testing phase.
Our method considers both character texture feature and character embedding robustness, which is more amicable to recognition performance. Moreover, our approach is label-free without any human quality annotation.
4. Experiments
4.1. Experimental Setup
4.1.1. Datasets and STR System
Seven standard benchmarks include ICDAR 2003 (IC03) [32], ICDAR 2013 (IC13) [33], ICDAR 2015 (IC15) [34], IIIT5K (IIIT) [35], Street View Text (SVT) [36], Street View Text-Perspective (SVTP) [37], CUTE80 (CUTE) [38], and TextZoom were used as the testing datasets. In addition, TextZoom is the first super-resolution text dataset and contains large variations in illumination, blurriness, and occlusion, whose test dataset was divided into three testing subsets [6] according to the camera focal length and the distance between the camera and the object.
For the STR system, we adopted an opensource implementation of https://github.com/Wang-Tianwei/Decoupled-attention-network (accessed on 29 November 2020) DAN. The height of the input image is set to 32 and the width is calculated with the original aspect ratio (up to 128).
4.1.2. Implementation Details
In our work, the training set of above benchmarks was utilized as CEL and training data for the quality score network. During data preparation, text images are sent into the STR system. According to the recognition result, the paired attention map and character embedding are split into two parts: right and wrong. A fixed number of character embeddings are randomly sampled from the right part to form the CEL. Each character class contains 50 paired data.
Our score network was built on the PyTorch framework with NVIDIA RTX 2080Ti GPUs. The model was trained by an Adam optimizer. The initial learning rate is and is decayed to and , respectively, after 4 and 5 epochs.
4.1.3. Evaluation Protocols
To evaluate the text quality assessment performance, we use the error versus reject curve (EVRC), which is first proposed in [39] and a widely used metric in FIQA [15,16]. The goal is to state how efficiently rejection of low-quality samples results in improved performance, which shows an STR system error rate over the fraction of images with low quality scores. From another perspective, text images with quality scores are shown to reflect the correspondence between quality score and image clarity.
4.2. Results and Discussion
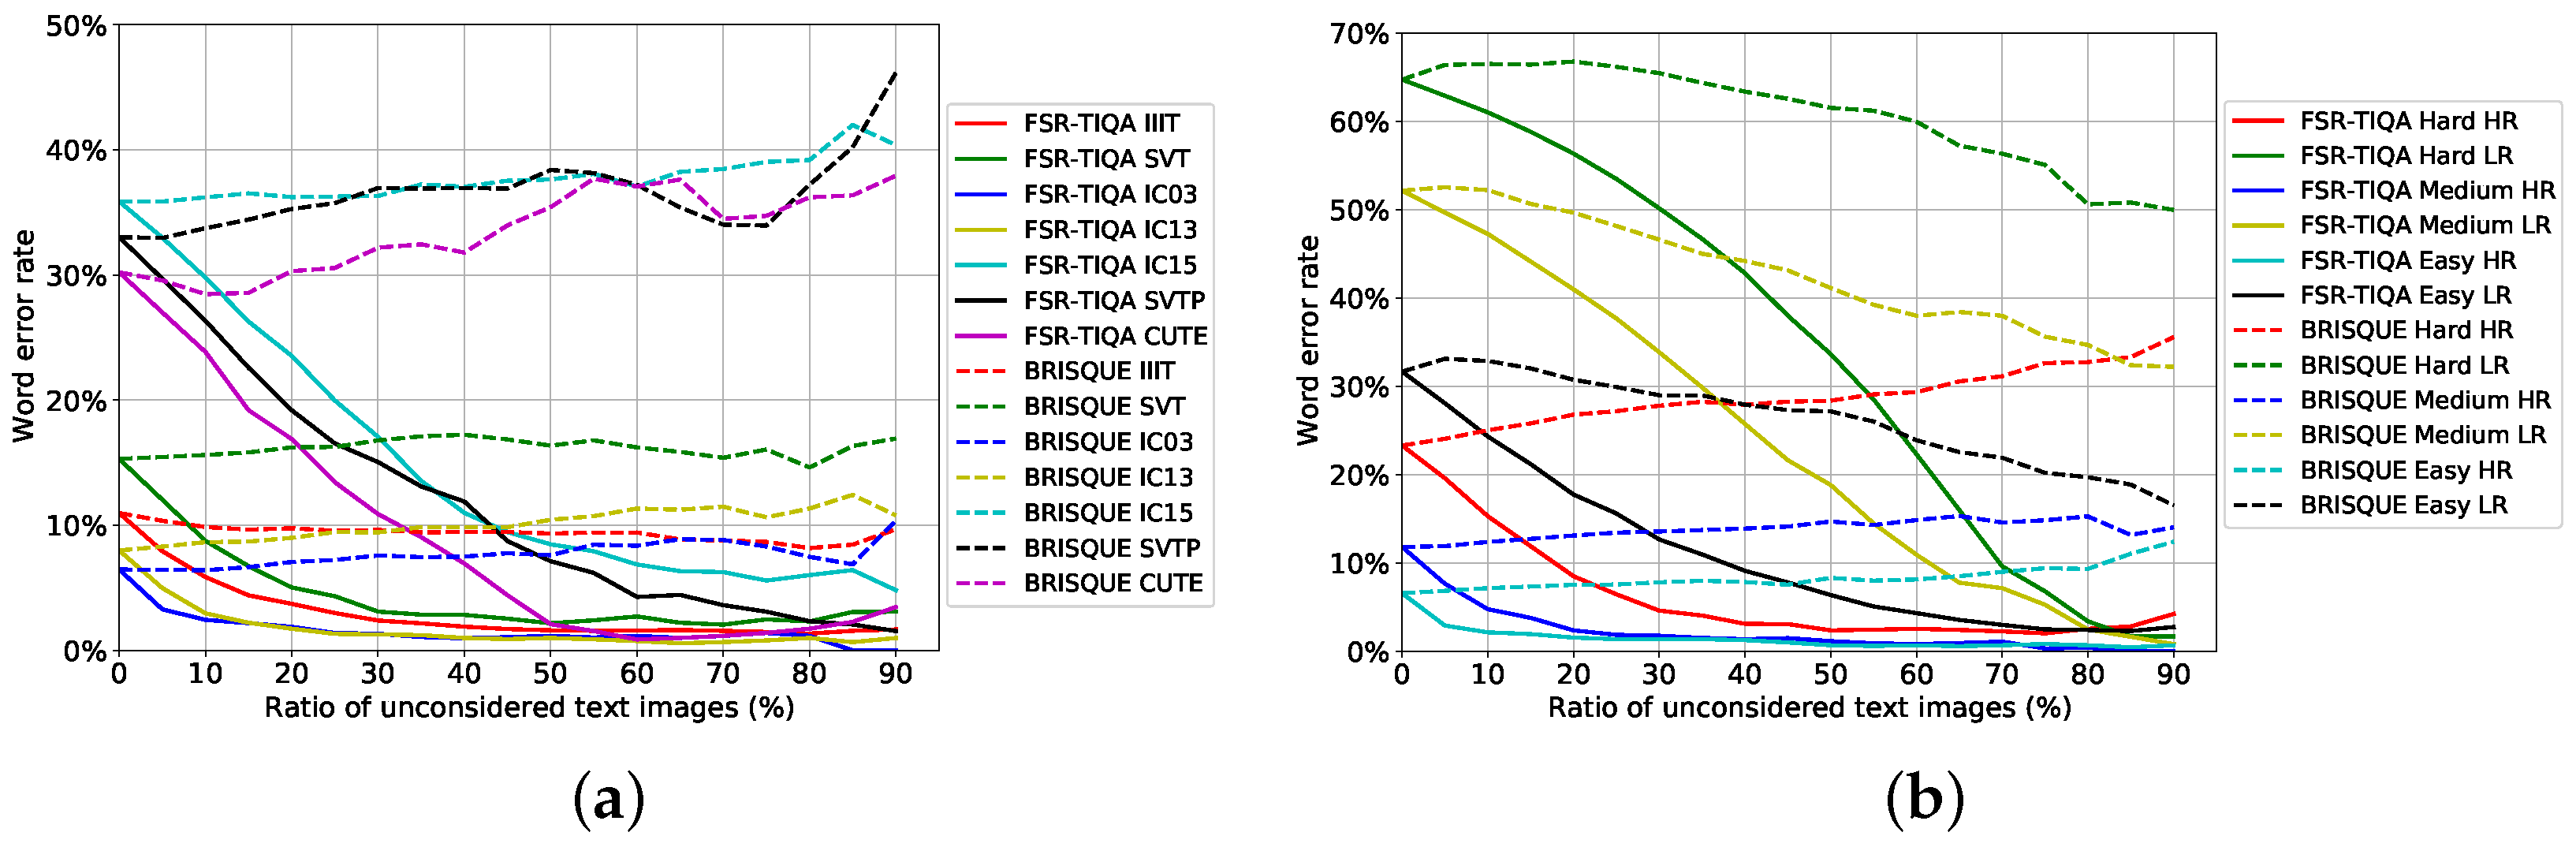
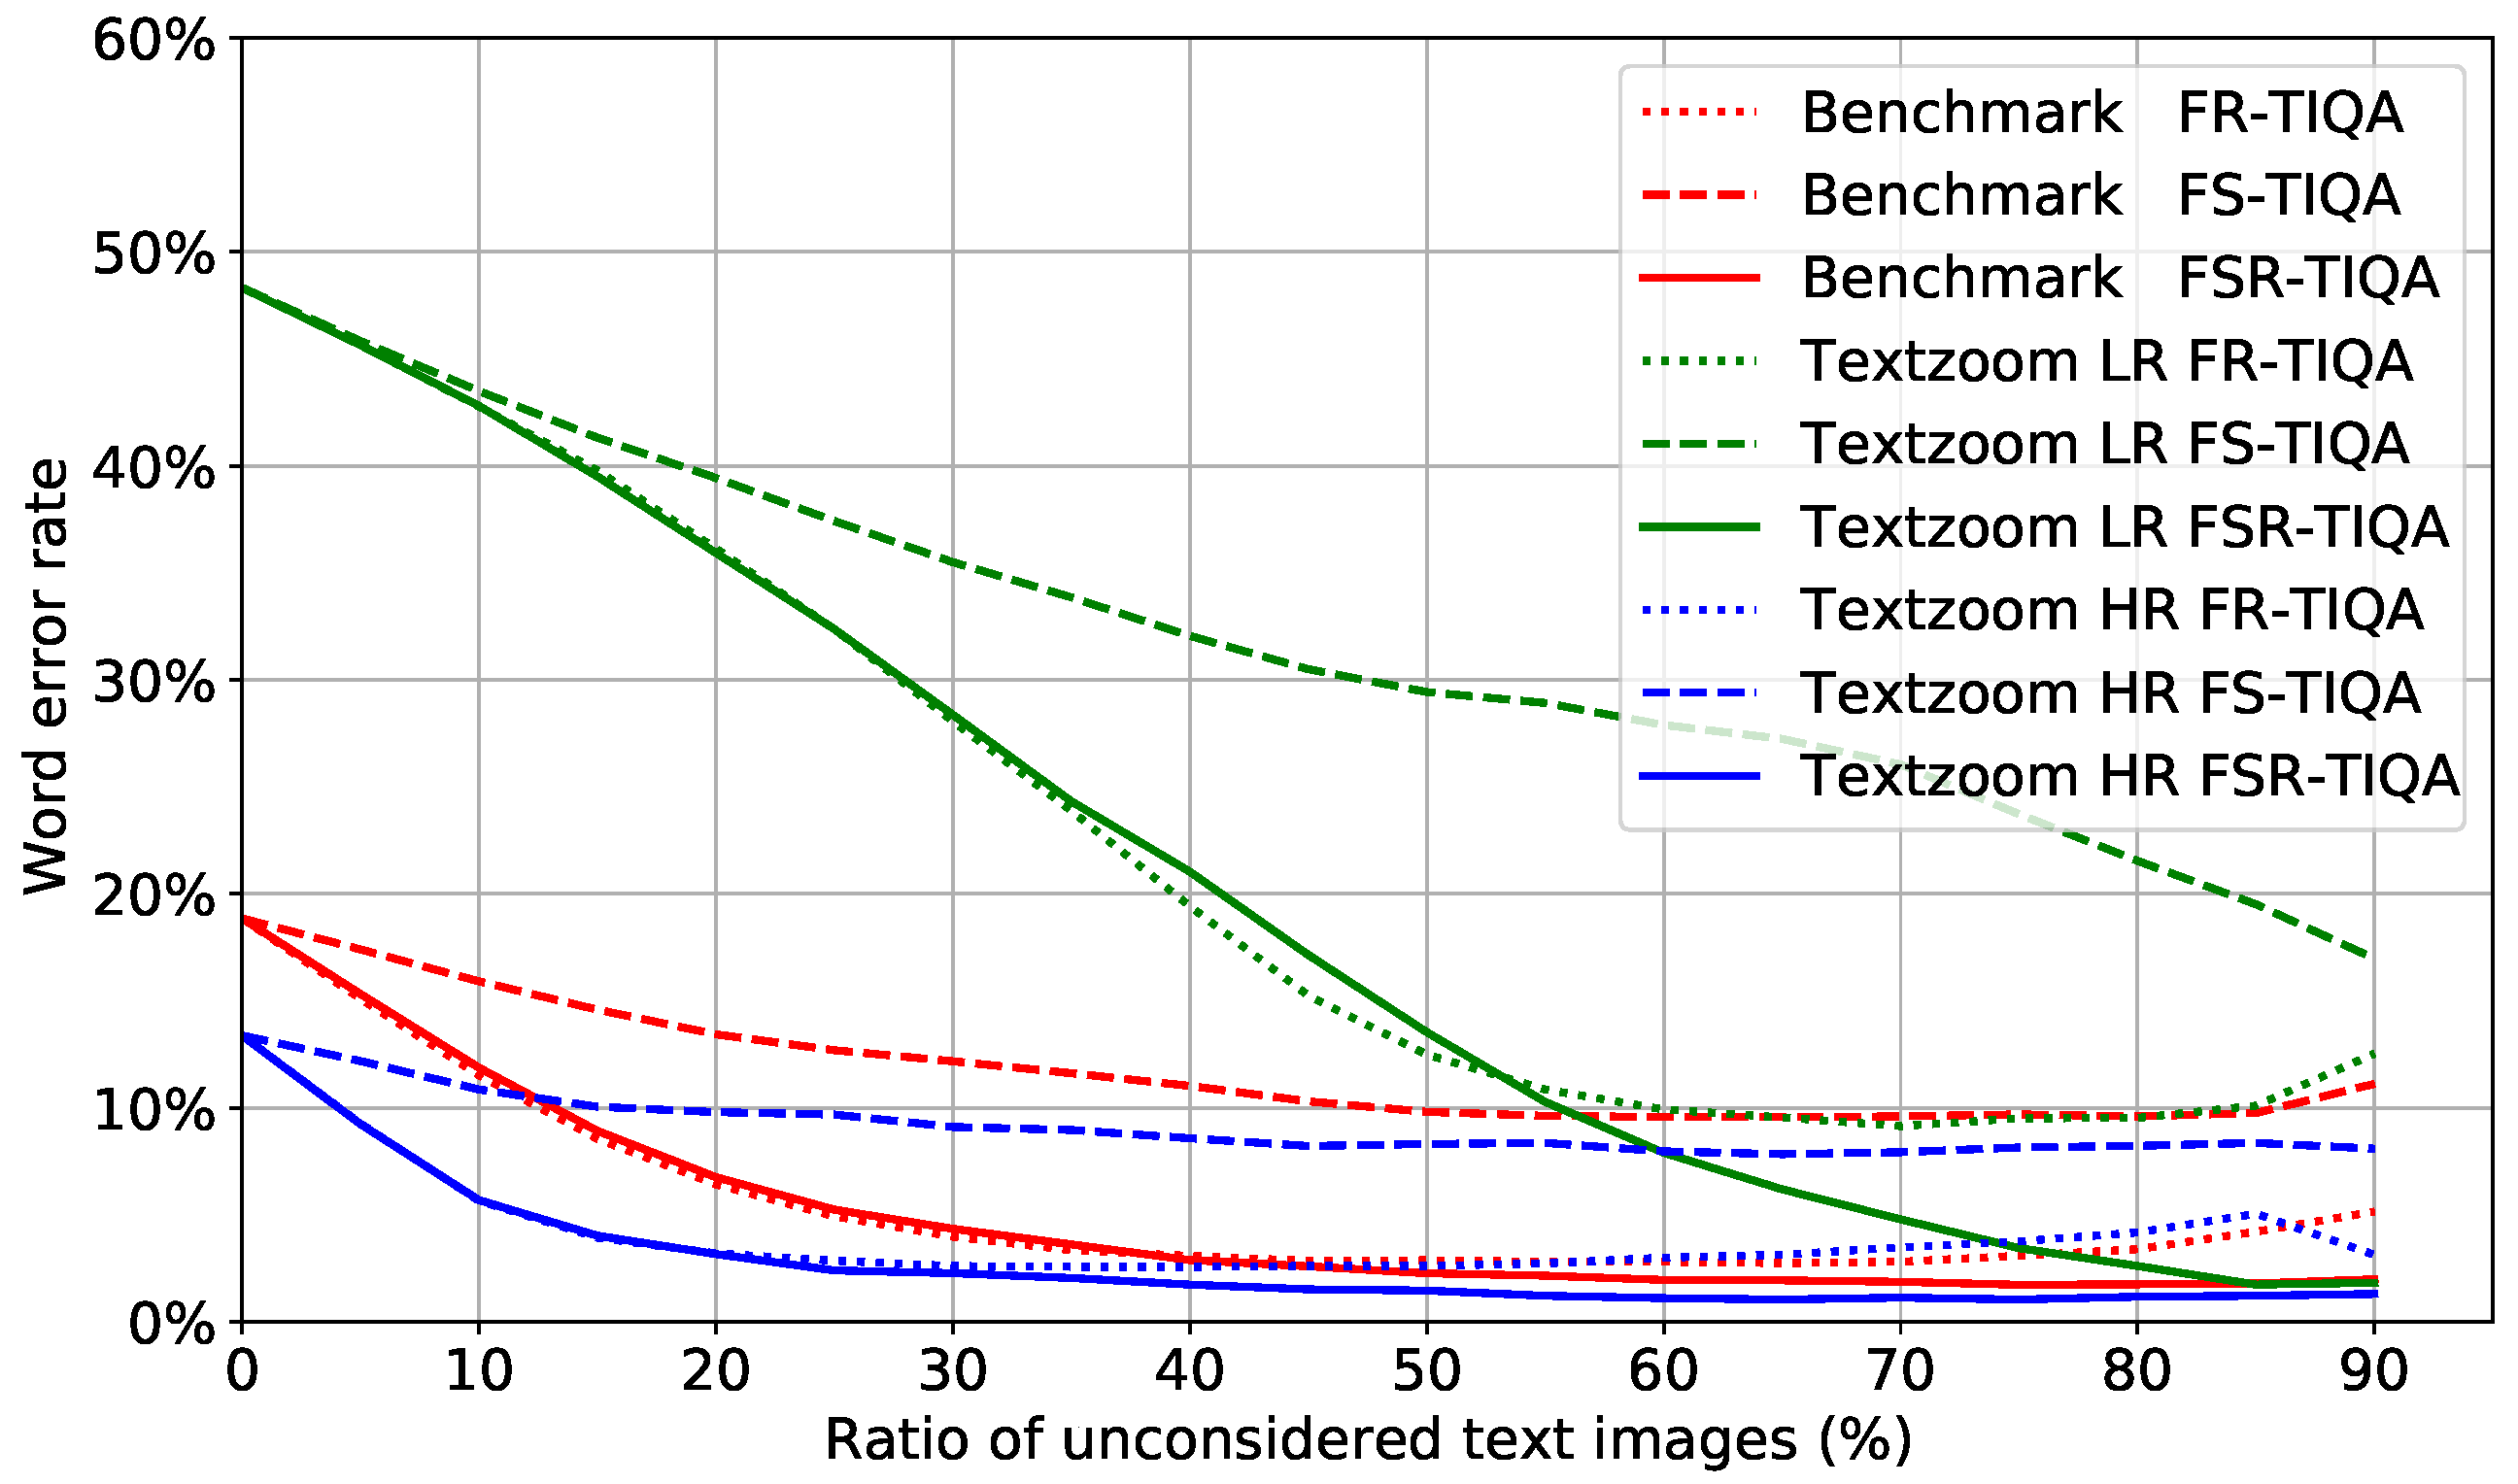
In our experiments, we report the quality assessment performance on benchmarks and Textzoom from the character level, image level, and dataset level. The proposed FSR-TIQA method is compared with the analytics-based method BRISQUE [17], which is reproduced using the released codes directly. The results of BRISQUE and FSR-TIQA are shown in Figure 7. In the three LR datasets, the word error rate decreases when the proportion of unconsidered images increases. In most datasets, BRISQUE lead to an increase in the word error rate. The results demonstrate that analytics-based methods are not suitable for assessing text images with rich semantic information. It is necessary to design a text image quality assessment method according to the characteristics of the text.
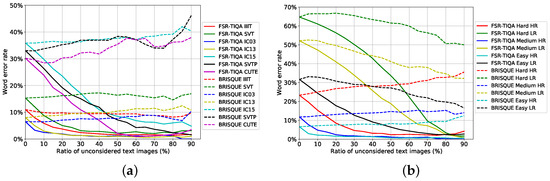
Figure 7.
Text recognition performance on the predicted text image quality score. The curves show the effectiveness of rejecting low-quality text images in datasets. (a) shows the result for benchmarks. (b) shows the same for three subsets in Textzoom.
4.2.1. Results on Character Quality Score
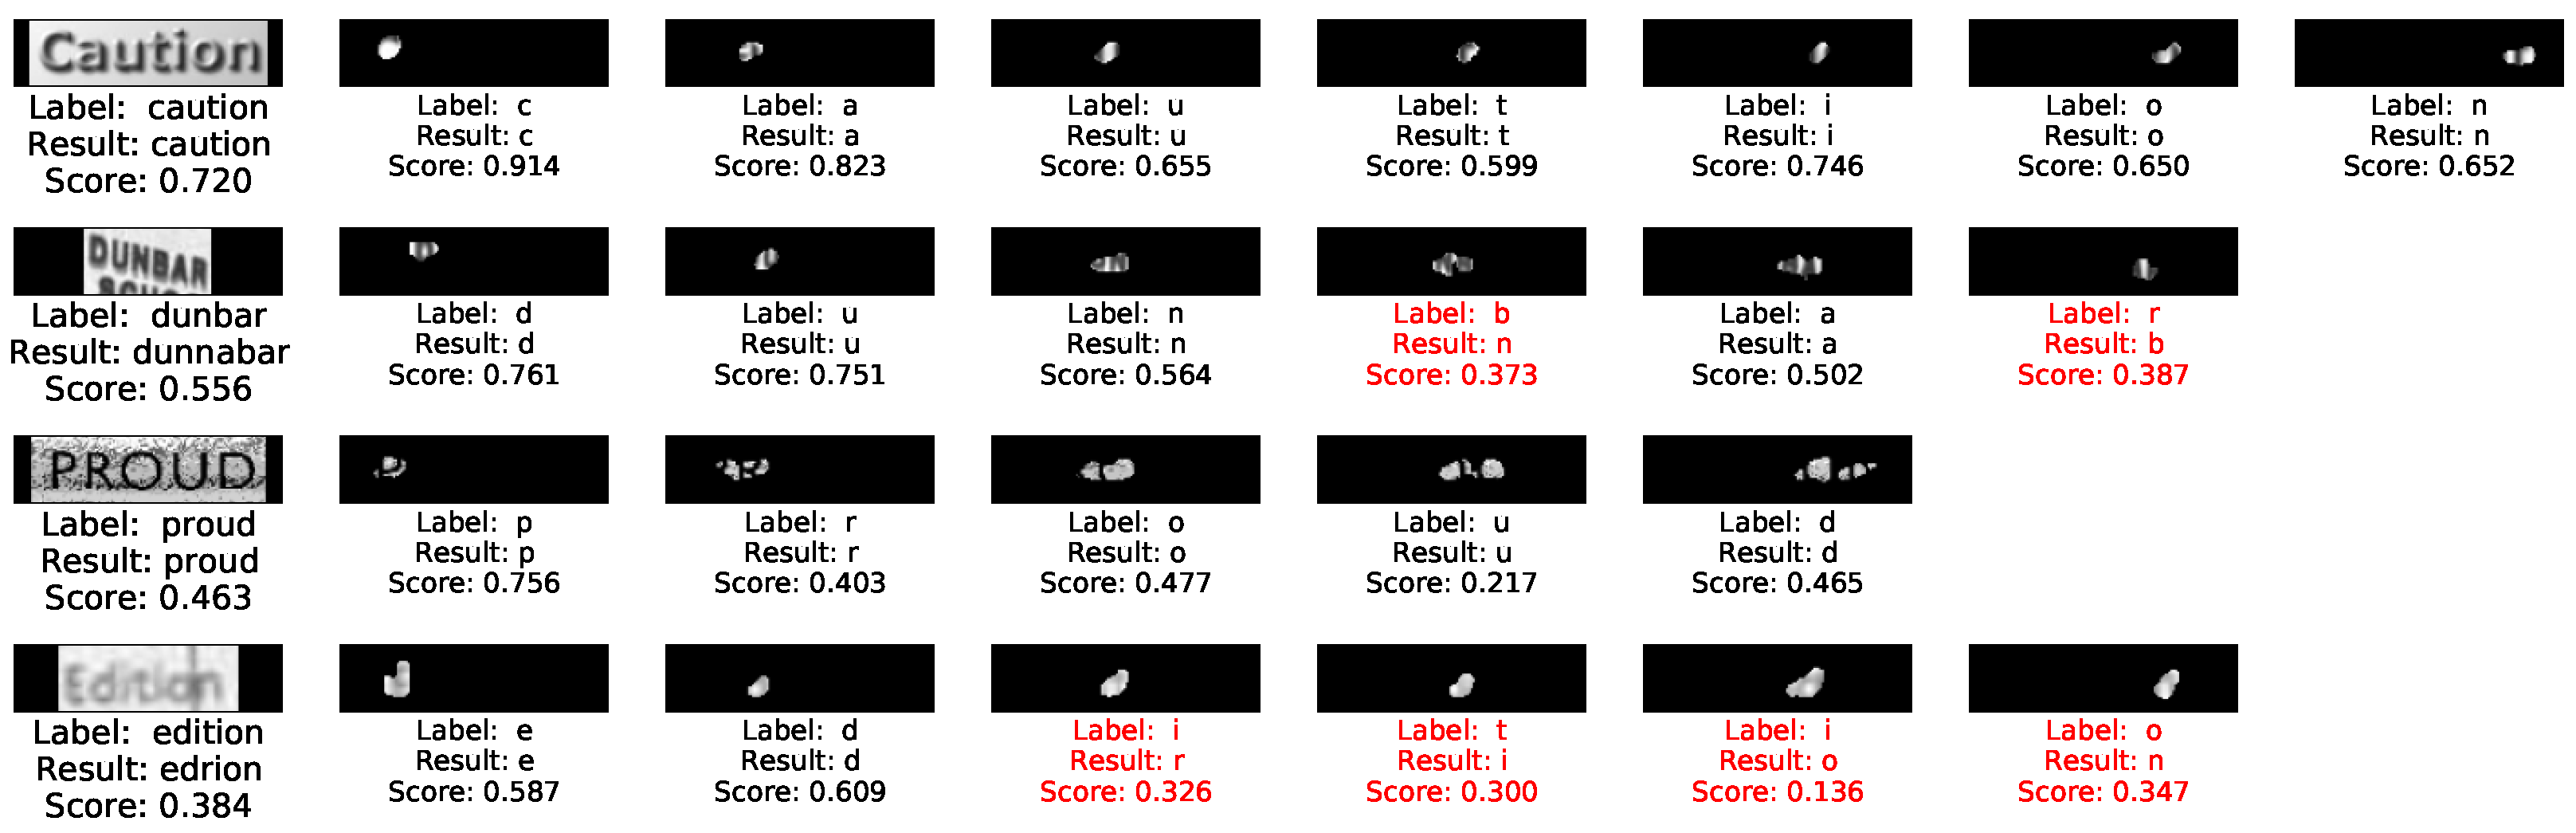
To better understand how fine-grained images work in FSR-TIQA, we visualize the character region and score results in Figure 8. On the one hand, “caution” is a high-quality text image, almost every character obtains a score of more than 0.7. On the other hand, our method can provide unclear characters (“proud”) and misrecognized characters (“b” and “r” in “dunbar”) lower scores. The Haralick feature and Wasserstein distance of each character are contributed to the quality score of whole text image. The proposed character region and embedding extraction method shows a powerful assessment capabilities from the character level.
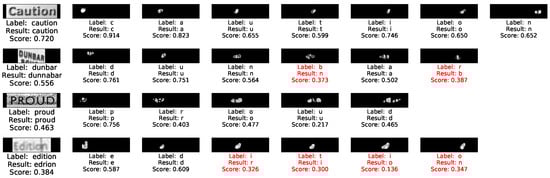
Figure 8.
Samples text images from benchmark with the corresponding quality scores of each character in it.
4.2.2. Results on Benchmarks
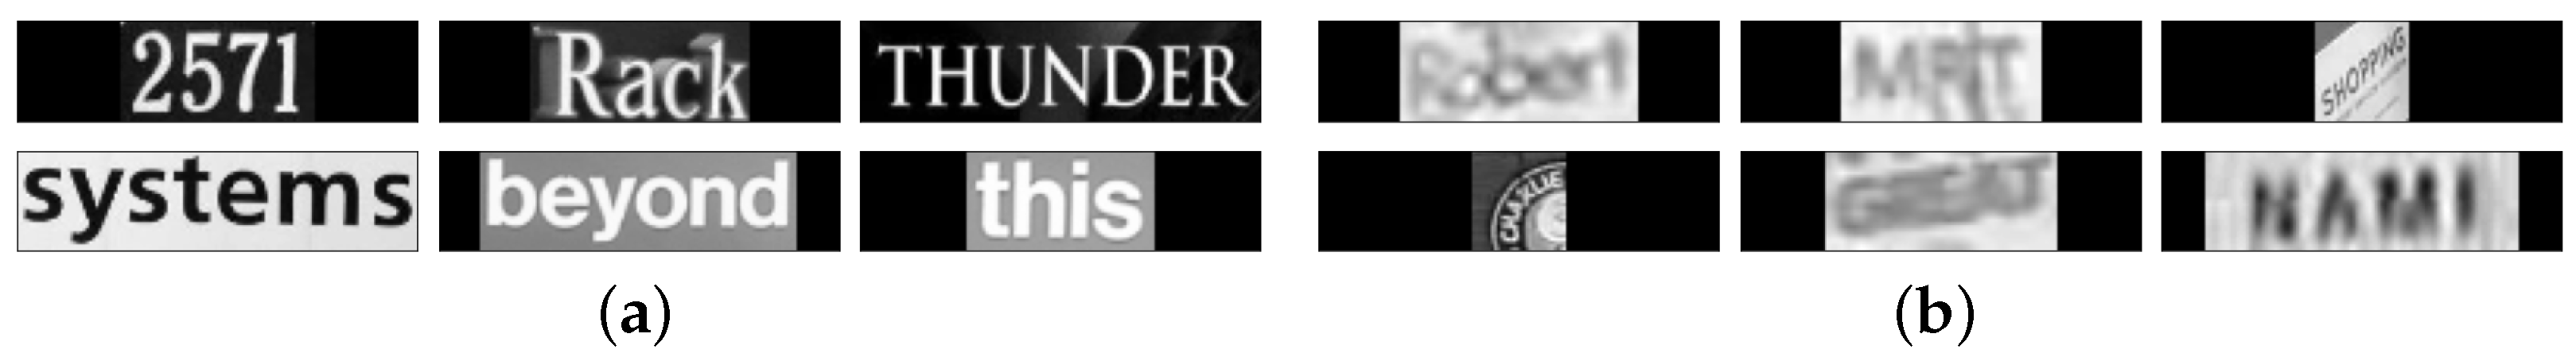
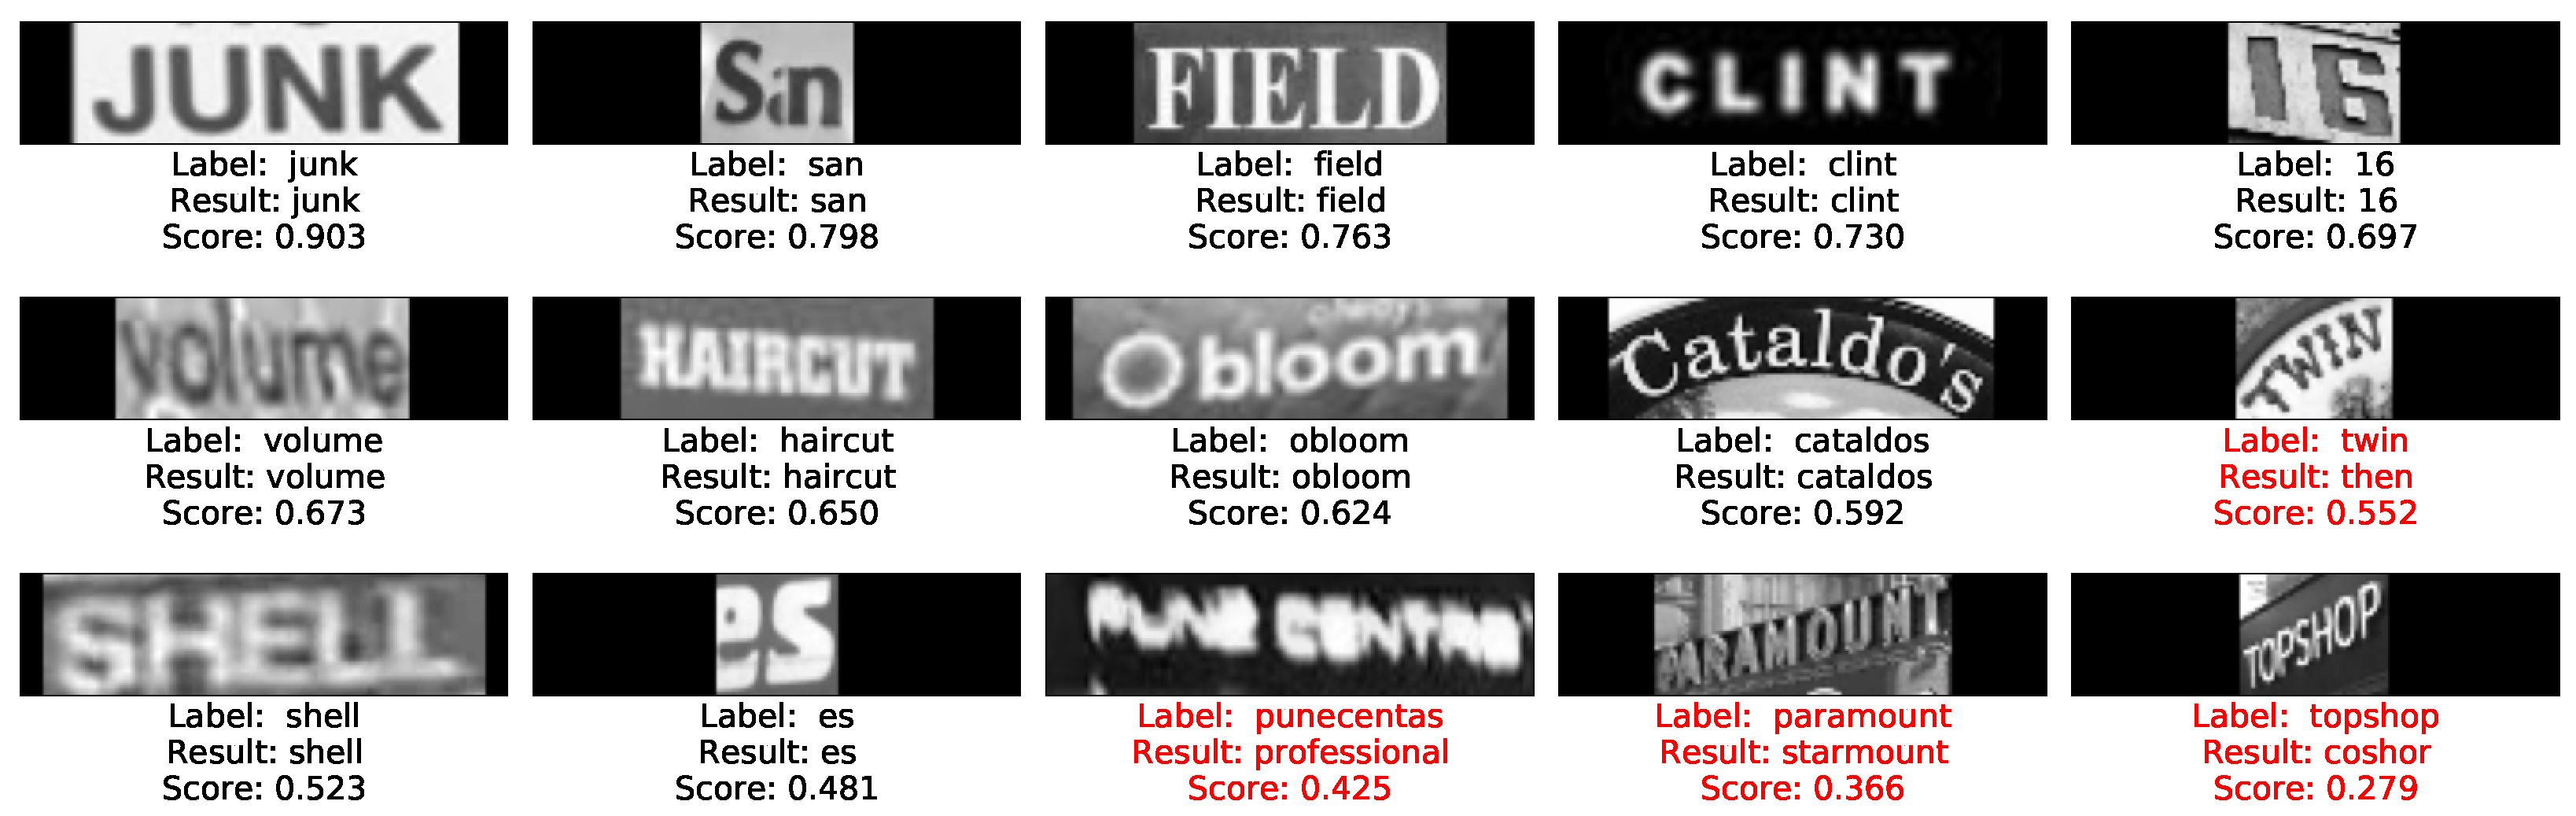
From the quality score of single image, Figure 9 shows benchmark images with perdition quality scores. We can observe: (1) from the perspective of image texture, text images with high quality scores usually have standard fonts, sharp edges, and high contrast with the background color. In contrast, text images with low scores are harder to identify the character and edge between content and background. (2) From the perspective of recognition result, easy samples have high scores and accuracy; meanwhile, correctly recognized hard examples can also obtain lower scores due to the bad texture feature.
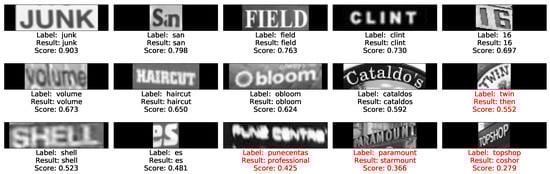
Figure 9.
Samples text images from benchmarks with the corresponding quality scores, recognition ground truth, and results.
From the view of whole dataset, EVRC is shown in Figure 7a. Unconsidered images with low-quality scores were removed from the dataset and the error rate was calculated on the remaining images. The word error rate (WER) sharply decreases with the increase in the ratio of unconsidered images. Although the WER was higher for IC15, SVTP, and CUTE, the curve of CUTE falls faster. This is because the image quality of CUTE is better, and the main reason for the recognition error is the irregular shape of the text. From the experiments we can conclude: (1) the quality scores are strongly correlated with recognizability of text images. (2) our FSR-TIQA is sensitive to text image texture feature.
4.2.3. Results on Textzoom
We also test our FSR-TIQA on three subsets of Textzoom. With the help of FSR-TIQA, the quality score of each image can be easily calculated. The EVRC of Textzoom is shown in Figure 7b. From the downward trend of the curve, it can be seen that the decline rate of the three LR subsets is slower. That is to say, the LR subsets contain more difficult text images. Meanwhile, high-scoring data in the Easy subset and low-scoring data in the Hard subset are selected, as shown in Figure 10. From the quality score perspective, there is a small percentage of data that do not match the difficulty it belongs to. Labeling datasets with subjective metrics is difficult. In our view, dataset difficulty should be divided according to its quality score. In this way, the performance of the STR system and image restoration network can be better reflected. Our FSR-TIQA can provide a new approach for data difficulty classification.
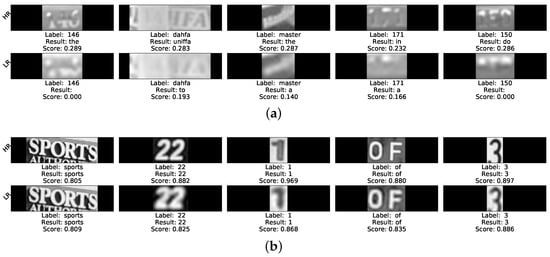
Figure 10.
Samples text images from Textzoom with the corresponding quality scores, recognition ground-truth and results. (a) shows the paired images with low quality scores in Easy subset. (b) shows the paired images with high quality scores in Hard subset.
4.2.4. Results on Quality Score Distribution
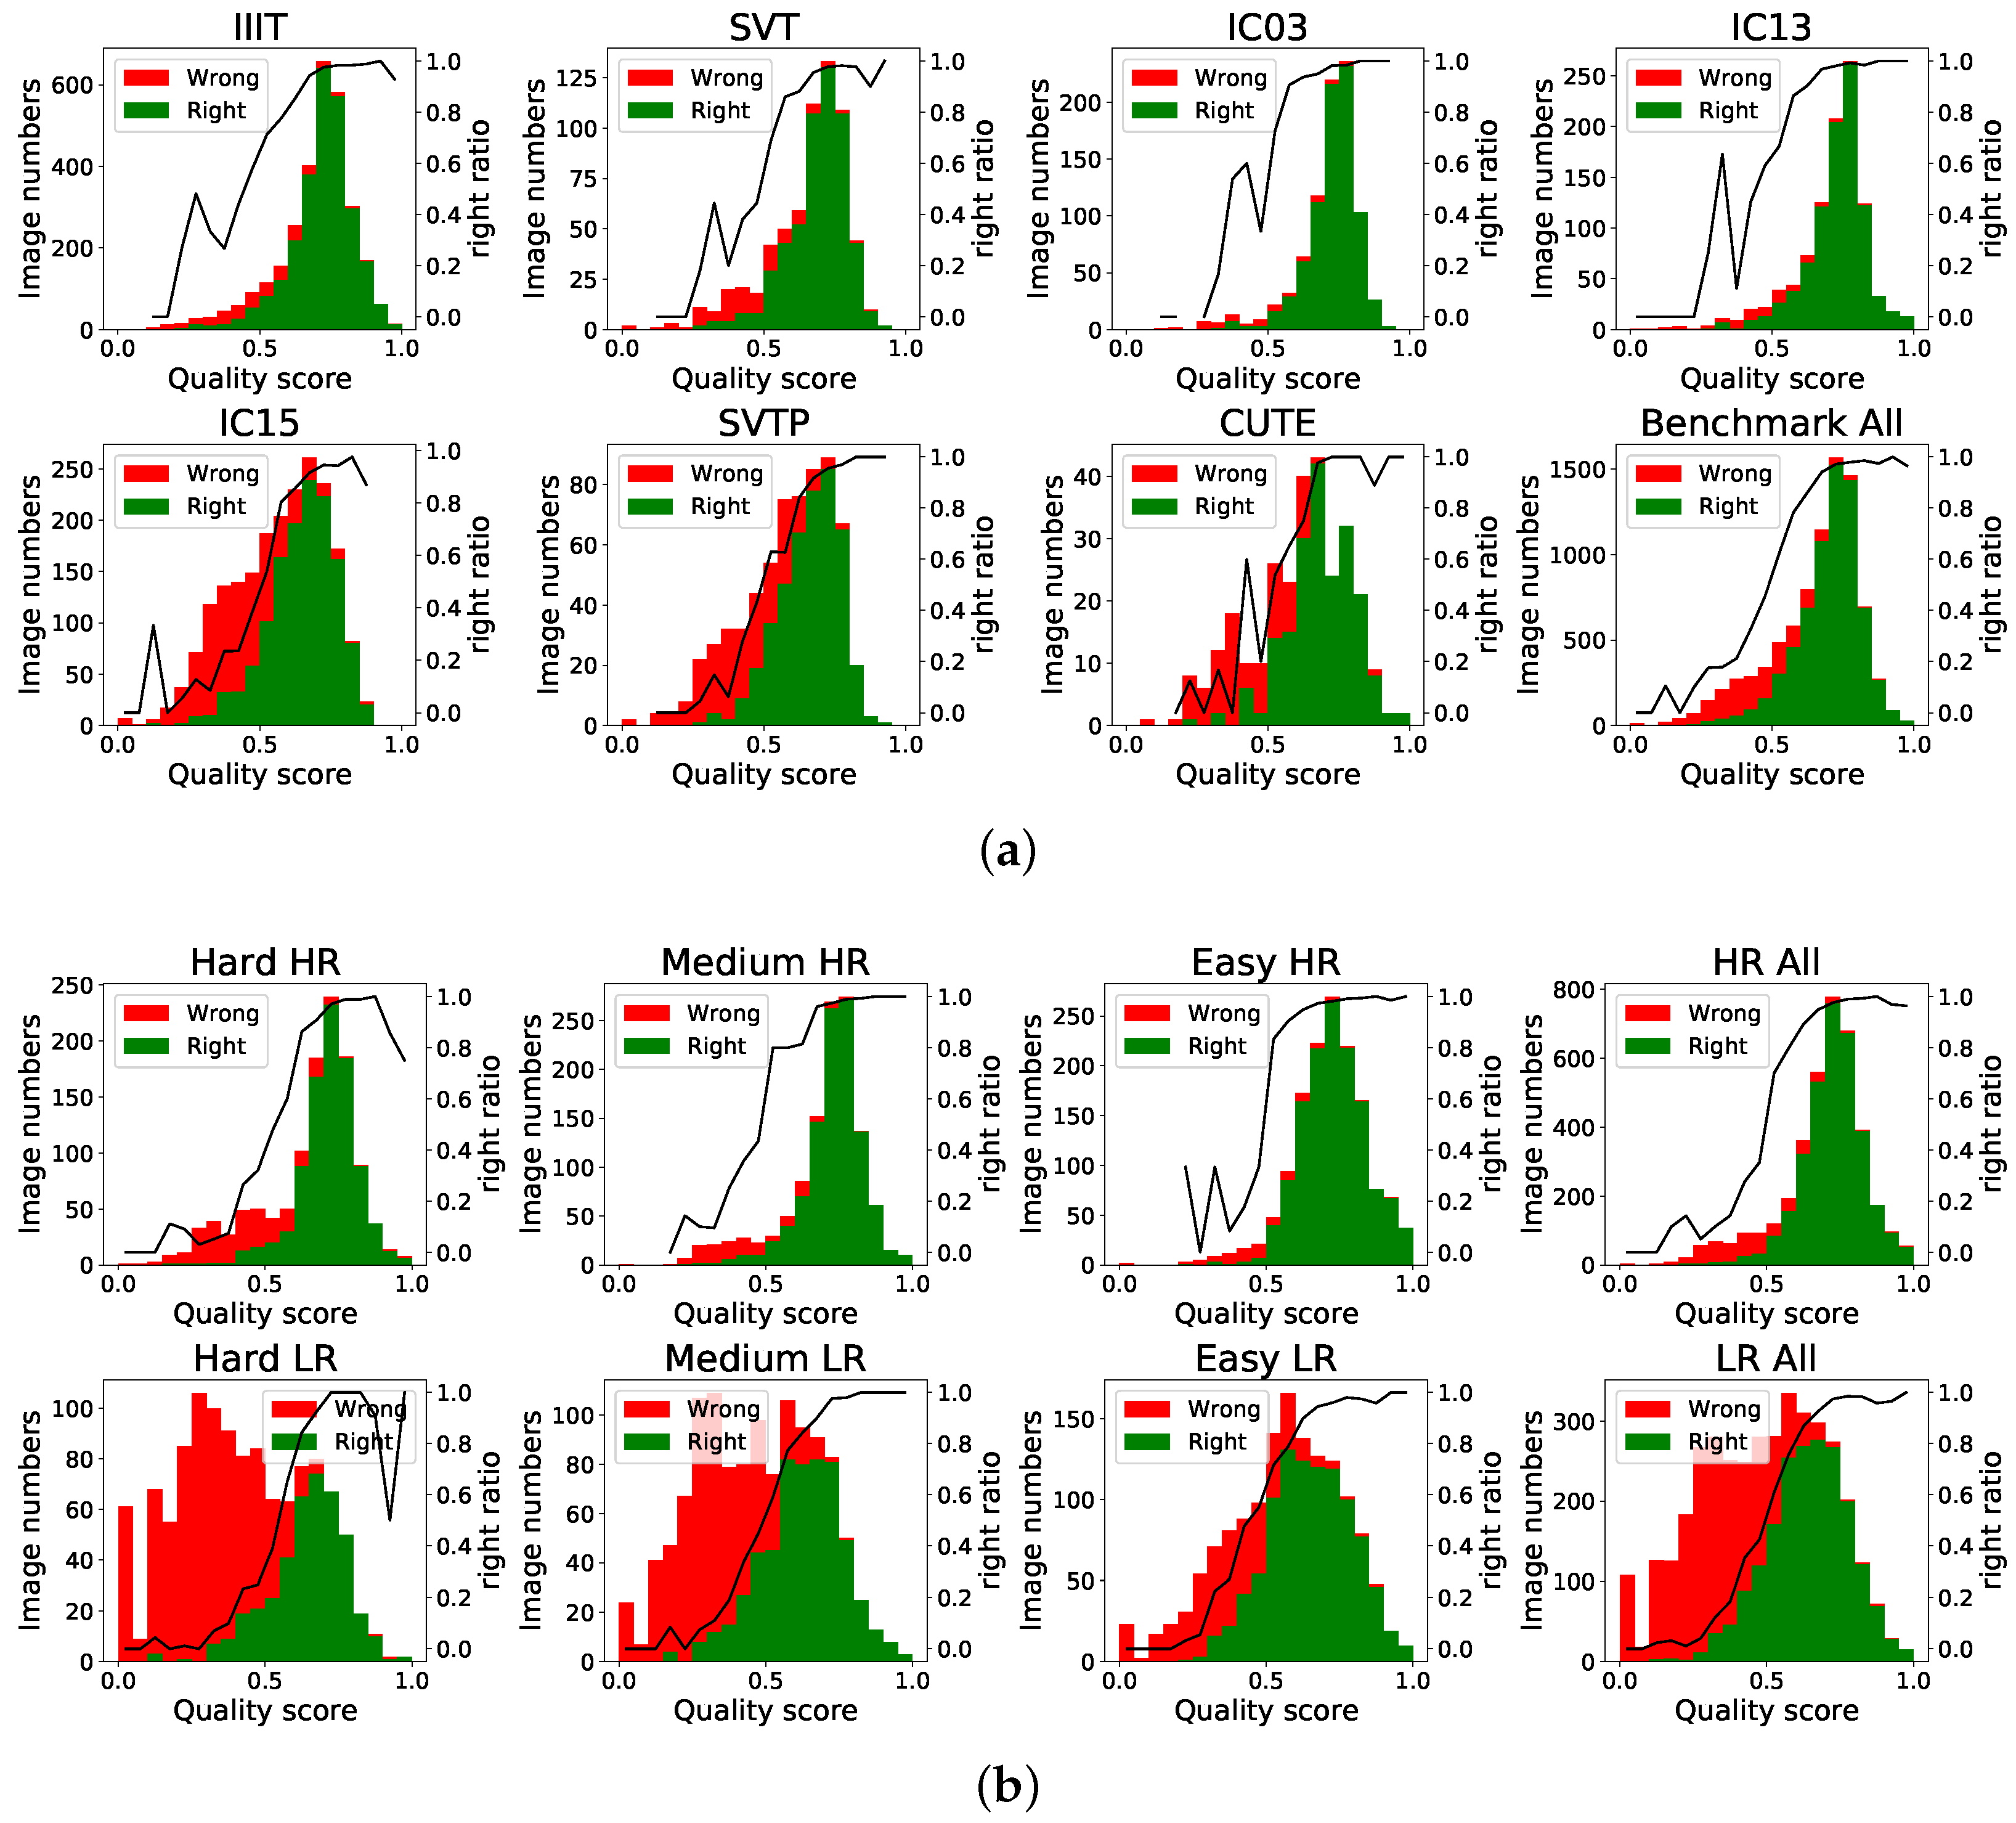
We also implement an experiment to investigate whether there is a significant correlation between the quality score and texture feature or embedding robustness. The quality score distribution results on the benchmark and Textzoom dataset are shown in Figure 11. The quality score is divided into 20 intervals of 0.05.
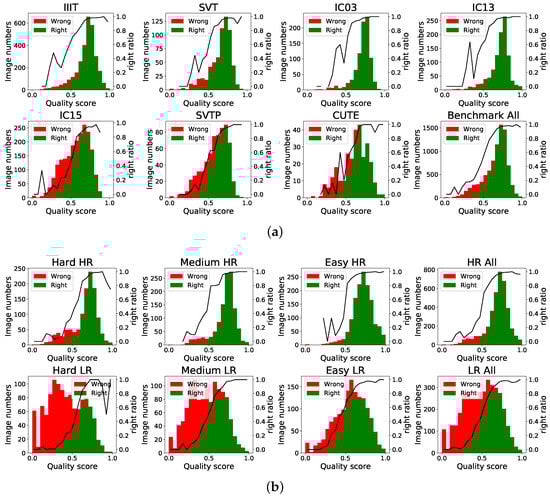
Figure 11.
Score distribution map of benchmarks and Textzoom. The last figure in (a) shows the overall distribution of the benchmark. The last row in (b) shows the overall distribution of the HR and LR dataset. We divide the scores into 20 parts and calculate the proportion of correctly recognized samples shown in black line.
From the overall distribution of the dataset scores, most of the text image quality scores are concentrated between 0.6 and 0.9. For low-resolution datasets, the proportion of low-scoring samples increases. It can be seen from the proportion of the correctly identified samples: (1) When the score is greater than 0.7, the main part is the correctly recognized text image. (2) When the score is less than 0.4, more images are misidentified. (3) Meanwhile we notice that samples with scores between 0.4 and 0.7, the recognition results are less discriminative. The low discrimination of this part of the sample scores is mainly related to the two scoring perspectives. It is reasonable to exist some samples with clear texture but wrongly identified or poor textured but correctly identified samples. The recognizer should improve the recognition accuracy of this part of the data to improve the overall system robustness.
4.2.5. Generalization on License Plate Datasets
We further explore the generalization of FSR-TIQA on other text image datasets. License plate recognition is a hot topic in intelligent transportation systems and computer vision. The license plate image is a special kind of text image. We chose two Chinese license plate datasets: CLPD [40] and CCPD [41]. The CLPD dataset contains 1200 images of all provinces in mainland China based on the real environment. CCPD contains more than 290k images under a variety of conditions. We chose the Challenge subset in CCPD.
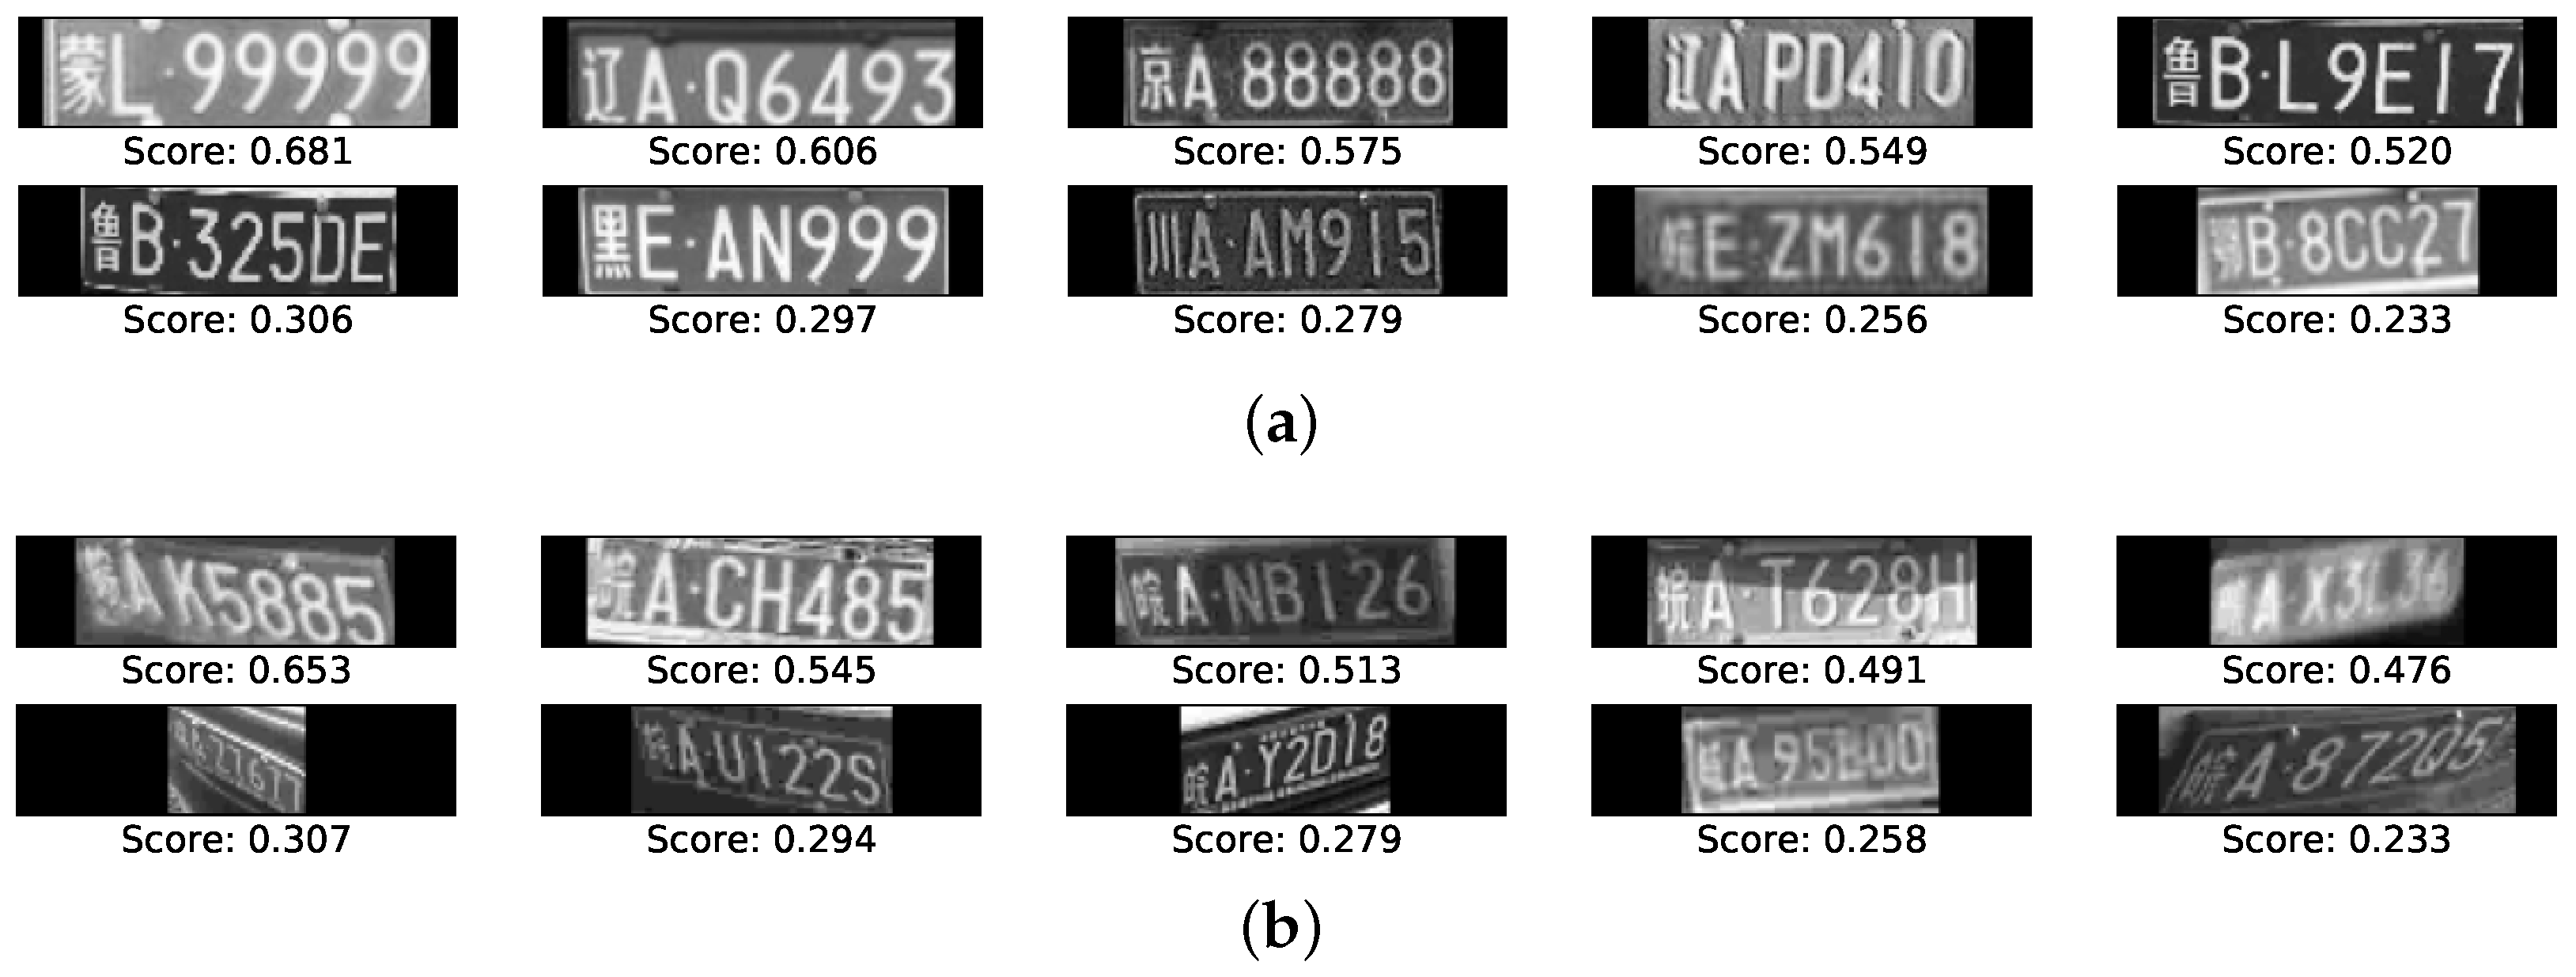
In our experiment, since the STR system used in FSR-TIQA can only recognize numbers and letters, the first character of each image is not considered during assessment. The score is shown in Figure 12 which suggests that, although our method is not trained on the license plate dataset, FSR-TIQA is consistent in scoring the texture features of license plate images.

Figure 12.
Samples license plate images from CLPD (a) and CCPD Challenge subset (b) with the corresponding quality scores.
4.3. Ablation Study on FSR-TIQA
In this subsection, an ablation study is presented to reason the design choices of the proposed method with respect to clear texture feature and embedding robustness. Hereafter, the method that only evaluates character texture feature is denoted by FS-TIQA, and the method that only evaluates character embedding robustness is denoted by FR-TIQA. The EVRC of benchmark, LR, and HR datasets in Textzoom are shown in Figure 13. FS-TIQA fits character texture features to character recognition results through the quality score network. The falling curve of FS-TIQA represents the relationship between a character texture feature and the ability of the a text image to be recognized. The character similarity distribution distance is used for assessing text image quality in FR-TIQA. The word error rate of FR-FIQA sharply decreases with the increase in the ratio of unconsidered images in the beginning; however, when the ratio is greater than 50%, FR-FIQA and FS-FIQA have poor quality score discrimination for the remaining images. It can be clearly seen that FSR-TQIA provides much higher performance and maintains stronger discrimination across all data than FS-TIQA and FR-TIQA in all test datasets. As a result, the quality of text images can be evaluated more comprehensively from the dimension of sharp texture feature and embedding robustness.
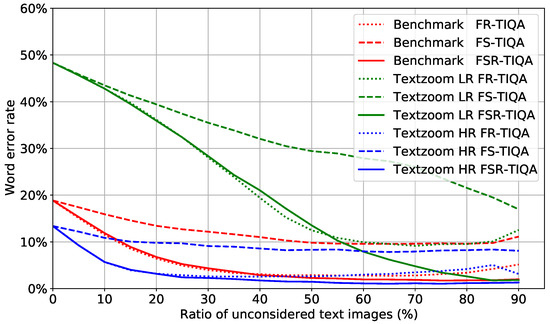
Figure 13.
Text recognition performance of proposed methods on benchmark, LR, and HR datasets in Textzoom. The EVRC shows the effectiveness of rejecting low-quality text images.
5. Conclusions
In this work, we are the first to propose a text image quality assessment framework from three perspectives: character-level-based evaluation, clear texture feature, and embedding robustness. Correspondingly, we propose a learning-based fine-grained, sharp, and recognizable text image quality assessment method. With the help of an attention recognizer, we evaluate each character in text images. The Wasserstein distance between the intra-class and inter-class similarity distributions is used to evaluate embedding robustness. The multiscale Haralick feature reflects the degree and clarity of the texture feature of character region. A quality score network is designed under the label-free training manner to normalize the texture feature and output the quality score. Extensive experiments indicate that FSR-TIQA has significant discrimination for different quality text images on benchmarks and Textzoom datasets from the character level, image level, and dataset level. The results on license plate dataset shows that our FSR-TIQA can generalize to more text datasets.
To some extent, our method provides a new way to assess text datasets based on image quality. This is helpful for selecting training sets in restricted scenarios and evaluating STR systems using datasets of different quality. In the future, FSR-TIQA can improve the recognition capability and range of the STR system to assess a wider variety of text images.
Author Contributions
Conceptualization, Z.J.; methodology, Z.J.; software, Z.J.; validation, S.X.; writing—original draft preparation, Z.J.; writing—review and editing, Y.T., S.M., and S.X.; supervision, S.X.; funding acquisition, S.X. All authors have read and agreed to the published version of the manuscript.
Funding
This work was supported by the National Natural Science Foundation of China (NSFC) under Grants 61871262, 61901251, 61904101 and 62071284, the Innovation Program of Shanghai Municipal Science and Technology Commission under Grants 21ZR1422400, 20JC1416400 and 20511106603, Pudong New Area Science & Technology Development Fund, Key-Area Research and Development Program of Guangdong Province under Grant 2020B0101130012, and Foshan Science and Technology Innovation Team Project under Grant FS0AA-KJ919-4402-0060.
Conflicts of Interest
The authors declare no conflict of interest.
References
- Shi, B.; Bai, X.; Yao, C. An end-to-end trainable neural network for image-based sequence recognition and its application to scene text recognition. IEEE Trans. Pattern Anal. Mach. Intell. 2016, 39, 2298–2304. [Google Scholar] [CrossRef] [PubMed] [Green Version]
- Shi, B.; Yang, M.; Wang, X.; Lyu, P.; Yao, C.; Bai, X. Aster: An attentional scene text recognizer with flexible rectification. IEEE Trans. Pattern Anal. Mach. Intell. 2018, 41, 2035–2048. [Google Scholar] [CrossRef] [PubMed]
- Wang, T.; Zhu, Y.; Jin, L.; Luo, C.; Chen, X.; Wu, Y.; Wang, Q.; Cai, M. Decoupled attention network for text recognition. Aaai Conf. Artif. Intell. 2020, 34, 12216–12224. [Google Scholar] [CrossRef]
- Jia, Z.; Xu, S.; Mu, S.; Tao, Y.; Cao, S.; Chen, Z. IFR: Iterative Fusion Based Recognizer for Low Quality Scene Text Recognition. Chinese Conference on Pattern Recognition and Computer Vision (PRCV); Springer: Berlin/Heidelberg, Germany, 2021; pp. 180–191. [Google Scholar]
- Tao, Y.; Jia, Z.; Ma, R.; Xu, S. TRIG: Transformer-Based Text Recognizer with Initial Embedding Guidance. Electronics 2021, 10, 2780. [Google Scholar] [CrossRef]
- Wang, W.; Xie, E.; Liu, X.; Wang, W.; Liang, D.; Shen, C.; Bai, X. Scene text image super-resolution in the wild. European Conference on Computer Vision; Springer: Berlin/Heidelberg, Germany, 2020; pp. 650–666. [Google Scholar]
- Fang, S.; Xie, H.; Wang, Y.; Mao, Z.; Zhang, Y. Read Like Humans: Autonomous, Bidirectional and Iterative Language Modeling for Scene Text Recognition. In Proceedings of the IEEE/CVF Conference on Computer Vision and Pattern Recognition, Nashville, TN, USA, 20–25 June 2021; pp. 7098–7107. [Google Scholar]
- Chen, J.; Li, B.; Xue, X. Scene Text Telescope: Text-Focused Scene Image Super-Resolution. In Proceedings of the IEEE/CVF Conference on Computer Vision and Pattern Recognition, Nashville, TN, USA, 20–25 June 2021; pp. 12026–12035. [Google Scholar]
- Ma, J.; Guo, S.; Zhang, L. Text Prior Guided Scene Text Image Super-resolution. arXiv 2021, arXiv:2106.15368. [Google Scholar]
- Nakaune, S.; Iizuka, S.; Fukui, K. Skeleton-Aware Text Image Super-Resolution; University of Tsukuba: Tsukuba, Japan, 2021. [Google Scholar]
- Chen, J.; Yu, H.; Ma, J.; Li, B.; Xue, X. Text Gestalt: Stroke-Aware Scene Text Image Super-Resolution. arXiv 2021, arXiv:2112.08171. [Google Scholar]
- Mou, Y.; Tan, L.; Yang, H.; Chen, J.; Liu, L.; Yan, R.; Huang, Y. PlugNet: Degradation Aware Scene Text Recognition Supervised by a Pluggable Super-Resolution Unit. In Proceedings of the 16th European Conference on Computer Vision (ECCV 2020), Glasgow, UK, 23–28 August 2020; pp. 1–17. [Google Scholar]
- Zhai, G.; Min, X. Perceptual image quality assessment: A survey. Sci. China Inf. Sci. 2020, 63, 211301. [Google Scholar] [CrossRef]
- Zhou, W.; Chen, Z. Deep multi-scale features learning for distorted image quality assessment. In Proceedings of the 2021 IEEE International Symposium on Circuits and Systems (ISCAS) IEEE, Daegu, Korea, 22–28 May 2021; pp. 1–5. [Google Scholar]
- Ou, F.Z.; Chen, X.; Zhang, R.; Huang, Y.; Li, S.; Li, J.; Li, Y.; Cao, L.; Wang, Y.G. Sdd-fiqa: Unsupervised face image quality assessment with similarity distribution distance. In Proceedings of the IEEE/CVF Conference on Computer Vision and Pattern Recognition, Nashville, TN, USA, 20–25 June 2021; pp. 7670–7679. [Google Scholar]
- Terhorst, P.; Kolf, J.N.; Damer, N.; Kirchbuchner, F.; Kuijper, A. SER-FIQ: Unsupervised estimation of face image quality based on stochastic embedding robustness. In Proceedings of the IEEE/CVF Conference on Computer Vision and Pattern Recognition, Seattle, WA, USA, 14–19 June 2020; pp. 5651–5660. [Google Scholar]
- Mittal, A.; Moorthy, A.K.; Bovik, A.C. No-Reference image quality assessment in the spatial domain. IEEE Trans. Image Process. 2012, 21, 4695–4708. [Google Scholar] [CrossRef] [PubMed]
- Zhou, W.; Chen, Z.; Li, W. Dual-Stream interactive networks for no-reference stereoscopic image quality assessment. IEEE Trans. Image Process. 2019, 28, 3946–3958. [Google Scholar] [CrossRef] [PubMed]
- Shen, W.; Ren, Q.; Liu, D.; Zhang, Q. Interpreting Representation Quality of DNNs for 3D Point Cloud Processing. Adv. Neural Inf. Process. Syst. 2021, 34, 1–14. [Google Scholar]
- Qiao, Z.; Zhou, Y.; Yang, D.; Zhou, Y.; Wang, W. Seed: Semantics enhanced encoder-decoder framework for scene text recognition. In Proceedings of the IEEE/CVF Conference on Computer Vision and Pattern Recognition, Seattle, WA, USA, 14–19 June 2020; pp. 13528–13537. [Google Scholar]
- Schroff, F.; Kalenichenko, D.; Philbin, J. Facenet: A unified embedding for face recognition and clustering. In Proceedings of the IEEE Conference on Computer Vision and Pattern Recognition, Boston, MA, USA, 7–12 June 2015; pp. 815–823. [Google Scholar]
- Haralick, R.M.; Shanmugam, K.; Dinstein, I.H. Textural features for image classification. IEEE Trans. Syst. Man Cybern. 1973, 6, 610–621. [Google Scholar] [CrossRef] [Green Version]
- Xu, J.; Zhou, W.; Chen, Z. Blind omnidirectional image quality assessment with viewport oriented graph convolutional networks. IEEE Trans. Circuits Syst. Video Technol. 2020, 31, 1724–1737. [Google Scholar] [CrossRef]
- Zhou, W.; Jiang, Q.; Wang, Y.; Chen, Z.; Li, W. Blind quality assessment for image superresolution using deep two-stream convolutional networks. Inf. Sci. 2020, 528, 205–218. [Google Scholar] [CrossRef] [Green Version]
- Schlett, T.; Rathgeb, C.; Henniger, O.; Galbally, J.; Fierrez, J.; Busch, C. Face image quality assessment: A literature survey. ACM Computing Surveys (CSUR) 2021. [Google Scholar] [CrossRef]
- Gao, X.; Li, S.Z.; Liu, R.; Zhang, P. Standardization of face image sample quality. In Proceedings of the International Conference on Biometrics, Seoul, Korea, 27–29 August 2007; Springer: Berlin/Heidelberg, Germany, 2007; pp. 242–251. [Google Scholar]
- Wasnik, P.; Raja, K.B.; Ramachandra, R.; Busch, C. Assessing face image quality for smartphone based face recognition system. In Proceedings of the 2017 5th International Workshop on Biometrics and Forensics (IWBF) IEEE, Coventry, UK, 4–5 April 2017; pp. 1–6. [Google Scholar]
- Aggarwal, G.; Biswas, S.; Flynn, P.J.; Bowyer, K.W. Predicting performance of face recognition systems: An image characterization approach. In Proceedings of the CVPR 2011 WORKSHOPS, Colorado Springs, CO, USA, 20–25 June 2011; pp. 52–59. [Google Scholar]
- Meng, Q.; Zhao, S.; Huang, Z.; Zhou, F. Magface: A universal representation for face recognition and quality assessment. In Proceedings of the IEEE/CVF Conference on Computer Vision and Pattern Recognition, Nashville, TN, USA, 20–25 June 2021; pp. 14225–14234. [Google Scholar]
- Long, J.; Shelhamer, E.; Darrell, T. Fully convolutional networks for semantic segmentation. In Proceedings of the IEEE Conference on Computer Vision and Pattern Recognition, Boston, MA, USA, 7–12 June 2015; pp. 3431–3440. [Google Scholar]
- Otsu, N. A threshold selection method from gray-level histograms. IEEE Trans. Syst. Man, Cybern. 1979, 9, 62–66. [Google Scholar] [CrossRef] [Green Version]
- Lucas, S.M.; Panaretos, A.; Sosa, L.; Tang, A.; Wong, S.; Young, R.; Ashida, K.; Nagai, H.; Okamoto, M.; Yamamoto, H.; et al. ICDAR 2003 robust reading competitions: Entries, results, and future directions. Int. J. Doc. Anal. Recognit. (IJDAR) 2005, 7, 105–122. [Google Scholar] [CrossRef]
- Karatzas, D.; Shafait, F.; Uchida, S.; Iwamura, M.; i Bigorda, L.G.; Mestre, S.R.; Mas, J.; Mota, D.F.; Almazan, J.A.; De Las Heras, L.P. ICDAR 2013 robust reading competition. In Proceedings of the 2013 12th International Conference on Document Analysis and Recognition, Washington, DC, USA, 25–28 August 2013; pp. 1484–1493. [Google Scholar]
- Karatzas, D.; Gomez-Bigorda, L.; Nicolaou, A.; Ghosh, S.; Bagdanov, A.; Iwamura, M.; Matas, J.; Neumann, L.; Chandrasekhar, V.R.; Lu, S.; et al. ICDAR 2015 competition on robust reading. In Proceedings of the 13th International Conference on Document Analysis and Recognition), Tunis, Tunisia, 23–26 August 2015; pp. 1156–1160. [Google Scholar]
- Mishra, A.; Alahari, K.; Jawahar, C. Scene text recognition using higher order language priors. In Proceedings of the British Machine Vision Conference (BMVC), Virtual, 22–25 November 2012. [Google Scholar]
- Wang, K.; Babenko, B.; Belongie, S. End-to-end scene text recognition. In Proceedings of the 2011 International Conference on Computer Vision IEEE, Washington, DC, USA, 20–25 June 2011; pp. 1457–1464. [Google Scholar]
- Quy Phan, T.; Shivakumara, P.; Tian, S.; Lim Tan, C. Recognizing text with perspective distortion in natural scenes. In Proceedings of the IEEE International Conference on Computer Vision, Sydney, NSW, Australia, 2–8 December 2013; pp. 569–576. [Google Scholar]
- Risnumawan, A.; Shivakumara, P.; Chan, C.S.; Tan, C.L. A robust arbitrary text detection system for natural scene images. Expert Syst. Appl. 2014, 41, 8027–8048. [Google Scholar] [CrossRef]
- Grother, P.; Tabassi, E. Performance of biometric quality measures. IEEE Trans. Pattern Anal. Mach. Intell. 2007, 29, 531–543. [Google Scholar] [CrossRef] [PubMed]
- Zhang, L.; Wang, P.; Li, H.; Li, Z.; Shen, C.; Zhang, Y. A robust attentional framework for license plate recognition in the wild. IEEE Trans. Intell. Transp. Syst. 2020, 22, 6967–6976. [Google Scholar] [CrossRef]
- Xu, Z.; Yang, W.; Meng, A.; Lu, N.; Huang, H.; Ying, C.; Huang, L. Towards end-to-end license plate detection and recognition: A large dataset and baseline. In Proceedings of the European conference on computer vision (ECCV), Munich, Germany, 8–14 September 2018; pp. 255–271. [Google Scholar]

Publisher’s Note: MDPI stays neutral with regard to jurisdictional claims in published maps and institutional affiliations. |
© 2022 by the authors. Licensee MDPI, Basel, Switzerland. This article is an open access article distributed under the terms and conditions of the Creative Commons Attribution (CC BY) license (https://creativecommons.org/licenses/by/4.0/).