
Acquiring, Analyzing and Interpreting Knowledge Data for Sustainable Engineering Education: An Experimental Study Using YouTube

 ,
,  ,
,  , ,
, ,
Abstract
:1. Introduction
2. Related Work
- Can a YouTube channel provide adequate and quality asynchronous support on student tasks in online learning environments?
- Can we provide a guide for future instructors and organizers of CAD modules, willing to implement pedagogical methods supported by technology and social media sites such as YouTube, which would benefit the learning process in online and hybrid spaces?
- Can learners’ viewing habits be revealed in online and hybrid learning spaces through information provided by YouTube?
- Do learners’ behaviors and visualization patterns follow the flow of the module?
- Can educational data mining (EDM) from social media sites like YouTube provide a solid foundation for addressing student needs?
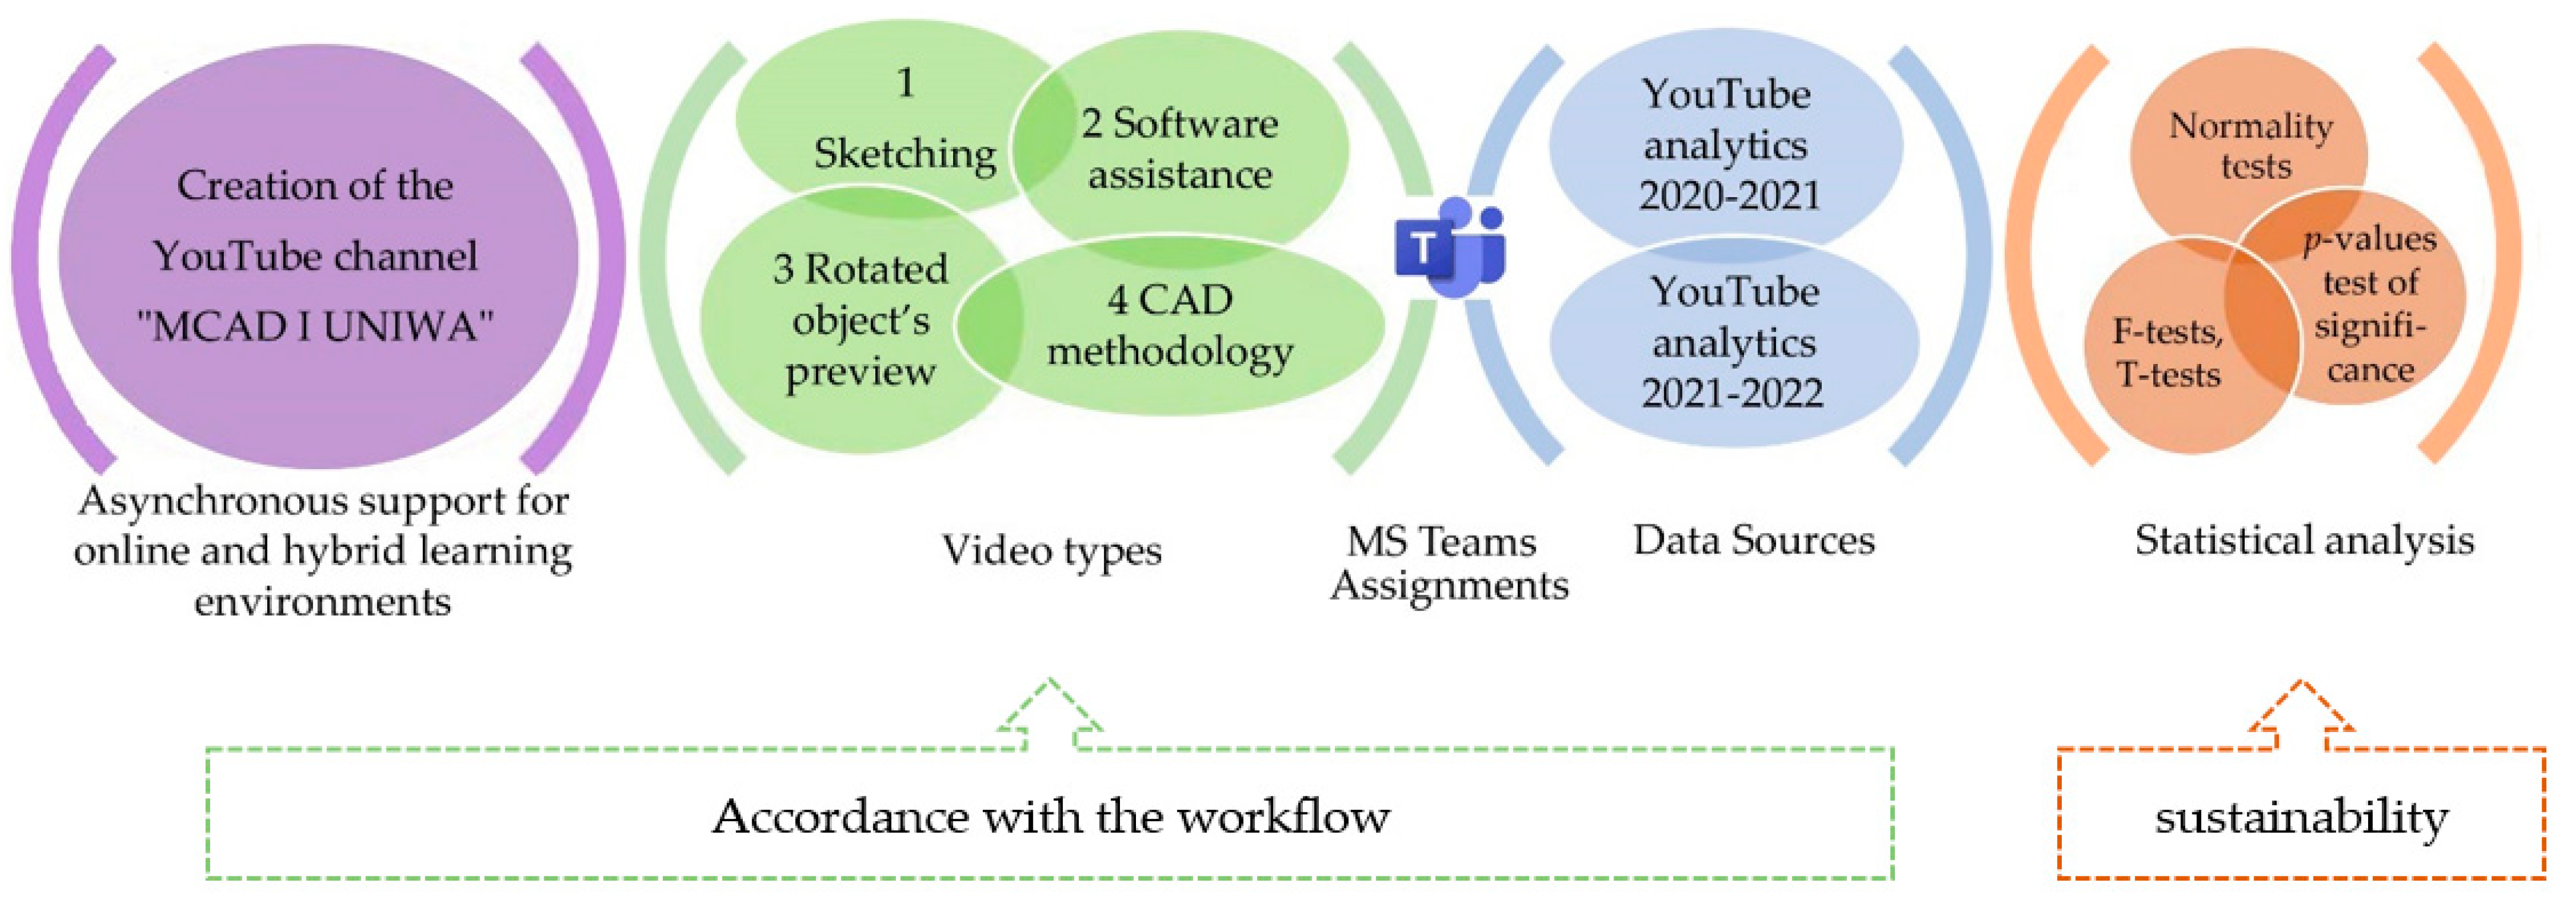
3. Methodological and Organizational Aspects
3.1. Foreword
- Provide asynchronous support to students and incorporate it into assessments of individual tasks.
- Guarantee students the robustness of the learning process, including avoiding any disruption caused by multiple platforms or LMS.
3.2. Participant Demographics
3.3. Reports on Students’ Views, Comparative Analysis and Discussion
- Sketch and make freehand drawings in two dimensions of views of given objects.
- Assist the CAD software with the basic commands needed to accomplish the assigned tasks.
- Preview of the object to be studied that was modeled in the three-dimensional CAD modeler. This specific type of video was created not only to help students perceive shapes and geometric entities, generate multiple representations of them (views), but also to develop their optimized design principle [45].
- Support on tasks by screen and sound recordings of the drawing procedure in the CAD environment.
4. Main Results
4.1. The Number of Views and Unique Viewers: Two Major Variables in the Foreground
4.2. Selected Statistical Variables
- Dataset 1: data from the academic period 2020–2021;
- Dataset 2: data from the academic period 2021–2022.
4.3. Normality Test Results
4.4. Hypothesis Testing Results
5. Discussion
- Recognize module gaps throughout the course. Recognize the needs of learners, for the promotion of sustainable engineering education. Reorganize the flow of tasks according to the learning objectives of the modules and determine the critical points of difficulty according to the knowledge to be acquired.
- Do not focus on a specific task, but on the unit by creating categories of units. Each unit may include several tasks, but the focus of the knowledge introduced is not the technical instruction itself, but the concept of the learning methodology. At the stage where the new knowledge is accumulated, call it the “pick of the curve”. Determine the points at which the new knowledge needs to be performed, as well as its nature in terms of asynchronous support. Do not be afraid to combine new knowledge with entertainment by using user-friendly digital tools, such as YouTube channels.
- Create direct access to certain parts of the course to redirect learners if necessary. Make access clear to avoid confusion.
- Analyze, evaluate and reconstruct the course based on the results. This means questioning the actions taken, modifying them if they fail, and adapting them according to the nature of the learning environments.
- Never neglect the social aspects: learners must be prepared for their professional future. Technical aspects can be learned through training, but methodology is the expertise of higher education instructors.
6. Conclusions and Future Work
Author Contributions
Funding
Institutional Review Board Statement
Informed Consent Statement
Data Availability Statement
Acknowledgments
Conflicts of Interest
Abbreviations
| CAD | Computer-aided design |
| CTR | Impressions Click-Through Rate |
| EDM | Educational data mining |
| LA | Learning analytics |
| LMS | Learning management system |
| MS | Microsoft |
| TAM | Technology acceptance model |
| TLP | Teaching—learning process |
| VLE | Virtual learning environments |
Appendix A. URL of Each Educational Video Content of the YouTube Channel “MCAD I UNIWA”
Appendix B. Summary of the Basics and Main Steps of the Shapiro–Wilk Normality Test
| 2020–2021 “Impressions” | 2021–2022 “Impressions” | 2020–2021 “Unique Viewers” (10 Weeks) | 2021–2022 “Unique Viewers” (10 Weeks) | |
| p-value (Shapiro–Wilk test) | 0.675 | 0.120 | 0.561 | 0.038 |
| Skewness | −0.102 | 0.150 | 0.138 | −0.029 |
| Kurtosis | −0.688 | −0.917 | −0.884 | −0.946 |
| Type of test allowed | Parametric | Non-parametric | ||
| 2020–2021 “Watch Time (h)” | 2021–2022 “Watch Time (h)” | 2020–2021 “Impressions CTR (%)” | 2021–2022 “Impressions CTR (%)” | |
| p-value (Shapiro–Wilk test) | 0.000 | 0.000 | 0.310 | 0.000 |
| Skewness | 1.280 | 1.717 | 0.550 | 1.772 |
| Kurtosis | 0.289 | 3.320 | 0.358 | 3.591 |
| Type of test allowed | Non-parametric | Non-parametric | ||
| 2020–2021 “Number of Views” | 2021–2022 “Number of Views” | 2020–2021 “Average Viewing Time (s)” | 2021–2022 “Average Viewing Time (s)” | |
| p-value (Shapiro–Wilk test) | 0.479 | 0.086 | 0.000 | 0.000 |
| Skewness | 0.177 | 0.447 | −0.323 | 1.086 |
| Kurtosis | −0.730 | 0.844 | 0.924 | 1.369 |
| Type of test allowed | Parametric | Non-parametric | ||
Appendix C. Summary of the Basics and Main Steps of and t-Tests for Parametric variables, and the Mann–Whitney–Wilcoxon Test for Non-Parametric Variables
- The first is the research hypothesis, which aims to state the subject of the research. If it is well defined, it will include the factors being studied and their expected relationship.
- The second is the statistical hypothesis, which converts the research hypothesis into a mathematical complex and a statistically testable statement about the presumed value of the variable being studied in the population.
Appendix C.1. Fisher-Snedecor or F-Test for Parametric Variables
Appendix C.2. Student’s t-Test for Parametric Variables
Appendix C.3. Mann–Whitney–Wilcoxon Test for Non-Parametric Variables
References
- Chango, W.; Lara, J.A.; Cerezo, R.; Romero, C. A review on data fusion in multimodal learning analytics and educational data mining. WIREs Data Min. Knowl. Discov. 2022, e1458, 1–19. [Google Scholar] [CrossRef]
- Wang, Q.; Mousavi, A.; Lu, C. A scoping review of empirical studies on theory-driven learning analytics. Distance Educ. 2022, 43, 6–29. [Google Scholar] [CrossRef]
- Hantoobi, S.; Wahdan, A.; Al-Emran, M.; Shaalan, K. A Review of Learning Analytics Studies. In Recent Advances in Technology Acceptance Models and Theories; Al-Emran, M., Shaalan, K., Eds.; Studies in Systems, Decision and Control; Springer International Publishing: Cham, Switzerland, 2021; pp. 119–134. ISBN 978-3-030-64987-6. [Google Scholar]
- Gutierrez-Bucheli, L.; Kidman, G.; Reid, A. Sustainability in engineering education: A review of learning outcomes. J. Clean. Prod. 2022, 330, 129734. [Google Scholar] [CrossRef]
- Hodges, C.; McCullough, H. The Adjacent Possible for Higher Education: The Digital Transformation of Faculty. Available online: https://er.educause.edu/articles/2021/9/the-adjacent-possible-for-higher-education-the-digital-transformation-of-faculty (accessed on 21 November 2021).
- Jacques, S.; Ouahabi, A.; Lequeu, T. Remote Knowledge Acquisition and Assessment during the COVID-19 Pandemic. Int. J. Eng. Pedagog. IJEP 2020, 10, 120–138. [Google Scholar] [CrossRef]
- Jacques, S.; Ouahabi, A.; Lequeu, T. Synchronous E-learning in Higher Education during the COVID-19 Pandemic. In Proceedings of the 2021 IEEE Global Engineering Education Conference (EDUCON), Vienna, Austria, 21–23 April 2021; pp. 1102–1109. [Google Scholar]
- Shloul, T.; Javeed, M.; Gochoo, M.; Alsuhibany, S.; Ghadi, Y.; Jalal, A.; Park, J. Student’s Health Exercise Recognition Tool for E-Learning Education. Intell. Autom. Soft Comput. 2022, 35, 149–161. [Google Scholar] [CrossRef]
- Lutfi, A.; Alsyouf, A.; Almaiah, M.A.; Alrawad, M.; Abdo, A.A.K.; Al-Khasawneh, A.L.; Ibrahim, N.; Saad, M. Factors Influencing the Adoption of Big Data Analytics in the Digital Transformation Era: Case Study of Jordanian SMEs. Sustainability 2022, 14, 1802. [Google Scholar] [CrossRef]
- Kanetaki, Z.; Stergiou, C.; Bekas, G.; Jacques, S.; Troussas, C.; Sgouropoulou, C.; Ouahabi, A. Grade Prediction Modeling in Hybrid Learning Environments for Sustainable Engineering Education. Sustainability 2022, 14, 5205. [Google Scholar] [CrossRef]
- Orji, F.A.; Vassileva, J. A Comparative Evaluation of the Effect of Social Comparison, Competition, and Social Learning in Persuasive Technology on Learning. In Proceedings of the Intelligent Tutoring Systems, Virtual Event, 7–11 June2021; Cristea, A.I., Troussas, C., Eds.; Springer International Publishing: Cham, Switzerland, 2021; pp. 369–375. [Google Scholar]
- Jackman, W.M. YouTube Usage in the University Classroom: An Argument for its Pedagogical Benefits. Int. J. Emerg. Technol. Learn. IJET 2019, 14, 157–166. [Google Scholar] [CrossRef] [Green Version]
- Cabrera, I.; Villalon, J.; Chavez, J. Blending Communities and Team-Based Learning in a Programming Course. IEEE Trans. Educ. 2017, 60, 288–295. [Google Scholar] [CrossRef]
- Kanetaki, Z.; Stergiou, C.; Bekas, G.; Troussas, C.; Sgouropoulou, C. The impact of different learning approaches based on MS Teams and Moodle on students’ performance in an on-line mechanical CAD module. Glob. J. Eng. Educ. 2021, 23, 185–190. [Google Scholar] [CrossRef]
- Kanetaki, Z.; Stergiou, C.; Bekas, G.; Troussas, C.; Sgouropoulou, C. Creating a Metamodel for Predicting Learners’ Satisfaction by Utilizing an Educational Information System During COVID-19 Pandemic. Nov. Intell. Digit. Syst. 2021, 338, 127–136. [Google Scholar] [CrossRef]
- Baker, R.S.J.D. International Encyclopedia of Education. In Data Mining, 3rd ed.; McGaw, B., Peterson, P., Baker, E., Eds.; 2010; pp. 112–118. [Google Scholar]
- Govindarajan, M.; Govindarajan, M. Educational Data Mining Techniques and Applications. Available online: https://www.igi-global.com/gateway/chapter/www.igi-global.com/gateway/chapter/272957 (accessed on 8 May 2022).
- Ihantola, P.; Vihavainen, A.; Ahadi, A.; Butler, M.; Börstler, J.; Edwards, S.H.; Isohanni, E.; Korhonen, A.; Petersen, A.; Rivers, K.; et al. Educational Data Mining and Learning Analytics in Programming: Literature Review and Case Studies. In Proceedings of the 2015 ITiCSE on Working Group Reports, Vilnius, Lithuania, 4–8 July 2015; Association for Computing Machinery: New York, NY, USA, 2015; pp. 41–63. [Google Scholar]
- Krishnan, R.; Nair, S.; Saamuel, B.S.; Justin, S.; Iwendi, C.; Biamba, C.; Ibeke, E. Smart Analysis of Learners Performance Using Learning Analytics for Improving Academic Progression: A Case Study Model. Sustainability 2022, 14, 3378. [Google Scholar] [CrossRef]
- Siemens, G.; Baker, R.S.J.d. Learning analytics and educational data mining: Towards communication and collaboration. In Proceedings of the 2nd International Conference on Learning Analytics and Knowledge, Vancouver, BC, Canada, 29 April 2012–2 May 2012; Association for Computing Machinery: New York, NY, USA, 2012; pp. 252–254. [Google Scholar]
- Muttakin, F.; Wang, J.-T.; Mulyanto, M.; Leu, J.-S. Evaluation of Feature Selection Methods on Psychosocial Education Data Using Additive Ratio Assessment. Electronics 2022, 11, 114. [Google Scholar] [CrossRef]
- Nowak-Brzezińska, A.; Łazarz, W. Qualitative Data Clustering to Detect Outliers. Entropy 2021, 23, 869. [Google Scholar] [CrossRef] [PubMed]
- Dooley, L.; Makasis, N. Understanding Student Behavior in a Flipped Classroom: Interpreting Learning Analytics Data in the Veterinary Pre-Clinical Sciences. Educ. Sci. 2020, 10, 260. [Google Scholar] [CrossRef]
- Al-Maroof, R.; Ayoubi, K.; Alhumaid, K.; Aburayya, A.; Alshurideh, M.; Alfaisal, R.; Salloum, S. The acceptance of social media video for knowledge acquisition, sharing and application: A com-parative study among YouTube users and TikTok Users’ for medical purposes. Int. J. Data Netw. Sci. 2021, 5, 197–214. [Google Scholar] [CrossRef]
- de Oliveira, C.F.; Sobral, S.R.; Ferreira, M.J.; Moreira, F. How Does Learning Analytics Contribute to Prevent Students’ Dropout in Higher Education: A Systematic Literature Review. Big Data Cogn. Comput. 2021, 5, 64. [Google Scholar] [CrossRef]
- Draus, P.J.; Curran, M.J.; Trempus, M.S. The Influence of Instructor-Generated Video Content on Student Satisfaction with and Engagement in Asynchronous Online Classes. J. Online Learn. Teach. 2014, 10, 240–254. [Google Scholar]
- Rodrigo, M.M.T.; Ladrido, E.M.M. Promoting Equity and Assuring Teaching and Learning Quality: Magisterial Lectures in a Philippine University during the COVID-19 Pandemic. Educ. Sci. 2022, 12, 146. [Google Scholar] [CrossRef]
- Isaenko, E.; Makrinova, E.; Rozdolskaya, I.; Matuzenko, E.; Bozhuk, S. Research of social media channels as a digital analytical and planning technology of advertising campaigns. In Proceedings of the IOP Conference Series: Materials Science and Engineering, St. Petersburg, Russian, 27–29 August 2020; Volume 986, p. 012014. [Google Scholar] [CrossRef]
- Al-rahmi, W.M.; Othman, M.S.; Yusuf, L.M. Using Social Media for Research: The Role of Interactivity, Collaborative Learning, and Engagement on the Performance of Students in Malaysian Post-Secondary Institutes. Mediterr. J. Soc. Sci. 2015, 6, 536. [Google Scholar] [CrossRef] [Green Version]
- Dahlstrom, E. ECAR Study of Undergraduate Students and Information Technology, 2012; EDUCAUSE Center for Applied Research: Louisville, CO, USA, 2012. [Google Scholar]
- Kanaki, K.; Kalogiannakis, M.; Poulakis, E.; Politis, P. Employing Mobile Technologies to Investigate the Association Between Abstraction Skills and Performance in Environmental Studies in Early Primary School. Int. J. Interact. Mob. Technol. IJIM 2022, 16, 241–249. [Google Scholar] [CrossRef]
- Walsh, J.N.; O’Brien, M.P.; Slattery, D.M. Video Viewing Patterns Using Different Teaching Treatments: A Case Study Using YouTube Analytics. Res. Educ. Learn. Innov. Arch. 2019, 22, 77–95. [Google Scholar] [CrossRef] [Green Version]
- McGowan, A.; Hanna, P.; Anderson, N. Teaching Programming: Understanding Lecture Capture YouTube Analytics. In Proceedings of the 2016 ACM Conference on Innovation and Technology in Computer Science Education, Arequipa, Peru, 9–13 July 2016; Association for Computing Machinery: New York, NY, USA, 2016; pp. 35–40. [Google Scholar]
- Schwarzenberg, P.; Navon, J.; Nussbaum, M.; Pérez-Sanagustín, M.; Caballero, D. Learning experience assessment of flipped courses. J. Comput. High. Educ. 2018, 30, 237–258. [Google Scholar] [CrossRef]
- Le, A.; Joordens, S.; Chrysostomou, S.; Grinnell, R. Online lecture accessibility and its influence on performance in skills-based courses. Comput. Educ. 2010, 55, 313–319. [Google Scholar] [CrossRef]
- Kanetaki, Z.; Stergiou, C.; Bekas, G.; Troussas, C.; Sgouropoulou, C. Analysis of Engineering Student Data in Online Higher Education During the COVID-19 Pandemic. Int. J. Eng. Pedagogy IJEP 2021, 11, 27–49. [Google Scholar] [CrossRef]
- Binkley, M.; Erstad, O.; Herman, J.; Raizen, S.; Ripley, M.; Miller-Ricci, M.; Rumble, M. Defining Twenty-First Century Skills. In Assessment and Teaching of 21st Century Skills; Griffin, P., McGaw, B., Care, E., Eds.; Springer Netherlands: Dordrecht, The Netherlands, 2012; pp. 17–66. ISBN 978-94-007-2324-5. [Google Scholar]
- Konys, A. An Ontology-Based Knowledge Modelling for Sustainable Entrepreneurship Domain. In Proceedings of the 55th Hawaii International Conference on System Sciences, Hawaii, HI, USA, 4–7 January 2022; pp. 5316–5325. [Google Scholar]
- Petrila, L.; Goudenhooft, G.; Gyarmati, B.F.; Popescu, F.-A.; Simuț, C.; Brihan, A.-C. Effective Teaching during the COVID-19 Pandemic? Distance Learning and Sustainable Communication in Romania. Sustainability 2022, 14, 7269. [Google Scholar] [CrossRef]
- Zabidi, N.; Wang, W. The Use of Social Media Platforms as a Collaborative Supporting Tool: A Preliminary Assessment. Int. J. Interact. Mob. Technol. IJIM 2021, 15, 138–148. [Google Scholar] [CrossRef]
- Kanetaki, Z.; Stergiou, C.; Bekas, G.; Troussas, C.; Sgouropoulou, C. Evaluating Remote Task Assignment of an Online Engineering Module through Data Mining in a Virtual Communication Platform Environment. Electronics 2022, 11, 158. [Google Scholar] [CrossRef]
- Rus-Arias, E.; Palos-Sanchez, P.R.; Reyes-Menendez, A. The Influence of Sociological Variables on Users’ Feelings about Programmatic Advertising and the Use of Ad-Blockers. Informatics 2021, 8, 5. [Google Scholar] [CrossRef]
- Batool, S.; Rashid, J.; Nisar, M.W.; Kim, J.; Mahmood, T.; Hussain, A. A Random Forest Students’ Performance Prediction (RFSPP) Model Based on Students’ Demographic Features. In Proceedings of the 2021 Mohammad Ali Jinnah University International Conference on Computing (MAJICC), Karachi, Pakistan, 15–17 July 2021; pp. 1–4. [Google Scholar]
- Anantharamaiah, K.B. YouTube Analytics Using Google Data Studio 2020. Available online: https://doi.org/10.2139/ssrn.3655551 (accessed on 23 May 2022).
- Chatzopoulos, A.; Kalogiannakis, M.; Papadakis, S.; Papoutsidakis, M. A Novel, Modular Robot for Educational Robotics Developed Using Action Research Evaluated on Technology Acceptance Model. Educ. Sci. 2022, 12, 274. [Google Scholar] [CrossRef]
- Camuffo, A.; Gerli, F. Modeling management behaviors in lean production environments. Int. J. Oper. Prod. Manag. 2018, 38, 403–423. [Google Scholar] [CrossRef]
- Zhang, L.; Lu, W.; Liu, X.; Pedrycz, W.; Zhong, C. Fuzzy C-Means clustering of incomplete data based on probabilistic information granules of missing values. Knowl.-Based Syst. 2016, 99, 51–70. [Google Scholar] [CrossRef]
- Sakai, T. t-Tests. In Laboratory Experiments in Information Retrieval: Sample Sizes, Effect Sizes, and Statistical Power; Sakai, T., Ed.; The Information Retrieval Series; Springer: Gateway East, Singapore, 2018; pp. 27–41. ISBN 9789811311994. [Google Scholar]
- Booth, T.; Doumas, A.; Murray, A.L. Null Hypothesis. In Encyclopedia of Personality and Individual Differences; Zeigler-Hill, V., Shackelford, T.K., Eds.; Springer International Publishing: Cham, Switzerland, 2020; pp. 3267–3270. ISBN 978-3-319-24612-3. [Google Scholar]
- Saxon, E. Defining the null hypothesis. BMC Biol. 2015, 13, 68. [Google Scholar] [CrossRef] [PubMed] [Green Version]
- F Distribution—An Overview|ScienceDirect Topics. Available online: https://www.sciencedirect.com/topics/mathematics/f-distribution (accessed on 23 May 2022).


| Demographics | 2020–2021 (n = 212) | Viewing Time (Hours) | 2021–2022 (n = 230) | Viewing Time (h) |
|---|---|---|---|---|
| Gender of the participant and age distribution | ||||
| Female | 10.0% | 10.0% | ||
| Male | 90.0% | 90.0% | ||
| Age of the participant | ||||
| 18–24 | 60.9% | 97.6% | ||
| 25–34 | 37.7% | 2.4% | ||
| 35–44 | 0.9% | 0.0% | ||
| 45–54 | 0.5% | 0.0% | ||
| Geography | ||||
| National | 97.8% | 261.6 | 100% | 174.6 |
| International | 2.2% | 0.1 | 0% | 0.0 |
| Subscription status | ||||
| Not subscribed | 75.9% | 193.6 | 82.1% | 151.4 |
| Subscriber | 24.1% | 70.9 | 17.9% | 30.2 |
| Type of viewing device used | ||||
| Computer | 75.0% | 210.39 | 70.7% | 137.4 |
| Mobile phone | 23.6% | 52.91 | 27.7% | 38.0 |
| Tablet | 0.9% | 0.81 | 1.3% | 5.6 |
| TV | 0.5% | 0.32 | 0.3% | 0.2 |
| Operating system | ||||
| Windows | 78.1% | 209.4 | 67.2% | 133.4 |
| Android | 17.7% | 46.0 | 22.2% | 31.1 |
| iOS | 3.7% | 7.8 | 6.4% | 12.5 |
| Macintosh | 0.4% | 1.0 | 2.6% | 4.4 |
| Smart TV | 0.1% | 0.02 | 0.0% | 0.0 |
| PlayStation | 0.0% | 0.0 | 0.4% | 0.2 |
| Linux | 0.0% | 0.0 | 0.4% | 0.1 |
| WebOS | 0.0% | 0.0 | 0.4% | 0.02 |
| Xbox | 0.0% | 0.0 | 0.4% | 0.01 |
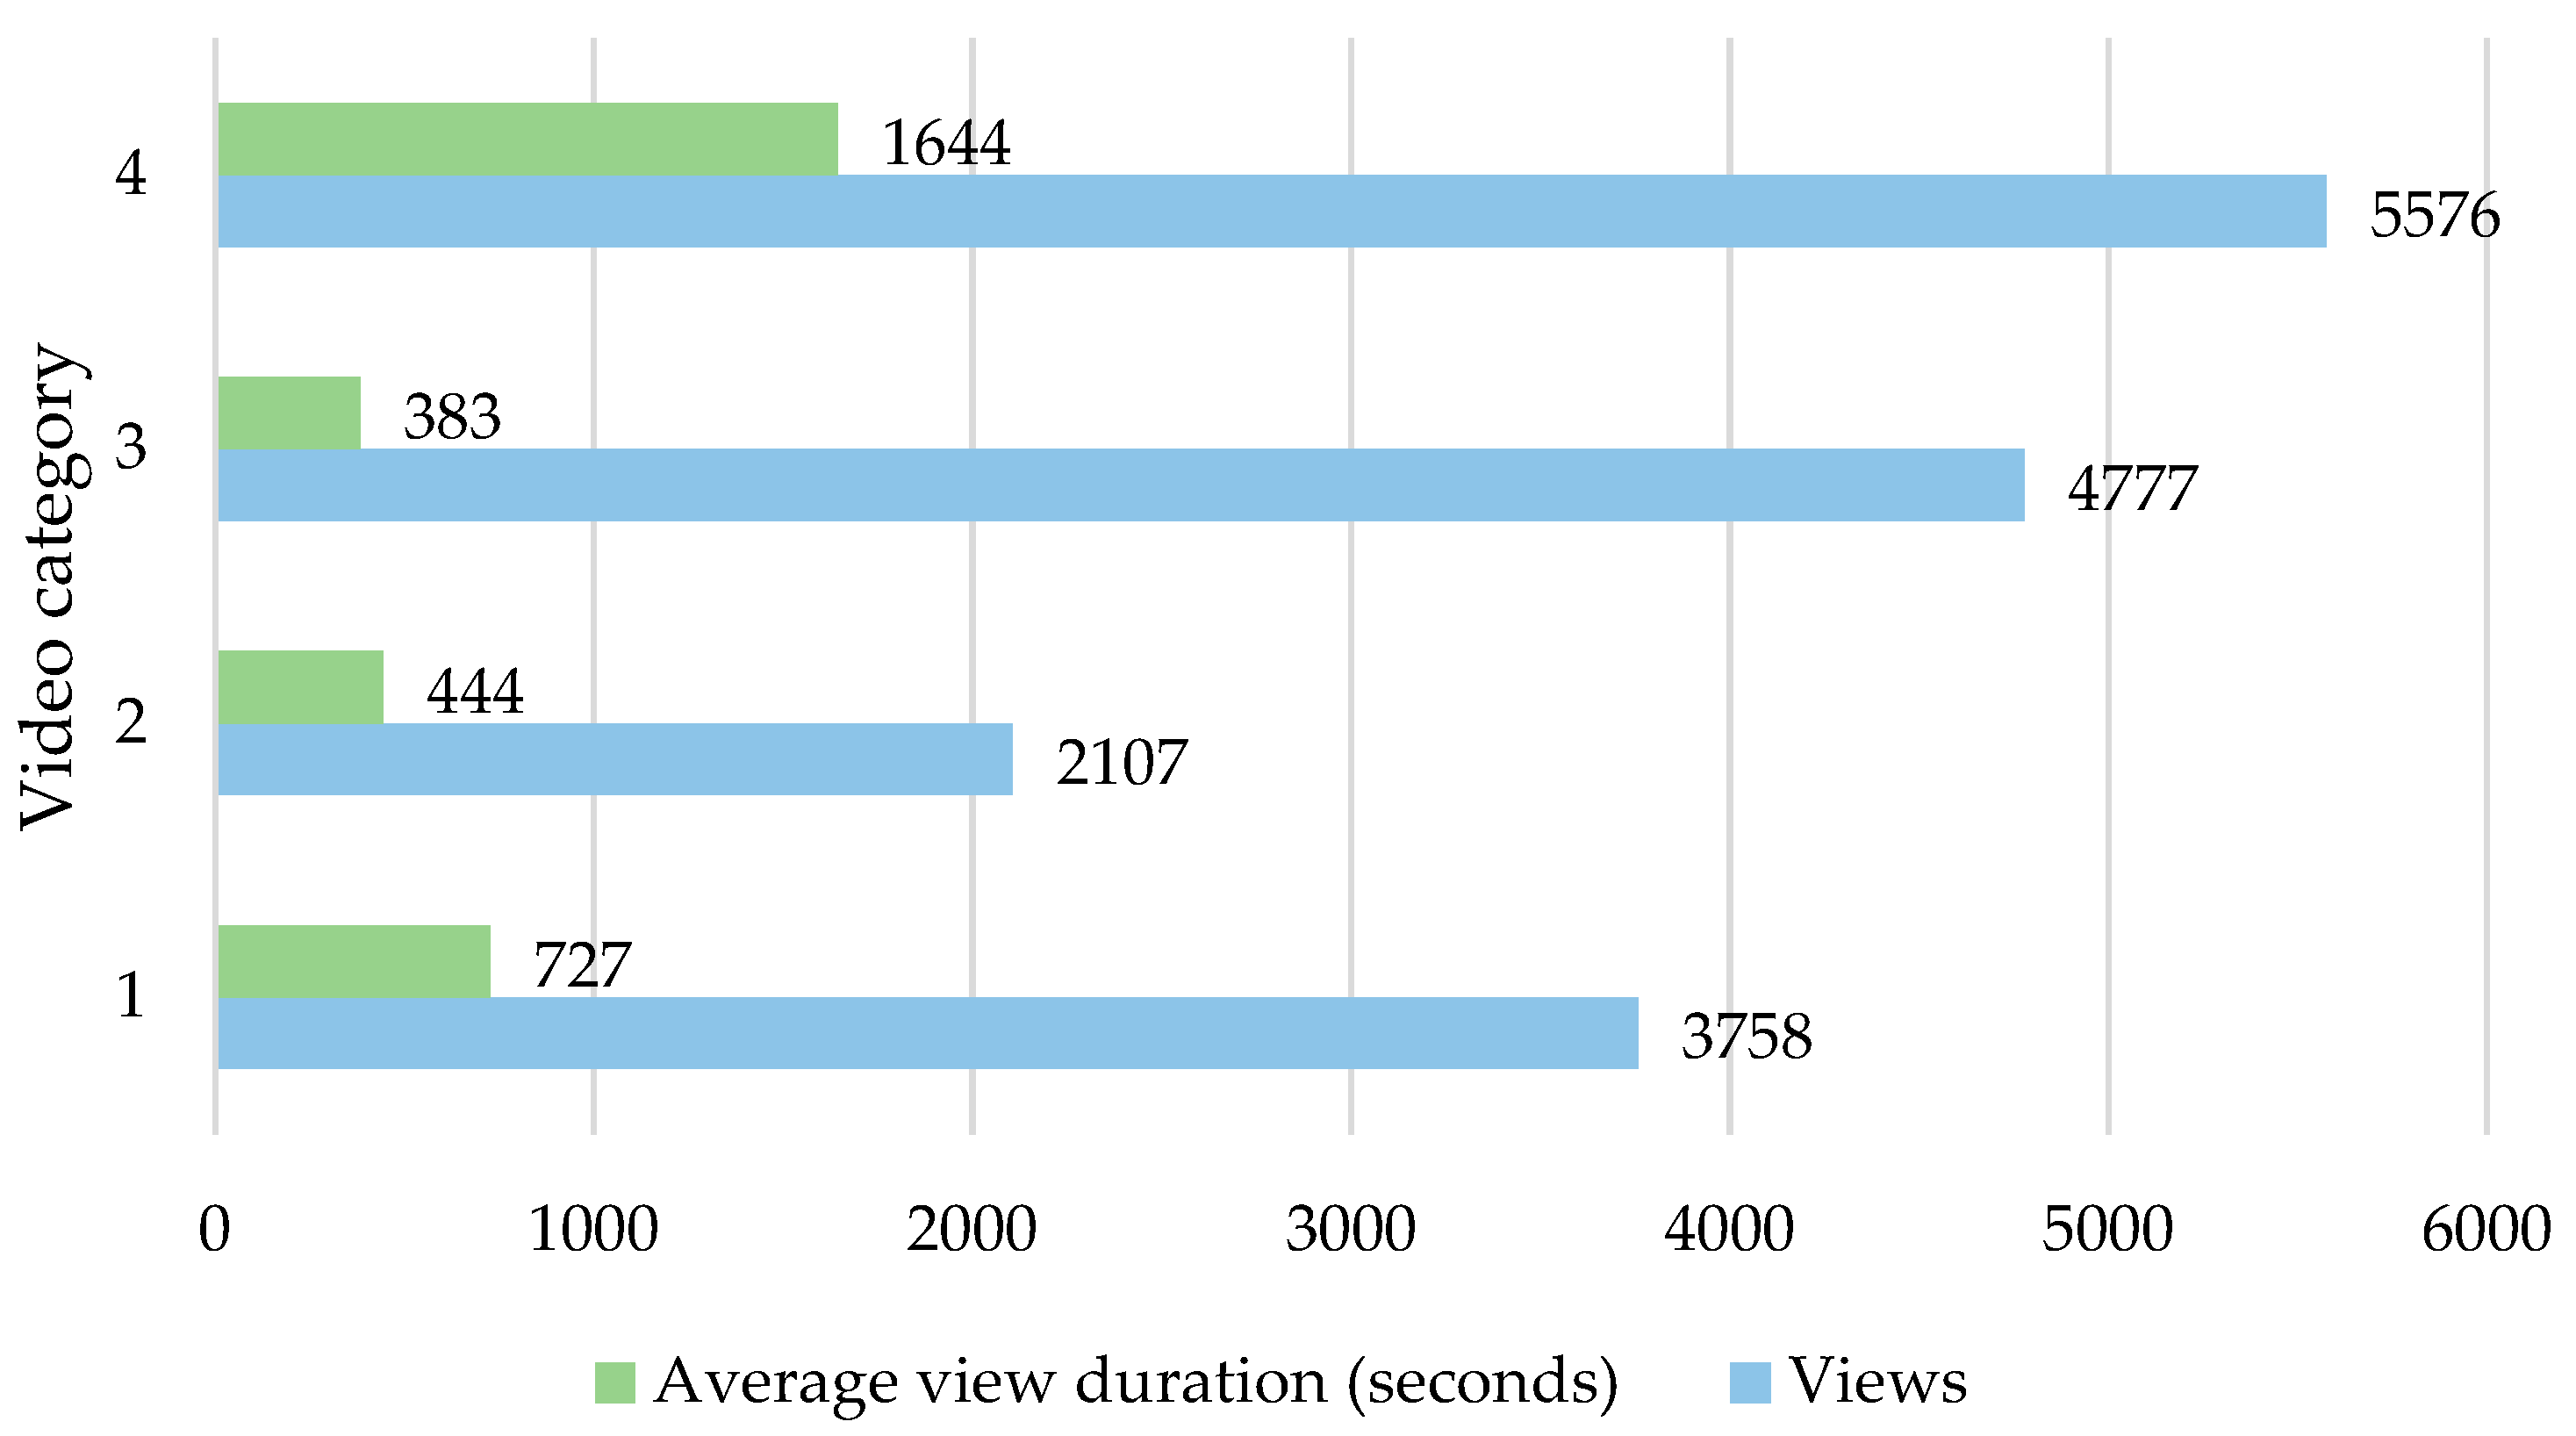
| Number of Videos | Number of Views | Average Viewing Time (s) | Average Percentage of Viewing | |
|---|---|---|---|---|
| Video category no. 1 | 11 | 3758 | 727 | 37.4 |
| Video category no. 2 | 5 | 2107 | 444 | 28.5 |
| Video category no. 3 | 9 | 4777 | 383 | 67.1 |
| Video category no. 4 | 12 | 5576 | 1644 | 29.9 |
| Total | 37 | 16,218 |
| Number of Weeks | |||||||||||||
|---|---|---|---|---|---|---|---|---|---|---|---|---|---|
| Sketching (First Stage) | CAD Drawings (Second Stage) | Final Exam (Third Stage) | |||||||||||
| Year | 1 | 2 | 3 | 4 | 5 | 6 | 7 | 8 | 9 | 10 | 11 | 12 | 13 |
| 2020–2021 | 54 | 137 | 137 | 84 | 154 | 184 | 224 | 186 | 116 | 72 | 110 | 190 | 202 |
| 2021–2022 | 27 | 72 | 109 | 134 | 120 | 154 | 177 | 161 | 143 | 96 | 47 | 97 | 143 |
| Variation | 27 | 65 | 28 | −50 | 34 | 30 | 47 | 25 | −27 | −24 | 63 | 93 | 59 |
| 2020–2021 “Impressions” | 2021–2022 “Impressions” | 2020–2021 “Number of Views” | 2021–2022 “Number of Views” | |
|---|---|---|---|---|
| p-value | 0.01 | 0.01 | 0.12 | 0.12 |
| “Impressions” | “Number of Views” | |
|---|---|---|
| Assumption | Unequal variance | Equal variance |
| p-value | 0.055 | 0.08 |
| Unique Viewers (10 Weeks) | Viewing Time or Watch Time (h) | Impressions CTR (%) | Average Viewing Time (s) | |
|---|---|---|---|---|
| p-value | 0.443 | 0.122 | 0.000 | 0.000 |
| Null hypothesis rejected or not rejected | Null hypothesis not rejected | Null hypothesis not rejected | Null hypothesis rejected | Null hypothesis rejected |
Publisher’s Note: MDPI stays neutral with regard to jurisdictional claims in published maps and institutional affiliations. |
© 2022 by the authors. Licensee MDPI, Basel, Switzerland. This article is an open access article distributed under the terms and conditions of the Creative Commons Attribution (CC BY) license (https://creativecommons.org/licenses/by/4.0/).
Share and Cite
Kanetaki, Z.; Stergiou, C.; Bekas, G.; Jacques, S.; Troussas, C.; Sgouropoulou, C.; Ouahabi, A. Acquiring, Analyzing and Interpreting Knowledge Data for Sustainable Engineering Education: An Experimental Study Using YouTube. Electronics 2022, 11, 2210. https://doi.org/10.3390/electronics11142210
Kanetaki Z, Stergiou C, Bekas G, Jacques S, Troussas C, Sgouropoulou C, Ouahabi A. Acquiring, Analyzing and Interpreting Knowledge Data for Sustainable Engineering Education: An Experimental Study Using YouTube. Electronics. 2022; 11(14):2210. https://doi.org/10.3390/electronics11142210
Chicago/Turabian StyleKanetaki, Zoe, Constantinos Stergiou, Georgios Bekas, Sébastien Jacques, Christos Troussas, Cleo Sgouropoulou, and Abdeldjalil Ouahabi. 2022. "Acquiring, Analyzing and Interpreting Knowledge Data for Sustainable Engineering Education: An Experimental Study Using YouTube" Electronics 11, no. 14: 2210. https://doi.org/10.3390/electronics11142210