4.2. Data Collection for Proposed Method
Unlike the existing smartphone low-power techniques, this paper proposes a technique that obtains power savings by considering the power consumption of smartphones in execution time. For execution time consumption prediction, the proposed low-power technique uses a power model [
5] that predicts CPU and GPU power consumption in real time and a display power model [
14] that predicts power consumption using display pixel size. The CPU and GPU power models quickly calculate power consumption within 50 ms through calculations using factors created through reinforcement learning through genetic algorithms. The smartphone CPU and GPU power model is a phase-based power model that divides detailed operating states of the CPU and GPU into several cases and predicts power consumption with an independent power model according to the phase. The display power model may quickly calculate display power by using a LUT. Both power models repeatedly used Monsoon Power Monitor [
15] for modeling.
The CPU and GPU power models were designed for the Samsung Exynos M1 and ARM Cortex A-53 CPU and the Mali T880 GPU, which have four little and four big cores and eight cores, respectively. Additionally, the CPU power model used one little core and one big core in the CPU. The GPU power model used whole cores in the GPU. The power consumption of each of the eight CPU cores may be calculated by using the point that the power consumption of each CPU core may be independently calculated.
The power model is also designed to fix CPU big core and GPU frequency at 2184 MHz and 600 MHz, respectively. The frequency is frequently changed because the low-power technique targeted in this paper reduces the power consumption of smartphones by changing the frequency to the DVFS technique. Therefore, a process of correcting the predicted power consumption of the power model according to the changing frequency is required. Equation (3) is used for the predicted power consumption correction according to the frequency change.
As shown in [
16] and [
17], the DVFS technique used in this paper is one of the widely known software-level low-power techniques. In Equation (3),
P is the power consumption of the CPU,
a is the switching activity,
C is the capacitance,
V is the voltage applied to the CPU, and
f is the frequency applied to the CPU. Because the proposed DVFS method uses the average of power consumption calculated several times for the same workload and the same workload performs a fixed task in the processor,
a can be considered as a constant value. Additionally,
C can be regarded as a constant value because the hardware CPU and GPU are fixed. These are because circuits and applications are fixed in the aspect of the DVFS technique, and the power is related to the square of voltage multiplied by frequency mainly. Therefore, if the voltage and frequency set in the power model are
and
, respectively, and the changed voltage and frequency are
and
, respectively, the power consumption
predicted by the power model is calculated using Equation (4).
The power consumption of the GPU is also corrected in the same method as in the CPU power consumption correction Equation (4). CPU and GPU have 21 and 5 variable frequencies, respectively, and the frequency is paired with a voltage determined for each frequency. Therefore, whenever calibrated power consumptions of the CPU and GPU were calculated, the power consumption of each processor was calculated using the LUT without using Equation (4). The power consumption correction of these CPUs and GPUs was used in all power consumption calculations in the low-power technique proposed in this paper.
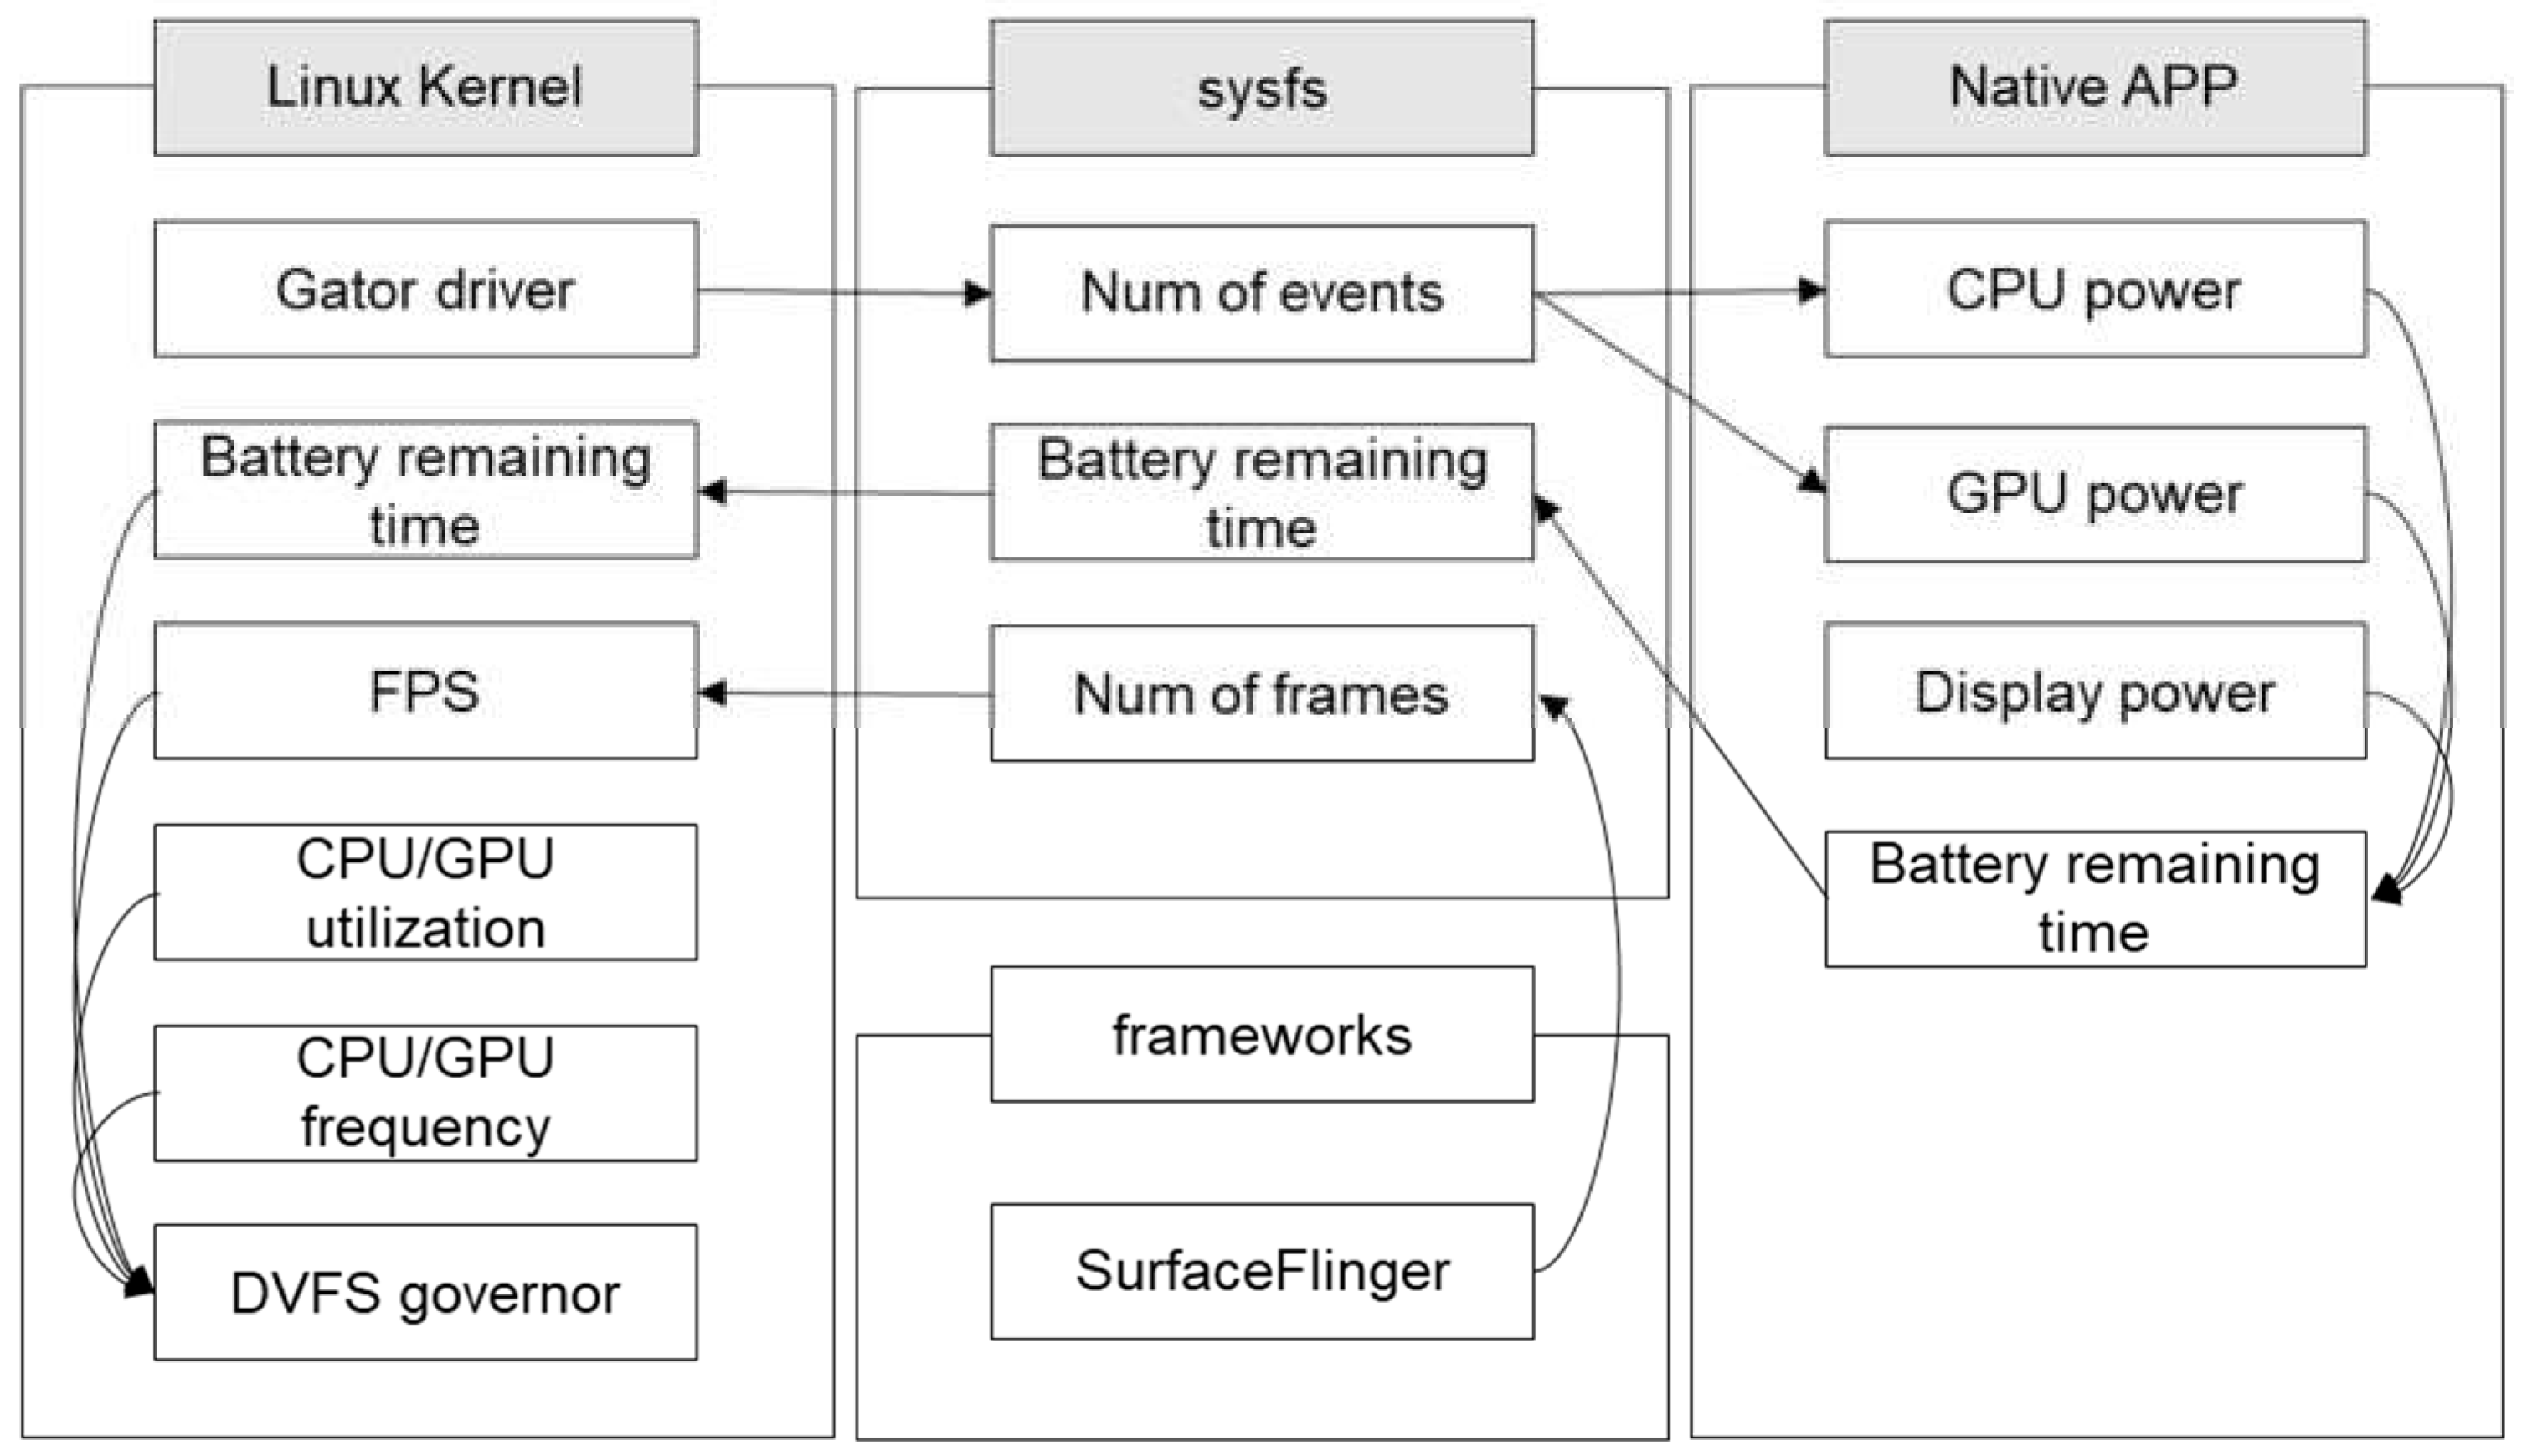
In addition to power consumption, we collect various data from CPUs and GPUs. The utilization of the CPU and the FPS of the smartphone display are collected at 50 ms intervals. It was observed that the reason for collecting at intervals of 50 ms was that the CPU/GPU’s consumption power prediction and data collection process had overhead, so the calculation results were not guaranteed at intervals below 50 ms. Therefore, a minimum period of 50 ms, which can show real-time power consumption while ensuring the accuracy of data such as CPU/GPU predictive power consumption and utilization and FPS, was set as a measurement and collection interval.
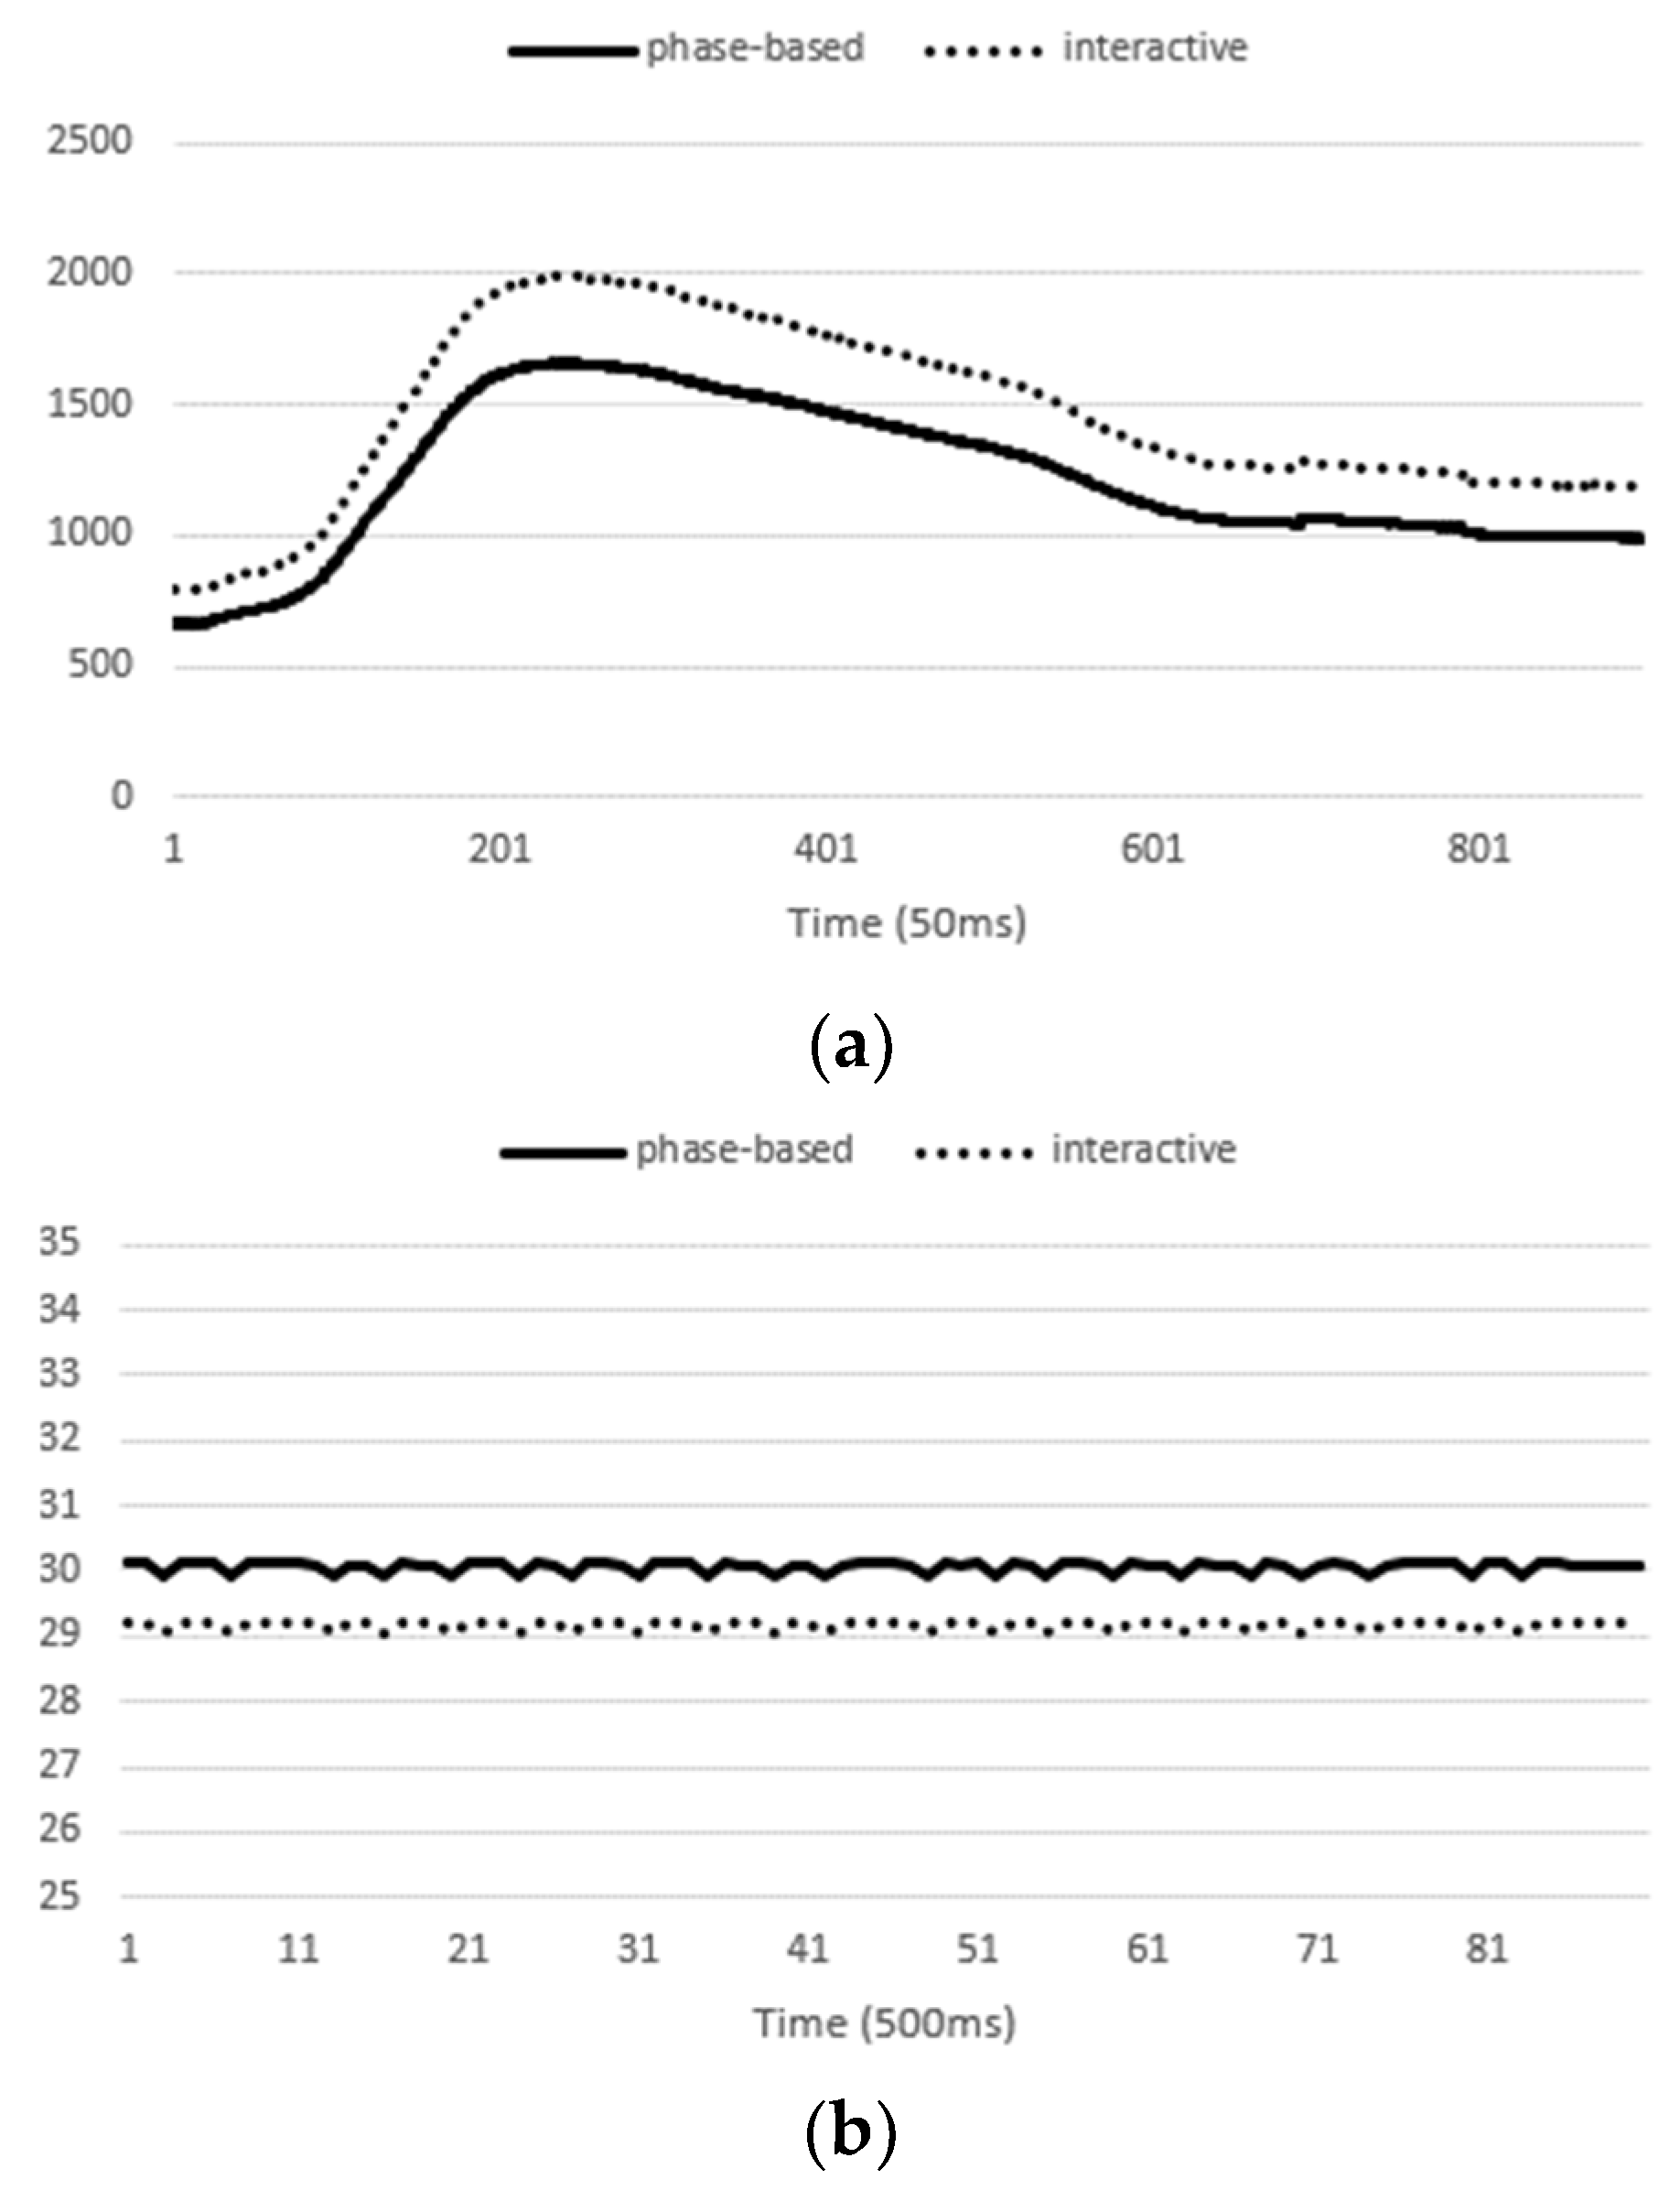
The processor utilization used the load value calculated by the interactive governor of the Linux kernel. It is the same calculation as utilization, with the total execution time of the processor minus the time spent in the idle state.
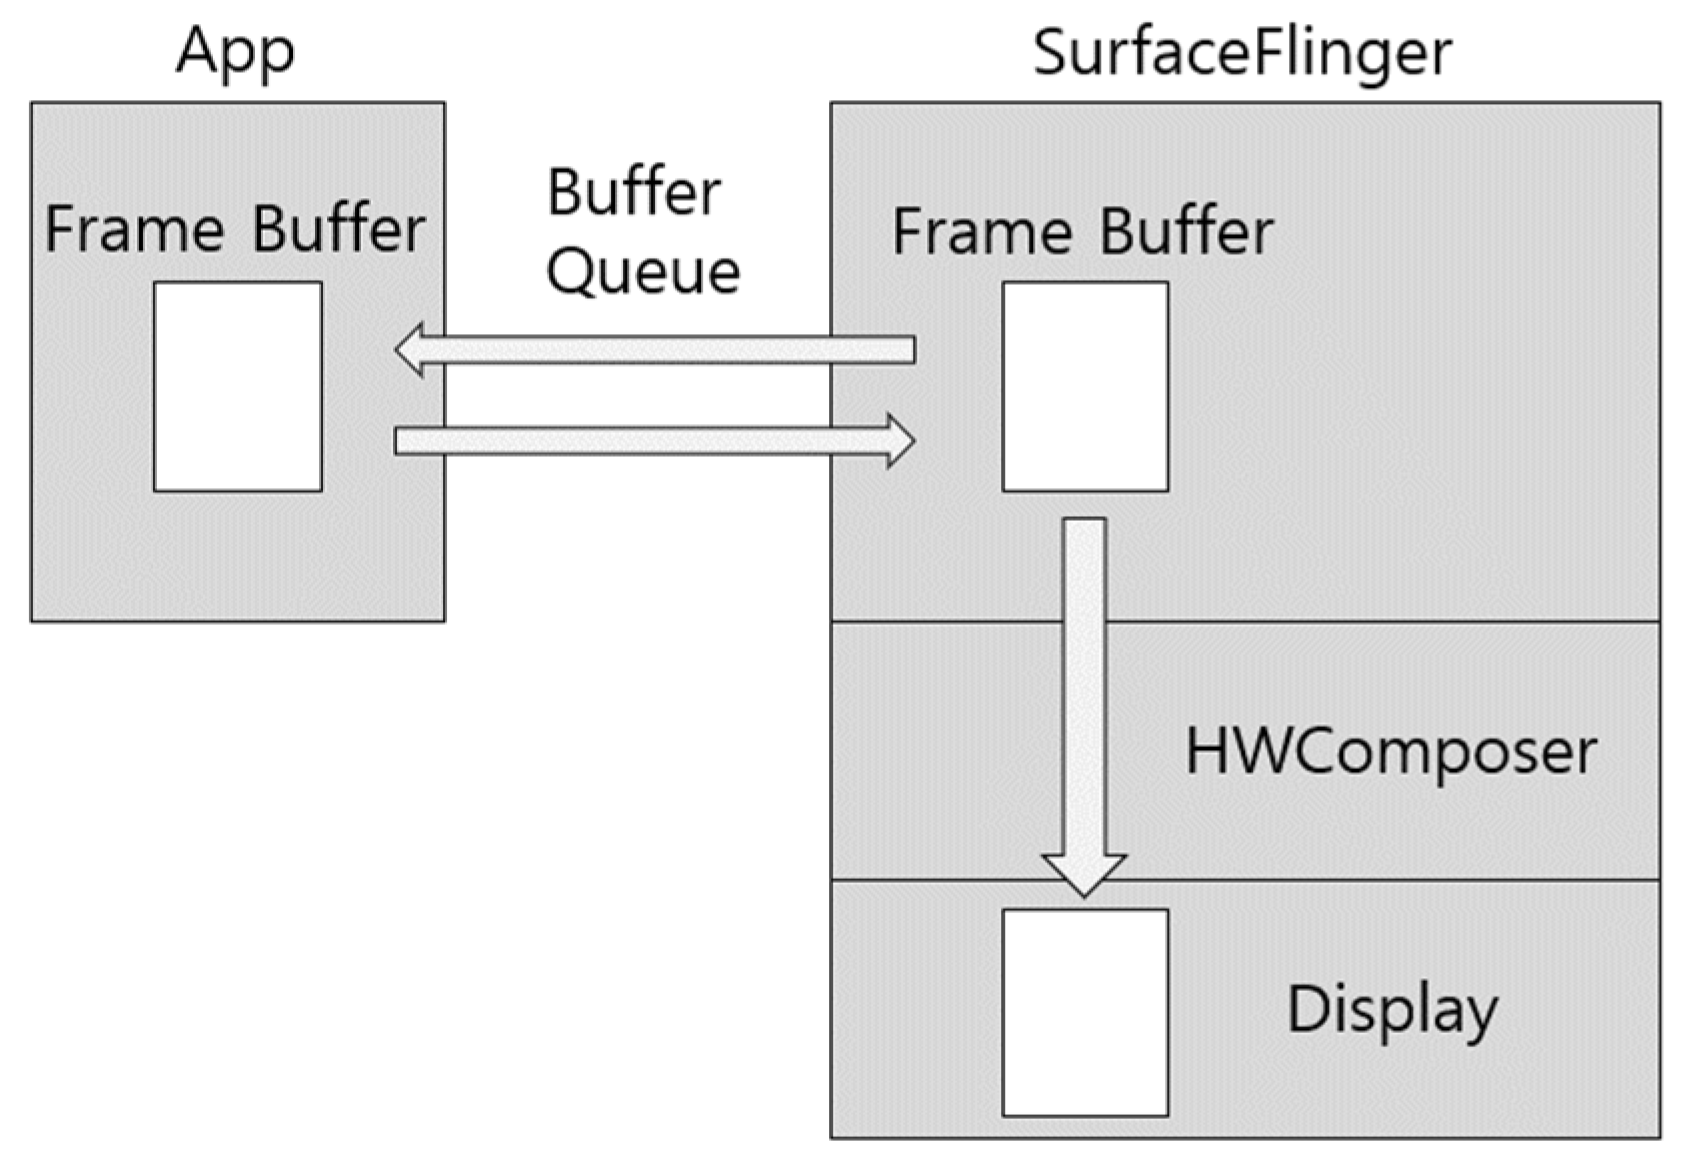
The FPS of the display was calculated using the Android SurfaceFlinger. SurfaceFlinger is responsible for allowing smartphones to synthesize and output screens created by users’ processes or applications to be displayed on the display screen. The SurfaceFlinger manages colors, screen locations, and display order, and works with the frame buffer so that final images created with the frame buffer driver present in the Linux kernel can be output to the screen via the frame buffer driver. The HWComposer in
Figure 4 counts the number of frames generated in one variable each time the final image synthesis is completed. By dividing the counted number of frames by the time taken, the FPS may be calculated.
4.3. Proposed Method
Figure 5 shows the overall process of the proposed low power management. Our proposed DVFS method proceeds as follows. First, check the CPU utilization to see if the CPU frequency and GPU frequency are changing. Second, check the current phase of the CPU and GPU and predict the next phase. Third, predict the power consumption of the next phase according to the predicted phase. Finally, select the optimal frequency of the CPU and the GPU according to the predicted power consumption. Finally, repeat the above process until the workload is over. Here, the workload is a mobile game application.
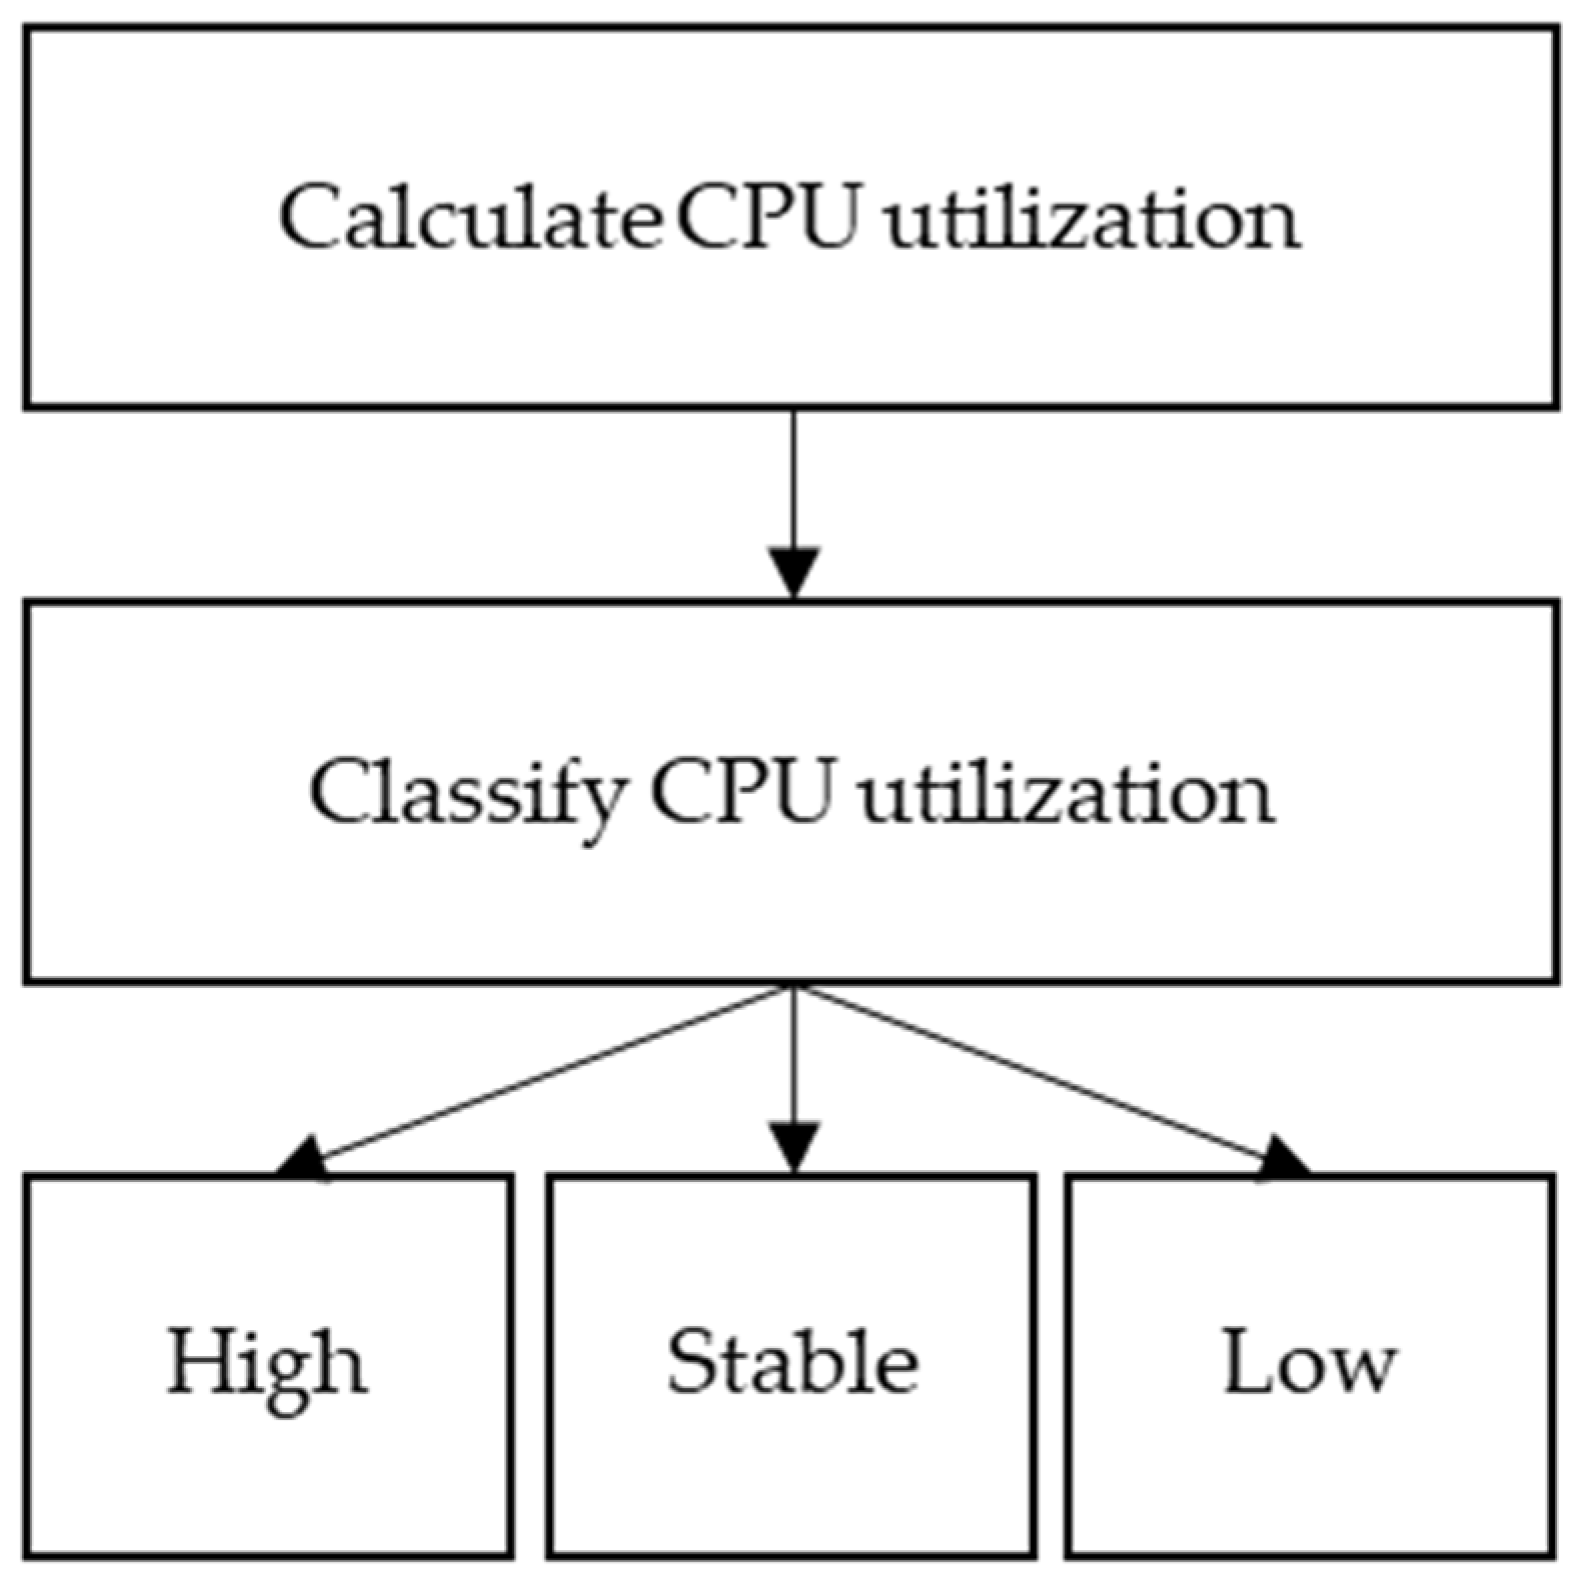
Figure 6 shows the part that determines whether to raise, fix, or lower frequency according to CPU utilization, which is the first step of the proposed low-power technique. That is, the frequency of the processor should be changed according to the CPU utilization. There are many cases where the CPU and GPU of a mobile device used in this paper are 21 and 6, respectively, and because of running a workload, the frequency in all cases is not used.
Table 5 shows the share by frequency of CPU big core confirmed by running 15 workloads on the basic CPU governor of the Galaxy S7. Of the 21 frequencies, only 5 frequencies were used, not 1664 MHz or higher. In addition,
Table 6 is the share of each GPU frequency confirmed by running 15 workloads on the basic GPU governor of the Galaxy S7. As a result of the measurement, it was confirmed that only 650 MHz, 600 MHz, and 546 MHz were used among the six GPU frequencies. Therefore, the proposed low-power technique uses CPU big core frequency between 1560 MHz and 520 MHz, and GPU frequency between 650 MHz, 600 MHz, and 546 MHz.
Now, when we start the low-power technique using only the given frequency, we first check the CPU utilization of the smartphone. If the CPU utilization is 86% or more, we increase the CPU frequency by one step. If the CPU utilization is high, it is lowered by increasing the frequency because CPU throughput is high. When the CPU utilization reaches 100%, it increases the CPU frequency because it can cause tasks that CPU cannot handle, and performance can be degraded. In addition, the optimal threshold for the CPU utilization is found so that the interactive governor, the default CPU frequency governor, increases the CPU frequency when the CPU utilization is over 86%. When the CPU frequency is more than 76% and less than 86%, it maintains the CPU frequency. This is to prevent a rapid repetition of the CPU frequency changes in the saturation case by creating a case where the CPU is fully used, and the CPU frequency is maintained.
If the CPU utilization is 76% or less, the CPU frequency is selected using the power consumption and FPS variation according to the CPU/GPU frequencies for each phase. The next phase should be predicted first. The process of predicting the next phase of the processor is as follows. First, we load a record of the last 7 phases of the processor. Each of these phases has a weight; the more recent, the greater the weight. For example, the phase from the nearest past has a weight of 7, and the subsequent phases have weights of 6, 5, 4, 3, 2, and 1, respectively, in order of closest to the present. Then, the same phases’ weights are added and we select the phase with the highest weight as the prediction phase.
The aforementioned two CPU utilization thresholds are set according to the interactive governor [
6], which changes CPU frequency according to CPU utilization. The interactive governor set the default values of the two thresholds to 90% and 80%. Through the experiment, we found the optimal CPU utilization thresholds with better performance than the interactive governor’s default values.
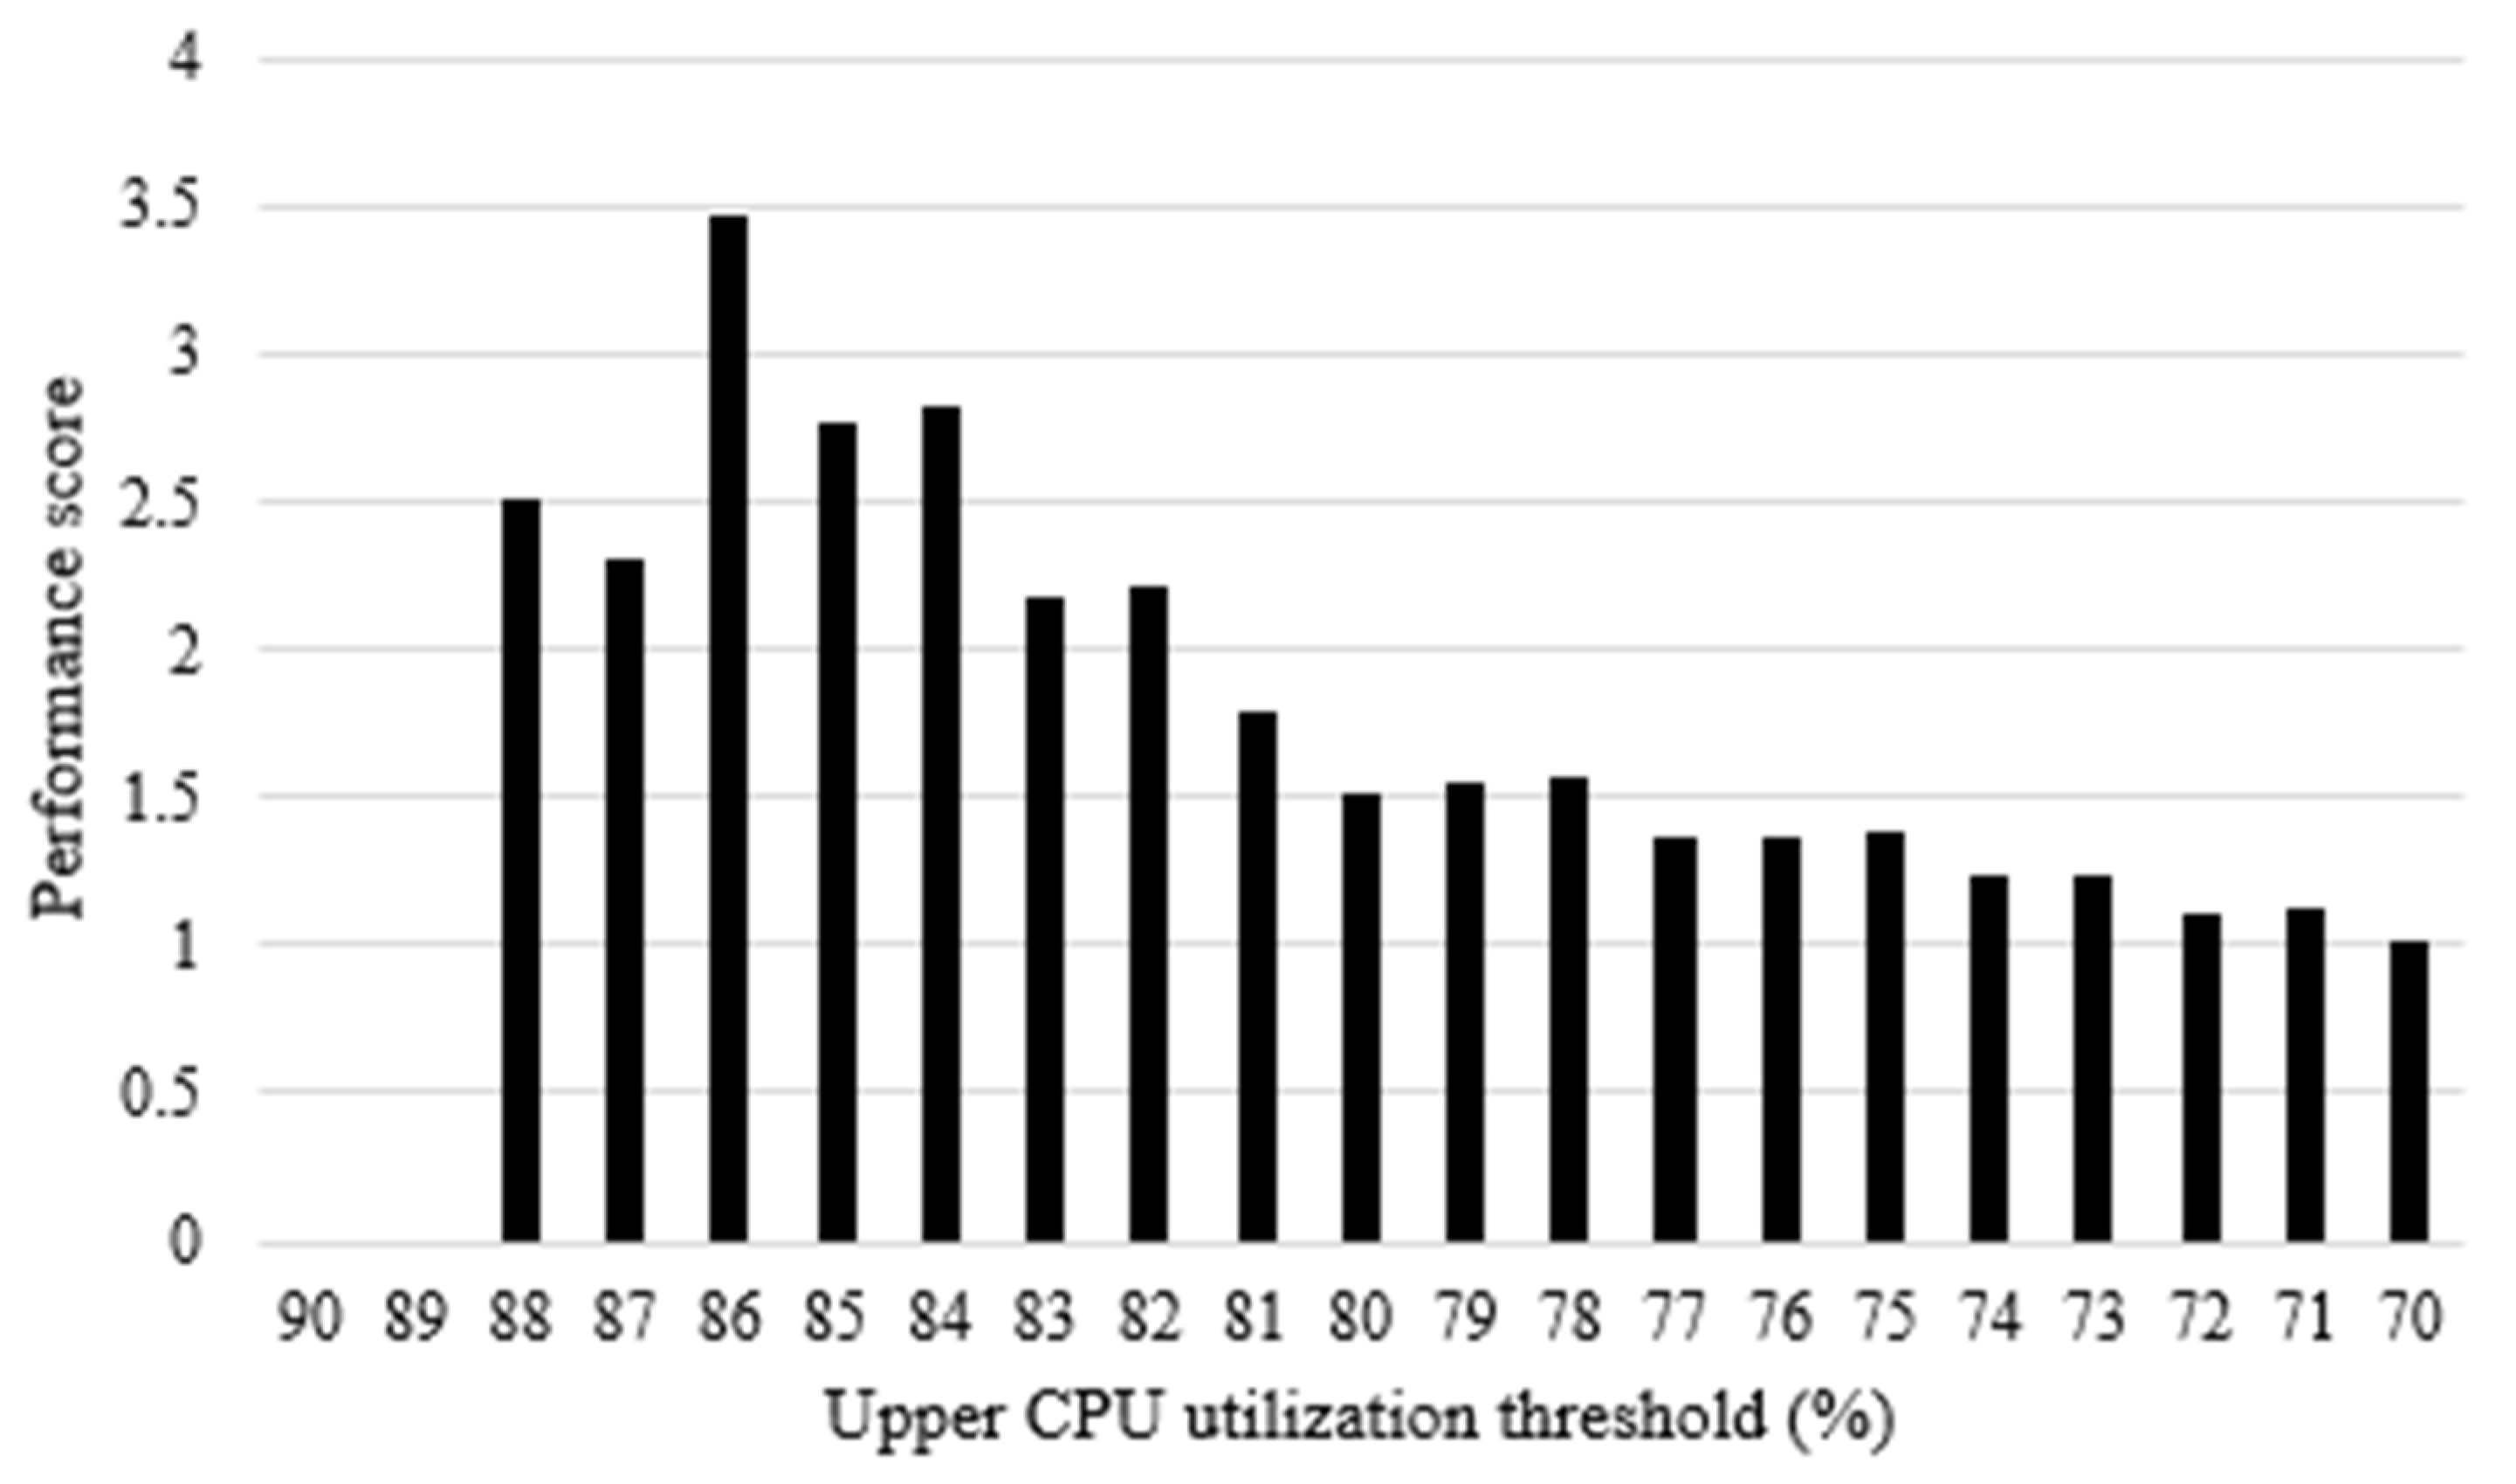
Figure 7 shows the performance score of the proposed low-power technique when experimenting with changing the upper CPU utilization threshold from 90% to 70%. The lower CPU utilization threshold is 10% below the upper one. The performance score is the normalized power consumption reduction rate for the normalized FPS reduction rate. Therefore, the performance score increases when the normalized power consumption reduction rate is high and the normalized FPS reduction rate is low. Additionally, the higher performance score, the better the upper CPU utilization threshold. Therefore, when the upper CPU utilization threshold is 86%, the proposed low-power technique showed the best performance.
If the phase of the next section is predicted, the power consumption of the current section is now calculated. Only the two power consumptions of the CPU big core and GPU are considered. Since the frequency of the CPU little core is not controlled and the display power is not affected by the low-power technique proposed in this paper, the CPU little core and the power of the display are calculated.
If the power consumption in the current section was calculated and the phase in the next section was predicted, the power consumption according to CPU/GPU frequency should now be predicted in the predicted phase.
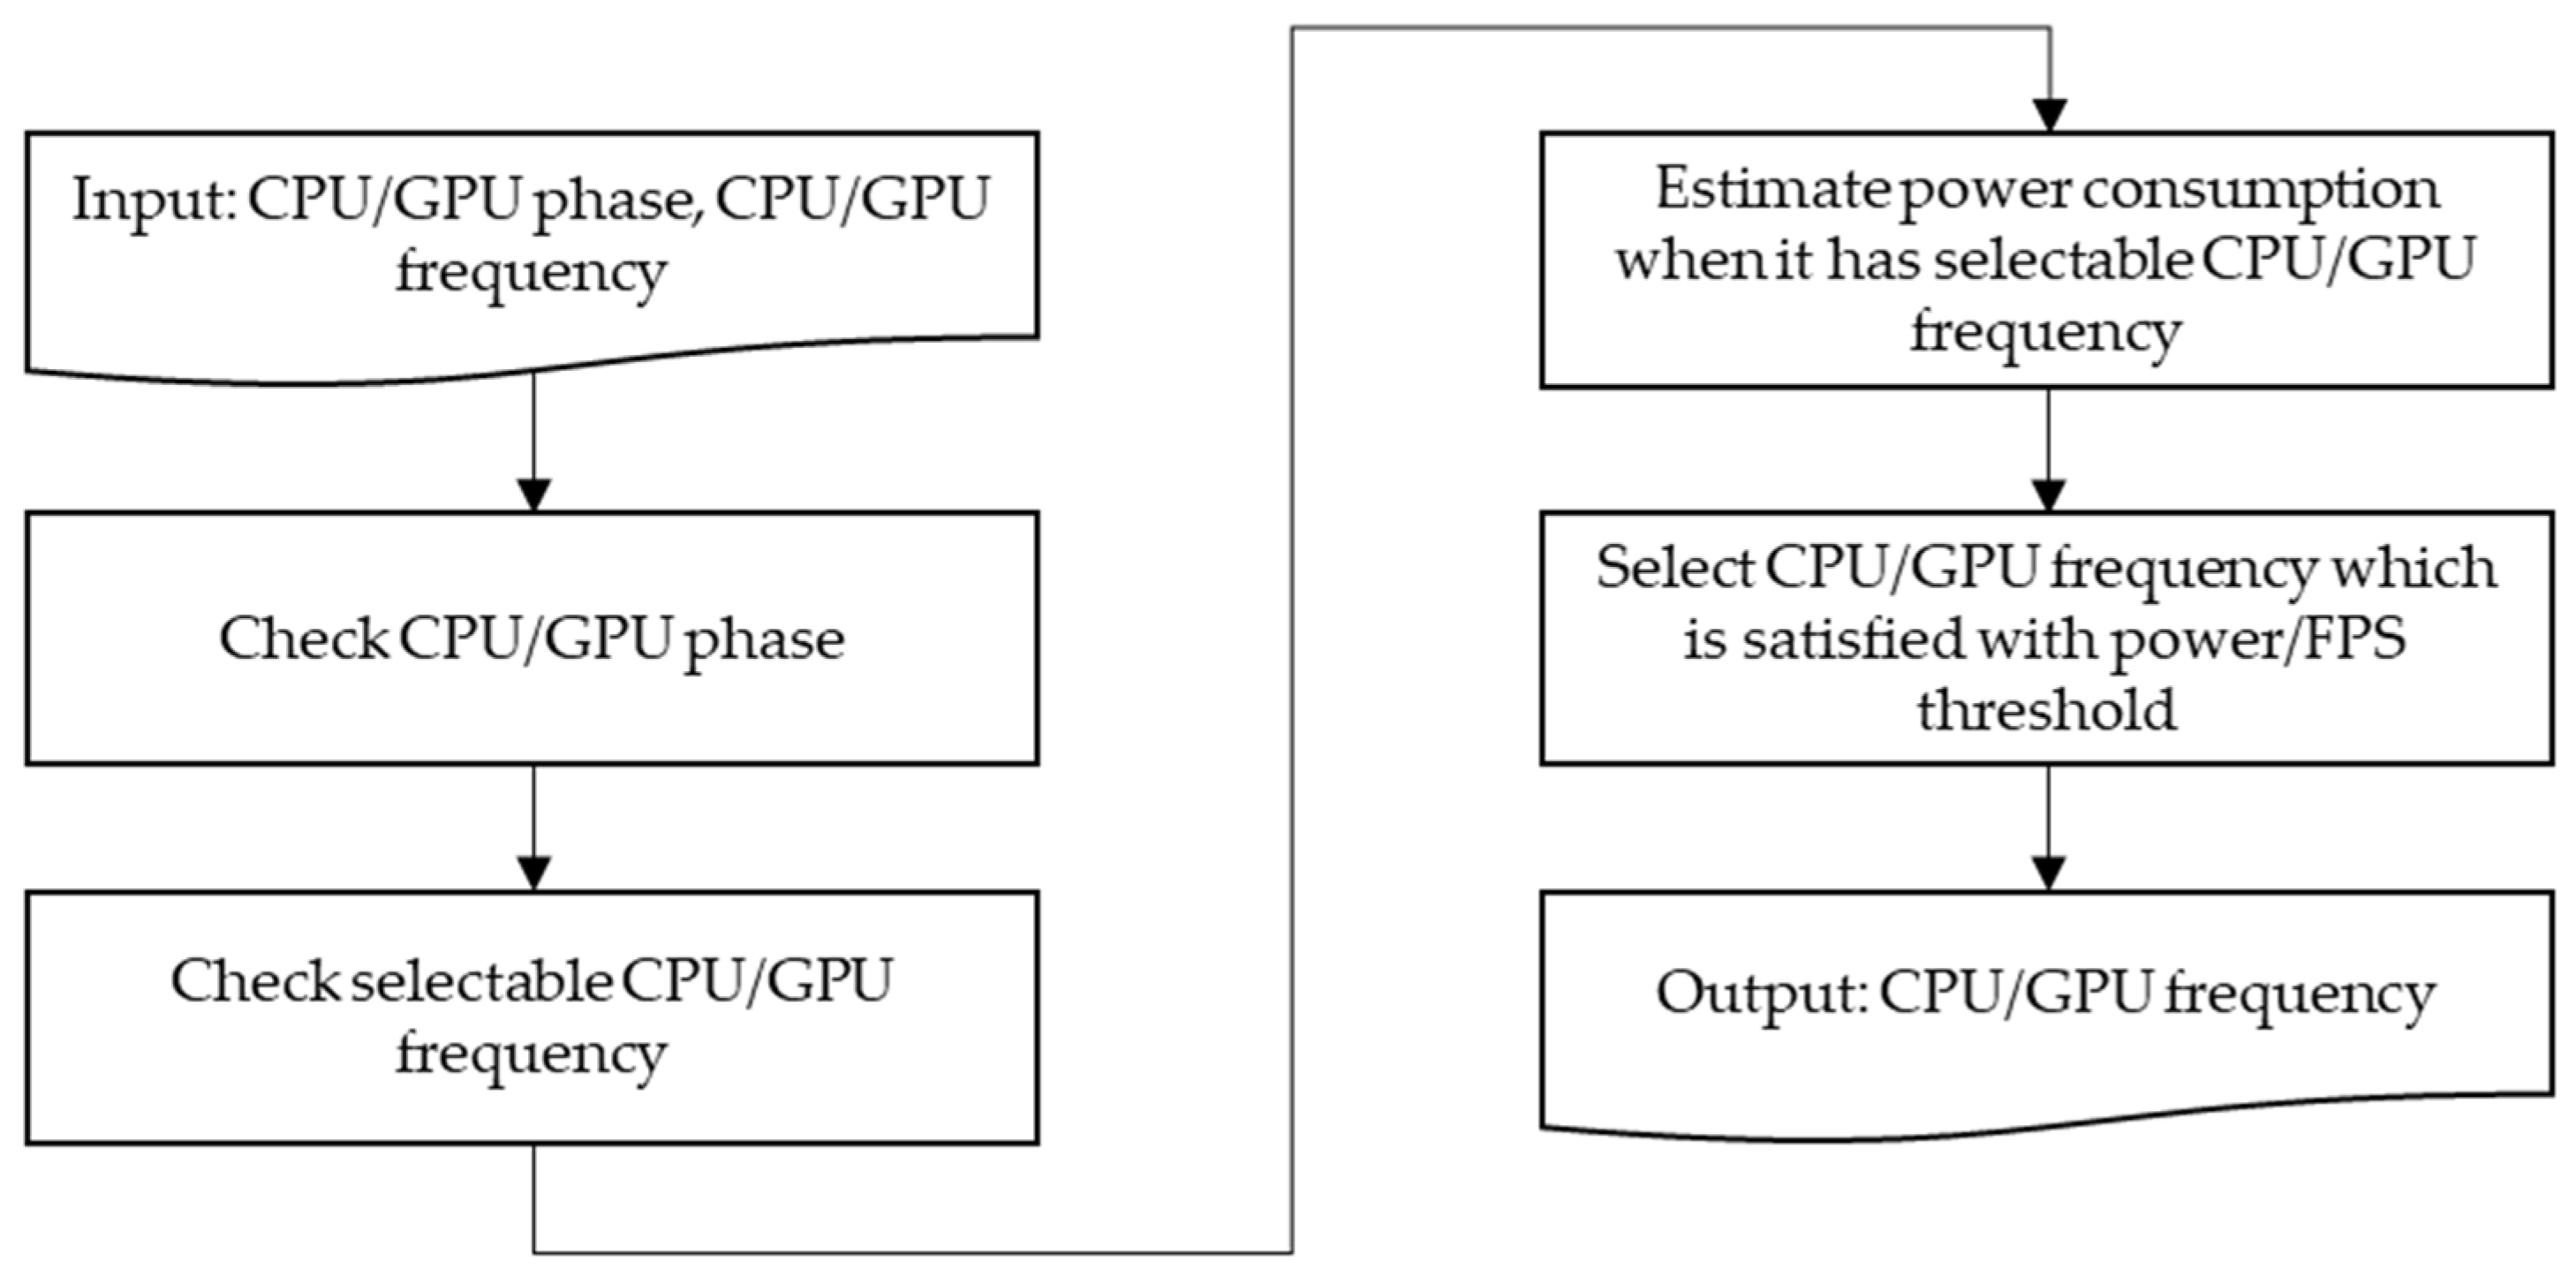
Figure 8 shows the flow of this process. Before that, one should check whether the CPU phase and GPU phase are phases with large power consumption and FPS changes according to the CPU/GPU frequency mentioned above. Here, if the CPU phase or GPU phase is a phase with a small amount of power consumption and FPS change, the frequency of the component is selected as the lowest frequency, and the frequency selected in the next process is ignored. CPU frequency and GPU frequency are 520 MHz and 546 MHz, respectively, the lowest frequencies.
If both CPU and GPU frequencies are selected, the process finishes selecting frequency, but otherwise proceeding to the next step. It goes to the section corresponding to the predicted phase in the power consumption and FPS variation table. Next, it finds the location corresponding to the current CPU/GPU frequencies and explores the eight nearest CPUs/GPU frequencies around the location. First, since the current CPU/GPU frequencies may not be the reference frequencies, the process increases or decreases to the same value as the eight surrounding values so that the current frequency consumption power and FPS change amount are 0%. The reference CPU frequency is 1144 MHz, which is the middle value among the CPU frequency range, and the reference GPU frequency is 600 MHz, the middle value among the GPU frequency range.
In addition, the current power consumption is multiplied by the amount of change in the surrounding eight, and the predicted power consumption change is calculated when the CPU/GPU frequencies are changed. For eight variable frequencies, the process adds the predicted power consumption of the CPU and GPU, and then selects the frequency with a little FPS change rate within 5% and the lowest predicted power consumption sum as the frequency of the next interval. The reason why the maximal FPS degradation is set at 5% is that, for workloads over 15 fps, small frame rate differences are not considered important by humans according to [
18]. Algorithm 1 shows an algorithm for finding a frequency that minimizes power consumption. We select a frequency by repeating the above process every section until the workload is over.
| Algorithm 1 Selecting CPU/GPU Frequency | |
| Input: CPU/GPU Frequency, CPU/GPU Phase | 1 For (i = −1; i <= 1; i++) |
| Output: Selected CPU/GPU frequency | 2 For (j = −1; j <= 1; j++) |
| : Predicted CPU phase | 3 Max = 0 |
| : Predicted GPU phase | 4 if (PP( + i, + j < Min) |
| : Current CPU frequency | 5 Min = PP( + i, + j) |
| : Current GPU frequency | 6 + i |
| + i: i th frequency from F in frequency table | 7 + j |
| PP(p1, p2, f1, f2): Predicted power consumption with CPU/GPU phase p1, p2 and CPU/GPU frequency f1, f2 | 8 Return , |
| : next CPU frequency | |
| : next GPU frequency | |
As a result, the proposed low-power technique uses algorithms that consider the predicted power consumption when the frequency is changed according to the phase of the CPU and GPU of the Android smartphone at 50 ms intervals to reduce the device’s power consumption.


