Article

RCS Measurement and Characteristic Analysis of a Sea Surface Small Target with a Shore-Based UHF-Band Radar

1
National Laboratory of Radar Signal Processing, Xidian University, Xi’an 710071, China
2
National Laboratory of Electromagnetic Environment, China Research Institute of Radiowave Propagation, Qingdao 266107, China
*
Author to whom correspondence should be addressed.
Electronics 2022, 11(16), 2573; https://doi.org/10.3390/electronics11162573
Submission received: 26 July 2022 / Revised: 10 August 2022 / Accepted: 15 August 2022 / Published: 17 August 2022

Abstract

:
Effectiveness verification of weapon equipment and the selection of stealth material are inseparable from target radar cross-section (RCS) measurement. For RCS characteristic analysis of sea surface small targets, a fishing vessel was measured using a shore-based ultra-high-frequency (UHF) band radar. In this article, a full program of RCS measurement and characteristic analysis is presented, and three strategies are adopted to guarantee its high precision. For this, a scheme was designed for RCS dynamic measurement, along with the construction of a two-stage median filter to improve target positioning precision, and an RCS estimation procedure with sea clutter removal is elaborated upon, which increases RCS accuracy. Note that the test range satisfies the far-field criterion, and the multipath effect is modified by external calibration in our data. The measurement results reveal that the RCS level of the sea surface small target is sensitive to the aspect angle and wave height at a low grazing angle, but the RCS fluctuation characteristic is not. Therefore, the aspect angle and wave condition must be considered for sea surface small target detection, classification, or identification.

1. Introduction

Control of the electromagnetic scattering characteristics of some targets is of great importance for radar design and operation. The RCS is a significant physical parameter to quantify an object’s ability to reflect electromagnetic waves, which can reveal the target’s size, shape, material, and other information [1,2,3]. It is useful for radar target detection [4,5], classification, and recognition [6] and is also one of the most important tactical and technical indicators for a new generation of stealth military targeting [3].
To research the interesting target RCS, there are two kinds of methods: the theory method and the test method. For the former, many different algorithms have been developed based on the theories of geometrical and physical optics and the geometrical and physical theories of diffraction, and so on [7,8,9,10]. Although the theory method is becoming more convenient to get RCS approximate values, with the development of the approximation theory and computer technique [11], it is still difficult to simulate the RCS of complex-shaped targets made of composite material [12,13]. In fact, the engineering application cannot entirely rely on computation and must eventually measure the targets indoors or outdoors [14,15,16]. Usually, the far-field RCS of targets is the most interesting. To obtain far-field RCSs, alternative approaches based on near-field far-field transformation are developed [17,18], but they are sensitive to the imperfections of the real measurement environment. The far-field measurement relies on an open field and the real target or scale model, and it has high requirements demanded for the measurement equipment and environment. Although the far-field test is costly, it can measure the full-scale target in natural environments and get the measured data with good accuracy and high reliability. Therefore, it remains the most effective measurement method in application.
As for the RCS of marine targets, there is an empirical formula for the radar frequency and the full-load displacement of the large vessel [19], but it is not available for small boats. For smaller targets, the composite electromagnetic scattering of the target and surroundings must be taken into consideration. In fact, the composite electromagnetic scattering characteristics of targets coexisting with a randomly rough sea surface have been studied using numerical algorithms [20,21,22], and the impact of different moveable positions, rotatable angle parameters, and sea conditions on ship RCS results are studied by modelling. However, the guidance and verification of measurements for modeling work to be successful is crucial. For this purpose, the Naval Ocean Systems Center in San Diego measured a real ship in real water at X-band and S-band frequencies [23], a Fynmeet X-band radar measured small boat reflectivity in sea clutter at Overberg test range and Signal Hill [24], and the University of Sydney measured a small wooden launch and a large glass fiber fly-bridge cruiser in a quiet section of the Hawksbury River, north of Sydney at 94 GHz [25].
In this article, a procedure for the RCS measurement and characteristic analysis at the UHF-band frequency for a small boat is discussed. The test range is an open sea and satisfies the far-field criterion for the RCS measurement [26]. Note that the UHF-band radar possesses the ability of early warning and anti-stealth. Thus, it is worth concentrating on its target characteristic. The main contributions of our works can be embodied in the following points: (1) we introduce, in detail, an RCS measurement experiment conducted on a sea surface near Lingshan Island using an UHF-band shore-based radar; (2) the procedure of target RCS estimation with external calibration, direction pattern correction, and sea clutter background elimination is elucidated; (3) the RCS characteristics at different aspect angles and wave conditions were studied. This article is organized as follows: the experiment and RCS estimation is presented in detail in Section 2. The RCS characteristic is analyzed in Section 3. Finally, discussion and concluding remarks are presented.

2. Procedure of RCS Measurement

2.1. Overview of the Experiment

The UHF-band radar installed at an altitude of about 430 m on Lingshan Island, China, can realize sea surface observations at grazing angles from 2° to 10° [25]. The radar adopts a fully coherent pulse system and a horizontal polarization mode with a planar array, for which a 3 dB beamwidth of azimuth and an elevation are measured at 10.2° and 11°, while using a pulse-compression system with a bandwidth of 2.5 MHz. For the environmental monitoring of the radar measurement scenario, it was equipped with a wave buoy (Datawell Waverider 4) and an anemometer (Lufft WS700-UMB); thus, the oceanic and meteorological parameters of the observation area were recorded.
The cooperative target for RCS measurement is a wooden fishing boat 12.5 m long and 3.3 m wide. Its average speed is about 3 m per second. The fishing boat and its real state on the sea surface are shown in Figure 1. There are two main purposes of our experiment: one is to obtain target RCS data at different aspect angles, and the other is to obtain target RCS data under different wave conditions. For the shore-based radar, which relies on the movement of the fishing boat itself to get the target echoes at different viewing angles, a reasonable experimental plan was needed to guide the target motion.
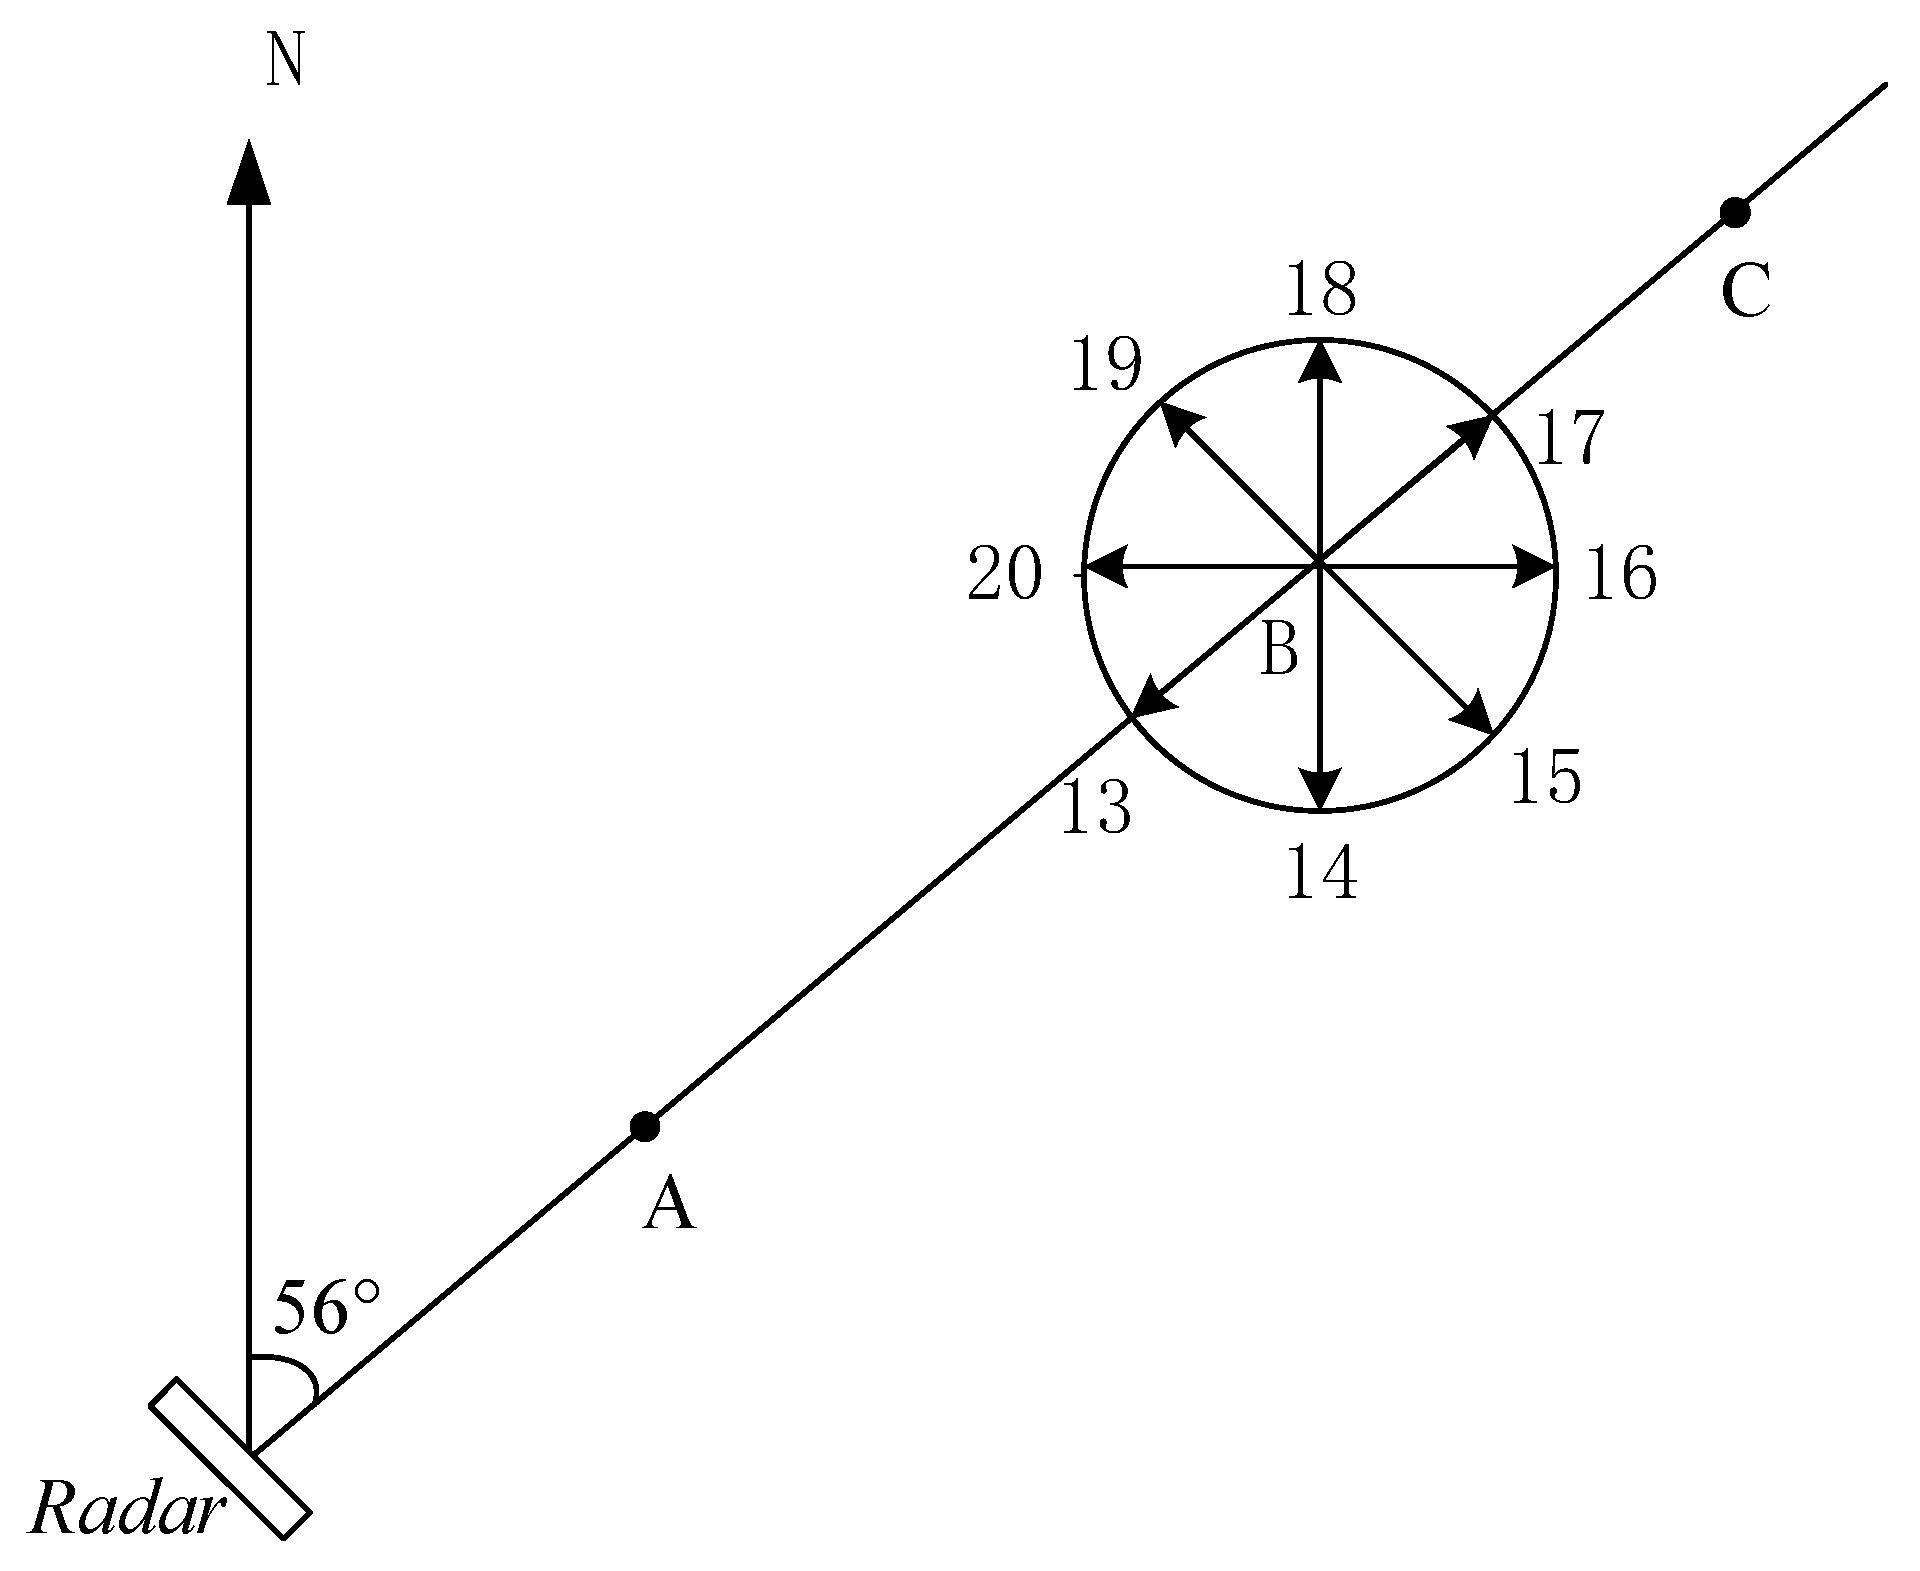
Therefore, multiple target movement routes are devised and shown in Figure 2. When the fishing boat moves along the line AC, the measurement data at a grazing angle of around 6° to 3° can be achieved. When it moves along the circular curve, the target returns at different aspect angles from 0° to 360°. However, the circular motion of a fishing boat is more difficult to carry out than rectilinear motion and is unfavorable for measuring adequate data at each aspect angle. In addition, the fishing boat cannot be fixed at a certain aspect angle on the sea surface, even if it is anchored, due to the drift and rotation caused by wave motion. Significantly, the moving target can maintain a more stable direction than a stationary target. Then the routes along the diameter of the circle are designed at an aspect angle from 0° to 315° in intervals of 45° to get the target returns from eight typical aspect angles. The grazing angle of point B is 4°, and the distance of the diameter of the circle is 300 m. It is worthy to note that the aspect angle 0° indicates the radar is facing the stern of the fishing boat, while an aspect angle of 180° indicates the radar is facing the bow of the fishing boat, with the aspect angles of 90° and 270° facing the starboard and port, respectively.
In terms of the experimental lines illustrated in Figure 2, the RCS measurement under different target motion states was carried out on different days in 2018. The radar parameters for RCS measurement are shown in Table 1, and the experimental data instructions are listed in Table 2. As described in Table 2, the data labels were numbered by ourselves; the ship routes are consistent with the routes depicted in Figure 2, with the significant wave height and wave direction recorded by Datawell Waverider 4. The aspect angle covered from 0° to 360°, and the grazing angle covered from 3° to 6°. Additionally, the ship’s route from data #101 was anticlockwise.

2.2. Estimation of Target RCS

The target RCS measurement data can be described as a complex matrix Z = [ z ( m , n ) , m = 1 , 2 , , M , n = 1 , 2 , , N ] , where M and N are the number of range bins and transmitted pulses, respectively. Its intensity is displayed by the distance-time amplitude map shown in Figure 3a, and the bright line pointed by the arrow is the signature of a fishing boat, in which we can see that the target echo intensity is higher than the sea surface. According to the GPS from the fishing boat and the distance-time amplitude map, the scope of the range bin is where the target located is determined. Assuming that the target range bins belong to [M1, M2], then the radar echo data containing the target signal is given as Z = [ z ( m , n ) , m = M 1 , M 1 + 1 , , M 2 , n = 1 , 2 , , N ] . The mark number of range bins of maximum radar echo intensity are given by:
x = [ argmax m { M 1 , M 1 + 1 , , M 2 } { | z ( m , n ) | } , n = 1 , 2 , , N ]
From Figure 3b, which plots the marks, the number of range bins varied with pulse number, we can realize that the misjudgment of the target position occurs when the target signal is weaker than the sea clutter. Owing to the fishing boat traveling at a slow speed, its motion trajectory should be continuous, so these misjudgment position points are similar to the impulse noise in a digital image, and the median filter can be used to correct the target position. In fact, the misjudged position of the measured target comes not only from the anomaly discrete points but also from the abnormal value at a certain period of time. On this condition, the filter length is an important factor in the result of position correction. When the filter length is too small, the continuous outliers cannot be filtered absolutely, but a “too large” filter length will also lead to filter errors. Reasonably, a two-stage median filter is used to correct the target position.
Let x = [ x ( n ) , n = 1 , 2 , , N ] be the sequence for the range bin shown in Figure 3b, where N denotes the number of pulses. The first-stage median filter has a small length L 1 to accurately filter out isolated or short-term outliers, and the second-stage median filter has a slightly longer length L 2 to filter out outliers over a longer period of time. Then, the target range bin vector y = [ y ( n ) , n = 1 , 2 , , N ] is:
y = m e d f i l t e r { m e d f i l t e r { x , L 1 } , L 2 } , L 1 < L 2
The vector y of the range bin after two-stage median filtering is depicted in Figure 3c, wherein the range bins of misjudgment are eliminated. Then, the sequence of the composite echo of the target and sea surface can be expressed as:
z = [ z ( y ( n ) , n ) , n = 1 , 2 , , N ]
For the RCS estimation, it is worth calibrating the radar measurement system and finding a system constant, which is used to perform absolute calibration on the radar echoes [27,28,29]. The UHF-band radar system was calibrated outdoors with the multipath effect modification described in detail by Li et al. in 2021. We obtained the system constant, represented as L. For a monostatic radar, transmitting and receiving with the same antenna, the RCS σ can be expressed as per [28]:
σ = P r ( 4 π ) 3 R 4 L P t G 2 λ 2
where P t and P r are the transmitted power and received power, respectively; G is the radar antenna gain, R is the slant distance from the target to antenna, and λ is the radar wavelength. It is worth noting that σ is the radar cross section of the target and sea surface.
In addition, what we need to point out is that the radar antenna gain is not a constant but a function of elevation angle. Let the radar antenna elevation diagram be represented as a function f ( a ) , where a is the angle away from the center of the pitch beam; thus, the radar antenna gain is G = G 0 f ( g g 0 ) when the target locates at elevation angle g, where g 0 is the elevation angle of radar antenna, and G 0 is the radar antenna gain of radar beam center. Due to the target movement causing almost no change in azimuth movement in our experiment, the correction of the azimuth pattern is ignored here. The expression of RCS σ is modified as:
σ = P r ( 4 π ) 3 R 4 L P t G 0 2 f 2 ( g g 0 ) λ 2
Although the radar data can be regarded as the vector superposition of radar echoes from the target and sea surface scatter, the radar returns from the target and sea surface from the same radar resolution unit cannot be separated. Moreover, the sea surface as a strong scatterer cannot be ignored for RCS estimation, and it cannot be filtered from radar returns as ground clutter, which can be eliminated with a zero frequency filter. It is worthy to note that the size of the cooperative fishing boat is much smaller than the area of the radar resolution unit, and the fishing boat can be regarded as a point target. Thus, the composite RCS value of the target and sea surface can be approximated as the sum of the target RCS value and sea surface RCS value in the unit of m2. Following Equation (5), the RCS of the radar resolution unit, where the target is located, can be computed as:
σ ( n ) = | z ( y ( n ) , n ) | 2 ( 4 π ) 3 ( y ( n ) Δ R ) 4 L P t G 0 2 f 2 ( g g 0 ) λ 2 , n = 1 , 2 , , N w h e r e , g = asin ( H y ( n ) Δ R ) , a n d , σ ( n ) σ sea ( n ) + σ target ( n ) .
where Δ R is the radar range resolution, and H is the elevation of radar.
Below, we focus on the RCS estimation of the sea surface. In terms of the radar equation, the radar echo power of the sea surface is represented by [26]:
P r = P t G 2 λ 2 Δ θ Δ R ( 4 π ) 3 L × σ 0 ( R ) R 2 R 2 H 2
where σ 0 ( R ) is the sea surface back-scattering coefficient, with a slant distance R, Δθ is the antenna azimuth beamwidth. It is noted that the first term in (7) is a constant when the radar parameters are fixed; thus, the radar echo power is a function of the slant distance and scattering coefficient. As we know, the scattering coefficient is a function of the grazing angle, but the several adjacent range bins are of the same or similar value for reflectivity at the low grazing angles. Here, P r R 2 R 2 H 2 can be regarded as an independent identically distributed random variable in a limited distance range. Let K = 10, the K range resolution units (closest to the target range bin) have a range number of { r 1 ( n ) , r 2 ( n ) , , r K ( n ) } , so that the sea clutter power of the target range-resolution unit can be estimated as follows:
P sea ( n ) = 1 K k = 1 K | z ( y ( n ) , n ) | 2 R k ( n ) 2 R k ( n ) 2 H 2 R 0 ( n ) 2 R 0 ( n ) 2 H 2 , n = 1 , 2 , , N R k ( n ) = r k ( n ) Δ R , R k ( n ) = y ( n ) Δ R .
According to Equations (5) and (6), and the RCS sequence of the measured target, we compute:
σ t a r g e t ( n ) = σ ( n ) P s e a ( n ) ( 4 π ) 3 ( y ( n ) Δ R ) 4 L P t G 0 2 f 2 ( g g 0 ) λ 2 , n = 1 , 2 , , N w h e r e , g = asin ( H y ( n ) Δ R ) .
where the unit of σ t a r g e t ( n ) is m2.

3. RCS Characteristics of a Sea Surface Small Target

In this section, the experimental data measured at different aspect angles and wave conditions are represented by the fluctuation characteristic and statistic of the RCS sequence. In addition, the influence of the aspect angle and wave conditions on the RCS is analyzed based on the measured data.

3.1. RCS Characteristics

The RCS fluctuation characteristic has important applications in radar system simulation, target detection, etc. The commonly used target fluctuation model is the Swerling model [30], which describes the fluctuating target as four types, from Swerling I to Swerling IV. It is classified via the form of a target RCS probability density function and its temporal correlation. Remarkably, the probability density function of Swerling models is the special form of a chi-square distribution, and the chi-square distribution is an extension of Swerling modeling that describes the target fluctuation characteristics more accurately [31]. The probability density function of a chi-square distribution is expressed by Equation (11); when parameter k is 1, P, 2, or 2P, it represents Swerling I, Swerling II, Swerling III, and Swerling IV, respectively, where P denotes the pulse number accumulated over a scan period. Furthermore, the parameter k of a chi-square distribution can be a decimal; thus, it has a more accurate representation of RCS statistical distribution. Generally, it is used for a slow fluctuating target when the RCS between pulses is correlated over a scan period and a rapid fluctuating target when the RCS between pulses is irrelevant over a scan period. Based upon these understandings, the correlation time can be used to describe the degree of target fluctuation when the radar works in the staring mode.
Following the elaborated steps from Section 3, we get the target time-RCS series, which is represented by { σ t a r g e t ( n ) , n = 1 , 2 , , N } . The temporal correlation coefficient ρ is:
ρ ( m ) = 1 N | m | n = 1 N m σ t a r g e t ( n ) σ t a r g e t ( n + m ) σ ¯ 2 t a r g e t 1 N n = 1 N m σ 2 t a r g e t ( n ) σ ¯ 2 t a r g e t , m > 0 , σ ¯ t a r g e t = 1 N n = 1 N σ t a r g e t ( n ) .
and the probability density function is [31]:
p ( σ t a r g e t ) = k ( k 1 ) ! σ ¯ t a r g e t ( k σ t a r g e t σ ¯ t a r g e t ) k 1 exp ( k σ t a r g e t σ ¯ t a r g e t ) , σ t a r g e t > 0
where k is the degree of freedom of chi-square distribution.
In what follows, the statistics are introduced to describe the target RCS. The generally used statistics are defined as followed:
σ m e a n = 1 N n = 1 N σ t a r g e t ( n ) , σ m e d i a n = m e d i a n { σ t a r g e t ( n ) , n = 1 , 2 , , N } , σ max = max { σ t a r g e t ( n ) , n = 1 , 2 , , N } , σ min = min { σ t a r g e t ( n ) , n = 1 , 2 , , N } , S = [ ( σ t a r g e t ( n ) σ m e a n ) 2 N ( N 1 ) ] 1 / 2 , V = S / σ m e a n .
where the σ m e a n , σ m e d i a n , σ max , and σ min are the mean value, median value, maximum value, and minimum value, respectively, and S and V are the standard deviation and variation coefficient, respectively. The former four statistics are used to represent the size of the RCS; the next two statistics are developed to describe the variance of the time-RCS series. In fact, the standard deviation is not appropriate for comparing the degree of dispersion between two data sets when they have different measurement scales, but the coefficient of variation, which eliminated the influence of the measurement scale, is available. The coefficient of variation is also a statistic to represent the RCS fluctuation characteristic.

3.2. Influence of Aspect Angle

The experimental datasets labeled #001~#008 are measured at an aspect angle from 0° to 315° in intervals of 45°, and their correlation times and the parameter k are listed in Table 3. The series { σ t a r g e t ( n ) , n = 1 , 2 , , N } from data #001 is plotted in Figure 4a; its temporal correlation coefficient and probability distribution are depicted in Figure 4b,c, respectively, for example. From the perspective of temporal correlation, the correlation time of the measured target is in the order of seconds, which indicates that it is a slow fluctuating target. In addition, the parameter k for eight aspect angles is close to 1, which indicates that the cooperative target is more in line with the Swerling I model, and the RCS fluctuation characteristic is stable with the variation of aspect angle.
Furthermore, the six statistics in Equation (12) from eight aspect angles are estimated and depicted in Figure 5. The maximum value, mean value, median value, and minimum value of each aspect angle are marked in Figure 5a from top to bottom, successively; the standard deviation and the coefficient of variation are plotted in Figure 5b,c, respectively. We can see that the median value, mean value, maximum value, minimum value, and standard deviation have two peaks at aspect angles of 90° and 270°, and a similar variance trend with the aspect angle, and yet the coefficient of variation has three peaks at aspect angles of 90°, 180° and 270°. From Figure 5a, the maximum value of the target RCS occurs when the aspect angle is at 90° and the minimum value when the aspect angle is 225°, with their mean values having a difference of 1.75 m2. It is noted that the standard deviation in Figure 5b is positively associated with the RCS level, and the difference in the RCS level at different aspect angles renders it invalid as a statistic to represent the degree of dispersion of the RCS. Nonetheless, the coefficients of variation in Figure 5c are close to 1, except that the prow and stern are 0.77 and 1.18; this insensitivity to aspect angle demonstrates that it may be available for target classification.
Besides, data #101 was recorded at an aspect angle of 0° to 360°, when the cooperative fishing boat made a circular motion around point B (Figure 2). The longitude and latitude of the target track are plotted in Figure 6a. The target’s average RCS over aspect angle “windows” 2° wide is depicted in Figure 6b. The mean value of the RCS in Figure 5a is also marked with red stars (as in Figure 6b) for comparison. Note that the target’s RCS is the largest when the radar beam illuminates the ship starboard directly and that they have the same variation trend with aspect angles using two measurement modes. Additionally, the mean value of the RCS at all aspect angles is 1.59 m2, and the mean value of the RCS from eight aspect angles is 1.22 m2. The consistency of these two measurement modes indicates the representativeness of these eight aspect angles and the validity of the experimental plan.
Ignoring the variation of the aspect angles, the target RCS at an aspect angle from 0° to 360° is only a time-RCS series, and its correlation time is 3.08 s, it’s parameter k is 0.9, and the coefficient of variation is 1.09. Then, it can be realized that the RCS fluctuation characteristic of the target (at varied aspect angles) is the same as it is at a certain aspect angle.

3.3. Influence of Wave Condition

As described in Table 2, data #201 and #202 were measured on two different days with the same route but different wave conditions. Their significant wave heights were 0.28 and 0.48 m, and wave direction was 118.2 and 165.5 degrees, respectively. Data #201 was recorded when the cooperative fishing boat moved from 4.7 km to 8.0 km at an aspect angle of 0°, and data #202 was recorded when the fishing boat moved from 4.4 km to 7.8 km at an aspect angle of 0° too.
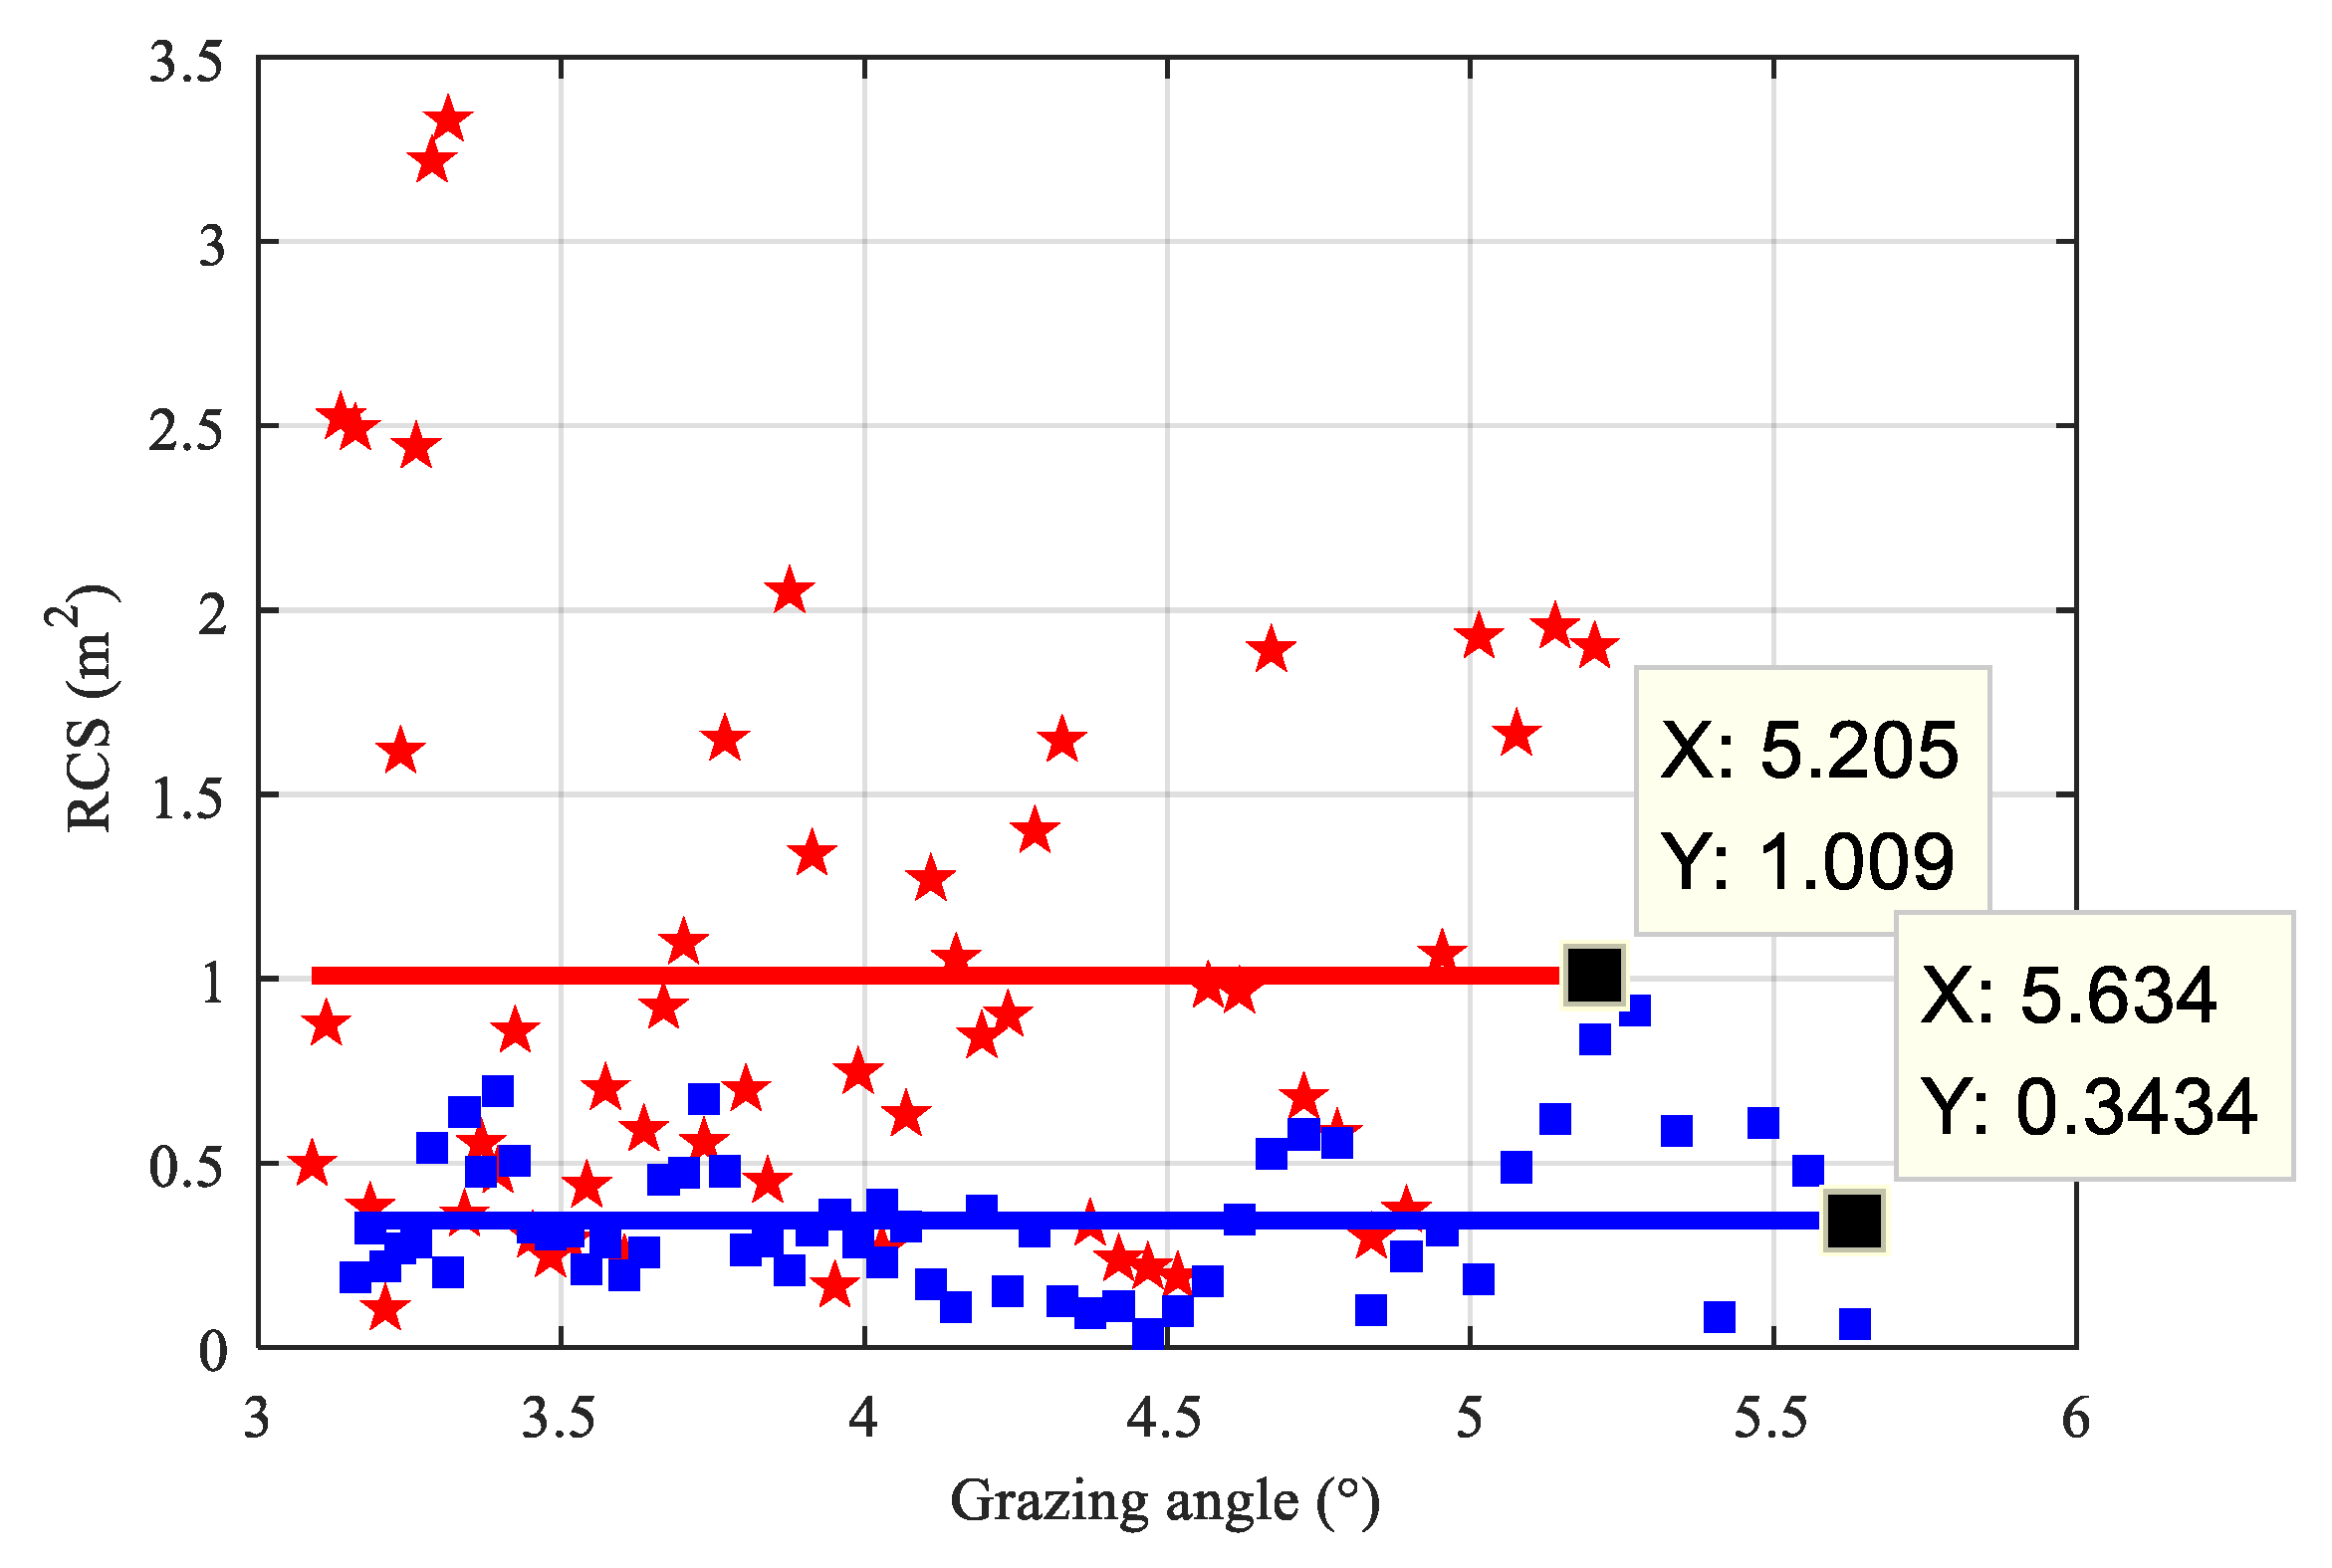
Due to the slow motion of the target, there are multiple pulses that can be obtained from each range bin. Then, the average RCS of multiple pulses in each range bin is utilized to eliminate the randomness of the observed value. Figure 7 depicts the average RCS from each range bin varying with the grazing angle. The blue squares are the measured values of data #201, and the blue line is their average value. The red stars are the measured values of data #202, and the red line is their average value. We can see that the average RCS for 0.48 m significant wave height is 0.67 m2 greater than that of the 0.28 m significant wave height. Table 4 charts their RCS fluctuation characteristics and statistics. From the perspective of the parameters in Table 4, we note that the correlation time, parameter k of chi-square distribution, and coefficient of variation between the two datasets are similar, but others are inversely proportional to wave height.
In some ways, the wave direction of the two datasets comes from a side wave, though they have a wave direction difference of 46.7°, and this may not cause the obvious change to the target’s attitude angle. However, the higher wave height signifies more wave shelter, especially at a low grazing angle. This will have a strong impact on small target RCSs. The measurement results reveal that the RCS level is sensitive to small wave height variation, but the RCS fluctuation characteristic is not. Furthermore, it is also worth mentioning that there is no obvious variation trend between the grazing angle of the measured target RCS at the low grazing angle.

4. Discussion

In this article, a wooden fishing boat 12.5 m long and 3.3 m wide was measured by a shore-based UHF-band radar. By measuring the target at different aspect angles and under different wave conditions, the RCS characteristics were studied. The result shows that the RCS level is sensitive to the aspect angle and wave height, but the fluctuation characteristic is not. Specifically, the measurement results reveal that the higher the wave height, the smaller the target RCS, and the existing modeling results also verify this. This phenomenon may be caused by wave shelter at low grazing angles. On the whole, the aspect angle and the sea state will have to be further considered for small target detection, classification, and recognition.

5. Conclusions

In this paper, the RCS measurement of a fishing vessel on the sea’s surface using a shore-based UHF-band radar is introduced. The experimental data measured at different aspect angles and wave conditions are analyzed and represented by the fluctuation characteristic and statistics of the RCS sequence. Based on the above, the RCS level of the cooperative fishing boat obviously varies with the aspect angle and wave height. The RCS measurement under all aspect angles was accomplished, yet it needs to be carried out over more wave conditions of differing heights in future studies. The measurement method and results of sea-surface targeting are significant for engineering applications.

Author Contributions

Methodology, X.X. and X.L.; software, X.X. and X.L.; investigation, Y.Z.; writing—original draft preparation, X.X.; writing—review and editing, P.S.; project administration, Q.L.; funding acquisition, Y.Z. All authors have read and agreed to the published version of the manuscript.

Funding

This research was funded by National Natural Science Foundation of China under Grant No.62071346.

Conflicts of Interest

The authors declare no conflict of interest.

References

  1. Borkar, V.G.; Ghosh, A.; Singh, R.K.; Chourasia, N. Radar Cross-section Measurement Techniques. Def. Sci. J. 2010, 60, 204–212. [Google Scholar] [CrossRef]
  2. Muth, L.A. Nonlinear Calibration of Polarimetric Radar Cross Section Measurement. IEEE Antennas Propag. Mag. 2010, 52, 187–192. [Google Scholar] [CrossRef]
  3. Xu, X.J. New Techniques for Radar Target Scattering Signature Measurement and Processing; National Defense Industry Press: Beijing, China, 2017; pp. 6–8. [Google Scholar]
  4. Hua, X.; Ono, Y.; Peng, L.; Xu, Y. Unsupervised Learning Discriminative MIG Detectors in Nonhomogeneous Clutter. IEEE Trans. Commun. 2022, 70, 4107–4120. [Google Scholar] [CrossRef]
  5. Liu, J.; Massaro, D.; Orlando, D.; Farina, A. Radar Adaptive Detection Architectures for Heterogeneous Environments. IEEE Trans. Signal Process. 2020, 68, 4307–4319. [Google Scholar] [CrossRef]
  6. Skolnik, M.I. Radar Handbook, 3rd ed.; Graw-Hill: New York, NY, USA, 2008; pp. 649–655. [Google Scholar]
  7. Maslovskiy, A.; Legenkiy, M.; Antyufeyeva, M. BSP step for complex target RCS measuring or calculation. In Proceedings of the 9th International Kharkiv Symposium on Physics and Engineering of Microwaves, Millimeter and Submillimeter Waves (MSMW), Kharkiv, Ukraine, 20–24 June 2016. [Google Scholar]
  8. Maslovskiy, A.; Kolchigin, N.; Legenkiy, M.; Antyufeyeva, M. Decomposition method for complex target RCS measuring. In Proceedings of the IEEE First Ukraine Conference on Electrical and Computer Engineering (UKRCON), Kyiv, Ukraine, 29 May–2 June 2017. [Google Scholar]
  9. Xiao, D.H.; Guo, L.X.; Liu, W.; Hou, M.Y. Efficient RCS Prediction of the Conducting Target Based on Physics-Inspired Machine Learning and Experimental Design. IEEE Trans. Antennas Propag. 2021, 69, 2274–2289. [Google Scholar] [CrossRef]
  10. Sanchez-Olivares, P.; Lozano, L.; Somolinos, Á.; Cátedra, F. EM Modelling of Monostatic RCS for Different Complex Targets in the Near-Field Range: Experimental Evaluation for Traffic Applications. Electronics 2020, 9, 1890. [Google Scholar] [CrossRef]
  11. Fan, T.Q.; Guo, L.X.; Liu, W. A novel OpenGL-based MoM/SBR hybrid method for radiation pattern analysis of an antenna above an electrically large complicated platform. IEEE Trans. Antennas Propag. 2016, 64, 201–209. [Google Scholar] [CrossRef]
  12. Zhang, Q.; Wang, D.; Zhou, Y.W. A method of RCS measurement in the outfield. In Proceedings of the World Conference on Mechanical Engineering and Intelligent Manufacturing, Shanghai, China, 4–6 December 2016. [Google Scholar]
  13. Wei, G.Y.; Yuan, W.Z.; Gao, F.; Cui, X.H. An accurate monostatic RCS measurement method based on the extrapolation technique. In Proceedings of the IEEE 9th International Conference on Communication Software and Networks (ICCSN), Guangzhou, China, 6–8 May 2017. [Google Scholar]
  14. Alvarez, J. Near-Field 2-D-Lateral Scan System for RCS Measurement of Full-Scale Targets Located on the Ground. IEEE Trans. Antennas Propag. 2019, 67, 4049–4058. [Google Scholar] [CrossRef]
  15. He, L.W.; Xue, Z.H.; Ren, W.; Li, W.M. S-band time domain near field planar measurement for RCS inside an anechoic chamber. In Proceedings of the 2015 7th Asia-Pacific Conference on Environmental Electromagnetics (CEEM), Hangzhou, China, 4–7 November 2015. [Google Scholar]
  16. Chen, B.X.; Hu, T.J.; Zhu, W.; Zhang, Z.S.; Zhang, X.L. RCS measurement for scale model of stealth targets in VHF band. Chin. J. Radio Sci. 2011, 26, 480–485. [Google Scholar]
  17. Osipov, A.; Kobayashi, H.; Suzuki, H. An Improved Image-Based Circular Near-Field-to-Far-Field Transformation. IEEE Trans. Antennas Propag. 2013, 61, 989–993. [Google Scholar] [CrossRef]
  18. Schnattinger, G.; Mauermayer, R.A.M.; Eibert, T.F. Monostatic Radar Cross Section Near-Field Far-Field Transformations by Multilevel Plane-Wave Decomposition. IEEE Trans. Antennas Propag. 2014, 62, 4259–4268. [Google Scholar] [CrossRef]
  19. Skolnik, M.I. An empirical formula for the radar cross section of ships at grazing incidence. IEEE Trans. Aerosp. Electron. Syst. 1974, 10, 292. [Google Scholar] [CrossRef]
  20. Behdani, M.; Dehkhoda, P.; Tavakoli, A.; Zoofaghari, M. Modified PO-PO hybrid method for scattering of 2D ship model on the rough sea surface. IET Microw. Antennas Propag. 2019, 13, 156–162. [Google Scholar] [CrossRef]
  21. Liang, Y.; Guo, L.X. A Study of Composite Scattering Characteristics of Movable/Rotatable Targets and a Rough Sea Surface Using an Efficient Numerical Algorithm. IEEE Trans. Antennas Propag. 2021, 69, 4011–4019. [Google Scholar] [CrossRef]
  22. Yan, W.; Gen, L.; Zhou, L.; Zhao, Y.; Wang, E.R.; Zhu, D. Optimization Analysis Method on Ship RCS Based on Sea Conditions and Cubic Spline Interpolation Algorithm. J. Electron. Inf. Technol. 2018, 40, 579–586. [Google Scholar]
  23. Tice, T.E. An overview of radar cross section measurement techniques. IEEE Trans. Instrum. Meas. 1990, 39, 205–207. [Google Scholar] [CrossRef]
  24. Herselman, P.L.; Baker, C.J.; de Wind, H.J. An Analysis of X-Band Calibrated Sea Clutter and Small Boat Reflectivity at Medium-to-Low Grazing Angles. Int. J. Navig. Obs. 2008, 2008, 347518. [Google Scholar] [CrossRef]
  25. Brooker, G.; Lobsey, C.; Hennessy, R. Radar cross sections of small boats at 94 GHz. In Proceedings of the IEEE Radar Conference, Rome, Italy, 26–30 May 2008. [Google Scholar]
  26. Li, X.; Shui, P.L.; Xia, X.Y.; Zhang, J.P.; Shi, X.F. Analysis of UHF-band sea clutter reflectivity at low grazing angles in offshore waters of the Yellow Sea. Int. J. Remote Sens. 2020, 41, 7472–7485. [Google Scholar] [CrossRef]
  27. Li, X.; Li, H.M.; Zhang, Y.S.; Shui, P.L.; Zhang, J.P.; Xu, S.W. Calibration measurements of shore-based radar with active reflector. In Proceedings of the 12th International Symposium Antennas, Propagation, and EM Theory, Hangzhou, China, 3–6 December 2018. [Google Scholar]
  28. Li, X.; Shui, P.L.; Zhang, Z.D.; Zhang, Y.S.; Xu, X.W. External Calibration of P-Band Island-Based Sea Clutter Measurement Radar on sea surface. IEEE Trans. Geosci. Remote Sens. 2021, 59, 5711–5720. [Google Scholar] [CrossRef]
  29. Wang, C.; Tian, Y.; Yang, J.; Zhou, H.; Wen, B.; Hou, Y. A Practical Calibration Method of Linear UHF Yagi Arrays for Ship Target Detection Application. IEEE Access 2020, 8, 46472–46479. [Google Scholar] [CrossRef]
  30. Swerling, P. Probability of detection for fluctuating targets. IRE Trans. Inf. Theory 1960, 6, 269–308. [Google Scholar] [CrossRef]
  31. Swerling, P. Radar probability of detection for some additional fluctuating target cases. IEEE Trans. Aerosp. Electron. Syst. 1997, 33, 698–709. [Google Scholar] [CrossRef]
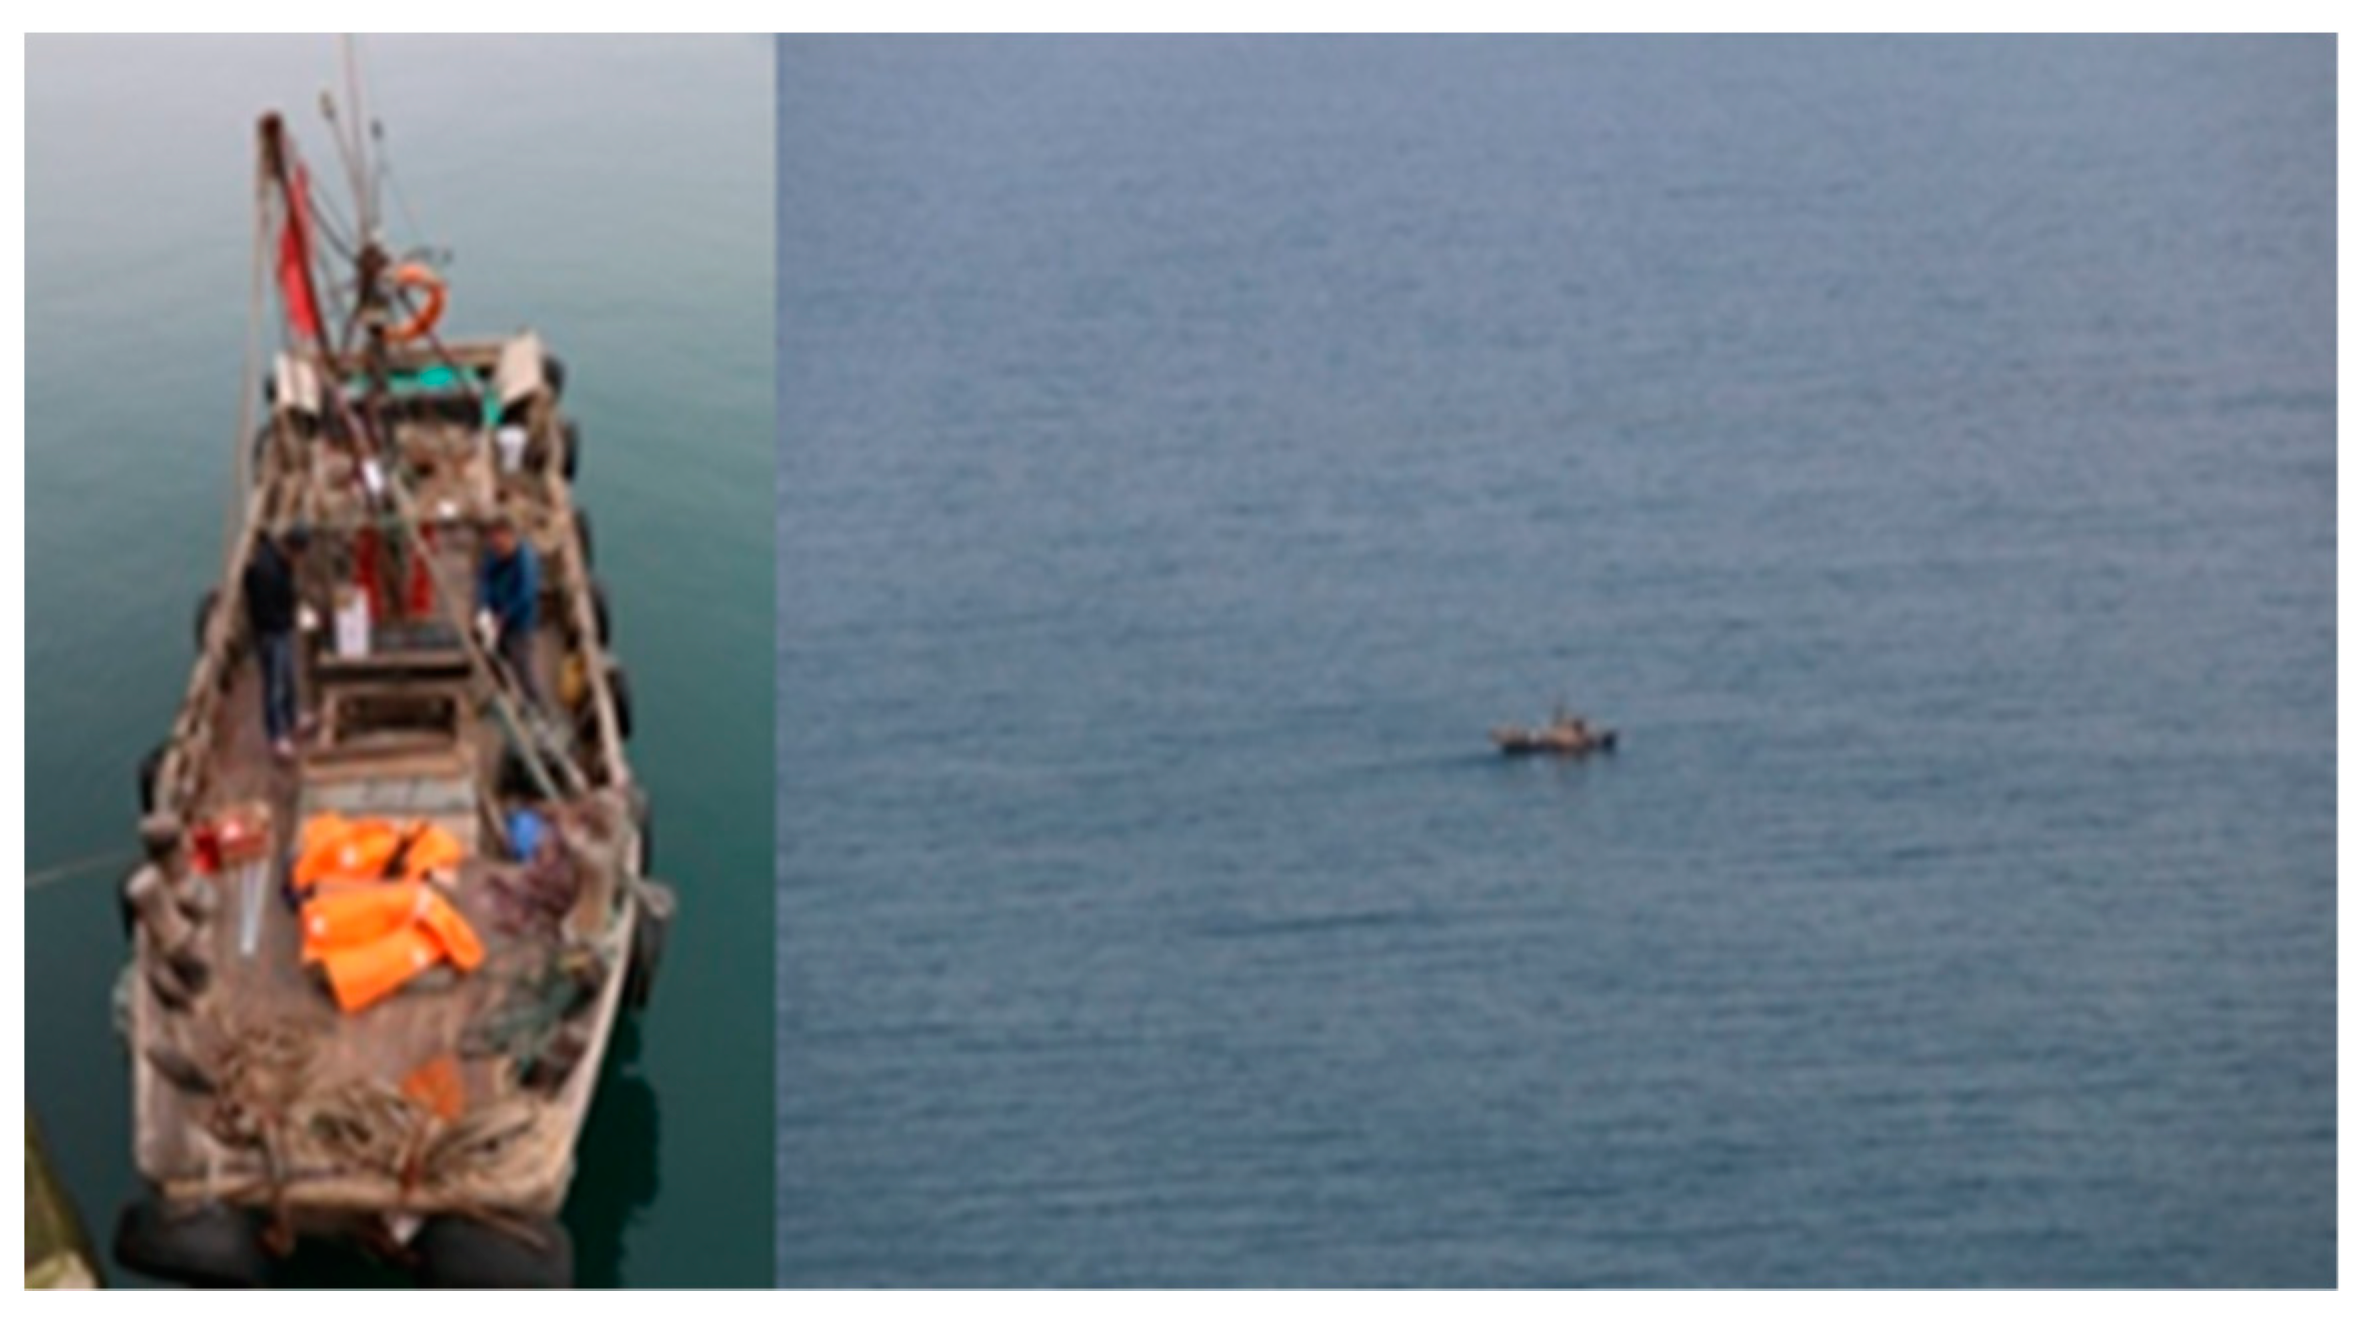
Figure 1. Live map of the cooperative fishing boat on the sea surface.
Electronics 11 02573 g001
Figure 2. Schematic plot of the RCS measurement experimentation.
Electronics 11 02573 g002
Figure 3. Process of target positioning based on radar echoes. (a) Distance-time amplitude map of radar echoes; (b) target range bin, with maximum radar echo intensity around the target; (c) modified target range bin by two-stage median filter.
Electronics 11 02573 g003
Figure 4. Target RCS fluctuation characteristic from data #001 at an aspect angle of 0°. (a) Time-RCS sequence; (b) time correlation; (c) probability distribution.
Electronics 11 02573 g004
Figure 5. The RCS statistical digital features of the cooperative fishing boat vary with aspect angle. (a) The size of RCS; (b) standard deviation; (c) coefficient of variance.
Electronics 11 02573 g005
Figure 6. The GPS data and average RCS over aspect angle “windows” 2° wide from the circumferential fishing boat. (a) The longitude and latitude of target; (b) the average RCS varies with aspect angle.
Electronics 11 02573 g006
Figure 7. Average RCS comparison of data #201 with data #202 at a grazing angle of about 3.0° to 5.6°, where the red star is the average RCS in each range bin for data #201, the red line is the RCS mean value for #201, the blue square is the average RCS in each range bin for data #202, and the blue line is the RCS mean value for #202.
Electronics 11 02573 g007
Table 1. Radar parameters.
ParameterValue
Frequency456 MHz
Elevation angle−4 degrees
PRF1 kHz
Pulse width10 μs (0.4 μs compressed)
Transmitting power3.2 kW
Antenna gain23 dB
Calibration accuracy2 dB
Table 2. Description of experimental data.
Data LabelShip RouteSignificant Wave Height (m)Wave Direction (°)Aspect Angle (°)Grazing Angle (°)
#00113→170.42130.904
#00220→160.45134.4454
#00319→150.42130.9904
#00418→140.42130.91354
#00517→130.42130.91804
#00616→200.45134.42254
#00715→190.42130.92704
#00814→180.42130.93154
#10117→18→…→170.45134.40~3604
#201A→C0.28118.206~3
#202A→C0.48165.506~3
Table 3. Target RCS fluctuation characterizations from eight aspect angles.
Data LabelAspect Angle (°)Correlation Time (s)Parameter k
#00100.721.4
#002451.050.9
#003901.510.7
#0041351.301.1
#0051802.070.9
#0062250.601.4
#0072701.321.0
#0083150.911.0
Table 4. Target RCS characteristic parameters.
Parameter#201#202
Correlation time5.70 s6.03 s
Parameter k0.81.1
σ m e a n 1.05 m20.34 m2
σ m e d i a n 0.66 m20.25 m2
σ max 7.56 m22.97 m2
σ min 0 m20 m2
S1.06 m20.32 m2
V1.010.92
Publisher’s Note: MDPI stays neutral with regard to jurisdictional claims in published maps and institutional affiliations.