Article

Preparation and Charge Transfer at Sb2Se3/1L-MoS2 Heterojunction

1
College of Materials and Environmental Engineering, Hangzhou Dianzi University, Hangzhou 310018, China
2
School of Sciences, Hangzhou Dianzi University, Hangzhou 310018, China
*
Author to whom correspondence should be addressed.
Electronics 2022, 11(16), 2574; https://doi.org/10.3390/electronics11162574
Submission received: 12 July 2022 / Revised: 5 August 2022 / Accepted: 12 August 2022 / Published: 17 August 2022
(This article belongs to the Special Issue Two-Dimensional Materials for Nanoelectronics and Optoelectronics)

Abstract

:
Owing to the strong optical absorption of Sb2Se3, building heterojunctions (HJs) by using thin-layer Sb2Se3 and other two-dimensional (2D) materials is critical to the design and applications of ultrathin optoelectronic devices. However, the preparation of HJs using Sb2Se3 and other transition metal dichalcogenide (TMDC) thin layers is still challenging. Herein, a chemical vapor deposition (CVD) method was used to prepare monolayer MoS2(1L-MoS2) and Sb2Se3 thin layers. A dry transfer method was subsequently used to build their HJs. Individual PL spectra and PL mapping results obtained at the HJs indicate a charge injection from 1L-MoS2 into Sb2Se3 flake, which was further confirmed by contact potential difference (CPD) results obtained by using Kelvin probe force microscopy (KPFM). Further measurements indicate a type-Ⅰ band alignment with a band offset finally determined to be 157 meV. The obtained results of Sb2Se3/1L-MoS2 HJs will benefit the rational design of novel ultrathin optoelectronic devices based on novel 2D absorber layers working in visible light.

1. Introduction

In recent years, vertical van der Waals (vdW) HJs, stacked by two or more dissimilar 2D TMDC thin layers via van der Waal forces in the out-of-plane direction, inspired great enthusiasm in the application of novel 2D devices. The combination of different TMDC components offers extra manipulations of optical absorption, interlayer excitons [1], photovoltaic effect [2], tunneling-assisted carrier recombination [3], ultrafast and high-efficiency charge transfer [4], etc., which greatly enhances the external quantum efficiency and detectivity of optoelectronic devices from UV to near-infrared regions [5]. Since the emergence of the first vertically stacked graphene/h-BN HJ in 2010 [6], a variety of 2D bilayer TMDCs vertical HJs, denoted by MX2/MX2 (M = W, Mo, Nb, Pt, V, Re, Ta; X = S, Se, Te) [3,4,5,7,8,9,10,11,12,13,14,15,16,17,18,19,20,21,22,23,24,25,26] have been prepared. The manipulations through the composition, layer number, stacking sequence, and relative stacking angles are able to enhance light absorption ranging from the UV-light to near-infrared region and greatly elongate recombination lifetime of interlayer excitons up to five orders of magnitude (∼100 ns) [7,27], which greatly facilitates the design and preparation of novel optoelectronic devices with ultra-thin thickness.
Sb2Se3 have long been studied as a photovoltaic material. Its medium band gap of 1.04–1.18 eV [28,29] and strong absorption coefficient >105 cm−1 make it a potential absorber material in novel solar cells such as CdS/Sb2Se3 [30,31], CdxZn1−xS/ Sb2Se3 [32], ZnO/Sb2Se3 [33], TiO2/ Sb2Se3 [34], etc. In recent years, 2D Sb2Se3 nanoflakes with ultra-thin thickness as 1.28–1.54 nm have been prepared by the solvent-based method [35,36] and sodium-assisted CVD method [37]. Thicker layers with thickness of ~80 nm were also prepared by a hydrothermal method using SbCl3 and Na2SeO3 as precursors [35]. The obtained Sb2Se3 nanoflakes exhibit a layer thickness dependent band gap, which varies from ~1.5 eV (flake thickness ~80 nm) [35] to ~1.8 eV(flake thickness (~1.3 nm) [37]. The ultra-thin Sb2Se3 flakes exhibit an interesting anisotropic response of Raman peak intensity and photocurrent as a function of the polarization angle of the incident light [36], which indicates Sb2Se3 can be used as an absorber material in novel atomic-scale anisotropic photodetectors. Building p-n junctions using Sb2Se3 nanoflakes with other 2D materials is crucial to designing novel Sb2Se3-based detectors.
One-dimensional (1D) Sb2Se3 nanowires have been used to build HJs with 1L WS2 [38]. Regarding these processes, to the best of our knowledge, the preparation of HJs of Sb2Se3 with other 2D TMDCs is still challenging.
In this study, we prepared a Sb2Se3/1L-MoS2 HJ by a combined CVD and transfer method. Sb2Se3 flakes firstly deposited on mica substrate were transferred onto 1L-MoS2 flakes using a dry-transfer method assisted by PDMS tape. Redshift of PL A excitons of MoS2 at the junction area indicate a charge injection from 1L-MoS2 into Sb2Se3. Further measurements using KPFM indicate this new HJ has a type-Ⅰ band alignment. This study provides a rational design of Sb2Se3-based ultrathin HJs, and the obtained results would be helpful for deeply understanding the photoresponse of this new HJ structure.

2. Experiment and Characterization

Sample preparation: The CVD method was employed for the 2D Sb2Se3 flakes grown using two different routines. In routine Ⅰ, CVD was performed in a two-heating-zone tube furnace (Figure 1). A quantity of 5 mg Sb2O3 (99.9%, Aladdin) was put in zone 1 at 700 °C. A quantity of 3 mg Se (99.999%, Macklin) was placed 8–10 cm away from Sb2O3 powder in the upper steam direction (roughly 300 °C). A freshly cleaved mica sheet (KMg3AlSi3O10F2) was placed in zone 2 (T2 = 400 °C). High purity Ar/H2 (60 SCCM) was used as the carrier gas. In zone 2, the temperature was firstly ramped to 100 °C in 3 min and held for 10 min. Then the temperature was ramped to 400 °C and held for 33 min. In zone 1, the temperature was raised to 100 °C in 3 min and held for 26 min. Subsequently, the temperature was ramped to 700 °C and held for 5 min. During the whole process, the pressure was kept at 700–800 Torr. In routine Ⅱ, CVD was performed in a single heating zone tube furnace. A quantity of 10 mg of Sb2Se3 (99.9%, Aladdin) powder blended with a small amount of NaCl (10 wt.%) was used as precursor. A freshly cleaved mica sheet was directly placed on the top of the Sb2Se3 source. The temperature was ramped to 700 °C and held for 40 min. During the whole process, the pressure was kept at 700–800 Torr.
1L-MoS2 samples were also prepared by the CVD method in another two-heating-zone tube furnace. A quartz boat containing sulfur powder was placed in heating zone 1. A Si/SiO2 substrate (300 nm SiO2) was placed upside-down on a Mo sheet in heating zone 2. High purity Ar gas was used as carrier gas at a flow rate of 60 SCCM. Firstly, the temperature of heating zone 2 was raised from ambient temperature to 550 °C in 25 min, then heating zone 1 was turned on. The temperatures of heating zones 1 and 2 were raised to 270 and 850 °C, respectively, and held for 15 min before cooling naturally to ambient temperature.
The Sb2Se3 nanoflakes growing on the mica were transferred onto 1L-MoS2 flakes by the dry-transfer method. Firstly, PDMS was pasted onto the mica substrate and Sb2Se3 flakes were detached from mica and transferred to PDMS. Then, the Sb2Se3 flakes were released to Au thin film (60 nm) or 1L-MoS2 after heating at 85 °C for 7 min. The obtained Sb2Se3/1L-MoS2 HJs were annealed for 3 h in vacuum at 200 °C and a pressure of 3 × 10⁻² Torr.
Characterization: Optical images were captured by an optical microscope. A Raman spectrometer (Horiba Labram Nano) was used for the Raman measurement. This Raman spectrometer is equipped with 532, 632.8, and 785 nm lasers, 100x (NA = 0.9, Olympus) objective, two gratings (1800/150 mm), and a charge-coupled detector (CCD). Raman and PL measurements were conducted by switching the lasers and controlling laser power. Furthermore, an atomic force microscopy (AFM) (HORIBA, AIST-NT) was adopted to measure the morphology, CPD, and capacitance image. The Au–coated tips were used for the AFM and KPFM measurements. KPFM measurements were performed by lifting the tips 10 nm from the sample surface. A bias of 4 V was applied on the tips, while the substrates were grounded. The work function of the Au-coated tip was calibrated to be 4.9 eV by a highly oriented pyrolytic graphite (HOPG). I-V curves were measured in conductive mode using a Pt coated silicon tip working in contact mode. The element type and content of composition were analyzed by energy disperse spectroscopy (EDS) on a scanning electron microscope (SEM).

3. Results and Discussions

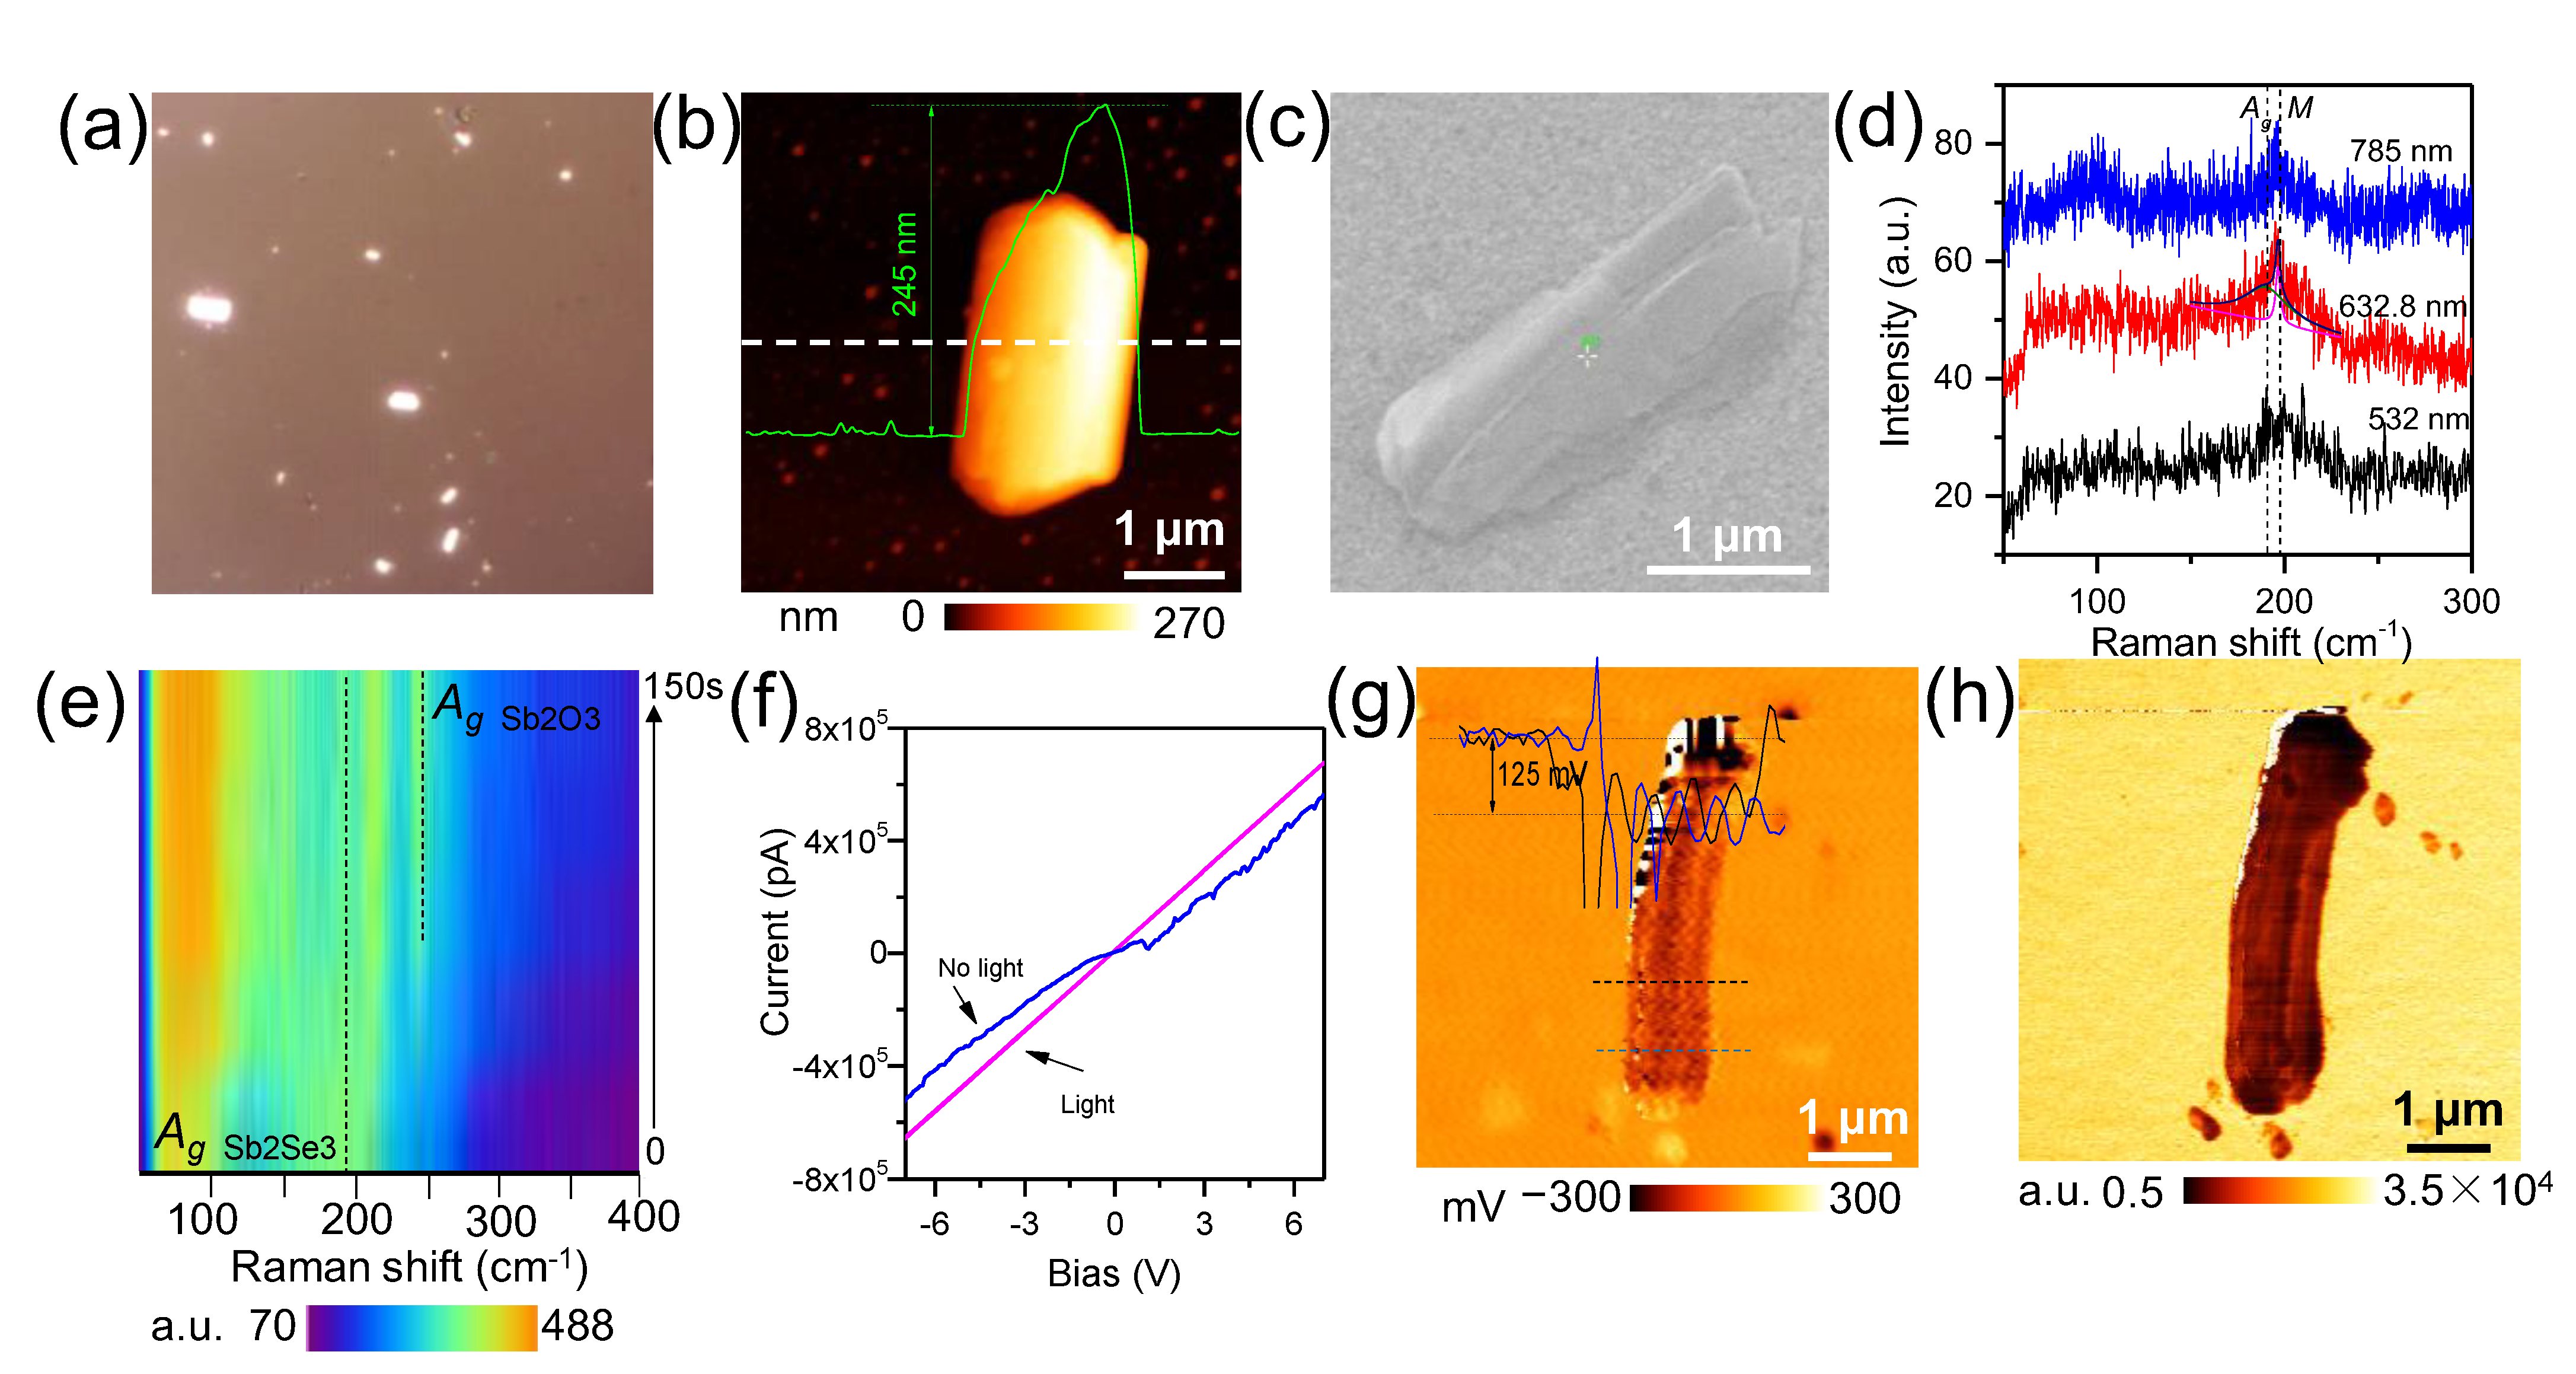
Optical images of obtained Sb2Se3 nanoflakes prepared on a mica substrate by routines Ⅰ and Ⅱ are presented in Figure 2a and Figure S1a, respectively. The obtained nanoflakes exhibit a long rhombic shape, which is analogous to that of Sb2Se3 nanoflakes prepared by the CVD method reported by Valdman et al. [39] and Wang et al. [35]. The atomic structure of Sb2Se3 is composed of 1D chain-like [Sb4Se6]n ribbons along the [1] direction. Within each [Sb4Se6]n ribbon, the atoms are bonded by strong Sb–Se covalent bonds. Trigonal SbSe3 units and tetragonal SbSe5 pyramids are coordinated alternately. Along the [100] and [10] directions, the ribbons are stacked by relatively weak van der Waals forces [36,37]. An AFM topographic image of a Sb2Se3 nanoflake prepared by routine Ⅰ is presented in Figure 2b. This flake has a rhombic flake shape and a larger thickness on one side. This feature is also quite similar to that of epitaxial Sb2Se3 on mica [39]. The thickness of this flake can be determined to be 245 nm from the height profile along the dashed line (inset in Figure 2b). An SEM image of a Sb2Se3 nanoflake prepared on Au-coated substrate is shown in Figure 2c. The Sb and Se atomic percentages were measured to be 22.5% and 77.5%, respectively, by EDS collected at the marked point in Figure 2c. The large deviation in stoichiometry may be induced by large uncertainties in EDS measurement.
Raman spectra of the Sb2Se3 nanoflakes prepared by routine Ⅰ were measured by 532, 632.8, and 785 nm lasers and are presented in Figure 2d. The Raman spectrum of Sb2Se3 nanoflakes prepared by routine Ⅱ was measured by 532 nm laser and is plotted in Figure S1b. It can be seen these spectra exhibit similar features, i.e., a broad Raman band centered at ~190 cm−1, which can be assigned to Ag mode, in which the Sb-Se bond-stretching vibration is orthogonal to the ribbon direction [37]. It should be noted that these spectra were measured at extremely low laser power. For an excitation laser wavelength of 532 nm and larger laser power of ~34 μW at the focus, the features of Raman spectra strongly depend on the scanning time (Figure 2e). At the beginning of the scan (<20 s), the obtained Raman spectra are similar to those in Figure 2d, whereas for scanning time >40 s, three Raman peaks at 193, 215, and 251 cm−1 were predominant (Figure S2a). These features are similar to those of Sb2O3 oxidized from Sb2Se3 [16,40]. The peak at ~193 cm−1 can still be assigned to Ag of Sb2Se3, whereas the peak at 251 cm−1 can be assigned to Ag mode of Sb2O3 [41]. Similar oxidation was not observed by using excitation laser wavelength of 632.8 and 785 nm (Figure S2b,c), which might be induced by low optical absorption at these two wavelengths [37]. The scanning time-dependent Raman spectra of Sb2Se3 flakes prepared by routine Ⅱ are presented in Figure S2d. The intensity of the Ag peak also decreases with long exposure time, indicating the oxidation is still seen at long exposure time, which is similar to the flakes prepared by routine Ⅰ. These results indicate oxidation of Sb2Se3 nanoflakes prepared by routine Ⅰ and Ⅱ occurs when strong laser power and long exposure time are used. This also indicates the similar crystal structure and quality of Sb2Se3 prepared by the two routines. Therefore, the Sb2Se3 flakes prepared by the two routines are intentionally not discussed in the following section.
The I-V curve of a Sb2Se3 nanoflake prepared on gold thin film (topography image is shown in Figure S3) was measured in a dark state and is plotted in Figure 2f. The semi-linear curve indicates a typical response of a resistor, whereas, with illumination of a 532 nm laser, the enhanced current indicates the enlarged conductivity induced by generation of photocarriers. This indicates the semiconductor properties of the Sb2Se3 nanoflake, which agree well with those reported by Vidal-Fuentes et al. [16] and Chen et al. [29].
The CPD of a Sb2Se3 nanoflake prepared on gold thin film was measured and is shown in Figure 2g. CPD profiles along two dashed lines across the flake are plotted as an inset. The CPD on Au thin film is 0.02 ± 0.01 V, which is close to zero, the expected value. The average CPD on the Sb2Se3 nanoflake is measured to be −125 mV, corresponding to a Fermi energy of 5.025 eV by using Equation (1) [42]:
E f = Φ A u e × C P D
where Φ A u is the work function of the Au tip (4.9 eV). The obtained Fermi level of the nanoflake is slightly larger than the 4.64 eV of Sb2Se3 thin films reported by Mamta et al. [43]. The capacitance image of this Sb2Se3 nanoflake is shown in Figure 2h. The capacitance fluctuation may be induced by the thickness fluctuation, as shown by a topography image in Figure S3.
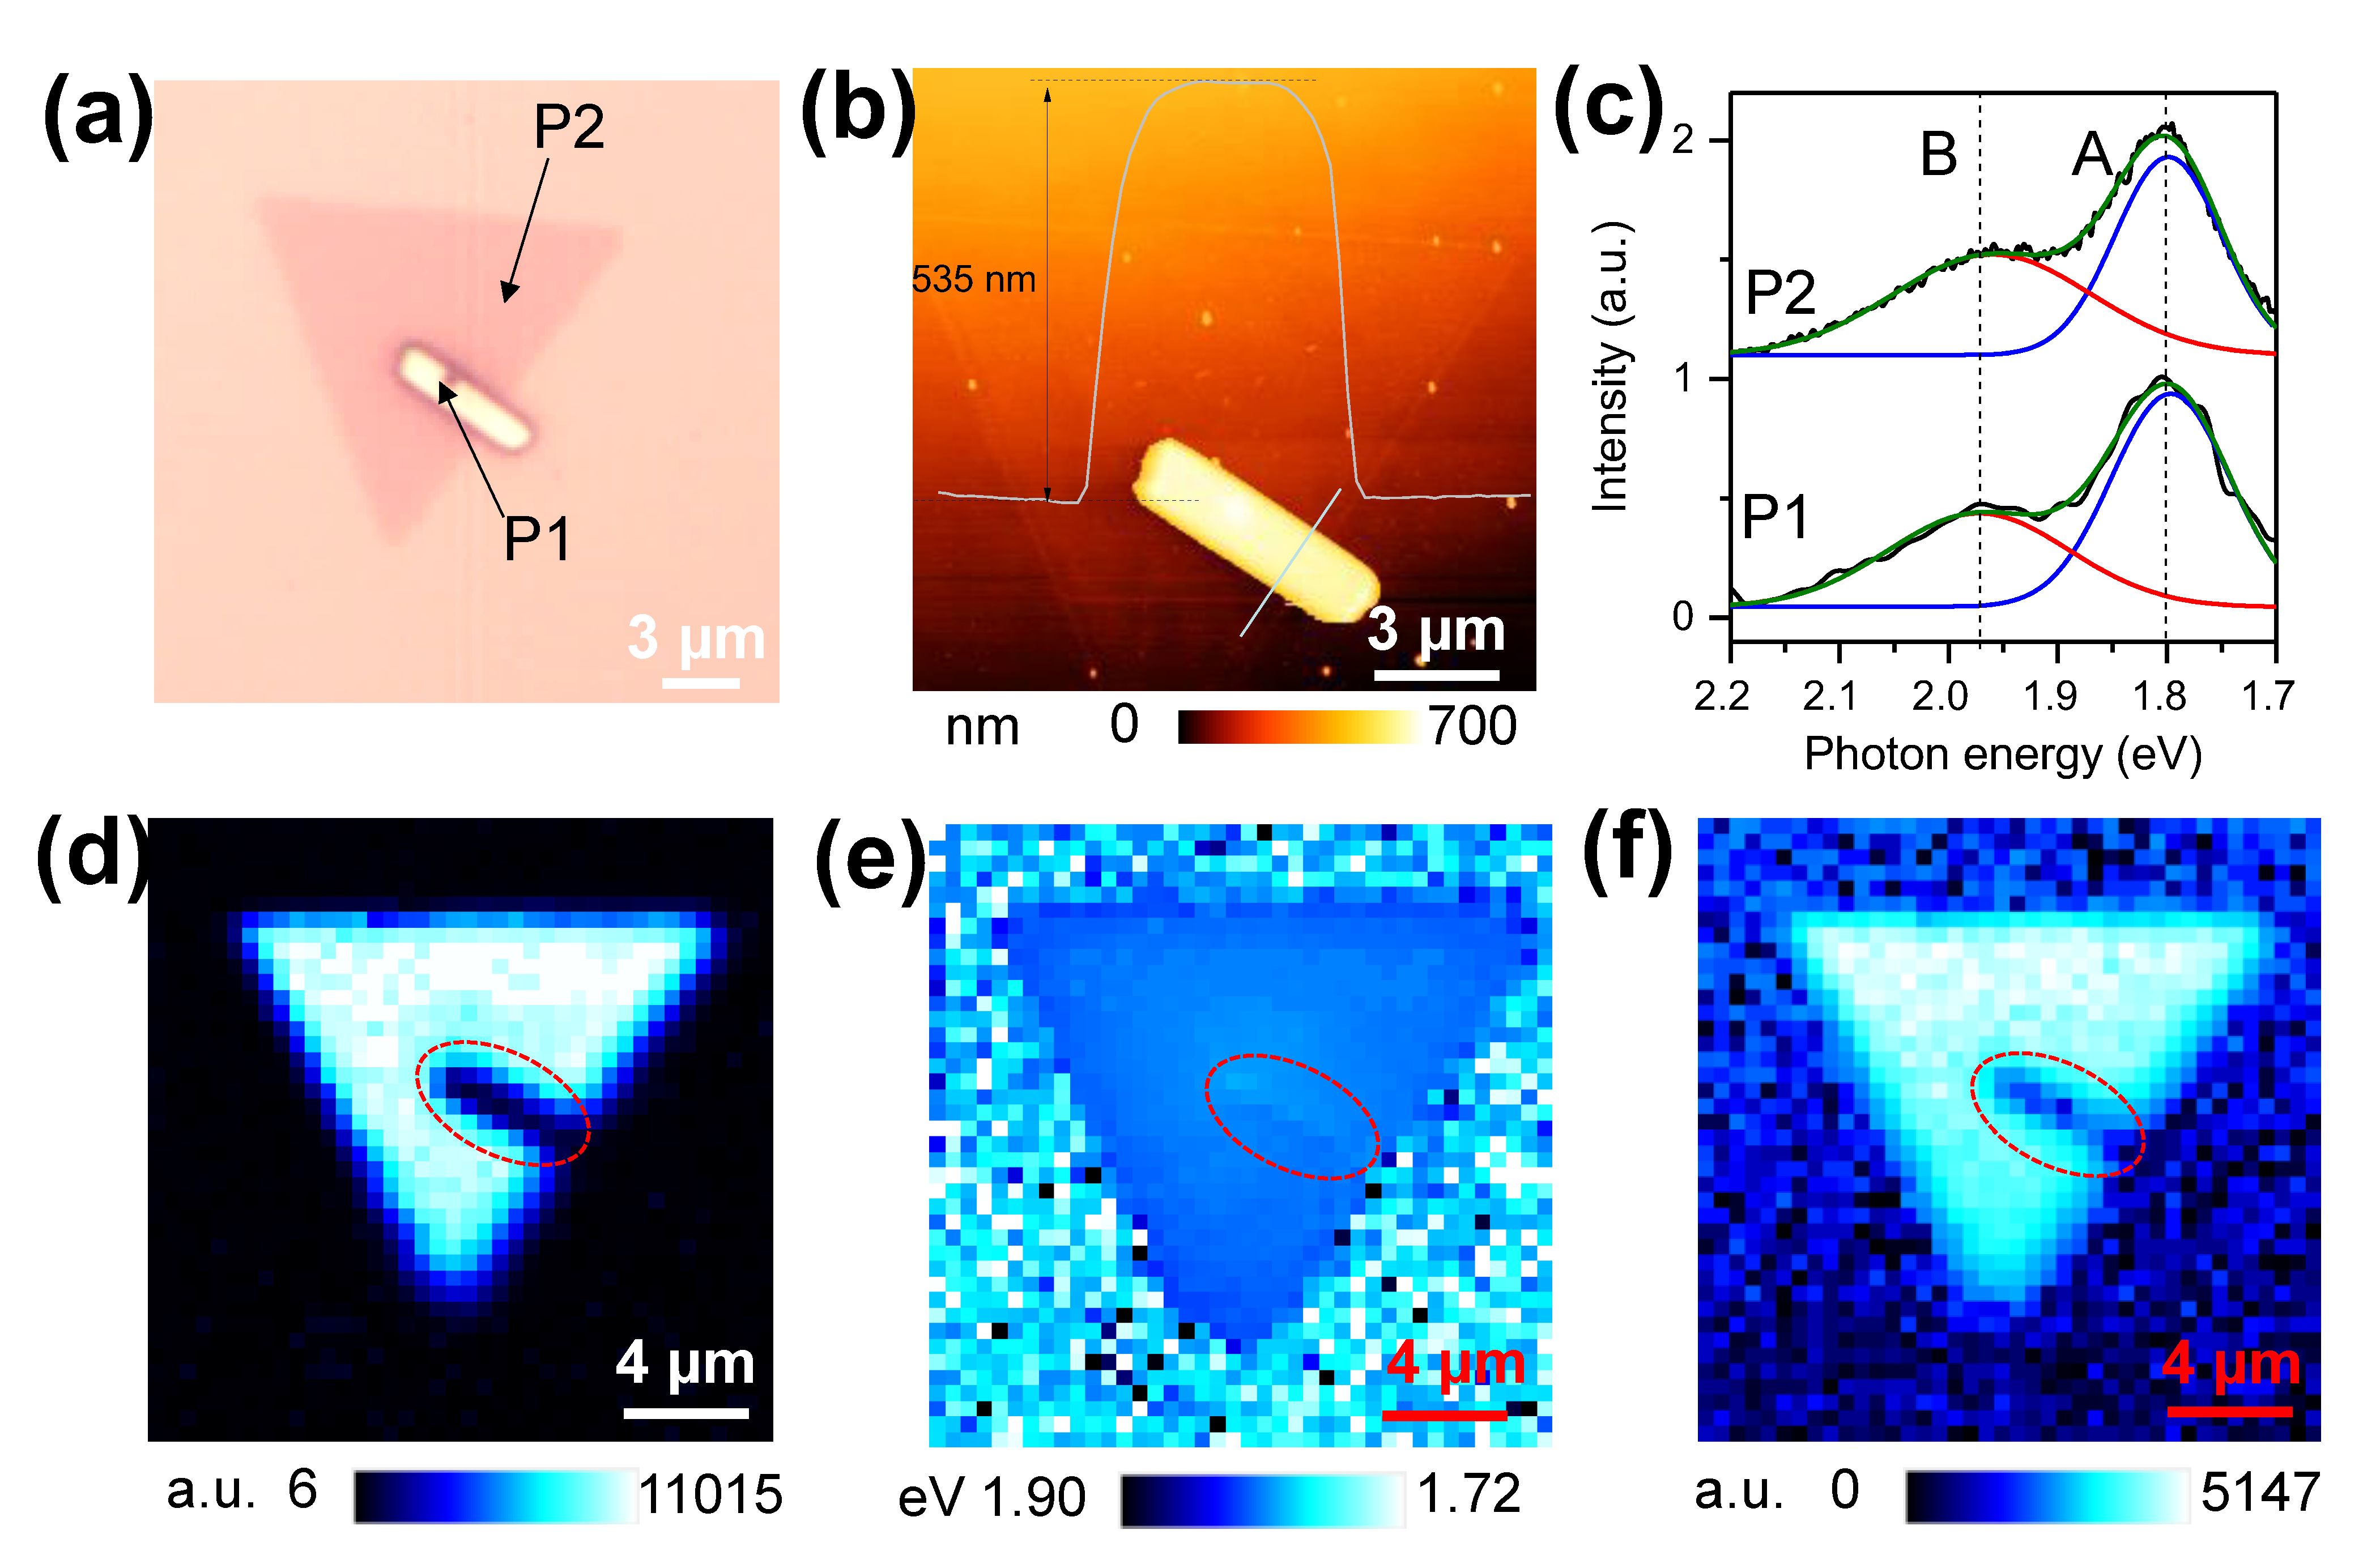
An optical image of a Sb2Se3/MoS2 HJ sample is presented in Figure 3a. The MoS2 triangular flake presents a light purple contrast, which is similar to those in a previous report [44]. A rhombic multilayer Sb2Se3 with bright contrast is placed in the center of this MoS2 flake. AFM topography image of this HJ is presented in Figure 3b. The thickness of the multilayer Sb2Se3 can be determined to be 535 nm by a height line profile across the flake (inset in Figure 3b). The Raman spectrum of a clean MoS2 area is plotted in Figure S4a. Prominent Raman peaks can be seen at 383.1, 403.3, and 449.7 cm−1, which can be assigned to be two first-order modes of E′ and A′, and a second-order mode 2LA(M), respectively [45]. The separation between the E′ and A′ modes, 20.2 cm−1, agrees with that of the CVD-prepared 1L-MoS2 [46], and indicate the 1L nature of the MoS2 flake in Figure 3a. Compared to the 1L-MoS2 area, the intensities of A′ and E′ peaks of MoS2 are too weak to be observed in the HJ area, indicating extremely strong optical absorption of the incident laser photons. The Raman spectra of the Sb2Se3 on the HJ are quite similar to those in Figure S1b and indicate the good quality of the transferred heterojunctions. On the PL spectra collected from 1L-MoS2 and the HJ area (Figure 3c), prominent PL peaks at ~1.97 and 1.80 eV can be assigned to B and A excitons, respectively, induced by spin-orbit splitting of the valence band [47]. Compared to that of 1L-MoS2, the A exciton redshifts by 3 meV. Further deconvolution using Gaussian functions indicates a negligible exciton energy shift of B excitons in the HJ area. These exciton features of 1L-MoS2 in the HJ area indicate charge depletion of 1L-MoS2.
The PL intensity and energy images of the HJ sample are shown in Figure 3d,e, respectively. The A exciton PL intensity and energy images of this 1L-MoS2 flake before transfer are presented in Figure S4b,c for comparison. At the junction area, the PL intensity of MoS2 is lowered by 90%, which can be attributed to the strong absorption of Sb2Se3. The shape of the PL lowered area (dashed ellipse) agrees well with the shape of the Sb2Se3 nanoflake. Meanwhile, the lowered PL area gives a brighter contrast area (dashed ellipse) with redshifted PL peak energy. This HJ area also gives lowered Raman intensity of MoS2, which is further shown by a Raman image presented in Figure 3f and agrees with the Raman spectra in Figure S4a.
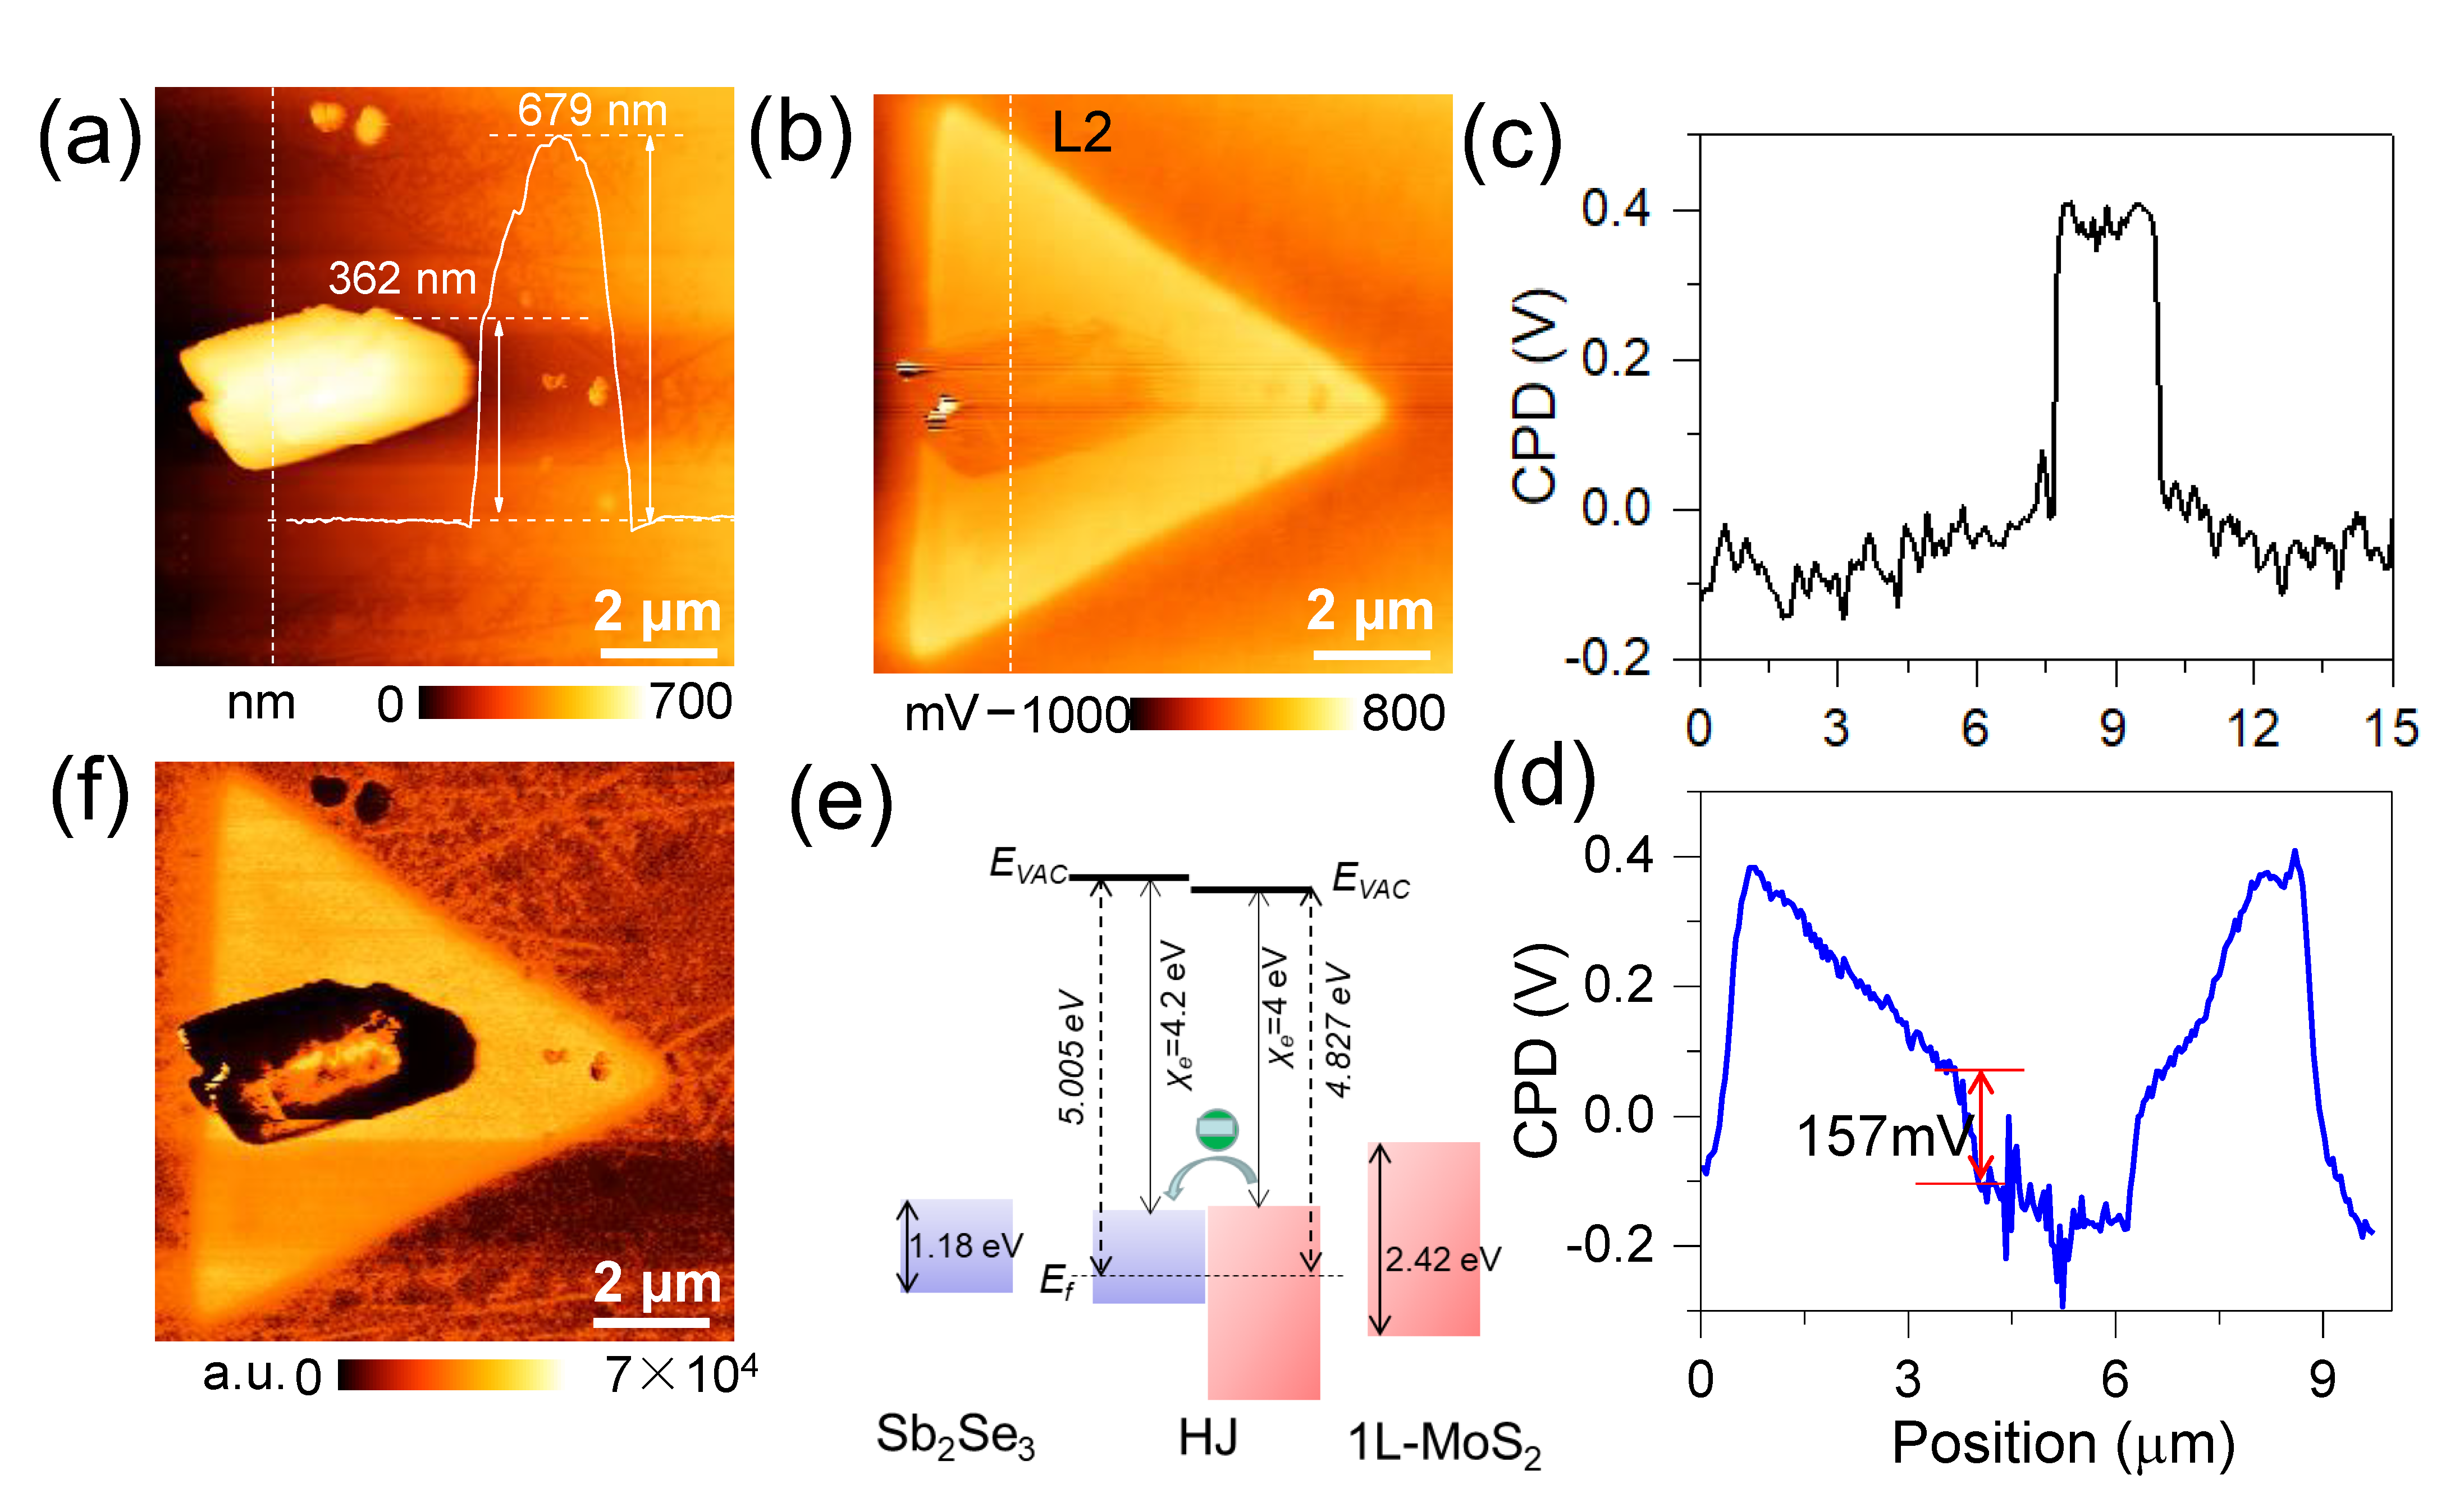
AFM topographic and CPD images of a Sb2Se3/1L-MoS2 HJ are presented in Figure 4a,b, respectively. This Sb2Se3 nanoflake exhibits a nonuniform thickness, which can be determined from the height profile along the dashed line. The flake thickness at the edge and the center is 362 and 679 nm, respectively. On the CPD image, lower contrast of Sb2Se3 flake indicates its lower CPD than that of the 1L-MoS2 area. In order to obtain the accurate CPD of 1L-MoS2, a CPD profile was taken along the dashed line in Figure S5b and is plotted in Figure 4c. The CPD of the 1L-MoS2 was measured to be 389 mV, corresponding to a Fermi level of 4.511 eV calculated by using Equation (1) and agreeing well with the value (4.47 eV) in the literature [48]. The CPD profile across the Sb2Se3/1L-MoS2 HJ is plotted in Figure 4d. At the junction edge, the CPD difference of 1L-MoS2 and Sb2Se3 is measured to be 157 mV.
Since the thickness of our Sb2Se3 flake is several hundreds of nanometers, the band gap is expected to be close to that of the bulk layer, which can be set to 1.18 eV [28]. The band gap of 1L-MoS2 can be set to be 2.42 eV using the B exciton energy of 1.98 eV and exciton binding energy of 0.44 eV [49]. The electron affinity of MoS2 and Sb2Se3 can be assumed to be 4 [50] and 4.2 eV [51], respectively. Therefore, the band alignment of the Sb2Se3/1L-MoS2 HJ can be plotted as a diagram in Figure 4e. The valence band difference ΔEVEV = Ev-MoS2Ev-Sb2Se3) and conduction band difference ΔEcEc = Ec-MoS2Ec-Sb2Se3) are calculated to be −0.043 eV and 1.197 eV, respectively. It can be immediately seen that Sb2Se3/1L-MoS2 HJ is a type-Ⅰ junction. Such band alignment results in the electron transport from 1L-MoS2 to Sb2Se3 nanoflake. The charge depletion of the 1L-MoS2 area is in good agreement with charge transfer from 1L-MoS2 to Sb2Se3 indicated by PL spectral measurements in Figure 3.
The capacitance image of the Sb2Se3/1L-MoS2 HJ is presented in Figure 4f. The capacitance is qualitatively proportional to the measured value. Brighter contrast in Figure 4f indicates larger capacitance. According to the definition of a planner capacitor, C = εS/d, where ε, S, and d are the dielectric constant, area of electrode, and the separation between two electrodes, respectively [52]. Given a constant electrode area and an ideal dielectric with no charging effect, the capacitance is in a reciprocal relationship with the thickness of the dielectric layer. The low thickness of 1L-MoS2 indicates the largest capacitance. It is expected that the Sb2Se3 nanoflake, in which the thickness is hundreds of nanometers, gives low contrast and small capacitance. However, the center area of the Sb2Se3 layer gives a much higher contrast than the edge area. This could be induced by the charge transfer effect, in which the injected electron accumulation changes the dielectric properties of Sb2Se3 flakes and changes the capacitance.
In summary, Sb2Se3/1L-MoS2 HJs were prepared by transferring Sb2Se3 nanoflakes to 1L-MoS2 deposited by the CVD method. PL spectra measured at the junction area indicate a charge transfer from 1L-MoS2 to Sb2Se3 flakes, which was further confirmed by an A exciton redshift indicated by PL imaging using A exciton intensity. KPFM measurement further indicates charge depletion and a band offset of 157 meV at the junction interface. Our study helps to understand the physical properties of 2D HJs using Sb2Se3 as an absorber layer. The obtained results would be instructive for the design of ultrathin novel optoelectronic devices such as solar cells and novel detectors.

Supplementary Materials

The following supporting information can be downloaded at: https://www.mdpi.com/article/10.3390/electronics11162574/s1, Figure S1: Optical image and Raman spectrum of Sb2Se3 flakes prepared by routine Ⅱ; Figure S2: individual Raman spectra and excitation time dependent Raman spectra of Sb2Se3 flakes; Figure S3: AFM topographic image of Sb2Se3 flake; Figure S4: Raman spectra of HJ and 1L-MoS2, PL mapping of the 1L-MoS2 flake before transfer; Figure S5: Optical and CPD image of 1L-MoS2.

Author Contributions

Conceptualization and supervision, W.S.; data curation, Y.W., F.C. and H.-W.L.; Writing, Y.W.; Funding acquisition, W.S. All authors have read and agreed to the published version of the manuscript.

Funding

This research was funded by Zhejiang Provincial Natural Science Foundation of China (Grant No. LZ22A040003), Natural Sciences Foundation of China (Grant No. 52027809, 52072272) and the Open Project Program of Guangdong Provincial Key Laboratory of Electronic Functional Materials and Devices, Huizhou University (Grant No. EFMD2021010M)

Data Availability Statement

The data used to support the findings of this study are included within the article.

Conflicts of Interest

The authors declare no conflict of interest.

References

  1. Yu, Y.; Hu, S.; Su, L.; Huang, L.; Liu, Y.; Jin, Z.; Purezky, A.A.; Geohegan, D.B.; Kim, K.W.; Zhang, Y. Equally efficient interlayer exciton relaxation and improved absorption in epitaxial and non-epitaxial MoS2/WS2 heterostructures. Nano Lett. 2015, 15, 486–491. [Google Scholar] [CrossRef] [PubMed]
  2. Furchi, M.M.; Pospischil, A.; Libisch, F.; Burgdörfer, J.; Mueller, T. Photovoltaic effect in an electrically tunable van der Waals heterojunction. Nano Lett. 2014, 14, 4785. [Google Scholar] [CrossRef] [PubMed]
  3. Lee, C.H.; Lee, G.H.; Zande, A.M.V.D.; Chen, W.; Li, Y.; Han, M.; Cui, X.; Arefe, G.; Nuckolls, C.; Heinz, T.F. Atomically thin p–n junctions with van der Waals heterointerfaces. Nat. Nanotechnol. 2014, 9, 676. [Google Scholar] [CrossRef] [PubMed]
  4. Hong, X.; Kim, J.; Shi, S.-F.; Zhang, Y.; Jin, C.; Sun, Y.; Tongay, S.; Wu, J.; Zhang, Y.; Wang, F. Ultrafast charge transfer in atomically thin MoS2/WS2 heterostructures. Nat. Nanotechnol. 2014, 9, 682. [Google Scholar] [CrossRef]
  5. Chen, F.; Su, W.; Ding, S.; Fu, L. The fabrication and tunable optical properties of 2D transition metal dichalcogenides heterostructures by adjusting the thickness of Mo/W films. Appl. Surf. Sci. 2020, 505, 144192. [Google Scholar] [CrossRef]
  6. Dean, C.R.; Young, A.F.; Meric, I.; Lee, C.; Wang, L.; Sorgenfrei, S.; Watanabe, K.; Taniguchi, T.; Kim, P.; Shepard, K.L. Boron nitride substrates for high-quality graphene electronics. Nat. Nanotechnol. 2010, 5, 722–726. [Google Scholar] [CrossRef]
  7. Baranowski, M.; Surrente, A.; Klopotowski, L.; Urban, J.; Plochocka, P. Probing the interlayer exciton physics in a MoS2/MoSe2/MoS2 van der Waals heterostructure. Nano Lett. 2018, 17, 6360. [Google Scholar] [CrossRef]
  8. Cao, L.; Zhong, J.; Yu, J.; Zeng, C.; Ding, J.; Cong, C.; Yue, X.; Liu, Z.; Liu, Y. Valley-polarized local excitons in WSe 2/WS2 vertical heterostructures. Opt. Express 2020, 28, 22135–22143. [Google Scholar] [CrossRef]
  9. Carozo, V.; Fujisawa, K.; Rao, R.; Kahn, E.; Cunha, J.R.; Zhang, T.; Rubin, D.; Salazar, M.F.; de Luna Bugallo, A.; Kar, S. Excitonic processes in atomically-thin MoSe2/MoS2 vertical heterostructures. 2d Mater. 2018, 5, 031016. [Google Scholar] [CrossRef]
  10. Ding, Y.; Zhou, N.; Gan, L.; Yan, X.; Wu, R.; Abidi, I.H.; Waleed, A.; Pan, J.; Ou, X.; Zhang, Q. Stacking-mode confined growth of 2H-MoTe2 /MoS2 bilayer heterostructures for UV-vis-IR photodetectors. Nano Energy 2018, 49, 200–208. [Google Scholar] [CrossRef]
  11. Fu, Q.; Wang, X.; Zhou, J.; Xia, J.; Zeng, Q.; Lv, D.; Zhu, C.; Wang, X.; Shen, Y.; Li, X. One-step synthesis of metal/semiconductor heterostructure NbS2/MoS2. Chem. Mater. 2018, 30, 4001–4007. [Google Scholar] [CrossRef]
  12. Gong, Y.; Lei, S.; Ye, G.; Li, B.; He, Y.; Keyshar, K.; Zhang, X.; Wang, Q.; Lou, J.; Liu, Z. Two-step growth of two-dimensional WSe2/MoSe2 heterostructures. Nano Lett. 2015, 15, 6135–6141. [Google Scholar] [CrossRef] [PubMed]
  13. Irisawa, T.; Okada, N.; Chang, W.-H.; Okada, M.; Mori, T.; Endo, T.; Miyata, Y. CVD grown bilayer WSe2/MoSe2 heterostructures for high performance tunnel transistors. Jpn. J. Appl. Phys. 2020, 59, SGGH05. [Google Scholar] [CrossRef]
  14. Li, F.; Feng, Y.; Li, Z.; Ma, C.; Qu, J.; Wu, X.; Li, D.; Zhang, X.; Yang, T.; He, Y. Rational kinetics control toward universal growth of 2D vertically stacked heterostructures. Adv. Mater. 2019, 31, 1901351. [Google Scholar] [CrossRef] [PubMed]
  15. Nikam, R.D.; Sonawane, P.A.; Sankar, R.; Chen, Y.-T. Epitaxial growth of vertically stacked p-MoS2/n-MoS2 heterostructures by chemical vapor deposition for light emitting devices. Nano Energy 2017, 32, 454–462. [Google Scholar] [CrossRef]
  16. Vidal-Fuentes, P.; Guc, M.; Alcobe, X.; Jawhari, T.; Placidi, M.; Pérez-Rodríguez, A.; Saucedo, E.; Roca, V.I. Multiwavelength excitation Raman scattering study of Sb2 Se3 compound: Fundamental vibrational properties and secondary phases detection. 2d Mater. 2019, 6, 045054. [Google Scholar] [CrossRef]
  17. Wan, Y.; Huang, J.-K.; Chuu, C.-P.; Hsu, W.-T.; Lee, C.-J.; Aljarb, A.; Huang, C.-W.; Chiu, M.-H.; Tang, H.-L.; Lin, C. Strain-directed layer-by-layer epitaxy toward van der Waals homo-and heterostructures. ACS Mater. Lett. 2021, 3, 442–453. [Google Scholar] [CrossRef]
  18. Wu, X.; Wang, X.; Li, H.; Zeng, Z.; Zheng, B.; Zhang, D.; Li, F.; Zhu, X.; Jiang, Y.; Pan, A. Vapor growth of WSe2/WS2 heterostructures with stacking dependent optical properties. Nano Res. 2019, 12, 3123–3128. [Google Scholar] [CrossRef]
  19. Xia, J.; Yan, J.; Wang, Z.; He, Y.; Gong, Y.; Chen, W.; Sum, T.C.; Liu, Z.; Ajayan, P.M.; Shen, Z. Strong coupling and pressure engineering in WSe2–MoSe2 heterobilayers. Nat. Phys. 2021, 17, 92–98. [Google Scholar] [CrossRef]
  20. Yuan, J.; Sun, T.; Hu, Z.; Yu, W.; Ma, W.; Zhang, K.; Sun, B.; Lau, S.P.; Bao, Q.; Lin, S. Wafer-scale fabrication of two-dimensional PtS2/PtSe2 heterojunctions for efficient and broad band photodetection. ACS Appl. Mater. Interfaces 2018, 10, 40614–40622. [Google Scholar] [CrossRef]
  21. Yuan, L.; Zheng, B.; Kunstmann, J.; Brumme, T.; Kuc, A.B.; Ma, C.; Deng, S.; Blach, D.; Pan, A.; Huang, L. Twist-angle-dependent interlayer exciton diffusion in WS2–WSe2 heterobilayers. Nat. Mater. 2020, 19, 617–623. [Google Scholar] [CrossRef] [PubMed]
  22. Zhai, X.; Xu, X.; Peng, J.; Jing, F.; Zhang, Q.; Liu, H.; Hu, Z. Enhanced optoelectronic performance of CVD-grown metal–semiconductor NiTe2/MoS2 heterostructures. ACS Appl. Mater. Interfaces 2020, 12, 24093–24101. [Google Scholar] [CrossRef] [PubMed]
  23. Zhang, C.; Chuu, C.-P.; Ren, X.; Li, M.-Y.; Li, L.-J.; Jin, C.; Chou, M.-Y.; Shih, C.-K. Interlayer couplings, Moiré patterns, and 2D electronic superlattices in MoS2/WSe2 hetero-bilayers. Sci. Adv. 2017, 3, e1601459. [Google Scholar] [CrossRef] [PubMed]
  24. Zhang, P.; Bian, C.; Ye, J.; Cheng, N.; Wang, X.; Jiang, H.; Wei, Y.; Zhang, Y.; Du, Y.; Bao, L. Epitaxial growth of metal-semiconductor van der Waals heterostructures NbS2/MoS2 with enhanced performance of transistors and photodetectors. Sci. China Mater. 2020, 63, 1548–1559. [Google Scholar] [CrossRef]
  25. Zhang, X.; Xiao, S.; Nan, H.; Mo, H.; Wan, X.; Gu, X.; Ostrikov, K.K. Controllable one-step growth of bilayer MoS2–WS2/WS2 heterostructures by chemical vapor deposition. Nanotechnology 2018, 29, 455707. [Google Scholar] [CrossRef] [PubMed]
  26. Zhou, J.; Kong, X.; Sekhar, M.C.; Lin, J.; Le Goualher, F.; Xu, R.; Wang, X.; Chen, Y.; Zhou, Y.; Zhu, C. Epitaxial synthesis of monolayer PtSe2 single crystal on MoSe2 with strong interlayer coupling. ACS Nano 2019, 13, 10929–10938. [Google Scholar] [CrossRef]
  27. Miller, B.; Steinhoff, A.; Pano, B.; Klein, J.; Jahnke, F.; Holleitner, A.; Wurstbauer, U. Long-lived direct and indirect interlayer excitons in van der Waals heterostructures. Nano Lett. 2017, 17, 5229–5237. [Google Scholar] [CrossRef]
  28. Birkett, M.; Linhart, W.M.; Stoner, J.; Phillips, L.J.; Durose, K.; Alaria, J.; Major, J.D.; Kudrawiec, R.; Veal, T.D. Band gap temperature-dependence of close-space sublimation grown Sb2Se3 by photo-reflectance. APL Mater. 2018, 6, 084901. [Google Scholar] [CrossRef]
  29. Chen, C.; Bobela, D.C.; Yang, Y.; Lu, S.; Zeng, K.; Ge, C.; Yang, B.; Gao, L.; Zhao, Y.; Beard, M.C.; et al. Characterization of basic physical properties of Sb2Se3 and its relevance for photovoltaics. Front. Optoelectron. 2017, 10, 18–30. [Google Scholar] [CrossRef]
  30. Chen, S.; Ishaq, M.; Xiong, W.; Ali Shah, U.; Farooq, U.; Luo, J.; Zheng, Z.; Su, Z.; Fan, P.; Zhang, X.; et al. Improved open-circuit voltage of Sb2Se3 thin-film solar cells via interfacial sulfur diffusion-induced gradient bandgap engineering. Solar RRL 2021, 5, 2100419. [Google Scholar] [CrossRef]
  31. Guo, L.; Zhang, B.; Li, S.; Montgomery, A.; Li, L.; Xing, G.; Zhang, Q.; Qian, X.; Yan, F. Interfacial engineering of oxygenated chemical bath–deposited CdS window layer for highly efficient Sb2Se3 thin-film solar cells. Mater. Today Phys. 2019, 10, 100125. [Google Scholar] [CrossRef]
  32. Li, G.; Li, Z.; Liang, X.; Guo, C.; Shen, K.; Mai, Y. Improvement in Sb2Se3 solar cell efficiency through band alignment engineering at the buffer/absorber interface. ACS Appl. Mater. Interfaces 2019, 11, 828–834. [Google Scholar] [CrossRef] [PubMed]
  33. Wang, L.; Li, D.-B.; Li, K.; Chen, C.; Deng, H.-X.; Gao, L.; Zhao, Y.; Jiang, F.; Li, L.; Huang, F.; et al. STable 6%-efficient Sb2Se3 solar cells with a ZnO buffer layer. Nat. Energy 2017, 2, 17046. [Google Scholar] [CrossRef]
  34. Chen, C.; Zhao, Y.; Lu, S.; Li, K.; Li, Y.; Yang, B.; Chen, W.; Wang, L.; Li, D.; Deng, H.; et al. Accelerated optimization of TiO2/Sb2Se3 thinfilm solar cells by high-throughput combinatorial approach. Adv. Energy Mater. 2017, 7, 1700866. [Google Scholar] [CrossRef]
  35. Wang, J.; Rehman, S.U.; Xu, Y.; Zuo, B.; Cheng, H.; Guo, L.; Zou, B.; Zhang, X.; Li, C. Two-dimensional antimony selenide (Sb2Se3) nanosheets prepared by hydrothermal method for visible-light photodetectors. Sol. Energy 2022, 233, 213–220. [Google Scholar] [CrossRef]
  36. Song, H.; Li, T.; Zhang, J.; Zhou, Y.; Luo, J.; Chen, C.; Yang, B.; Ge, C.; Wu, Y.; Tang, J. Highly anisotropic Sb2Se3 nanosheets: Gentle exfoliation from the bulk precursors possessing 1D crystal structure. Adv. Mater. 2017, 29, 1700441. [Google Scholar] [CrossRef]
  37. Zhao, M.; Su, J.; Zhao, Y.; Luo, P.; Wang, F.; Han, W.; Li, Y.; Zu, X.; Qiao, L.; Zhai, T. Sodium-mediated epitaxial growth of 2D ultrathin Sb2Se3 flakes for broadband photodetection. Adv. Funct. Mater. 2020, 30, 1909849. [Google Scholar] [CrossRef]
  38. Sun, G.; Li, B.; Li, J.; Zhang, Z.; Ma, H.; Chen, P.; Zhao, B.; Wu, R.; Dang, W.; Yang, X.; et al. Direct van der Waals epitaxial growth of 1D/2D Sb2Se3/WS2 mixed-dimensional p-n heterojunctions. Nano Res. 2019, 12, 1139–1145. [Google Scholar] [CrossRef]
  39. Valdman, L.; Wen, X.; Lu, Z.; Chen, X.; Hiebel, F.; Zhang, L.; Kisslinger, K.; Tao, Y.; Washington, M.; Lu, T.-M.; et al. Surface and interface structures of epitaxial Sb2Se3 on mica. Appl. Surf. Sci. 2021, 567, 150859. [Google Scholar] [CrossRef]
  40. Shongalova, A.; Correia, M.R.; Vermang, B.; Cunha, J.M.V.; Salomé, P.M.P.; Fernandes, P.A. On the identification of Sb2Se3 using Raman scattering. MRS Commun. 2018, 8, 865–870. [Google Scholar] [CrossRef]
  41. Han, W.; Huang, P.; Li, L.; Wang, F.; Zhai, T. Two-dimensional inorganic molecular crystals. Nat. Commun. 2019, 10, 4728. [Google Scholar] [CrossRef] [PubMed]
  42. Smithe, K.K.H.; Krayev, A.V.; Bailey, C.S.; Lee, H.R.; Yalon, E.; Aslan, Ö.B.; Muñoz Rojo, M.; Krylyuk, S.; Taheri, P.; Davydov, A.V.; et al. Nanoscale heterogeneities in monolayer MoSe2 revealed by correlated scanning probe microscopy and tip-enhanced Raman spectroscopy. ACS Appl. Nano Mater. 2018, 1, 572–579. [Google Scholar] [CrossRef]
  43. Mamta; Maurya, K.K.; Singh, V.N. Enhancing the performance of an Sb2Se3-based solar cell by dual buffer layer. Sustainability 2021, 13, 12320. [Google Scholar] [CrossRef]
  44. Su, W.; Jin, L.; Qu, X.; Huo, D.; Yang, L. Defect passivation induced strong photoluminescence enhancement of rhombic monolayer MoS2. Phys. Chem. Chem. Phys. 2016, 18, 14001–14006. [Google Scholar] [CrossRef]
  45. Molina-Sanchez, A.; Wirtz, L. Phonons in single-layer and few-layer MoS2 and WS2. Phys. Rev. B 2011, 84, 155413. [Google Scholar] [CrossRef]
  46. Li, F.; Yan, Y.; Han, B.; Li, L.; Huang, X.; Yao, M.; Gong, Y.; Jin, X.; Liu, B.; Zhu, C.; et al. Pressure confinement effect in MoS2 monolayers. Nanoscale 2015, 7, 9075–9082. [Google Scholar] [CrossRef] [PubMed]
  47. Mak, K.F.; Lee, C.; Hone, J.; Shan, J.; Heinz, T.F. Atomically thin moS2: A new direct-gap semiconductor. Phys. Rev. Lett. 2010, 105, 136805. [Google Scholar] [CrossRef]
  48. Lee, S.Y.; Kim, U.J.; Chung, J.; Nam, H.; Jeong, H.Y.; Han, G.H.; Kim, H.; Oh, H.M.; Lee, H.; Kim, H.; et al. Large work function modulation of monolayer MoS2 by ambient gases. ACS Nano 2016, 10, 6100–6107. [Google Scholar] [CrossRef]
  49. Hill, H.M.; Rigosi, A.F.; Roquelet, C.; Chernikov, A.; Berkelbach, T.C.; Reichman, D.R.; Hybertsen, M.S.; Brus, L.E.; Heinz, T.F. Observation of excitonic Rydberg states in monolayer MoS2 and WS2 by photoluminescence excitation spectroscopy. Nano Lett. 2015, 15, 2992–2997. [Google Scholar] [CrossRef]
  50. Tosun, M.; Fu, D.; Desai, S.B.; Ko, C.; Seuk Kang, J.; Lien, D.-H.; Najmzadeh, M.; Tongay, S.; Wu, J.; Javey, A. MoS2 heterojunctions by thickness modulation. Sci. Rep. 2015, 5, 10990. [Google Scholar] [CrossRef]
  51. Cao, Y.; Zhu, X.-Y.; Chen, H.-B.; Wang, C.-G.; Zhang, X.-T.; Hou, B.-D.; Shen, M.-R.; Zhou, J. Simulation and optimal design of antimony selenide thin film solar cells. Acta Phys. Sin. 2018, 67, 247301. [Google Scholar] [CrossRef]
  52. Su, W.; Kumar, N.; Shu, H.; Lancry, O.; Chaigneau, M. In situ visualization of optoelectronic behavior of grain boundaries in monolayer WSe2 at the nanoscale. J. Phys. Chem. C 2021, 125, 26883–26891. [Google Scholar] [CrossRef]
Figure 1. Schematic of the preparation of Sb2Se3/1L-MoS2 HJ samples.
Electronics 11 02574 g001
Figure 2. (a) Optical image of a Sb2Se3 flakes prepared on mica substrate. (b) AFM topography image of a Sb2Se3 nanoflake. Height profile along the white dashed line is plotted as an inset. (c) SEM image of a Sb2Se3 nanoflake transferred to Au coated substrate. (d) Raman spectra of Sb2Se3 nanoflakes measured using 532, 632.8, and 785 nm lasers at 3.5, 2.4, and 35 μW. The Raman peak at ~200 cm−1 was deconvoluted into the Ag peak of Sb2Se3 and the mica peak (M) using two Lorentzian functions. (e) Excitation time-dependent Raman spectra of a Sb2Se3 nanoflake. Excitation laser wavelength 532 nm; laser power 34 μW. (f) I-V curve of a Sb2Se3 nanoflake transferred to Au-coated substrate with and without a laser (532 nm). (g) CPD image of a Sb2Se3 nanoflake; the CPD profiles along the black and blue lines are plotted as insets. (h) Capacitance image of the Sb2Se3 nanoflake in (g).
Electronics 11 02574 g002
Figure 3. (a) Optical and (b) AFM topography images of a Sb2Se3/MoS2 HJ on SiO2/Si substrate; a height profile collected along the marked line in (b) is plotted as an inset. (c) PL spectra collected on the HJ (P1) and 1L-MoS2(P2) areas marked in (a); in (c), fitting using B and A excitons gives very good fitting results. (d) PL intensity of A exciton. (e) PL peak position of A exciton and (f) Raman A′ peak intensity of the sample in (a). In (df), laser: 532 nm, laser power: 34 μW, exposure time: 1 s, 40 × 40 pixels.
Electronics 11 02574 g003
Figure 4. (a) AFM topography and (b) CPD images of a Sb2Se3/1L-MoS2 HJ. Height profile across the Sb2Se3 flake is plotted as an inset in (a). CPD profile along dashed line L1 (c) in Figure S5b and L2 (d) in (b). (e) Band alignment diagram of the Sb2Se3/MoS2 HJ. EVC is the vacuum energy level. (f) capacitance image of the HJ in (b).
Electronics 11 02574 g004
Publisher’s Note: MDPI stays neutral with regard to jurisdictional claims in published maps and institutional affiliations.