Abstract
The wireless body area network (WBAN) can monitor human physiological information for a long time and alleviate problems such as the imbalance of medical resources distribution and population aging. The complex human media may make data transmission unstable in wireless body area networks. A delay-tolerant WBAN opportunity transmission method based on human data priority was studied. In this method, the historical states between links are recorded by a sliding window. Then, the link stability is measured by a prediction function. At the same time, considering the heterogeneity of the data in the body area network, transmission priority is assigned to different health data. Combined with residual energy, link stability, and distance, the transmission cost of the candidate set is calculated, and the node with the lowest expected transmission cost is selected as the next hop to improve the reliability of data transmission. The experimental results showed that this method includes the characteristics of opportunity routing and WBAN to transmit health data with lower delay and higher efficiency than previous methods.
1. Introduction
There are many problems in rural medical services, such as insufficient funds, shortage of medical facilities, and unbalanced allocation of resources. More than half of the rural elderly in China suffer from chronic diseases and other complications. It is difficult for them to obtain the necessary long-term care services [1]. According to two surveys in 2015, the rural population accounts for more than half of China total population, but only 33% of the total medical resources are allocated to rural areas [2].
Unbalanced rural medical resources and population aging have promoted research on intelligent health care [3]. A system that can continuously monitor the health of the rural elderly and share information with remote doctors or hospitals is of great significance to promote livable villages [4]. The Wireless Body Area Network (WBAN) is a wireless sensor network (WSN) technology. It is composed of interconnected, low-power, intelligent and miniaturized sensors, which transmit health data (temperature, arterial pressure, electroencephalogram signals, etc.) through the wireless medium in or on the human body [5].
The number of nodes in a WBAN is usually small, and the connectivity of transmission links is affected by human posture. Most nodes are powered by microbatteries and have limited energy [6,7]. If a node runs out of energy early, it will affect the network connection and eventually shorten the network lifetime. Compared with a traditional WSN, the signal transmission attenuation in the WBAN is faster. The human tissues increase the signal path loss, and the energy consumption of the WBAN is higher than that of other networks of the same scale. Battery replacement and charging are not feasible in implanted medical devices and will cause the loss of monitoring data. Therefore, each node must work long with limited energy [8]. Routing algorithms play an important role in improving communication efficiency and prolonging the WBAN lifetime.
Compared with those of the cities, the rural medical resources are less, and the rural elderly work more and lack adequate medical services. In addition, the loss of wireless signals in rural areas is greater. In this paper, we studied the application of the WBAN to monitor the health of the rural elderly. We introduced a delay-tolerant network to establish a time-varying prediction model of link connection probability. This delay-tolerant network takes into account both energy efficiency and data transmission efficiency and avoids multiple data retransmission by predicting the link connectivity probability. The data transmission probability was improved on the basis of reducing unnecessary energy consumption. According to factors such as link stability, residual energy and transmission distance, we constructed a transmission cost function based on data priority to transmit the elderly health data reliably.
2. Related Works
To accommodate dynamic link change and signal attenuation, many methods used multi-hop to transmit data. Takizawa et al. established a signal loss model when the medium is the human body under five bandwidths [9]. In ref. [10], the finite difference time domain method was used to model the WBAN channel, and the statistical parameters of path loss in relation to seven different movements were obtained. Yan et al. defined the minimum energy consumption path in the WBAN by considering factors such as residual energy, node importance and energy difference and designed an optimal WBAN energy consumption routing protocol based on an artificial bee colony [11]. Anwar et al. proposed an energy-aware efficient routing method for WBAN links [12]. Taking the energy efficiency as the core, the calculation model of the transmission cost was derived. Based on the energy-aware routing mechanism, the next hop routing model was established. A path cost function considering the residual energy was constructed in ref. [13], considering the number of hops and the transmission distance to select the next hop in the WBAN. In ref. [14], the roles of relay node and sensing node can be interchanged, so that all sensors have the opportunity to become relay nodes. This method reduced the energy consumption, prolonged the network lifetime and improved the WBAN reliability. Qureshi et al. proposed an energy-aware routing protocol to minimize energy utilization and select a next hop by evaluating the link quality [15]. This protocol evaluated energy levels, link quality, and residual energy to balance loads, minimized energy utilization, and enhanced data transmission. Smail et al. built an objective model to select efficient paths with stable links, and a fuzzy logic system was used to determine the link stability [16].
Banuselvasaraswathy et al. studied an Optimum Path Optimum Temperature (OPOT) Routing Protocol [17] that allows sending critical data first when the sensed temperature exceeds the threshold. Some studies also introduced a delay-tolerant network (DTN) into the WBAN to improve the network reliability based on link connection information [18,19,20,21]. Behavior-aware probabilistic routing used probability to measure the historical connection between nodes. An inertial sensor was used to quantify the instantaneous connection status of the sensors. When the node was in violent motion, the next hop judged by the instantaneous sensor node accounted for a more significant proportion. When the node was in stable motion, the proportion of the next hop judged by historical link connection status was larger [21]. Hassanpour et al. regarded the routes in the WBAN as chromosomes, the nodes as genes, and the adaptive values as the availability values of links [22]. After several crossovers and mutations, the path with relatively high reliability can be found. However, the time complexity of the genetic algorithm is relatively high, causing a large consumption of energy. In ref. [23], body posture’s influence on various multi-hop transmission methods was analyzed, and a delay-tolerant network was used to design a WBAN transmission strategy. The authors proposed a new improved method for delay-tolerant networks, with better reliability than previous similar data transmission methods.
Because the opportunistic routing protocol is effective in ensuring a stable transmission, Bangotra et al. constructed an opportunistic transmission model for the WBAN based on Bayesian probability [24]. In addition, the latest opportunistic transmission method based on maximum/minimum range is discussed in ref. [25]. However, the design of an opportunistic transmission protocol for a delay-tolerant WBAN was rarely considered in the published studies. Based on the link history, data importance and characteristics of delay-tolerant networks, a transmission protocol for the elderly’s WBAN was designed. This new protocol provides a scheme for realizing the hierarchical transmission of health data and improving the network reliability.
3. Wireless Body Area Network Model
Sensors are responsible for sensing physiological parameters related to important portions of the human body and send the collected information to the sink directly or through a forwarding node. Compared with ordinary sensor nodes with limited energy, in order to better aggregate the data and process algorithms, the energy of the sink is considered to be almost unlimited. Let the WBAN consists of N sensor nodes and a sink. It is represented by a directed graph G = (V, E). E is the set of all links. Edge eij ∈ E exists if, and only if, node vi and vj can communicate directly. The sensors and sink will not move in a short time after deployment. The initial energy of all sensors is the same. The parameters are shown in Table 1.

Table 1.
Basic symbols.
A common WBAN is shown in Figure 1. A health-monitoring network for the elderly with n = 5 is shown in Figure 1. The sink is placed at the waist and collects all sensed data. The other five sensors are placed on the heart, stomach, left knee, right knee and armpit.
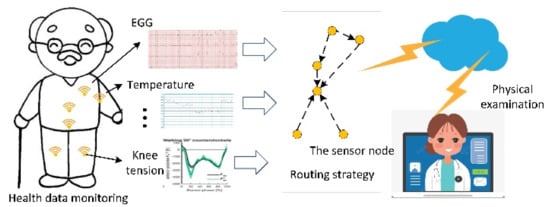
Figure 1.
Schematic diagram of the health-monitoring network for the elderly.
The importance of different physiological data collected in a WBAN varies. As shown in Table 2, we classified the sensing data into three groups: emergency data, important data, and periodic data. Among them, emergency data are related to life safety and are usually beyond the normal threshold. They need to be transmitted to the sink in a fast and reliable way, with the highest priority. Important data such as EGG have the second priority, while periodic data such as body temperature have the lowest priority.
Table 2.
Data priority.
(1) Energy consumption model
In a WBAN, each node consumes energy in data sensing, transmission, and processing. Among these processes, data transmission consumes the most energy; in this case, energy consumption mainly includes sending consumption and receiving consumption. The sending consumption ETX includes the energy consumption ETXelec produced by the transmitter and the energy consumption produced by the amplifier. The receiving energy consumption ERX is recorded as the energy consumption ERXelec generated by the receiver. Assuming that the sensor transmits k-bit data in a communication process, the total energy consumption ET, total sending energy consumption ETX and total receiving energy consumption ERX can be calculated by the following Equations:
Since the network on the human body is quasi-dynamic, the signal will not only be affected by the change of human posture, but also be disturbed by various electromagnetic waves in the environment, so the path loss coefficient cij is usually larger than in other situations.
(2) Prediction of the link connectivity probability
Probabilistic routing predicts the probability of link connectivity according to the transmission history and connection history. After the t-th interval, pijt can be dynamically updated as follows:
If the link is connected, pijt increases at a rate determined by the constant w (0 ≤ w ≤ 1). If the links are frequently connected in history, pijt will gradually reach its maximum value of 1. If the link is rarely connected in history, pijt gradually becomes 0. Therefore, for a given w, pijt can approximately reflect the connected state of link eij at time t. Ideally, w should be variable. For a good link in the past (maintaining a stable connection for a long time), pijt should grow very fast and decrease very slowly; for a bad link in the past, pijt should grow very slowly and decrease very quickly. This means that w should be able to capture the long-term history information of the link. Equation (5) defines the historical connection quality of link eij at time t [21]:
If the link is connected within time r, then Lijr is 1; otherwise, it is 0. We used a sliding time window to record the link state. Twindow represents a measurement window through which the average connection quality can be obtained. The parameter wijt represents the quality of the link connection during the last Twindow. The link stability is calculated by the link state within the Twindow before the current time t. The better the link quality, the larger is wijt. The worse the link quality, the smaller is wijt. Studies have shown that Twindow is reasonable between 7 s and 14 s [18,21].
In Equation (5), the historical connection quality is obtained by calculating the average value, but this method does not consider the variation trend of the error. The link evaluation index is designed as follows:
Equation (6) includes the weighted average of the overall link quality during the observation period and the weighted average of the change in link quality. α indicates that the longer the time from the current time, the smaller the impact of link quality on the final evaluation.
(3) Evaluation of link stability
Most of the rural elderly are still engaged in agricultural production as laborers. In a WBAN, the transmission channel changes with the actions performed. Therefore, we designed the following evaluation model as follows:
Since Twindow is the total number of observation windows and is between 0 and 1, it can be seen that LCSi ≤ le−1. The larger the entropy, the more chaotic the system is, which means that the dynamic channel has poor stability.
4. Opportunistic Routing Protocol for a WBAN Based on a Time-Varying Link
By predicting the connection probability, reliable links can be selected to establish a network topology. However, in a WBAN, the channel will change dramatically with the change of human posture and environment. Many studies showed that the one-hop star topology cannot meet the reliability requirements of WBANs in a time-varying environment. It is necessary to design an efficient routing algorithm to realize a reliable and energy efficient data transmission. For the opportunistic routing, when the network link is in a good state, the nodes consume more energy because they need to transmit information to multiple candidate nodes. When the link connectivity is unstable, opportunistic routing can ensure a more stable transmission and reduce the energy consumption by reducing the number of data retransmissions. Therefore, we should avoid selecting too many candidate nodes to reduce the transmission energy consumption; however, with too few candidate nodes, it will be difficult to ensure transmission stability. To comprehensively optimize energy efficiency and reliability, we studied a WBAN opportunistic routing protocol based on probabilistic link prediction and link interaction.
4.1. Expected Anycast Transmission Cost
The transmission probability between vi and vj is calculated according to Equation (4). In the candidate set of vi, the probabilities of each candidate node receiving data packets are independent of each other, so the probability of vi successfully transmitting data is:
The expected transmission time of one anycast transmission between vi and the candidate set Cai can be calculated by the following:
It can be seen from the above that the priority of monitoring data is different. For emergency data, it should be ensured that they reach the sink as soon as possible. The energy in the WBAN is limited. If all nodes choose the routing with the minimum expected transmission time, energy consumption may be too fast and uneven, resulting in a sharp decline in the network performance. Therefore, for periodic data with low real-time requirements, the residual energy should be considered when selecting the next hop:
4.2. Expected Transmission Cost of the Remaining Opportunistic Routing
The reliable one-hop path does not guarantee the overall routing reliability. Taking into account the interaction between the links, the transmission of the WBAN is divided into anycast routing and remaining opportunistic routing. In the opportunistic routing, when receiving a packet, the node with the highest priority will forward the data first, otherwise the candidate node with the second priority will forward it. That is, if node vj forwards the packet, all candidate nodes with higher priority have failed to receive it. Taking periodic data as an example, when the candidate set Cai of node vi forwards packets to the destination node, the required expected transmission energy efficiency is:
According to Equation (10), for periodic data, the influence of their residual energy on the network energy balance is considered when selecting the next hop. However, for emergency data, try to choose a transmission path with a small expected number of transmissions and transmit the data to the sink as soon as possible. For important data, both energy loss and link reliability are considered.
4.3. Opportunistic Routing Algorithm for the WBAN
When selecting candidate nodes, the neighbor nodes that can minimize the expected transmission cost between node vi and sink constitute the optimal candidate set of vi. Namely:
where Nei is the set of neighbor nodes of vi. Since the objective function is composed of multiple nodes, we designed the following candidate set construction algorithm (Algorithm 1). On the basis of the Bellman–Ford algorithm, queue optimization was added to reduce redundant slack operations. This is an efficient shortest path algorithm that finds the shortest path from a source vertex to all other vertices. Use the array to record the estimated value of the minimum transmission cost for each vertex.
| Algorithm 1. Candidate Set Construction Algorithm |
| Input: Node number N, node location (xi,yi) and initial transmission probability pij0 |
| Output: Candidate set |
| 1. S = ø; S0 = ø; Dlsink = 0; Dli0 = +∞, 1 ≤ i ≤ N; A = {sink}, B = ø, h = 1; |
| 2. for all vi ∈ V, do |
| 3. for all ne ∈ Ne(vi) do |
| 4. if ETX (ne, sink) < ETX (vi, sink), then |
| 5. S0i = S0i ∪ ne; |
| 6. end if |
| 7. end for |
| 8. end for |
| 9. while not all nodes i (1 <= i <= N) satisfy Dlih = Dlih−1, do |
| 10. for 1 <= i <= N do |
| 11. Determine whether the initial candidate set S0i′ includes nodes in set A |
| 12. Judge data priority |
| 13. for 1 <= j <= |S0i′| |
| 14. Based on Equation (4), calculate the transmission success probability |
| 15. According to data priority and Equations (11) and (12), calculate the transmission cost |
| 16. end |
| 17. if the transmission cost of node vi is reduced |
| 18. B0 = B0 ∪ vi |
| 19. Update the candidate set and transmission cost of vi |
| 20. end |
| 21. end |
| 22. end |
| 23. S = S0, A←B, B = ø, h = h + 1 |
| 24. Perform data transmission and update the link evaluation index matrix L |
| 25. end |
After the candidate node is determined, the transmission cost corresponding to each candidate node is compared. The smaller the transmission cost of a node, the higher its priority. The minimum value is selected as the forwarding node of the source node. Finally, the transmission path is determined.
The studied algorithm is a centralized algorithm. Before the nodes start to transmit data, the centralized central controller coordinates and manages all nodes. It calculates the candidate set and forwarding priority of each node and then notifies each node of the calculation result. When nodes need to transmit data, they send messages to all candidate nodes, and the final forwarding node is determined according to the forwarding priority.
5. Experiment and Analysis
5.1. Simulation Settings
In the environment of Intel®Core™ I7-9700U CPU@3.00 GHz with 16 GB RAM, the algorithm was verified on the MATLAB platform. The deployment location of the WBAN is shown in the Figure 2. To facilitate human action, the sink was placed at the waist. Taking the sink as the origin, the ray parallel to the ground as the X-axis, the ray perpendicular to the ground as the Y-axis, and the ray perpendicular to the X-axis and Y-axis as the Z-axis, a three-dimensional coordinate system of the WBAN for the rural elderly was established.
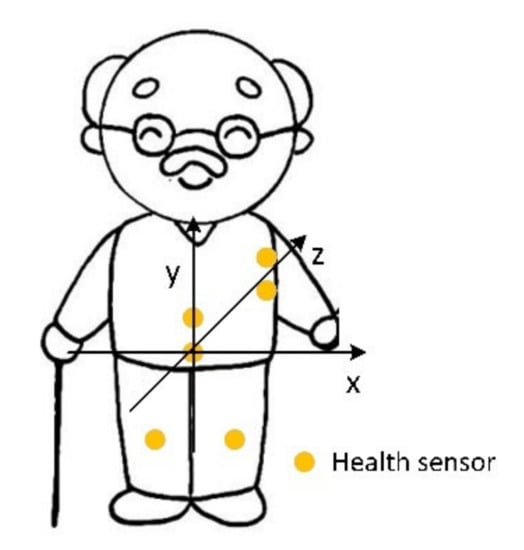
Figure 2.
Deployment diagram of the nodes in the WBAN.
In order to approach the channel state of the WBAN when the elderly was really active, we set the path loss as [26]:
The rural elderly moves frequently. In order to facilitate work, the clothe material will be rough and will easily cause large signal loss. Therefore, the maximum environmental attenuation rate in this model was set to 2. Through the signal loss model, the connectivity probability between links was initialized, and the actual connectivity probability of the links during each transmission was simulated. Other algorithm parameters are described in Table 3.
Table 3.
Detailed parameters.
Assuming that the height of the elderly was 165 cm (h = 23.5 cm) [27], the human body was in a relatively stable state such as standing/sleeping at the beginning, and all nodes were on the plane formed by the X-axis and the Y-axis, then the position coordinates of all nodes could be obtained, as listed in Table 4.
Table 4.
Node position when the human was static.
When simulating walking, the position of the sensors changed in a period of 2 s. The specific position changes of the sensors in a period are shown in Table 5.
Table 5.
Changes in node coordinates during human walking.
5.2. Network Performance Analysis
The network lifetime is measured by the number of rounds before a node dies. The fewer the number of dead nodes in a certain period of time, the longer the network lifetime. We compared the studied algorithm with the EEAR algorithm without considering opportunistic routing in ref. [13], the MMR_OR algorithm based on maximum/minimum ranges in ref. [25], and the IOP algorithm using opportunistic routing to transmit health data, reported in ref. [24].
As shown in ref. [13], in order to better aggregate data and run routing algorithms, the sink is considered to be energy-unlimited. Therefore, we mainly verified the energy consumption of the sensor nodes. In Figure 3, we can see that the first dead node of the studied protocol appeared at the latest, around the 200th simulation round. As the number of rounds increased, the number of dead nodes grew faster, and all nodes died around 560 rounds. In the later stage of the simulation, the death rate of the node increased. After a node died, the probability of forming a reliable transmission route in the WBAN decreased, the number of retransmissions increased, and the energy consumption increased, so the speed of death increased. However, compared with the other three algorithms, the energy consumption of the studied algorithm was more balanced, and the network was more stable. The algorithm selected the routing strategy according to the data priority. On the basis of not affecting the priority transmission of emergency data, the residual energy and link stability were comprehensively considered. Therefore, the energy consumption was more balanced. Although the network energy was not considered when transmitting emergency data, the algorithm still maintained a good network lifetime.
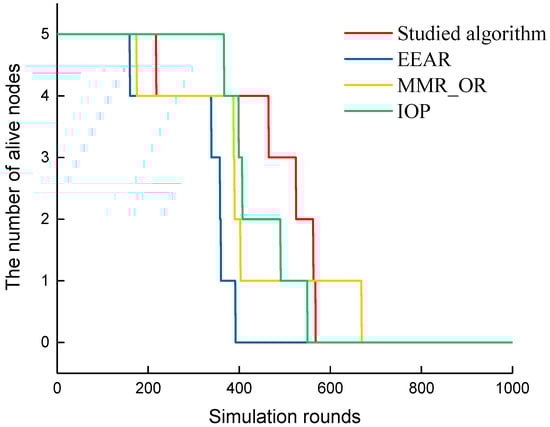
Figure 3.
Comparison of death nodes.
The throughput of the network is an important indicator that characterizes the overall performance of the network. Figure 4 shows the changing trend of the number of packets received by the sink. The throughput performance of the studied protocol was better than that of previous protocols. The energy consumption was more balanced, and the network performance was more stable, which ensured the reliability of data transmission and improved the network throughput. It can be clearly seen in the Figure 3 that the last node of the MMR_OR algorithm died around 650 rounds. The last node of MMR_OR died at the latest, but due to unbalanced energy consumption, other nodes died earlier, resulting in a poor throughput.
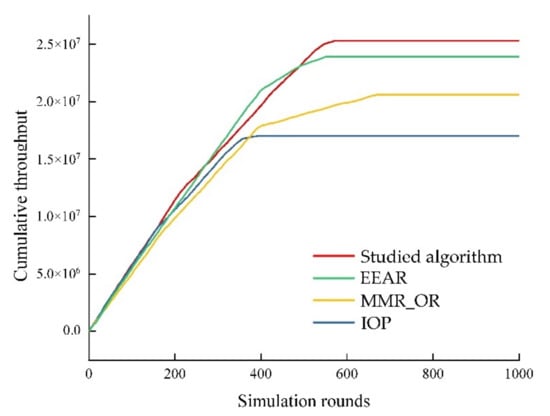
Figure 4.
Comparison of cumulative throughputs.
Figure 5 shows the network delay under different algorithms. It can be seen that the delay of our algorithm was shorter than that of other algorithms. This is because the shortest transmission path of emergency data was considered, which made the transmission cost of routing lower. Therefore, compared with other routing algorithms focusing on the transmission distance, the delay of our algorithm was shorter.
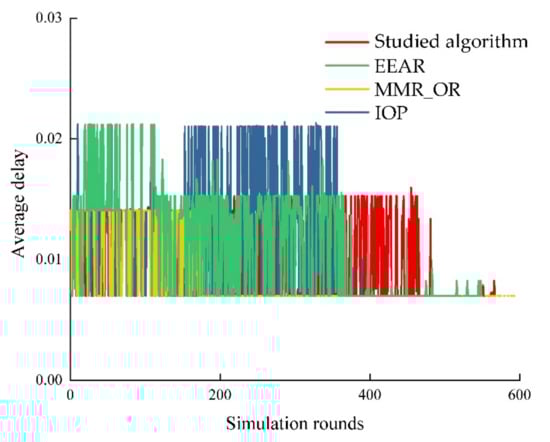
Figure 5.
Comparison of the average delay.
Figure 6 compares the average hops of each algorithm. When the network energy was abundant in the early stage, the studied algorithm chose to transmit data by one-hop transmission. In the later stage, the energy decreased. The influence of residual energy was introduced into the selection of the candidate set, so the average hop count increased. By comparing the average number of hops and the number of dead nodes, it can be seen that the average number of hops experienced by the route selected by our algorithm was small.
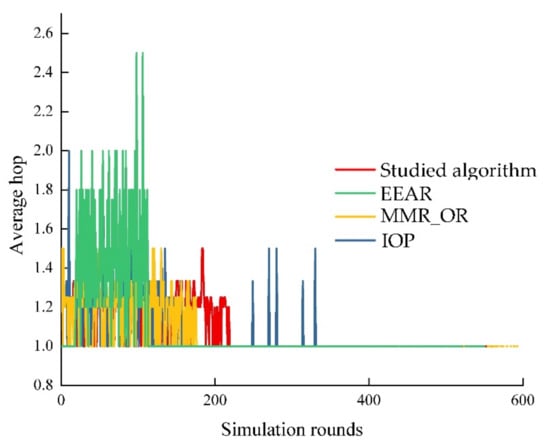
Figure 6.
Comparison of the average hops.
It can be seen from the number of retransmissions in Figure 7 that, as the number of simulation rounds increased, the number of retransmissions increased, which conforms to the transmission law of the WBAN. Compared with other algorithms, the number of retransmissions related to our algorithm was less in the early stage, because the link connectivity probability prediction with a sliding time window could more effectively evaluate the link reliability and realize a more stable data transmission.
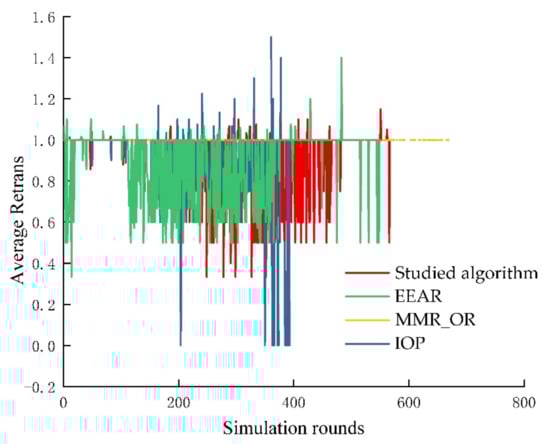
Figure 7.
Comparison of the average number of retransmissions.
5.3. Transmission Performance Analysis of Emergency Data
In order to further verify the performance of this algorithm in emergency data transmission, we compared the cumulative transmission delay and the cumulative average hops of the four algorithms for emergency data. As shown in Figure 8 and Figure 9, the cumulative delay and hop of emergency data in the EEAR and MMR_OR algorithms were kept at a low level. These Figures show the cumulative delay and the cumulative hop in the whole simulation round. In Figure 3, all sensors in the EEAR algorithm died early. Most of the nodes in MMR_OR also died in about 400 rounds. Therefore, it is reasonable that its cumulative delay and hop were small. However, too many nodes dying early would not allow the stable monitoring of human parameters and will lead to high equipment costs. It can be seen that when the number of alive nodes was in about the same range (before 380 rounds of simulation), the cumulative delay of our algorithm was small, and we could select a transmission path with fewer hops for emergency data. The studied algorithm could maintain the network stability while considering the emergency data.
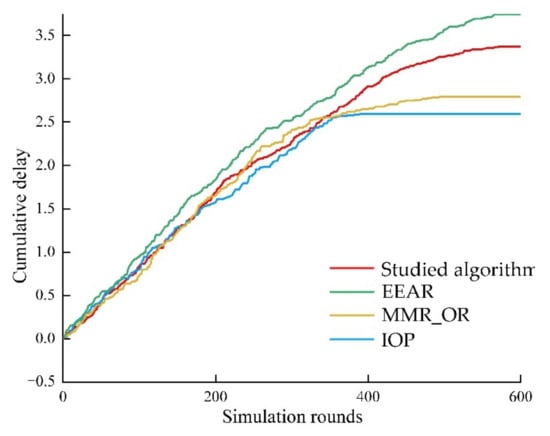
Figure 8.
Comparison of the emergency data transmission delay.
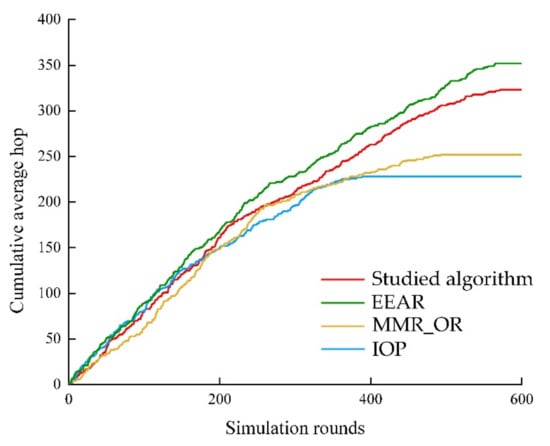
Figure 9.
Comparison of the emergency data transmission hop.
6. Conclusions
Combined with the delay-tolerant network, a prediction model of node connectivity probability based on the analysis of the link history connection was obtained. It further integrates the advantages of opportunistic routing forwarding nodes and optimizes the selection of candidate nodes according to node residual energy and link stability, which improves the reliability of data transmission. The construction of the candidate set took into account the interaction between communication links and studied the improved Bellman algorithm to obtain the candidate set. The proposed algorithm can effectively control the network overhead, prolong the network lifetime and improve the network throughput.
The channel model we used was mainly based on published studies. Therefore, our future research will mainly focus on testing the body area network channels of the elderly, further optimizing the mobile model of the rural elderly in combination with their random behavior and designing an efficient data transmission protocol.
Author Contributions
Conceptualization, H.W. and H.Z.; methodology, H.W. and J.G.; validation, J.G., C.P. and X.H.; formal analysis, H.Z., X.H. and C.P.; investigation, J.G.; writing—original draft preparation, all authors; funding acquisition, H.W. All authors have read and agreed to the published version of the manuscript.
Funding
This research was funded by the National Key Research and Development Program of China, grant number 2019YFD1101105, and the National Natural Science Foundation of China, grant number 61871041.
Institutional Review Board Statement
Not applicable.
Informed Consent Statement
Not applicable.
Data Availability Statement
Not applicable.
Conflicts of Interest
The authors declare no conflict of interest.
References
- Zou, X.; Fitzgerald, R.; Nie, J.B. “Unworthy of care and treatment”: Cultural devaluation and structural constraints to healthcare-seeking for older people in rural China. Int. J. Environ. Res. Pub. Health 2020, 17, 2132. [Google Scholar] [CrossRef]
- Zhong, Z.P.; Lin, L.; Yang, Y. Study on the Health Status and Health Service Utilization for the Rural Elderly in the Metropolitan Suburb During the Urbanization Process: A Case for Mingxing Village, Guangzhou. Sustainability 2020, 12, 3560. [Google Scholar] [CrossRef]
- Cai, W.C.; Deng, Y.J.; Zhang, Q.Q.; Yang, H.Y.; Huo, X.X. Does Income Inequality Impair Health? Evidence from Rural China. Agriculture 2021, 11, 203. [Google Scholar] [CrossRef]
- Khan, R.A.; Pathan, A.K. The state-of-the-art wireless body area sensor networks: A survey. Int. J. Distrib. Sens. Netw. 2018, 14, 1550147718768994. [Google Scholar] [CrossRef]
- Du, Y.W.; Xia, J.Z.; Gong, J.H.; Hu, X.H. An Energy-Efficient and Fault-Tolerant Topology Control Game Algorithm for Wireless Sensor Network. Electronics 2019, 8, 1009. [Google Scholar] [CrossRef]
- El Azhari, M.; El Moussaid, N.; Toumanari, A.; Latif, R. Equalized energy consumption in wireless body area networks for a prolonged network lifetime. Wirel. Commun. Mob. Comput. 2017, 2017, 4157858. [Google Scholar] [CrossRef]
- Yessad, N.; Omar, M.; Tari, A.; Bouabdallah, A. QoS-based routing in Wireless Body Area Networks: A survey and taxonomy. Computing 2018, 100, 245–275. [Google Scholar] [CrossRef]
- Javed, M.; Ahmed, G.; Mahmood, D.; Raza, M.; Ali, K.; Ur-Rehman, M. TAEO-A Thermal Aware & Energy Optimized Routing Protocol for Wireless Body Area Networks. Sensors 2019, 19, 3275. [Google Scholar]
- Takizawa, K.; Aoyagi, T.; Takada, J.; Katayama, N.; Yazdandoost, K.Y.; Kobayashi, T.; Kohno, R. Channel models for wireless body area networks. In Proceedings of the 30th Annual International Conference of the IEEE-Engineering-in-Medicine-and-Biology-Society, Vancouver, BC, Canada, 20–24 August 2008. [Google Scholar]
- Naganawa, J.; Wangchuk, K.; Kim, M.; Aoyagi, T.; Takada, J. Simulation-based scenario-specific channel modeling for WBAN cooperative transmission schemes. IEEE J. Biomed. Health 2015, 19, 559–570. [Google Scholar] [CrossRef]
- Yan, J.; Peng, Y.H.; Shen, D.W.; Yan, X.X.; Deng, Q.X. An artificial bee colony-based green routing mechanism in WBANs for sensor-based e-healthcare systems. Sensors 2018, 18, 3268. [Google Scholar] [CrossRef]
- Anwar, M.; Abdullah, A.H.; Altameem, A.; Qureshi, K.N.; Masud, F.; Faheem, M.; Cao, Y.; Kharel, R. Green communication for wireless body area networks: Energy aware link efficient routing approach. Sensors 2018, 18, 3237. [Google Scholar] [CrossRef] [PubMed]
- Aljaghthami, W.W.; Zafar, M.H.; Attiah, A.Z. An Efficient Energy Aware Routing Mechanism for Wireless Body Area Networks. CMC-Comput. Mater. Contin. 2022, 70, 1111–1126. [Google Scholar] [CrossRef]
- Ullah, F.; Khan, M.Z.; Faisal, M.; Rehman, H.U.; Abbas, S.; Mubarek, F.S. An energy efficient and reliable routing scheme to enhance the stability period in Wireless Body Area Networks. Comput. Commun. 2021, 165, 20–32. [Google Scholar] [CrossRef]
- Qureshi, K.N.; Din, S.; Jeon, G.; Piccialli, F. Link quality and energy utilization based preferable next hop selection routing for wireless body area networks. Comput. Commun. 2020, 149, 382–392. [Google Scholar] [CrossRef]
- Smail, O.; Kerrar, A. Energy-aware and stable routing protocol for hospital wireless body area networks. J. Inf. Sci. Eng. 2021, 37, 1–13. [Google Scholar]
- Banuselvasaraswathy, B.; Rathinasabapathy, V. Self-heat controlling energy efficient OPOT routing protocol for WBAN. Wirel. Netw. 2020, 26, 3781–3792. [Google Scholar] [CrossRef]
- Quwaider, M.; Biswas, S. DTN routing in body sensor networks with dynamic postural partitioning. Ad Hoc Netw. 2010, 8, 824–841. [Google Scholar] [CrossRef]
- Zhou, J.; Cao, Z.F.; Dong, X.L.; Vasilakos, T. GTSIM-POP: Game theory based secure incentive mechanism and patient-optimized privacy-preserving packet forwarding scheme in m-healthcare social networks. Future Gener. Comput. Syst. 2019, 101, 70–82. [Google Scholar] [CrossRef]
- Liang, X.H.; Li, X.; Shen, Q.H.; Lu, R.X.; Lin, X.D.; Shen, X.M.; Zhuang, W.H. Exploiting prediction to enable secure and reliable routing in wireless body area networks. In Proceedings of the IEEE INFOCOM Conference, Orlando, FL, USA, 25–30 March 2012. [Google Scholar]
- Quwaider, M.; Taghizadeh, M.; Biswas, S. Modeling on-body DTN packet routing delay in the presence of postural disconnections. EURASIP J. Wirel. Commun. Netw. 2011, 2011, 280324. [Google Scholar] [CrossRef][Green Version]
- Hassanpour, S.; Vejdanparast, Y.; Asadi, B.; Zargar, P. Improving reliability of routing in Wireless Body Area Sensor Networks using Genetic Algorithm. In Proceedings of the 2011 IEEE International Conference on Computer Science and Automation Engineering, Shanghai, China, 10–12 June 2011. [Google Scholar]
- Badreddine, W.; Khernane, N.; Potop-Butucaru, M.; Chaudet, C. Convergecast in wireless body area networks. Ad Hoc Netw. 2017, 66, 40–51. [Google Scholar] [CrossRef]
- Bangotra, D.K.; Singh, Y.; Selwal, A.; Kumar, N.; Singh, P.K.; Hong, W.C. An Intelligent opportunistic routing algorithm for wireless sensor networks and its application towards e-Healthcare. Sensors 2020, 20, 3887. [Google Scholar] [CrossRef] [PubMed]
- Yee, P.L.; Mehmood, S.; Almogren, A.; Ali, I.; Anisi, M.H. Improving the performance of opportunistic routing using min-max range and optimum energy level for relay node selection in wireless sensor networks. Peer J. 2020, 6, e326. [Google Scholar] [CrossRef] [PubMed]
- Alam, M.M.; Hamida, E.B. Towards Accurate Mobility and Radio Link Modeling for IEEE 802.15.6 Wearable Body Sensor Networks. In Proceedings of the (IEEE WiMOB) Seventh International Workshop on Selected Topics in Mobile and Wireless Computing, Larnaca, Cyprus, 8–10 October 2014. [Google Scholar]
- Domingo, M.C. Sensor and gateway location optimization in body sensor networks. Wirel. Netw. 2014, 20, 2337–2347. [Google Scholar] [CrossRef]


Publisher’s Note: MDPI stays neutral with regard to jurisdictional claims in published maps and institutional affiliations. |
© 2022 by the authors. Licensee MDPI, Basel, Switzerland. This article is an open access article distributed under the terms and conditions of the Creative Commons Attribution (CC BY) license (https://creativecommons.org/licenses/by/4.0/).