Article

Rapid Harmonic Detection Scheme Based on Expanded Input Observer

1
State Grid Xiangtan Power Supply Company, Xiangtan 411100, China
2
Department of Instrumental and Electrical Engineering, School of Aerospace Engineering, Xiamen University, Xiamen 361102, China
*
Author to whom correspondence should be addressed.
Electronics 2022, 11(18), 2860; https://doi.org/10.3390/electronics11182860
Submission received: 6 August 2022 / Revised: 3 September 2022 / Accepted: 6 September 2022 / Published: 9 September 2022
(This article belongs to the Special Issue Power Quality in Power Systems)

Abstract

:
The existence of harmonics will cause the quality of power supply in a power system to decline and will affect the normal use of the power system. Therefore, it is important to suppress harmonics in the power system, and the first step of harmonic suppression is harmonic detection. To address this phenomenon, a fast harmonic detection method is proposed in this paper. It is based on the input observer theory to construct a state space model based on the original signal and harmonic components and estimate the state variables so as to achieve harmonic extraction. The characteristic roots are used to prove the convergence of the observer. In addition, the Second-Order Generalized Integration (SOGI) frequency estimation method is chosen to cascade with it so that harmonic detection can be accomplished with unknown frequencies. The simulation results prove that the proposed method can quickly converge and accurately extract each harmonic in the case of fluctuations in the fundamental amplitude, fundamental frequency and phase of the input signal, and the whole process can be completed in 0.02 s. The possible effects of white noise on harmonic extraction are also simulated, and the results prove that the accuracy of harmonic extraction can still be guaranteed in the presence of white noise. By using the Speedgoat real-time target machine built Rapid Control Prototype (RCP) as a testbed, experiments with similar simulation conditions were performed. The results show that the method has fast and accurate harmonic detection performance.

1. Introduction

With the rapid development of modern power electronics, a wide range of non-linear loads are now used in power systems. The nonlinearities in power systems can cause harmonics. The damage caused by the presence of harmonics in the power grid should not be underestimated. Harmonics reduce the efficiency of electricity production, transmission, and utilization and can cause overheating and fires, as well as noise, vibration, and insulation aging, which shorten the life of the device [1,2,3]. Therefore, the harm caused by harmonics cannot be ignored and the research and treatment of harmonics are of exceptional importance.
Research into the treatment of harmonics has generally been divided into three parts: harmonic extraction, the study of harmonic propagation mechanisms, and harmonic suppression. However, harmonic detection needs to be completed accurately before the research on harmonic propagation mechanisms and harmonic management can continue—that is to say, fast and accurate real-time harmonic extraction is a significant prerequisite for the study of harmonic propagation mechanisms and harmonic suppression [4,5].
Traditional harmonic extraction methods and their improvement algorithms can be divided into two types: frequency domain methods and time domain methods. Frequency domain harmonic extraction methods are mainly based on Fast Fourier Transform (FFT) analysis [6] and the wavelet transform (WT) [7] method, etc. FFT is one of the most typical and dominant methods used for harmonic detection. This method converts the original time domain signal to the frequency domain for analysis, and only a few cycles of sampling are required to obtain information such as frequency, amplitude, and phase. However, the FFT-based detection method cannot extract harmonics in real time and becomes ineffective if the original signal period is constantly changing [8]. In recent years, many researchers have optimised the FFT detection method by adding window functions or interpolation [9,10,11]. Some methods have been effective in improving detection accuracy, but still not in real time; WT can detect harmonics in real time. Therefore, the WT is more effective in analyzing transient and non-smooth signals, but during the wavelet transform process, there is a risk of spectral aliasing, which can lead to errors [12]. This process is also susceptible to interference from chaotic signals [13].
Harmonic detection methods in the time domain include instantaneous reactive power theory and Kalman filter theory. Harmonic detection methods based on instantaneous reactive power theory include the p q method and the i p i q method. In the case of three-phase asymmetry or distortion, there will be a large error. In actual power grids, asymmetry and the distortion of three-phase voltage are common, so this method has great disadvantages [14,15]. The Kalman filter (KF) has strong robustness to noise and is superior in interference detection analysis. However, its detection speed is too slow at runtime, and when combined with other algorithms it increases the computational effort, which unable to balance detection accuracy and detection speed [16].
A number of AI-based detection methods have been proposed in recent years. One of the typical methods used is based on neural network algorithms [17], which generally introduce iteration, combined with an adaptive prediction mechanism. This type of method has a high accuracy and can track harmonic changes exactly, while requiring a large number of samples for training [18].The overall algorithm is complex and more dependent on software, and research on the implementation of hardware conditions is still relatively underdeveloped [19].
The observer-based harmonic detection method is a form of time domain method. Ref. [20] presents an online method that can extract a single harmonic from a complex signal using a composite asymptotic observer. This method is highly accurate and has outstanding advantages in terms of the higher harmonics extracted due to the introduction of multi-rate sampling. However, the detection speed and the complexity of the algorithm have to be optimized. The research in ref. [21] introduces a real-time detection method based on an input observer that uses a phase-locked loop to extract the phase of the real-time signal and constructs a state space model with the signal and harmonic components. Then, it constructs an input observer based on the state space model and the extracted phase information. The method has the advantages of a high detection accuracy and strong anti-interference characteristics. However, there is still room for improvement in its detection speed. The paper [22] uses a cascaded SOGI algorithm to filter the DC component of the input signal and extract the fundamental frequency. Then, it uses a time-varying composite observer to extract harmonics. The outstanding feature of this method is that harmonics can be extracted online from distorted grid signals. The convergence can be completed within 0.06 s, which is one of the faster detection speeds among the proposed methods, but there is still room for enhancement in terms of the accuracy of extraction of the higher harmonics. The study in [23] proposed a pairwise observer-based extraction method that can directly establish the relationship between frequency and interference harmonics, achieving the separation of signal and harmonics and greatly reducing the computational effort. However, the method is only applicable to standard sinusoidal signals, which require knowledge of frequency information. In addition, the harmonic detection time is very critical, because detection delays will directly affect the communication and control system in real time [24]. Therefore, it is necessary to study a fast, accurate, and real-time harmonic detection method.
In response to the slow speed or low accuracy of harmonic detection exposed by the above discussion, in this paper, we design the Luenberger observer with an input observer architecture. The observer model constructs a state space model based on the original signal and harmonic components to estimate the state variables so as to achieve harmonic extraction, and the convergence of this observer is proven using the characteristic root. In order to complete harmonic detection with an unknown frequency, the SOGI frequency estimation method is used to cascade with the observer model to constitute the harmonic detection system. The innovative points of this method are:
1. Able to quickly track the signal after the change when the grid fluctuates; generally able to converge within 0.02 s.
2. Realization of fast convergence; at the same time, it can accurately extract each harmonic and high-frequency harmonic components can still be accurately restored.
3. Able to cope with various distortions in the power grid (fundamental frequency, amplitude, and phase angle changes, etc.) to achieve real-time online detection.
4. Compared with traditional detection methods, the method proposed in this paper does not require additional hardware circuits (Such as parallel filter circuits, etc.) or complex calculations.
The remainder of this paper is organized as follows. Section 2 presents the theoretical analysis of the proposed observer module. Section 3 and Section 4 present the simulation and experimental validation, respectively, and Section 5 concludes the whole paper.

2. Harmonic Detection

2.1. Design Method for Input Observer

Due to the symmetry of the power equipment in the power system, most of the even harmonics will cancel each other out. As a result, the harmonics in the power system are dominated by odd harmonics [25,26,27,28,29]. Let i m ( t ) as the periodic signal to be measured and according to [21], i m ( t ) can be seen as the sum of the DC, fundamental, and first n harmonic components. It is expressed as follows in the form of the Fourier series.
i m ( t ) = i 0 + A 1 sin ( ω t + φ 1 ) + A 3 sin ( 3 ω t + φ 3 ) + + A ( 2 n 1 ) sin ( ( 2 n 1 ) ω t + φ ( 2 n 1 ) ) = i 0 + k = 1 n A ( 2 k 1 ) sin ( ( 2 k 1 ) ω t + φ ( 2 k 1 ) )
where, ω = 2 π f is the angular frequency, f is the fundamental frequency, usually using the industrial frequency f = 50 Hz. i 0 is the DC component. A ( 2 k 1 ) sin ( ( 2 k 1 ) ω t + φ ( 2 k 1 ) ) is each harmonic component of frequency ( 2 k 1 ) ω (k = 1, 2, 3, …, n) of the sinusoidal signal. A k is the amplitude of each harmonic, φ k is the phase of each harmonic.
Let
x 0 = i 0 x 1 = A 1 sin ( ω t + φ 1 ) x 3 = A 3 sin ( 3 ω t + φ 3 ) x 2 n 1 = A ( 2 n 1 ) sin ( ( 2 n 1 ) ω t + φ ( 2 n 1 ) )
then
i m ( t ) = x 0 + x 1 + x 3 + + x 2 n 1
Let
x 2 = A 1 cos ( ω t + φ 1 ) x 4 = A 3 cos ( 3 ω t + φ 3 ) x 2 n = A ( 2 n 1 ) cos ( ( 2 n 1 ) ω t + φ ( 2 n 1 ) )
Then, there are
x ˙ 0 = 0 x ˙ 1 = A 1 ω cos ( ω t + φ 1 ) = ω x 2 x ˙ 2 = A 1 ω sin ( ω t + φ 1 ) = ω x 1 x ˙ 3 = 3 A 3 ω cos ( 3 ω t + φ 3 ) = 3 ω x 4 x ˙ 4 = 3 A 3 ω sin ( 3 ω t + φ 3 ) = 3 ω x 3 x ˙ 2 n 1 = ( 2 n 1 ) A ( 2 n 1 ) ω cos ( ( 2 n 1 ) ω t + φ ( 2 n 1 ) ) = ( 2 n 1 ) ω x ( 2 n ) x ˙ 2 n = ( 2 n 1 ) A ( 2 n 1 ) ω sin ( ( 2 n 1 ) ω t + φ ( 2 n 1 ) ) = ( 2 n 1 ) ω x ( 2 n 1 ) .
Using i m ( t ) as an input signal, a dynamic system is constructed using an integration operation. The first-order state space equation for this system is described as
x ˙ m = x 0 + x 1 + 0 · x 2 + + x 2 n 1 + 0 · x 2 n y = x m
where x ˙ m = i m ( t ) and y is the output.
To observe the original signal, the harmonic components are used as new state quantities to create a matrix.
Let
x i = x m x 0 x 1 x 2 x 3 x 2 n 1 x 2 n T
we expand the state space equations of Equation (7) into the form of an augmentation matrix, i.e.,
x ˙ i = M ( 2 n + 2 ) × ( 2 n + 2 ) x i y = c 1 × ( 2 n + 2 ) x i
the model described by Equation (8) is a linear time-varying system.
where
M = 0 1 1 0 1 0 0 0 0 0 0 0 0 0 0 ω 0 0 0 0 ω 0 0 0 0 0 0 0 0 ( 2 n 1 ) ω 0 0 0 0 ( 2 n 1 ) ω 0 c = 1 0 0 0
based on the system of Equation (8), a time-varying Luenberger observer model is established in Equation (9), and its closed-loop state estimation model is shown in Figure 1, where the state estimate x ^ of the original signal can be measured directly. On this basis, the output error e = y y ^ is used to correct the state estimation model so that the state estimate x ^ converges to the true state of the system.
x ^ ˙ i = M ( 2 n + 2 ) × ( 2 n + 2 ) x ^ i L ( y y ^ ) y ^ = c 1 × ( 2 n + 2 ) x ^ i
where the gain matrix L of the error signal is a (2n + 2) × 1 matrix.
L = l 1 l 2 l 3 l 2 n + 2 T
where l 1 , l 2 , l 3 , , l 2 n + 2 are all constant.
From the observer Equation (9), it follows that
x ^ ˙ 0 = l 2 e x ^ ˙ 1 = ω x ^ 2 l 3 e x ^ ˙ 2 = ω x ^ 1 l 4 e x ^ ˙ 3 = 3 ω x ^ 4 l 5 e x ^ ˙ 4 = 3 ω x ^ 3 l 6 e x ^ ˙ 2 n 1 = ( 2 n 1 ) ω x 2 n + 1 l 2 n + 1 e x ^ ˙ 2 n = ( 2 n 1 ) ω x 2 n + 2 l 2 n + 2 e .
For implementation, (11) can be written in the discrete form as (12) at moment k. The original signal collected is integrated to obtain x ( k ) . Then, the equation obtained for the estimated value of each state at moment k + 1 is as follows:
x ^ 0 ( k + 1 ) = T s ( l 2 e ( k ) ) + x ^ 0 ( k ) x ^ 1 ( k + 1 ) = T s ( ω x ^ 2 ( k ) l 3 e ( k ) ) + x ^ 1 ( k ) x ^ 2 ( k + 1 ) = T s ( ω x ^ 1 ( k ) l 4 e ( k ) ) + x ^ 2 ( k ) x ^ 3 ( k + 1 ) = T s ( 3 ω x ^ 4 ( k ) l 5 e ( k ) ) + x ^ 3 ( k ) x ^ 4 ( k + 1 ) = T s ( 3 ω x ^ 3 ( k ) l 6 e ( k ) ) + x ^ 4 ( k ) x ^ 2 n 1 ( k + 1 ) = T s ( ( 2 n 1 ) ω x 2 n ( k ) l 2 n + 1 e ( k ) ) + x ^ 2 n 1 ( k ) x ^ 2 n ( k + 1 ) = T s ( ( 2 n 1 ) ω x 2 n 1 ( k ) l 2 n + 2 e ( k ) ) + x ^ 2 n ( k ) .
Defining the error signal x ˜ i = x i x ^ i , the dynamic system of errors is:
x ˜ ˙ i = ( M L ( ω ) c ) x ˜ i
At t , when the state estimation variable x ^ i converges to the input value x i —i.e., the error signal x ˜ i converges to 0, the observer is proven to be convergent, and the harmonic component of i m can be observed. The condition for the observer to converge is the real part of the characteristic root λ < 0 . Therefore, we need to show that the observer can be made to converge by adjusting the parameter l of the gain matrix. That is to say, we need to show that the magnitude of the eigenvalue λ of ( M L ( ω ) c ) changes as the number of parameters l increases.
Let
A e = ( M L ( ω ) c ) = l 1 1 1 0 1 0 l 2 0 0 0 0 0 l 3 0 0 ω 0 0 l 4 0 ω 0 0 0 l 2 n + 1 0 0 0 0 ( 2 n 1 ) ω l 2 n + 2 0 0 0 ( 2 n 1 ) ω 0
It is necessary to prove that the eigenvalues λ of A e are related to l 2 n + 1 , l 2 n + 2 . The following is the proof procedure. when n = 1,
λ E A e = λ + l 1 1 1 0 l 2 λ 0 0 l 3 0 λ ω l 4 0 ω λ = λ ( λ 2 + ω 2 ) l 1 + ( λ 2 + ω 2 ) l 2 + λ 2 l 3 + λ ω l 4 + λ 2 ω 2 + λ 4
write this value as D. when n = 2,
λ E A e = λ + l 1 1 1 0 1 0 l 2 λ 0 0 0 0 l 3 0 λ ω 0 0 l 4 0 ω λ 0 0 l 5 0 0 0 λ 3 ω l 6 0 0 0 3 ω λ = ( λ 2 + 9 ω 2 ) D + λ 2 ( λ 2 + ω 2 ) l 5 + 3 λ ω ( λ 2 + ω 2 ) l 6
when n = n,
λ E A e = λ + l 1 1 1 0 1 0 l 2 λ 0 0 0 0 l 3 0 λ ω 0 0 l 4 0 ω λ 0 0 l 2 n + 1 0 0 0 λ ( 2 n 1 ) ω l 2 n + 2 0 0 0 ( 2 n 1 ) ω λ
Expanding the last row gives three remainders; the first one is shown below.
l 2 n + 2 1 1 0 1 0 λ 0 0 0 0 0 λ ω 0 0 0 ω λ 0 0 0 0 0 λ ( 2 n 1 ) ω
The following equation can be obtained through a series of expansions:
= ( 2 n + 1 ) ω λ l 2 n + 2 ( 1 ) λ ω 0 0 ω λ 0 0 0 0 λ ( 2 n 3 ) ω 0 0 ( 2 n 3 ) ω λ
Let this determinant be D k . Expanding D k twice yields:
= ( ω 2 + λ 2 ) λ 3 ω 0 0 3 ω λ 0 0 0 0 λ ( 2 n 3 ) ω 0 0 ( 2 n 3 ) ω λ
It is obvious that a D k 1 shaped like D k can be obtained after two expansions of the determinant D k , D k = ( ω 2 + λ 2 ) D k 1 . That is, by non-stop expansion, the value of D k can be solved and the value of D k is not zero.
At this point, the value of the first term of the original determinant is ( 2 n 1 ) ω λ l 2 n + 2 D K .
The second term of the original determinant is processed next.
= ( 2 n 1 ) ω λ + l 1 1 1 0 0 l 2 λ 0 0 0 l 3 0 λ ω 0 l 4 0 ω λ 0 l 2 n + 1 0 0 0 ( 2 n 1 ) ω
The expansion of the last column of the above equation gives:
= ( 2 n 1 ) 2 ω 2 λ + l 1 1 1 0 1 0 l 2 λ 0 0 0 0 l 3 0 λ ω 0 0 l 4 0 ω λ 0 0 l 2 n 1 0 0 0 λ ( 2 n 3 ) ω l 2 n 0 0 0 ( 2 n 3 ) ω λ
Let this determinant be D m . It is easy to see that D m is similar to the original determinant. The proof of the first term shows that D m 0 and this does not contain l 2 n + 2 , l 2 n + 1 —i.e., it does not cancel with the result of the first term.
Therefore, the value of the second term of the original determinant is ( 2 n 1 ) 2 ω 2 D m .
The third term is treated the same as the first and second terms, and the third term can be sorted by non-stop expansion to obtain the value of λ 2 ( D m l 2 n 1 D k ) .
It follows that the value of the original determinant is
λ E A e = [ ( 2 n 1 ) ω λ l 2 n + 2 + l 2 n + 1 ] D k + [ ( 2 n 1 ) 2 ω 2 + λ 2 ] D k
where D m and D k are determinants independent of l 2 n + 2 , l 2 n + 1 , whose value can be solved and is not zero. That is, the value of the characteristic root λ is related to l 2 n + 2 , l 2 n + 1 . According to the idea of mathematical induction, it is evidenced that when the number of parameters l increases (i.e., when the number of harmonics increases), the value of the characteristic root λ also changes. A reasonable choice of l leads to a sizeable design of the observer.

2.2. Frequency Estimation Model

The power system inevitably causes voltage distortions to occur due to the presence of various disturbances. This causes the frequency, phase, and amplitude of the grid voltage to change [23]. The observer harmonic extraction method designed in this paper requires the fundamental frequency information of the input signal in order to accurately extract the harmonic components contained in the signal. Therefore, in order to perform the real-time harmonic extraction of the distorted input signal, a frequency detection module needs to be cascaded at the front end of the observer.
At present, the mainstream frequency estimation methods include: SOGI, the Kalman filter, the synchronous coordinate system, and the FFT interpolation algorithm. Among them, the SOGI method is widely used as a mature phase-locked method with the advantages of a simple structure, high detection accuracy, and fast speed.The document designed a cascaded adaptive frequency-locking method based on SOGI which avoids the influence of DC components in the input signal by filtering the DC components contained in the input signal through the cascaded adaptive Least Mean Square (LMS) algorithm [22]. The fundamental frequency of the output signal can be detected in real time and has rapid performance and accuracy. Therefore, this method is used as the frequency estimation method in this paper.
Simulation and experiment-specific implementation: The selected frequency estimation method is cascaded with the observer model designed in the previous section to obtain a harmonic detection system with frequency estimation. The structural block diagram is shown in Figure 2. Based on the harmonic detection system design simulation and experiment, the effect of the harmonic detection system is achieved by simulating the fluctuation of the frequency, phase, and amplitude of the input signal due to the distortion of the grid voltage, as well as when white noise is attached to the input signal.

3. Simulation Results

3.1. Simulation of Harmonic Observation Models

According to the above derivation process, suitable parameters l are selected and the observer model is studied using MATLAB/SIMULINK to verify the harmonic detection effect of the observer algorithm. The sampling time T s = 5 × 10 5 s, considering that low-frequency signals are the majority in the grid and the 3rd harmonics and its multiples will cause harm to the grid, which will lead to a serious waste of power and severely shorten the service life of power electronic equipment [30]. Thus, the original signal of the simulation is v = s i n ω t + 0.125 s i n 5 ω t + 0.0625 s i n 7 ω t + 0.0375 s i n 11 ω t + 0.0125 s i n 13 ω t , where ω = 2 π × 50 . When the original signal is input to the observer model, the observer model will detect the fundamental, 5th, 7th, 11th, and 13th harmonics. Then, we add and reconstruct them to obtain the tracking signal of the original signal.
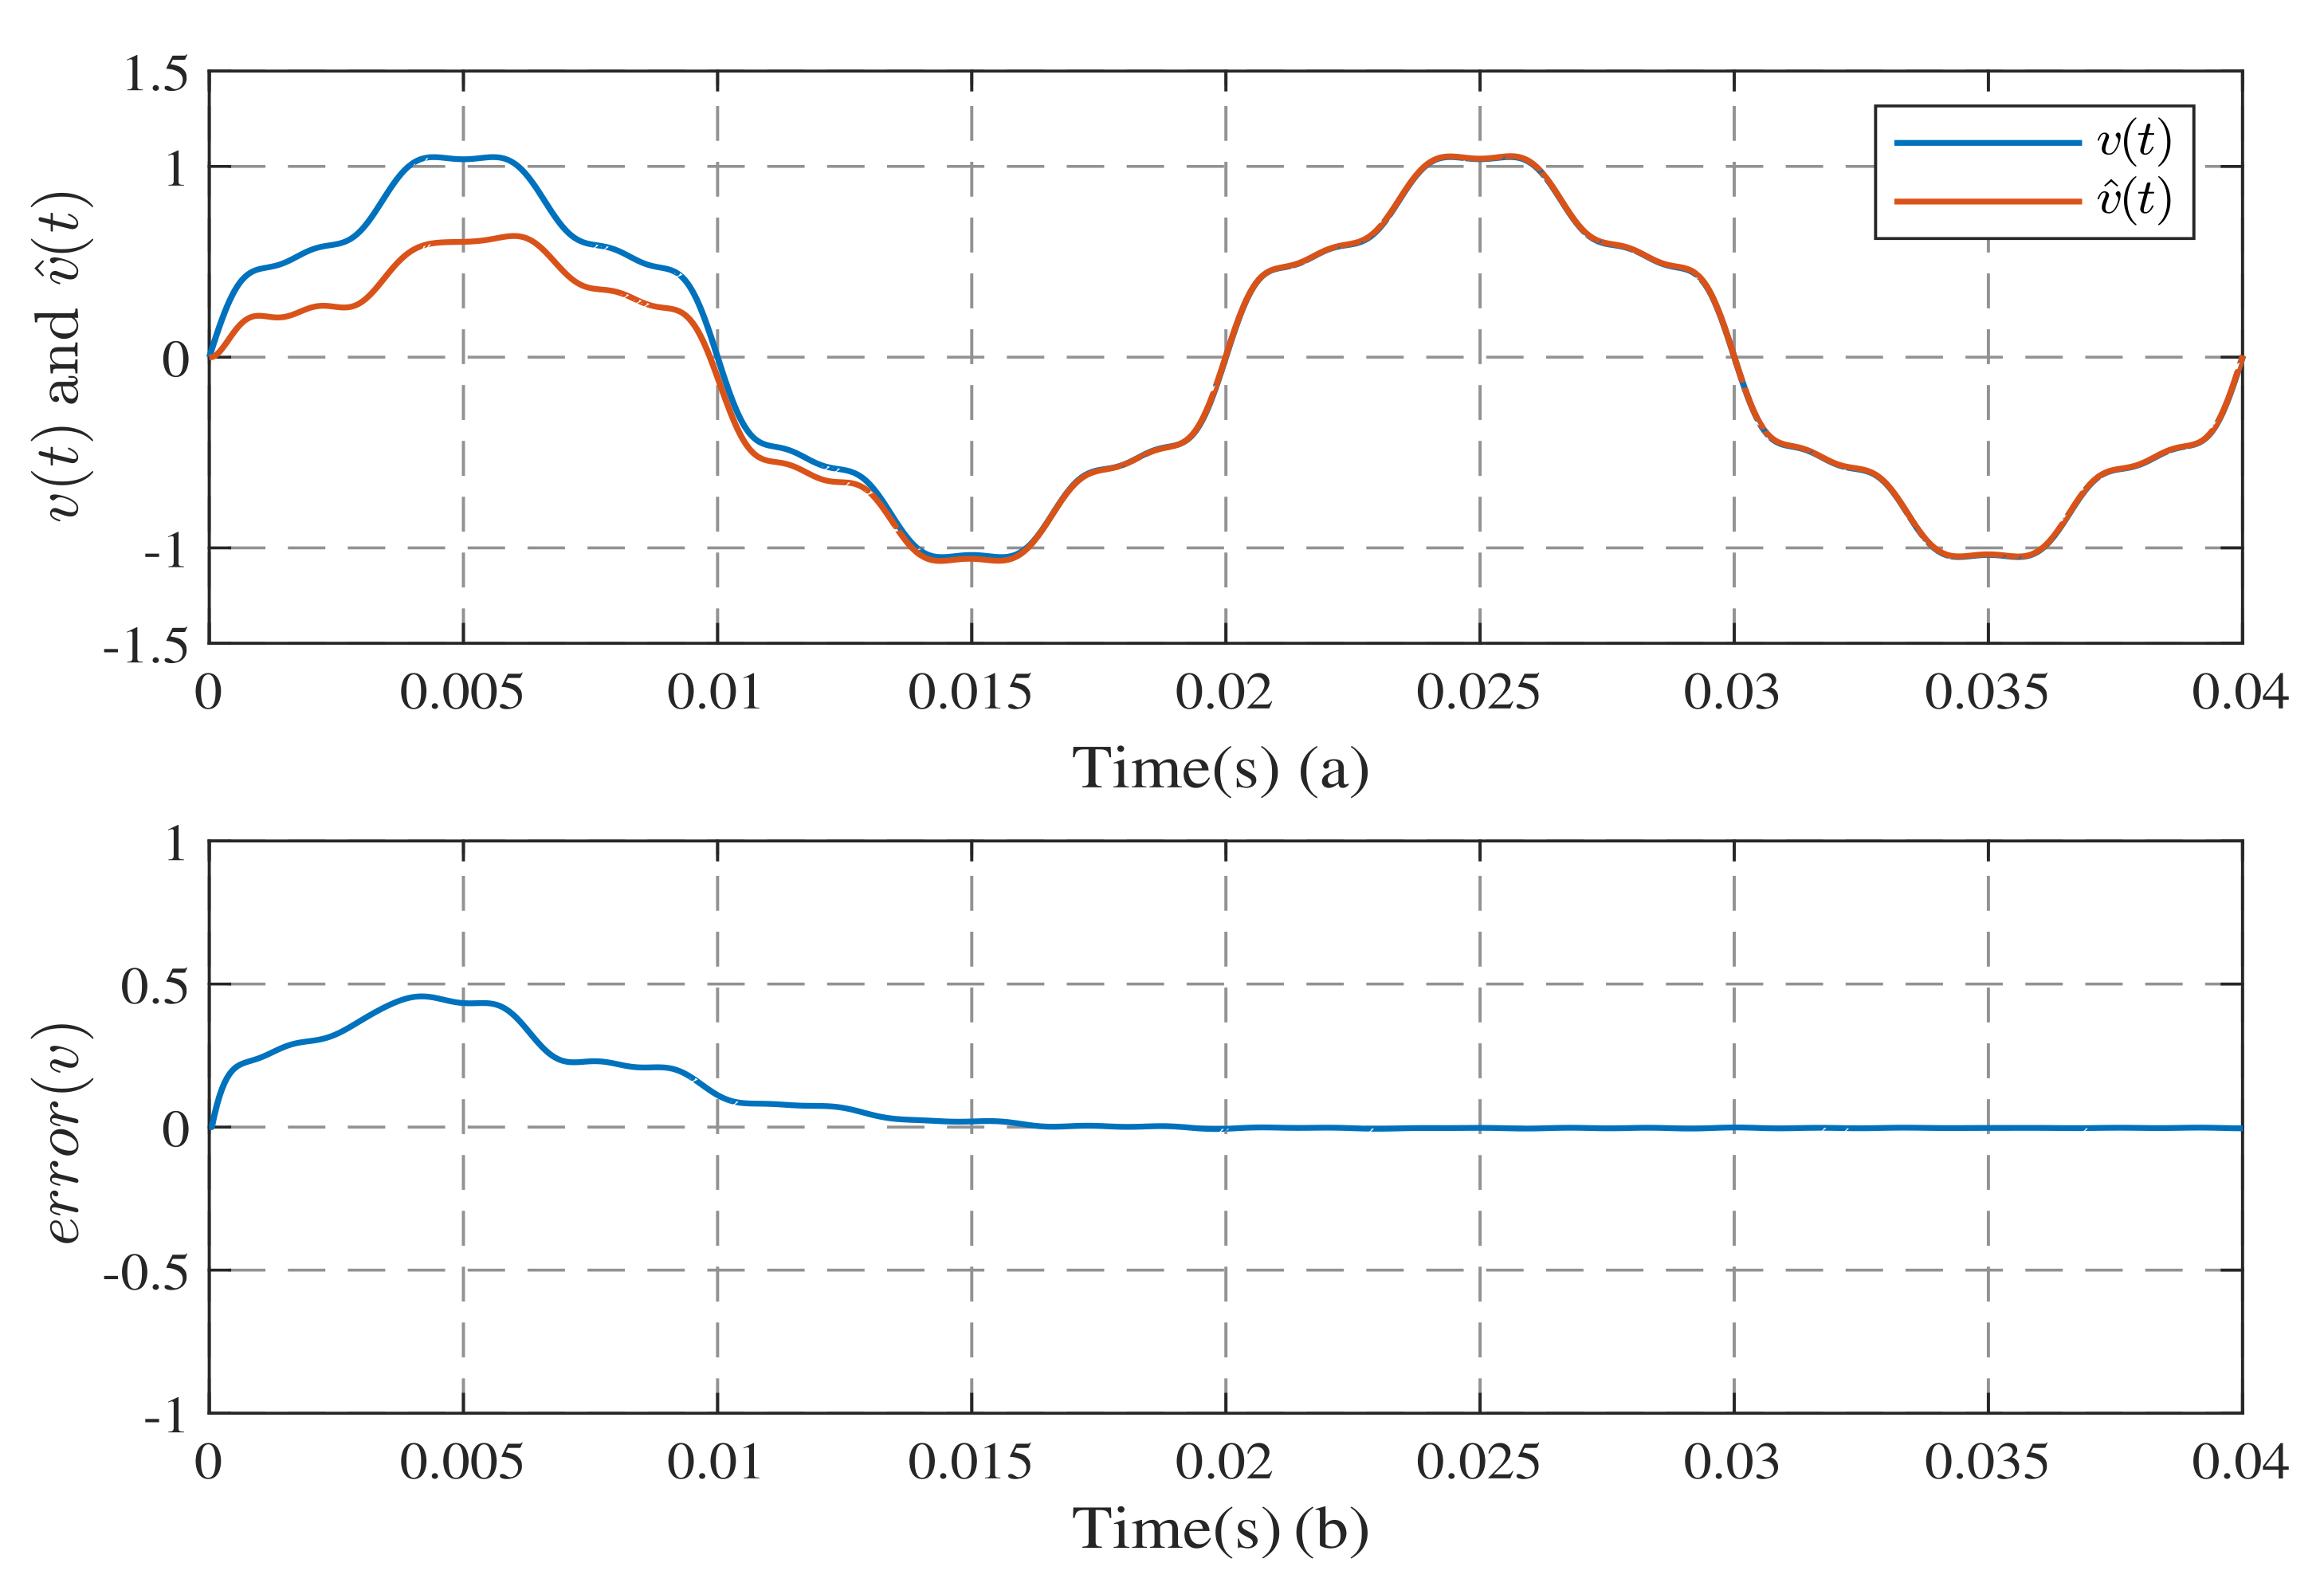
Figure 3 shows the observed waveforms of the observer model. It can be seen that the observer model can extract each harmonic accurately and quickly.
Figure 4a shows the tracking effect of this method, where v ^ is the observed signal and v is the original signal. Figure 4b is the error signal plot. The error signal e is the difference between the original signal and the observed current. It is easy to see that after a short oscillation, the observed signal can be tracked to the original signal very quickly. The detection of harmonics is completed in around 15ms and it can be kept stable after convergence.
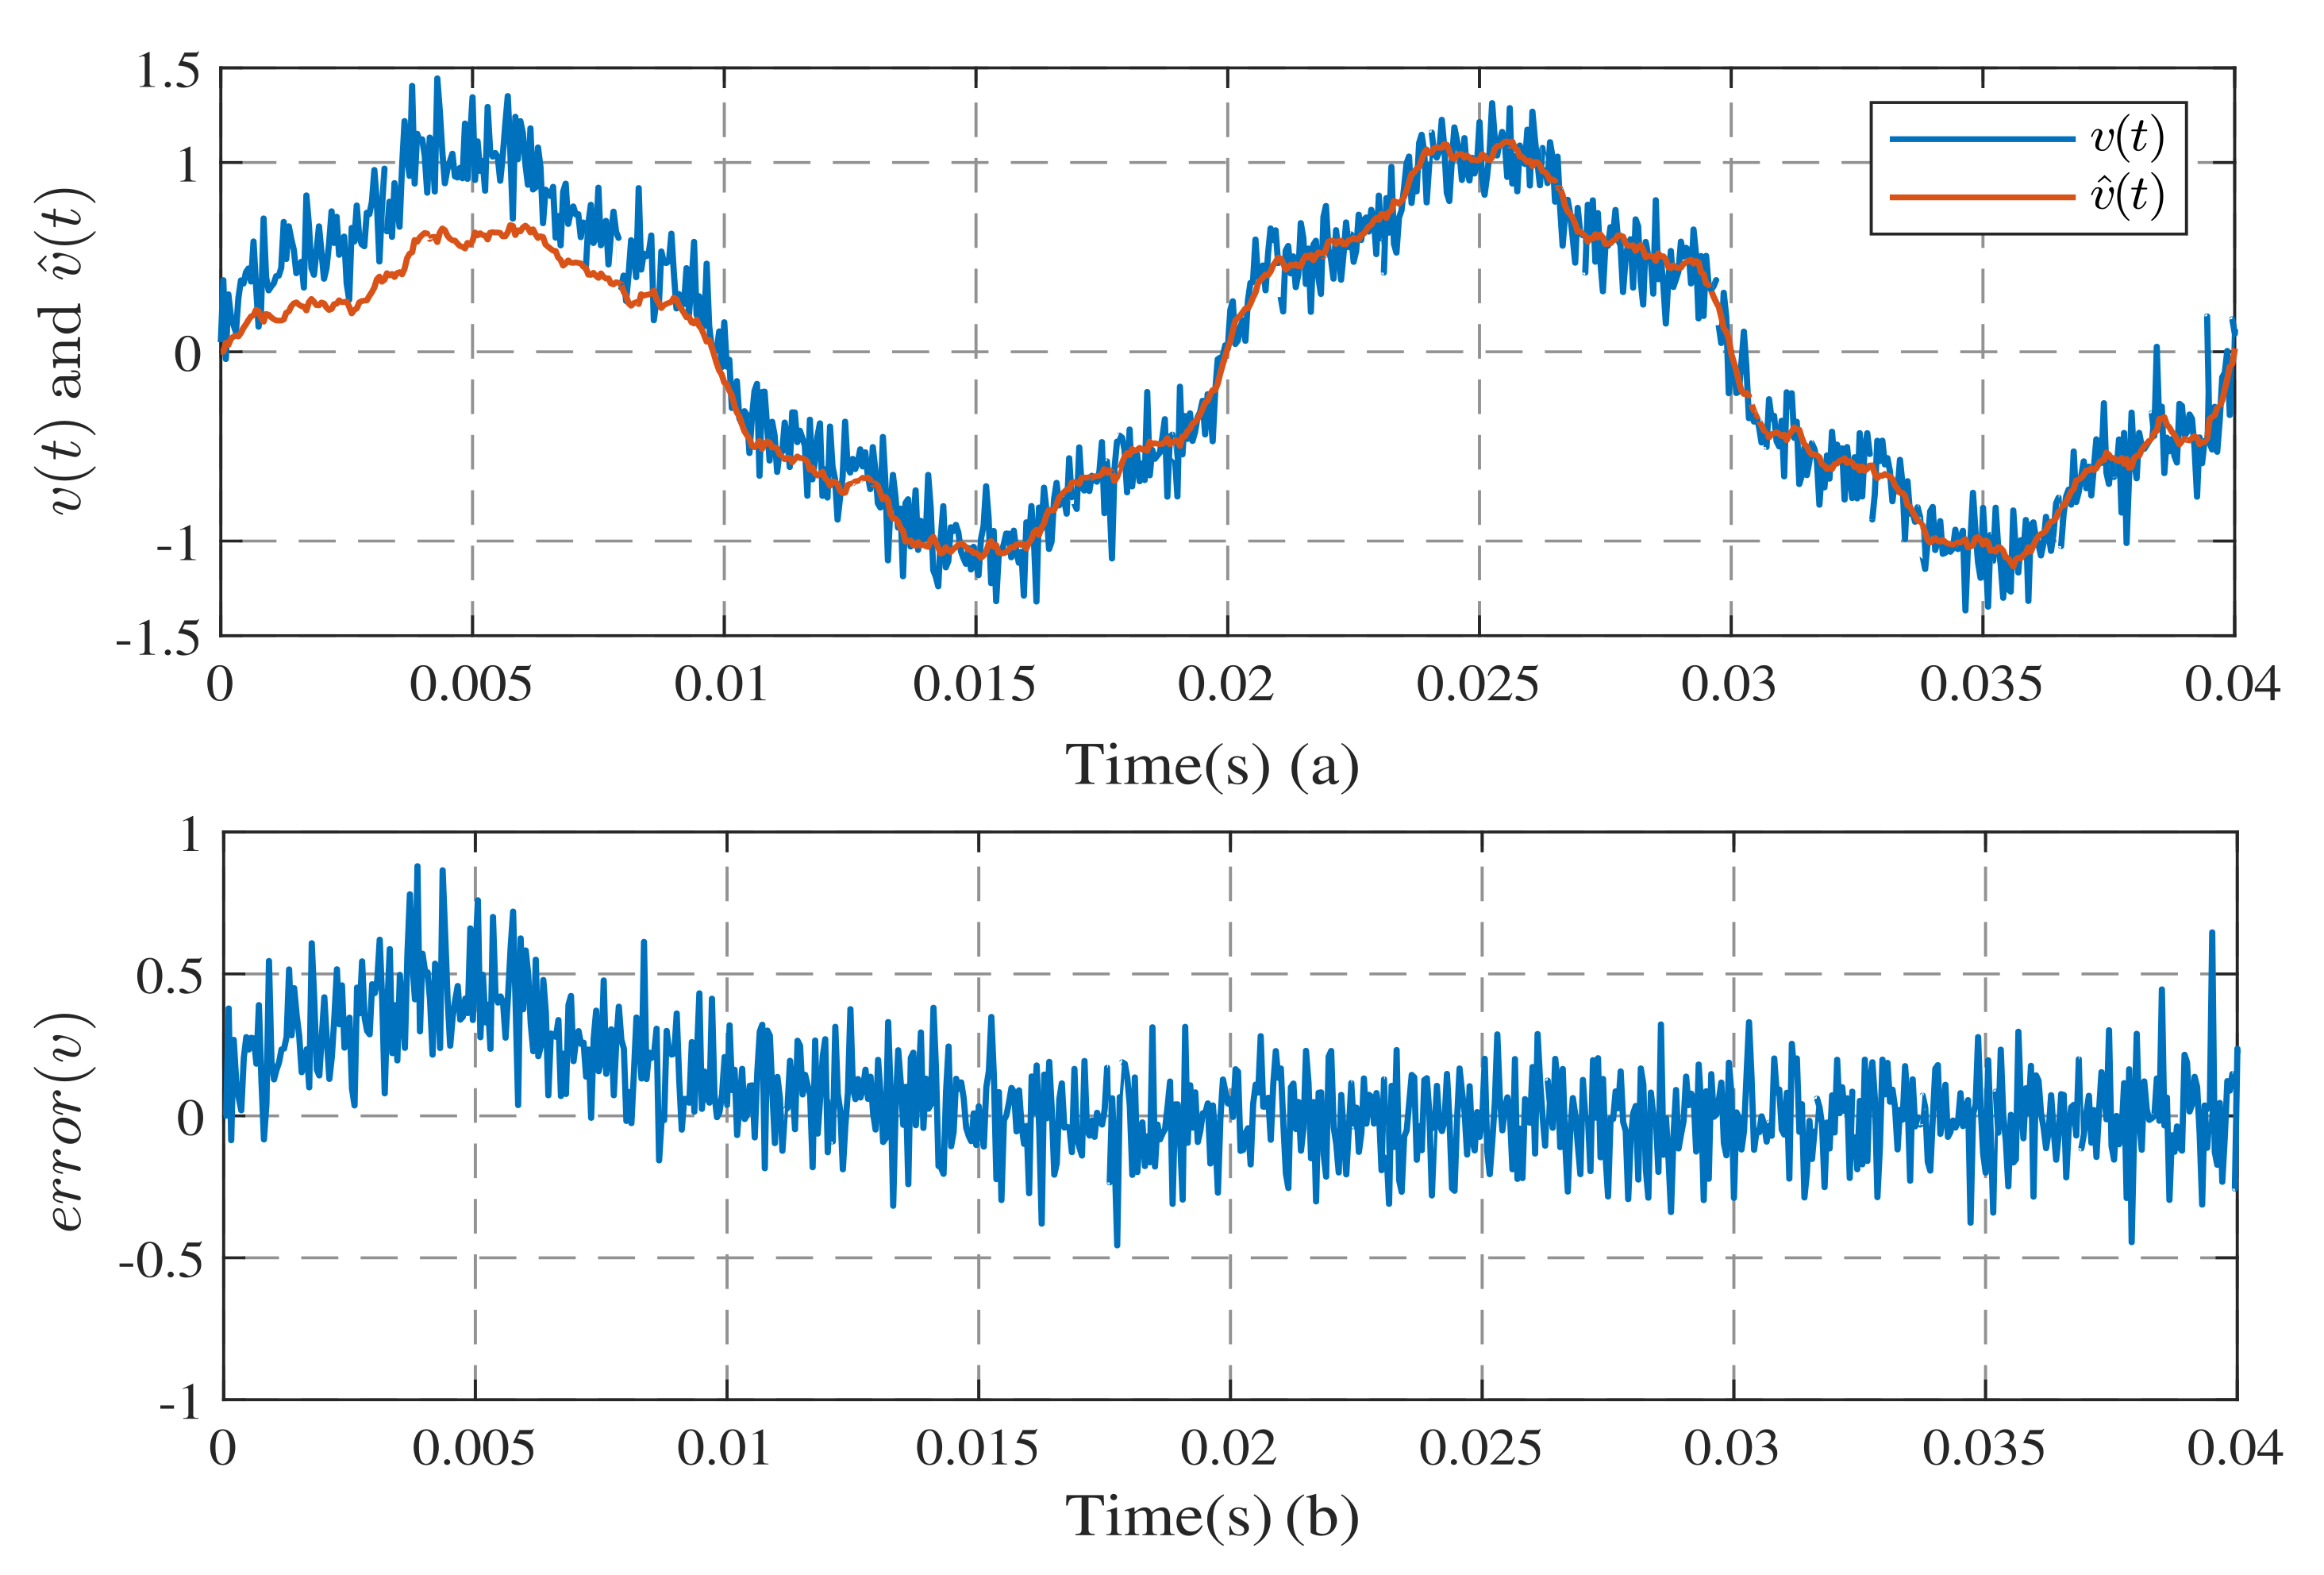
In addition, Figure 5a shows the tracking effect of the observer designed in this paper when the original signal contains white noise, and Figure 5b shows the tracking error. It can be seen that the observed signal can quickly complete the tracking of the original signal under the interference of white noise. That is, it has immunity to interference. Table 1 shows the error mean and Root Mean Square(RMS)-Error of the observed signal and the original signal with the addition of white noise with different Signal Noise Ratios (SNRs). It can be seen that there is an RMS-Error of no more than 10% compared to the fundamental amplitude—that is, we can observe the signal stably even in the presence of white noise interference.

3.2. Simulation of the Harmonic Observation System with Frequency Estimation

Since the focus of the method proposed in this paper is harmonic detection using observer-based theory, the frequency estimation method is not expanded on too much. In this paper, a mainstream SOGI method is selected for the frequency estimation of the input signal, and the estimation result is used as the input information of the constructed observer model to form a harmonic detection system.
Since fluctuations in the fundamental frequency, amplitude, and phase of the grid signal are frequent cases of distortion, the grid is also subject to noise interference from various devices during operation. Therefore, the designed harmonic detection system is functionally tested by simulating these situations.
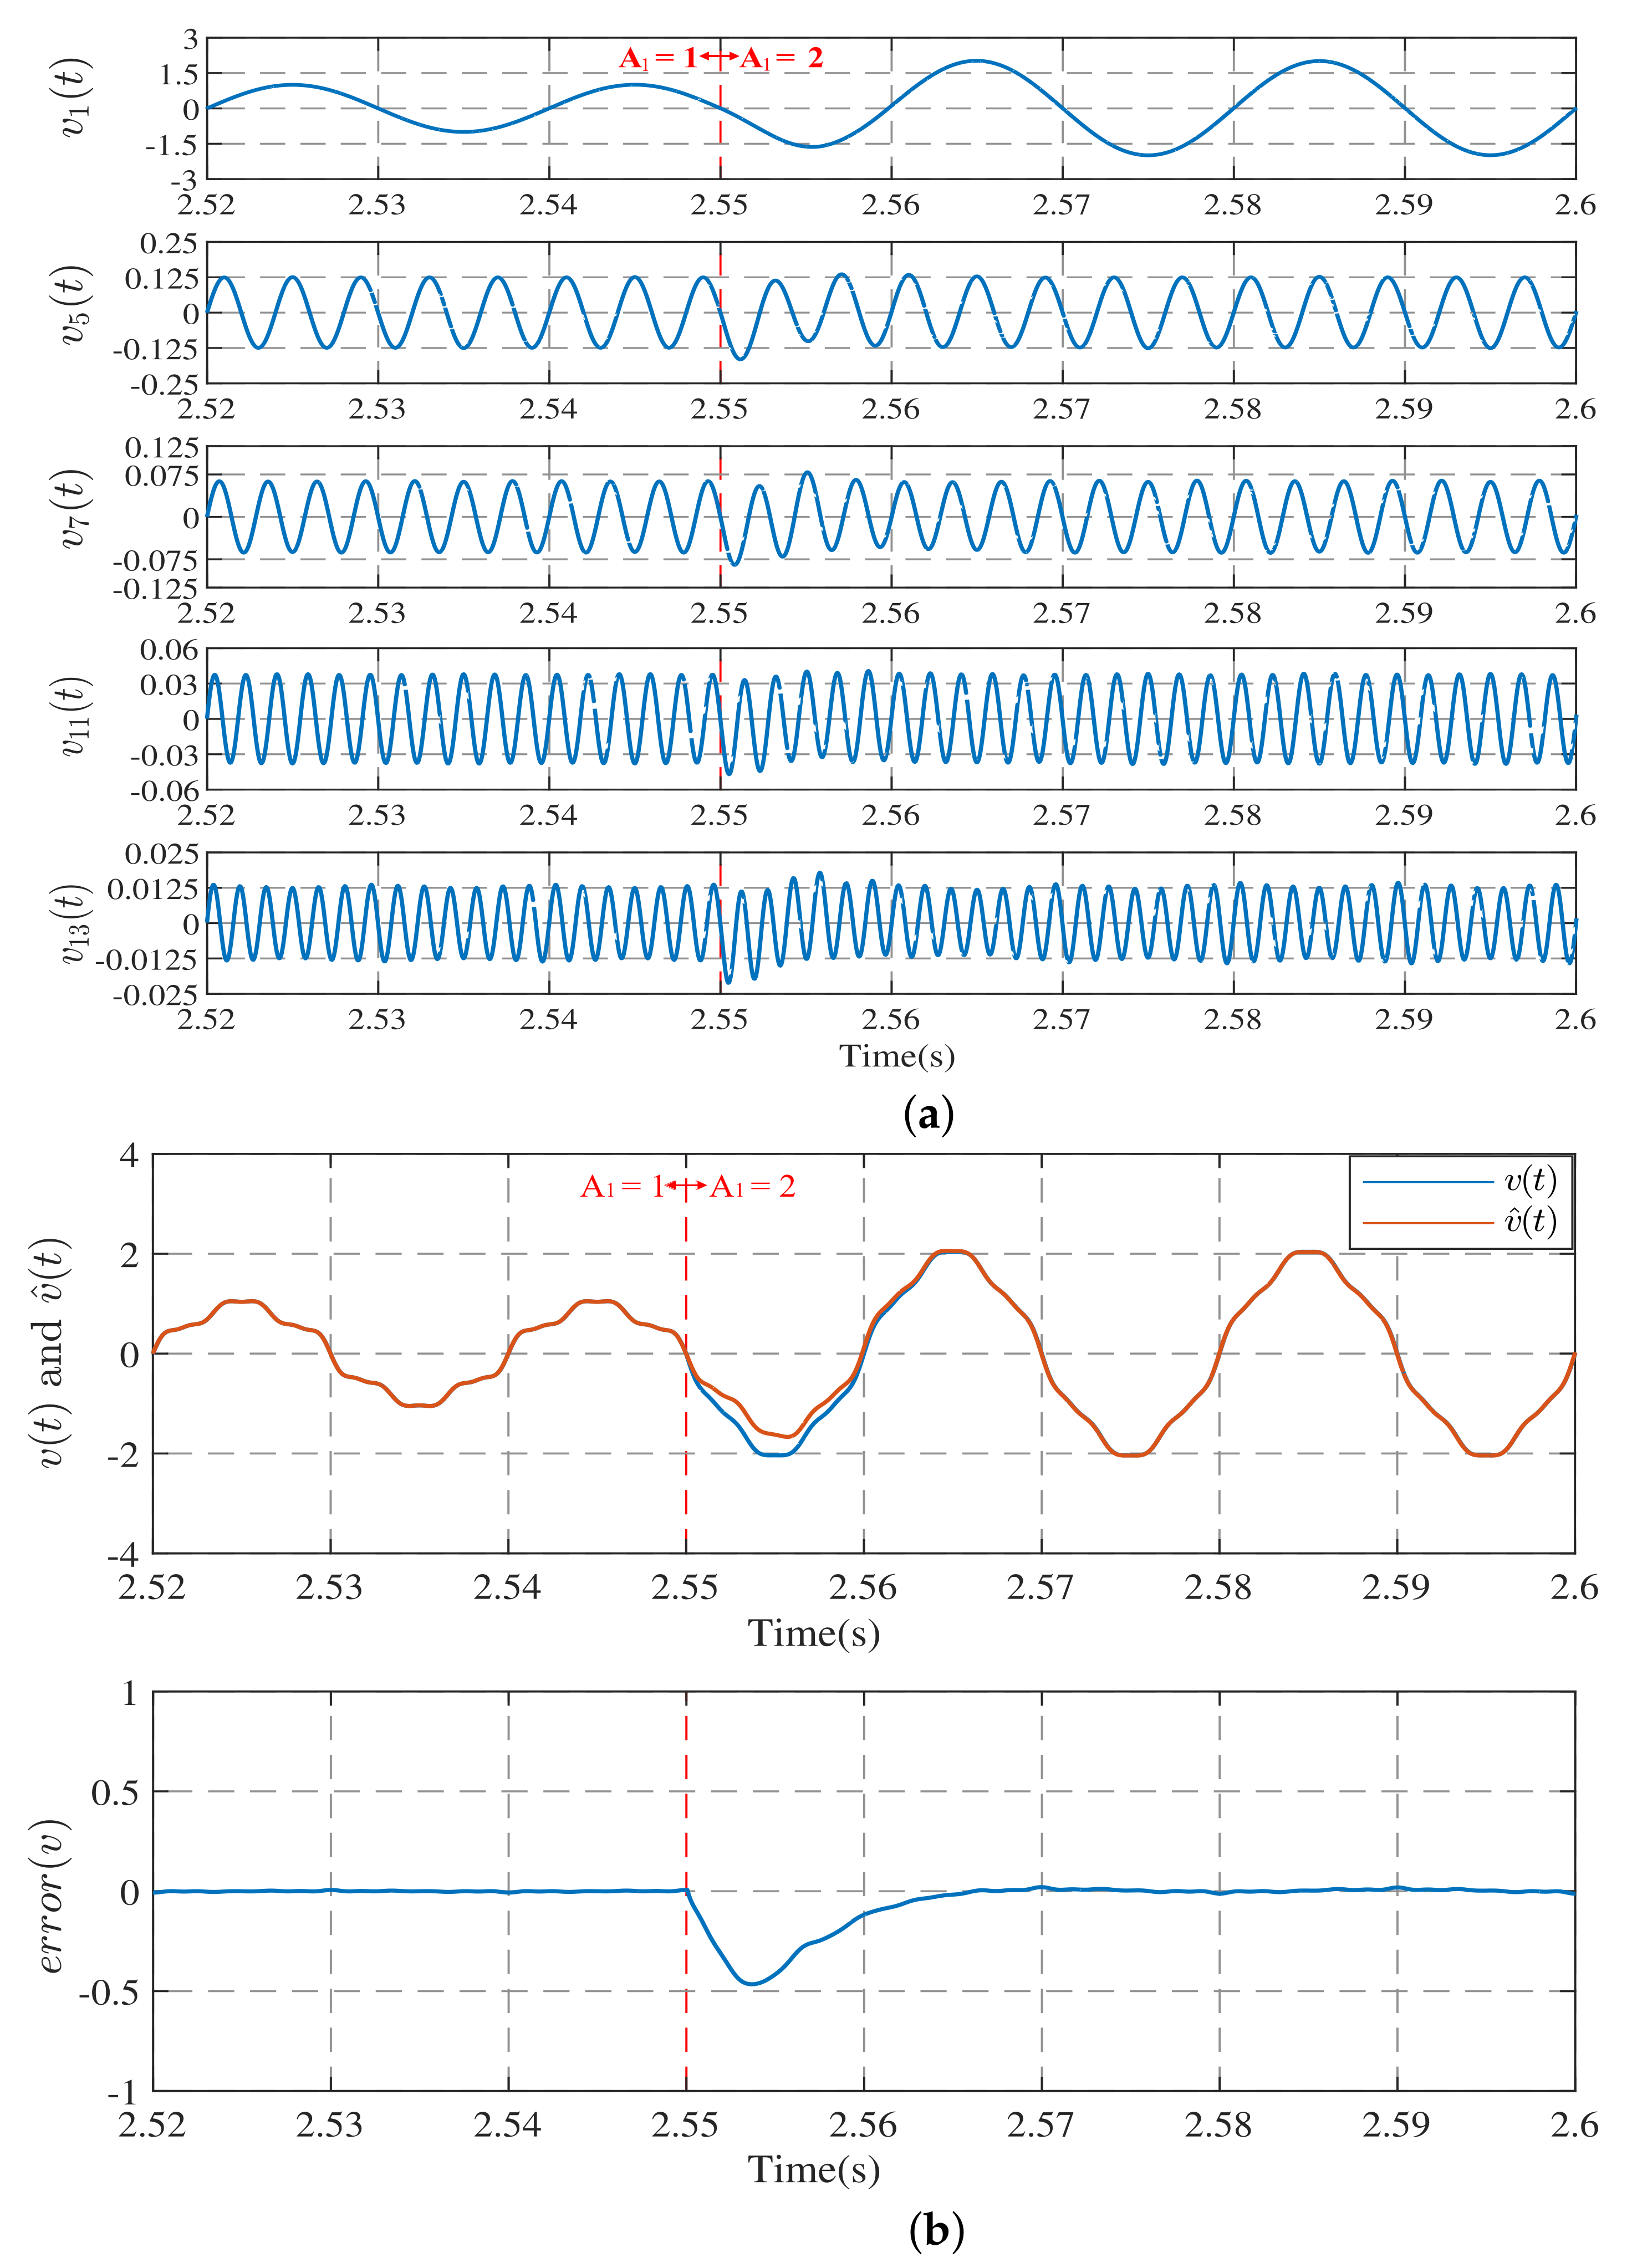
Case 1. Amplitude fluctuations of the fundamental wave from 1 V to 2 V at 2.55 s.
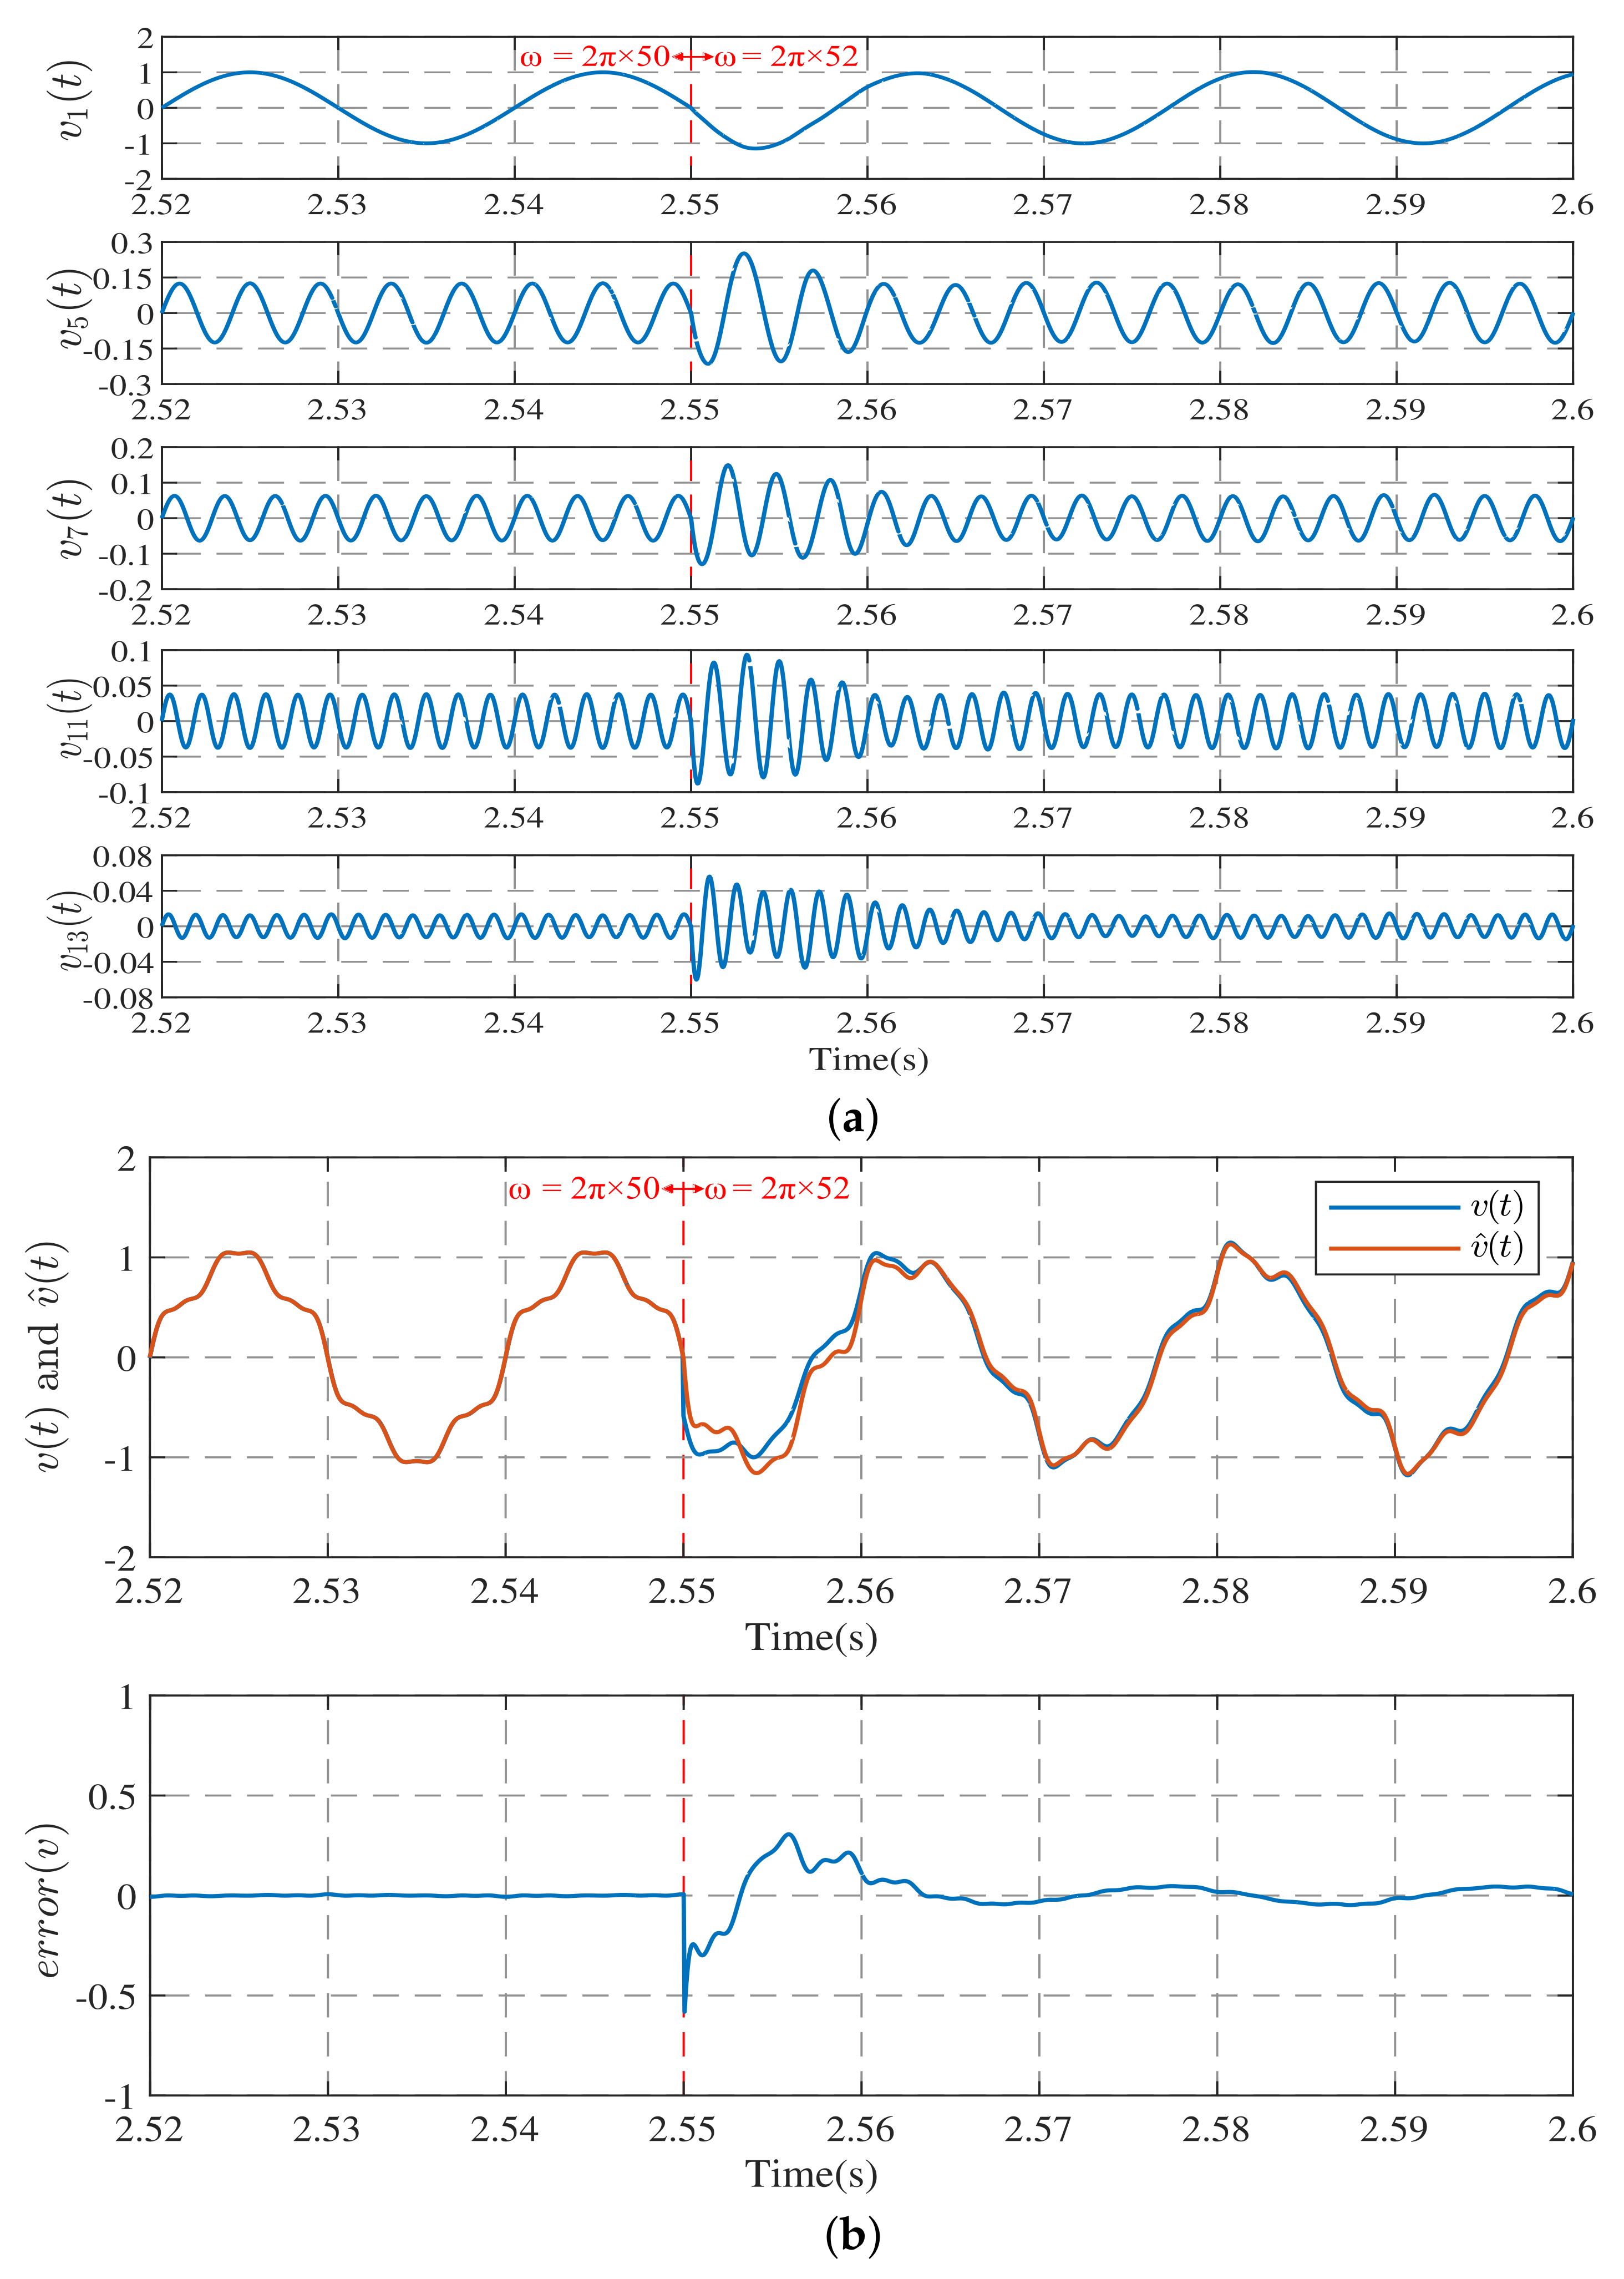
Case 2. Frequency fluctuation ω = 2 π × 52 at 2.55 s.
Case 3. Phase fluctuation of the fundamental wave from 0 to π / 25 at 2.55s.
Case 4. A noise signal with an SNR of 17 db is added to the original signal when Case 1 occurs.
Figure 6 shows the process of the re-convergence of the observer and the change in the error curve. As can be seen from Figure 6a, when the fundamental wave of the signal changes, the harmonic components from the observer fluctuate obviously, but they can be stabilized again quickly. Figure 6b shows the comparison between the input signal and the observed signal, and it can be seen that the waveforms are the same before 2.55 s. After the change in amplitude, because the result obtained by the observer is based on the information of the previous period, it will be quite different from the actual value, but it can also achieve fast convergence and re-track the observed signal. According to the error curve shown in Figure 6b, we can see that the whole convergence process can be completed in 20 ms.
Figure 7 shows the effect of harmonic detection when the fundamental frequency of the signal is changed. It can be seen through Figure 7a that the observer results undergo a more pronounced jitter than in Case 1 when the fundamental frequency changes, and this phenomenon can also be demonstrated through Figure 7b, as can be seen through the error curve. When the signal changes, the error between the observer results and the actual value still fluctuates to some extent, although it is able to converge to 0 within 20 ms. The reason for this phenomenon is that the observer is more dependent on the accuracy of the results of the predecessor’s frequency detection algorithm.
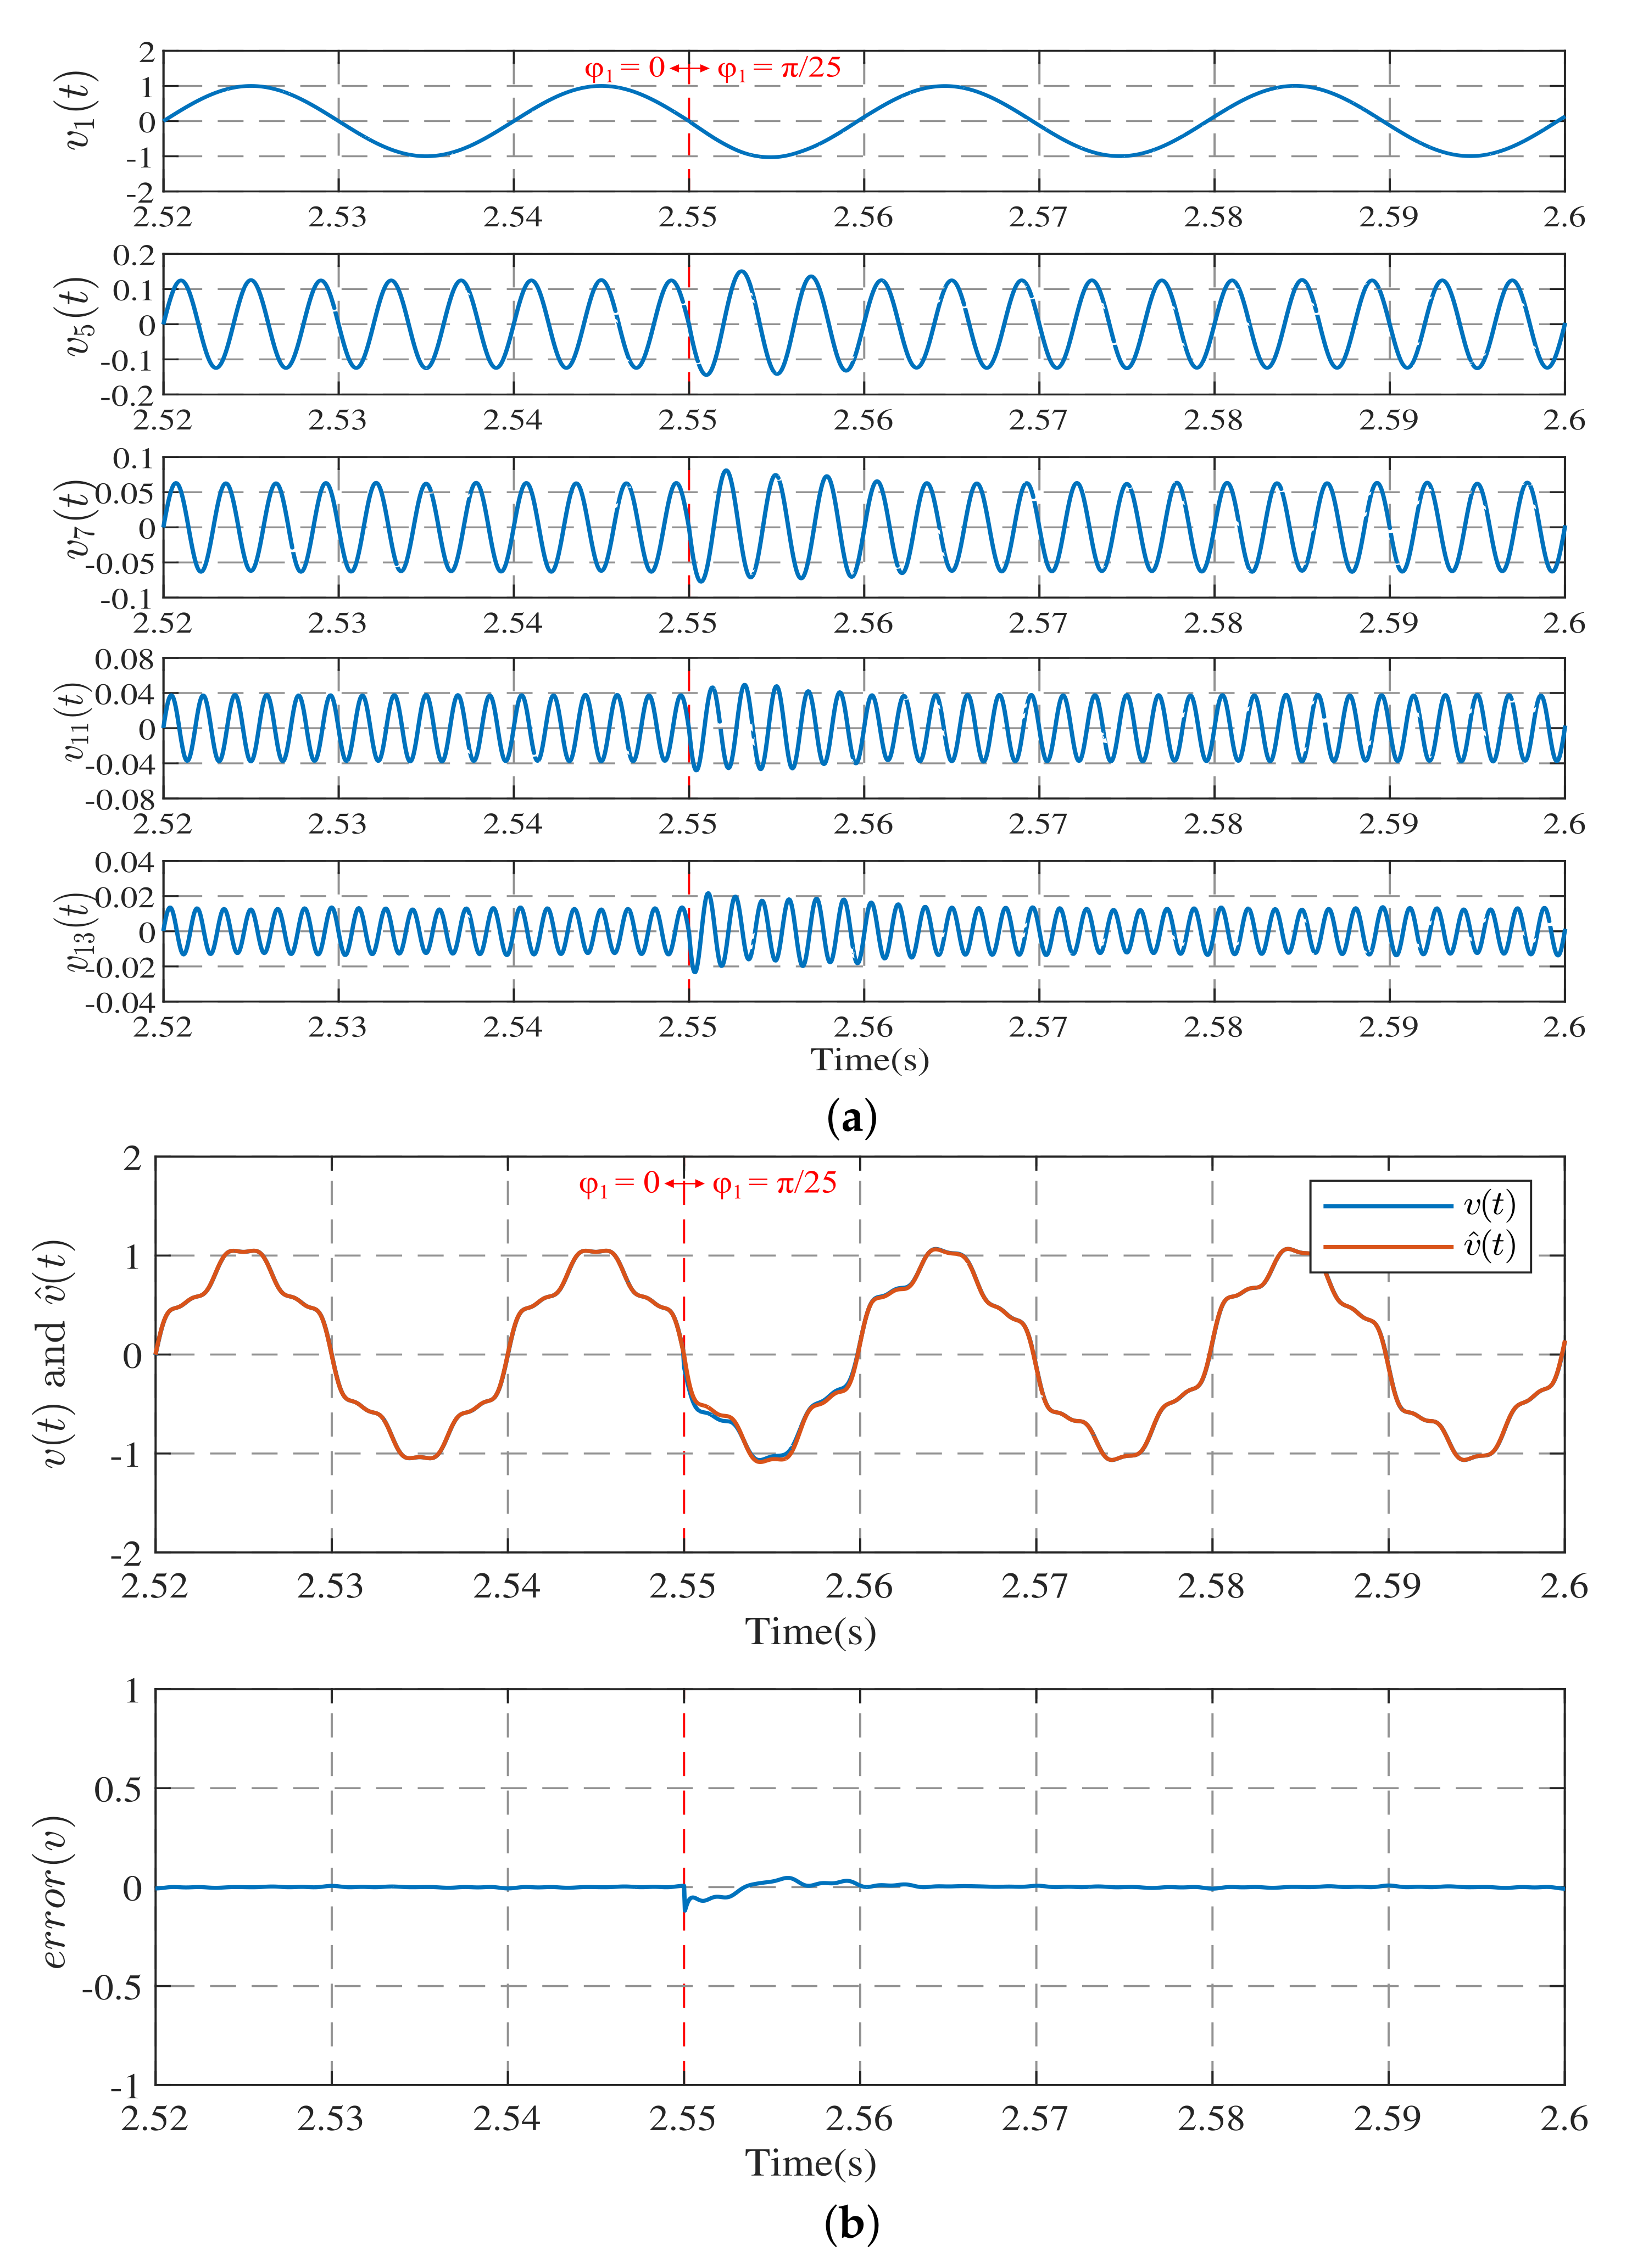
As can be seen in Figure 8, despite the existence of changes in the phase, the harmonic detection system designed in this paper can complete the observation of each harmonic within 0.02 s. Among these, the low-frequency harmonics can converge within 0.015 s and can be stabilized at 0 after convergence.
The simulation waveform for case 4 is shown in Figure 9.
In order to further verify the anti-interference capability of the harmonic detection system designed in this paper, noise with different SNRs is added to the original signal for simulation. The results obtained are shown in Table 2.
It can be seen from Figure 9 and Table 2 that even if white noise with different SNRs is added to the original signal, the system can still observe the signal quickly, indicating that the system has an acceptable anti-interference capability.

3.3. Comparison with Other Methods

In order to verify the rapidity and effectiveness of this method, the FFT harmonic detection method and the three-consecutive-sample (3CS) frequency estimation method were also selected for comparison in this paper.

3.3.1. Comparison with FFT

The FFT analysis results were calculated using the FFT analysis module in MATLAB/Simulink. We used the FFT algorithm and observer method to compare and analyze the detection results of the experimental signal within 2.8 s of the steady state situation. We used the conditions of Case 2 as a means of verifying the accuracy of the model designed in this paper. The results obtained are shown in Table 3.
As can be seen from Table 3, although the accuracy of the harmonic observation system designed in this paper is slightly lower than that of the FFT method, the relative error with respect to the set value is smaller. Thus, the design of this paper can be considered to be of high accuracy.

3.3.2. Comparison with 3CS Frequency Estimation Method

This paper also attempts to connect the other frequency estimation method to the observer model with the aim of verifying that the chosen SOGI frequency estimation method has better fitness. Ref. [31] The 3CS method was chosen to verify that the design of this paper has a faster convergence speed.
A comparative analysis of the detection results under the conditions of Case 1, 2, 3, and 4.
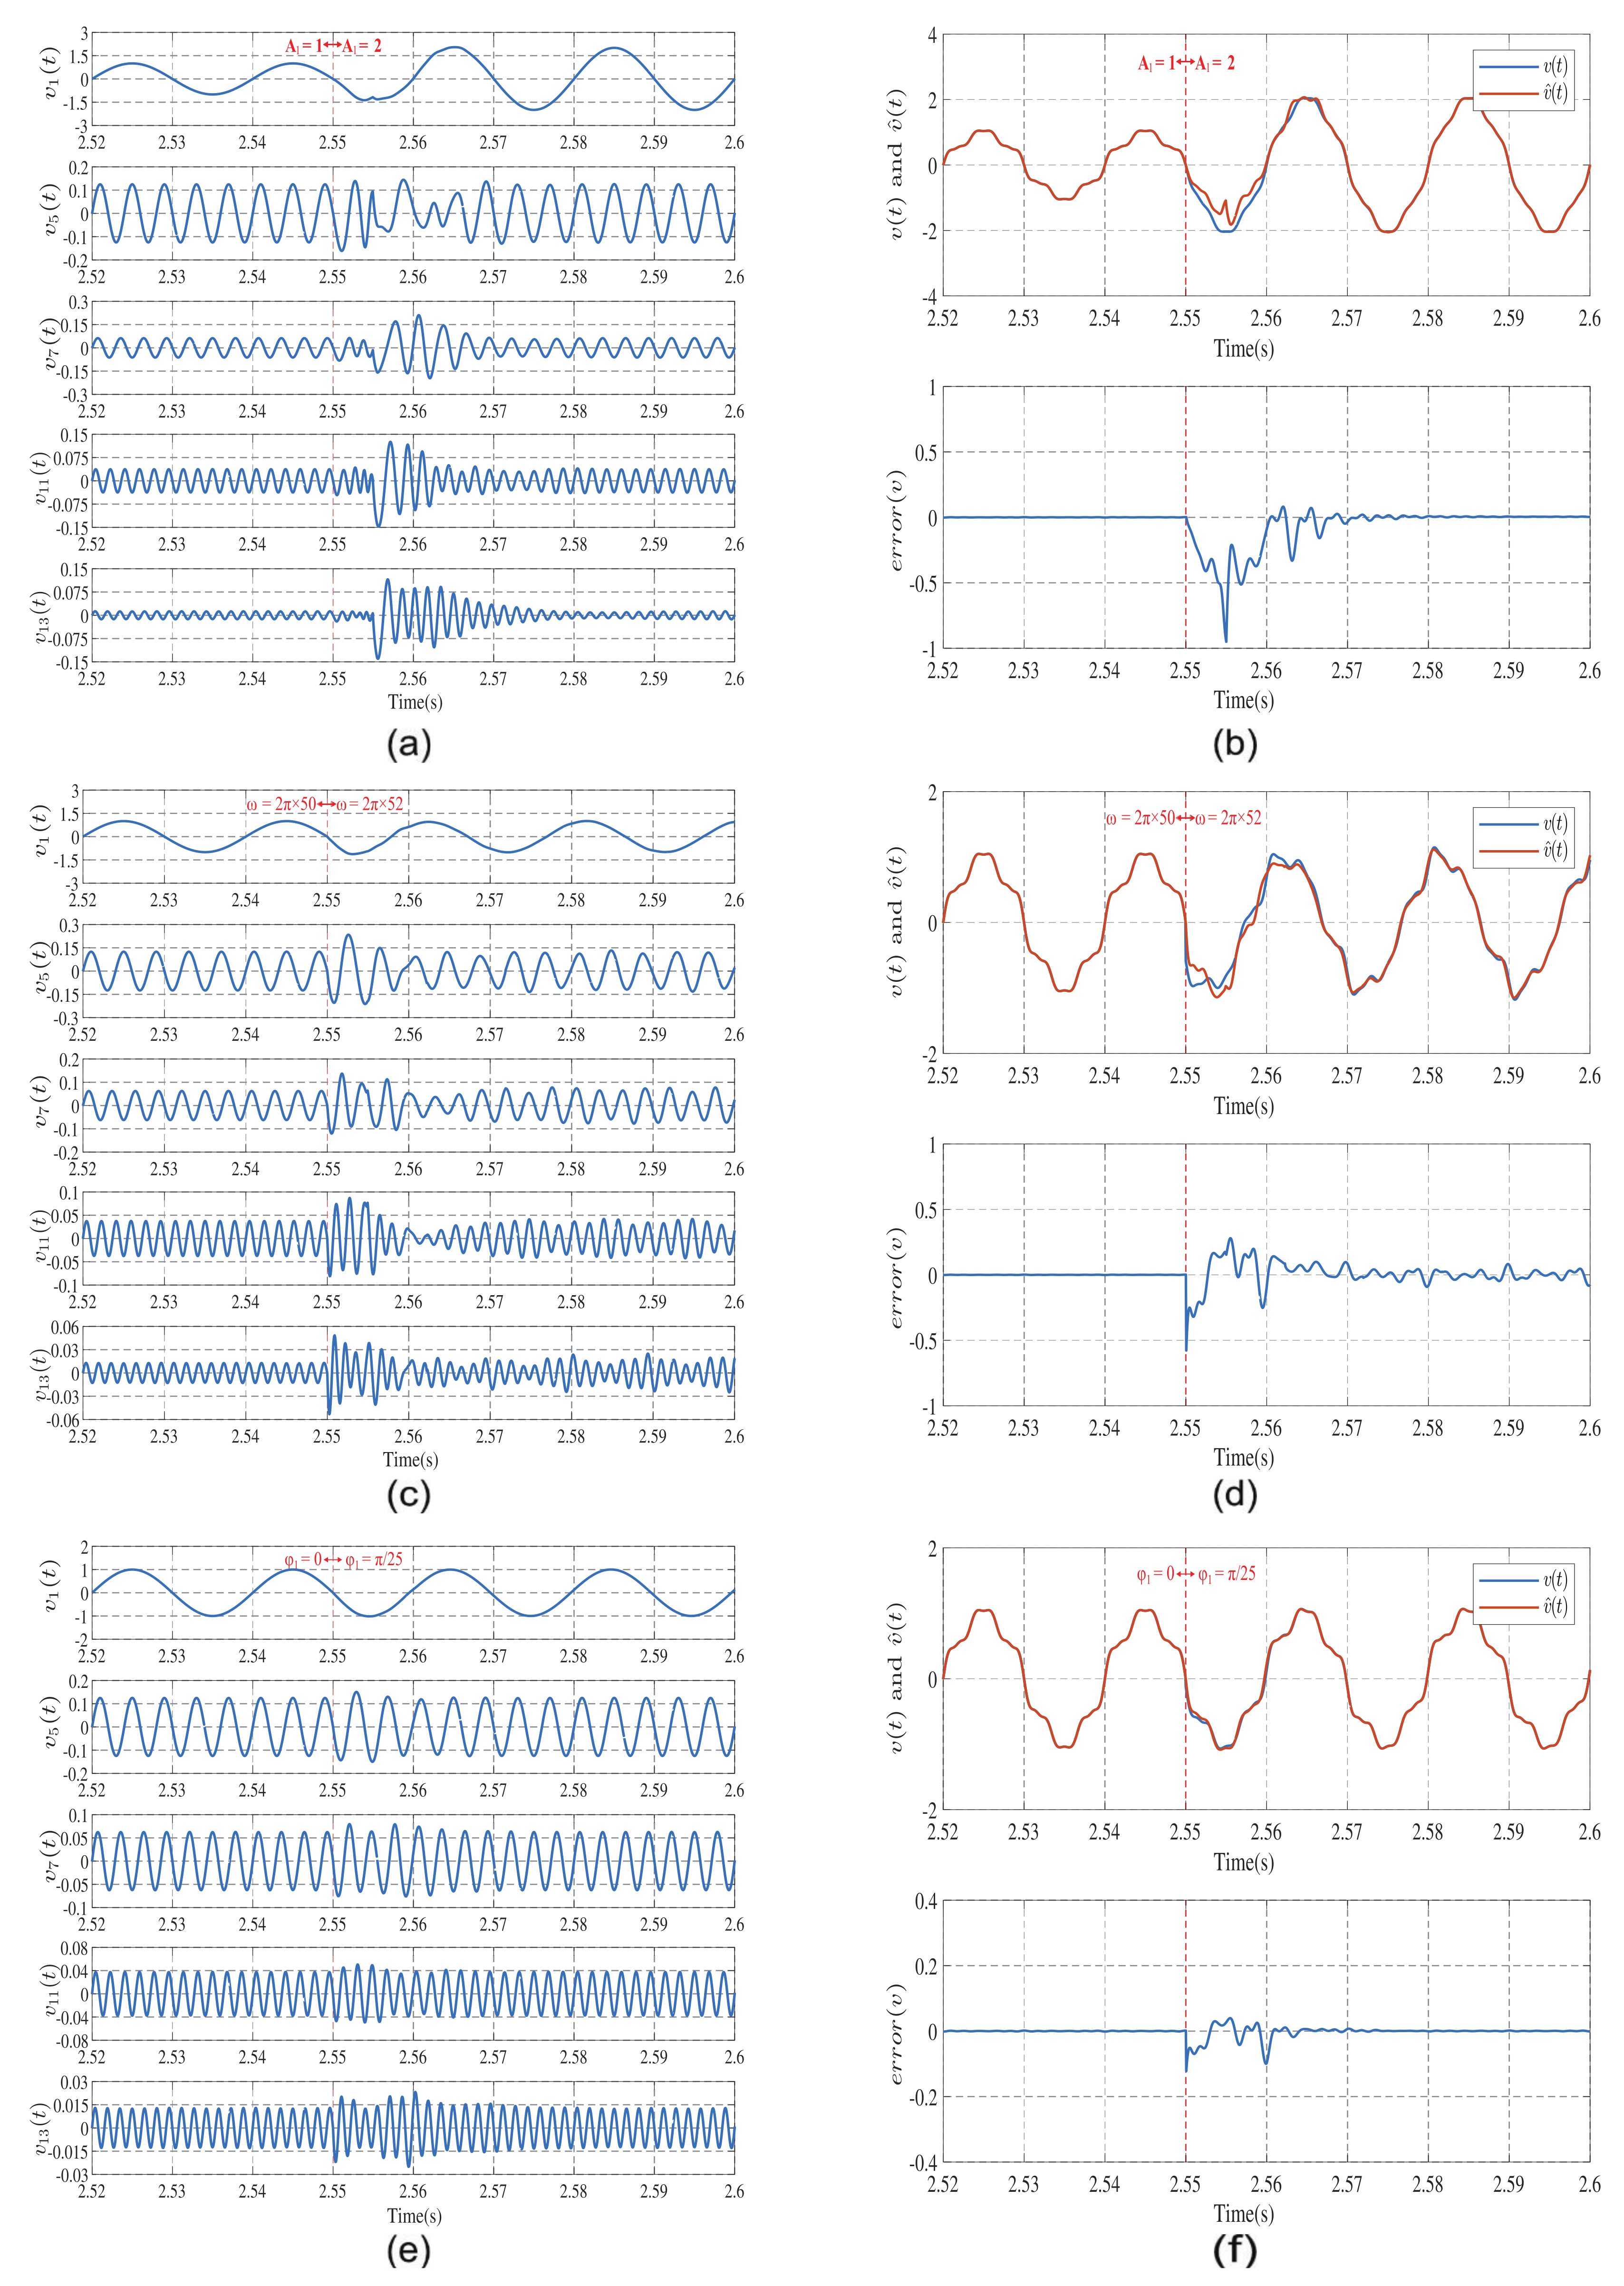
The waveforms of the harmonic detection system after simulation for Case 1, 2, and 3 are shown in Figure 10. Figure 10a,c,e shows the waveforms of the fundamental, 5th harmonic, 7th harmonic, 11th harmonic, and 13th harmonic before and after the jump detected by the harmonic detection system. Figure 10b,d,f shows plots of the tracking of the original signal before and after the jump and the error.
To verify that the selected SOGI frequency estimation method has better adaptability, the triple sampling (3CS) frequency estimation method is selected to cascade with the observer model to form a new harmonic detection system (referred to as the 3CS system), and the rapidity, accuracy, and interference immunity of the above two methods are explored by simulations and experiments, respectively.
A comparative analysis of the detection results under the conditions of Case 1, 2, 3, and 4. The waveforms of the harmonic detection system after simulation for Case 1, 2, and 3 are shown in Figure 10.
As can be seen from Figure 10, the harmonic detection system of the cascaded 3CS frequency estimation method requires 0.02–0.025 s to converge. In contrast, the harmonic observation system designed in this paper can converge in 0.02 s—i.e., the design in this paper has faster performance. Furthermore, the 3CS system converges with some fluctuations, and the comparison shows that the stability is not as good as that of the harmonic detection system designed in this paper.
The simulation waveform for Case 4 is shown in Figure 11.
White noise with different SNRs was taken for simulation and the results obtained are shown in Table 4.
It can be seen from Figure 11 and Table 4 that the 3CS system error RMS is larger—i.e., more affected—at the same SNR. In contrast, the system designed in this paper has better interference immunity.

4. Experiment

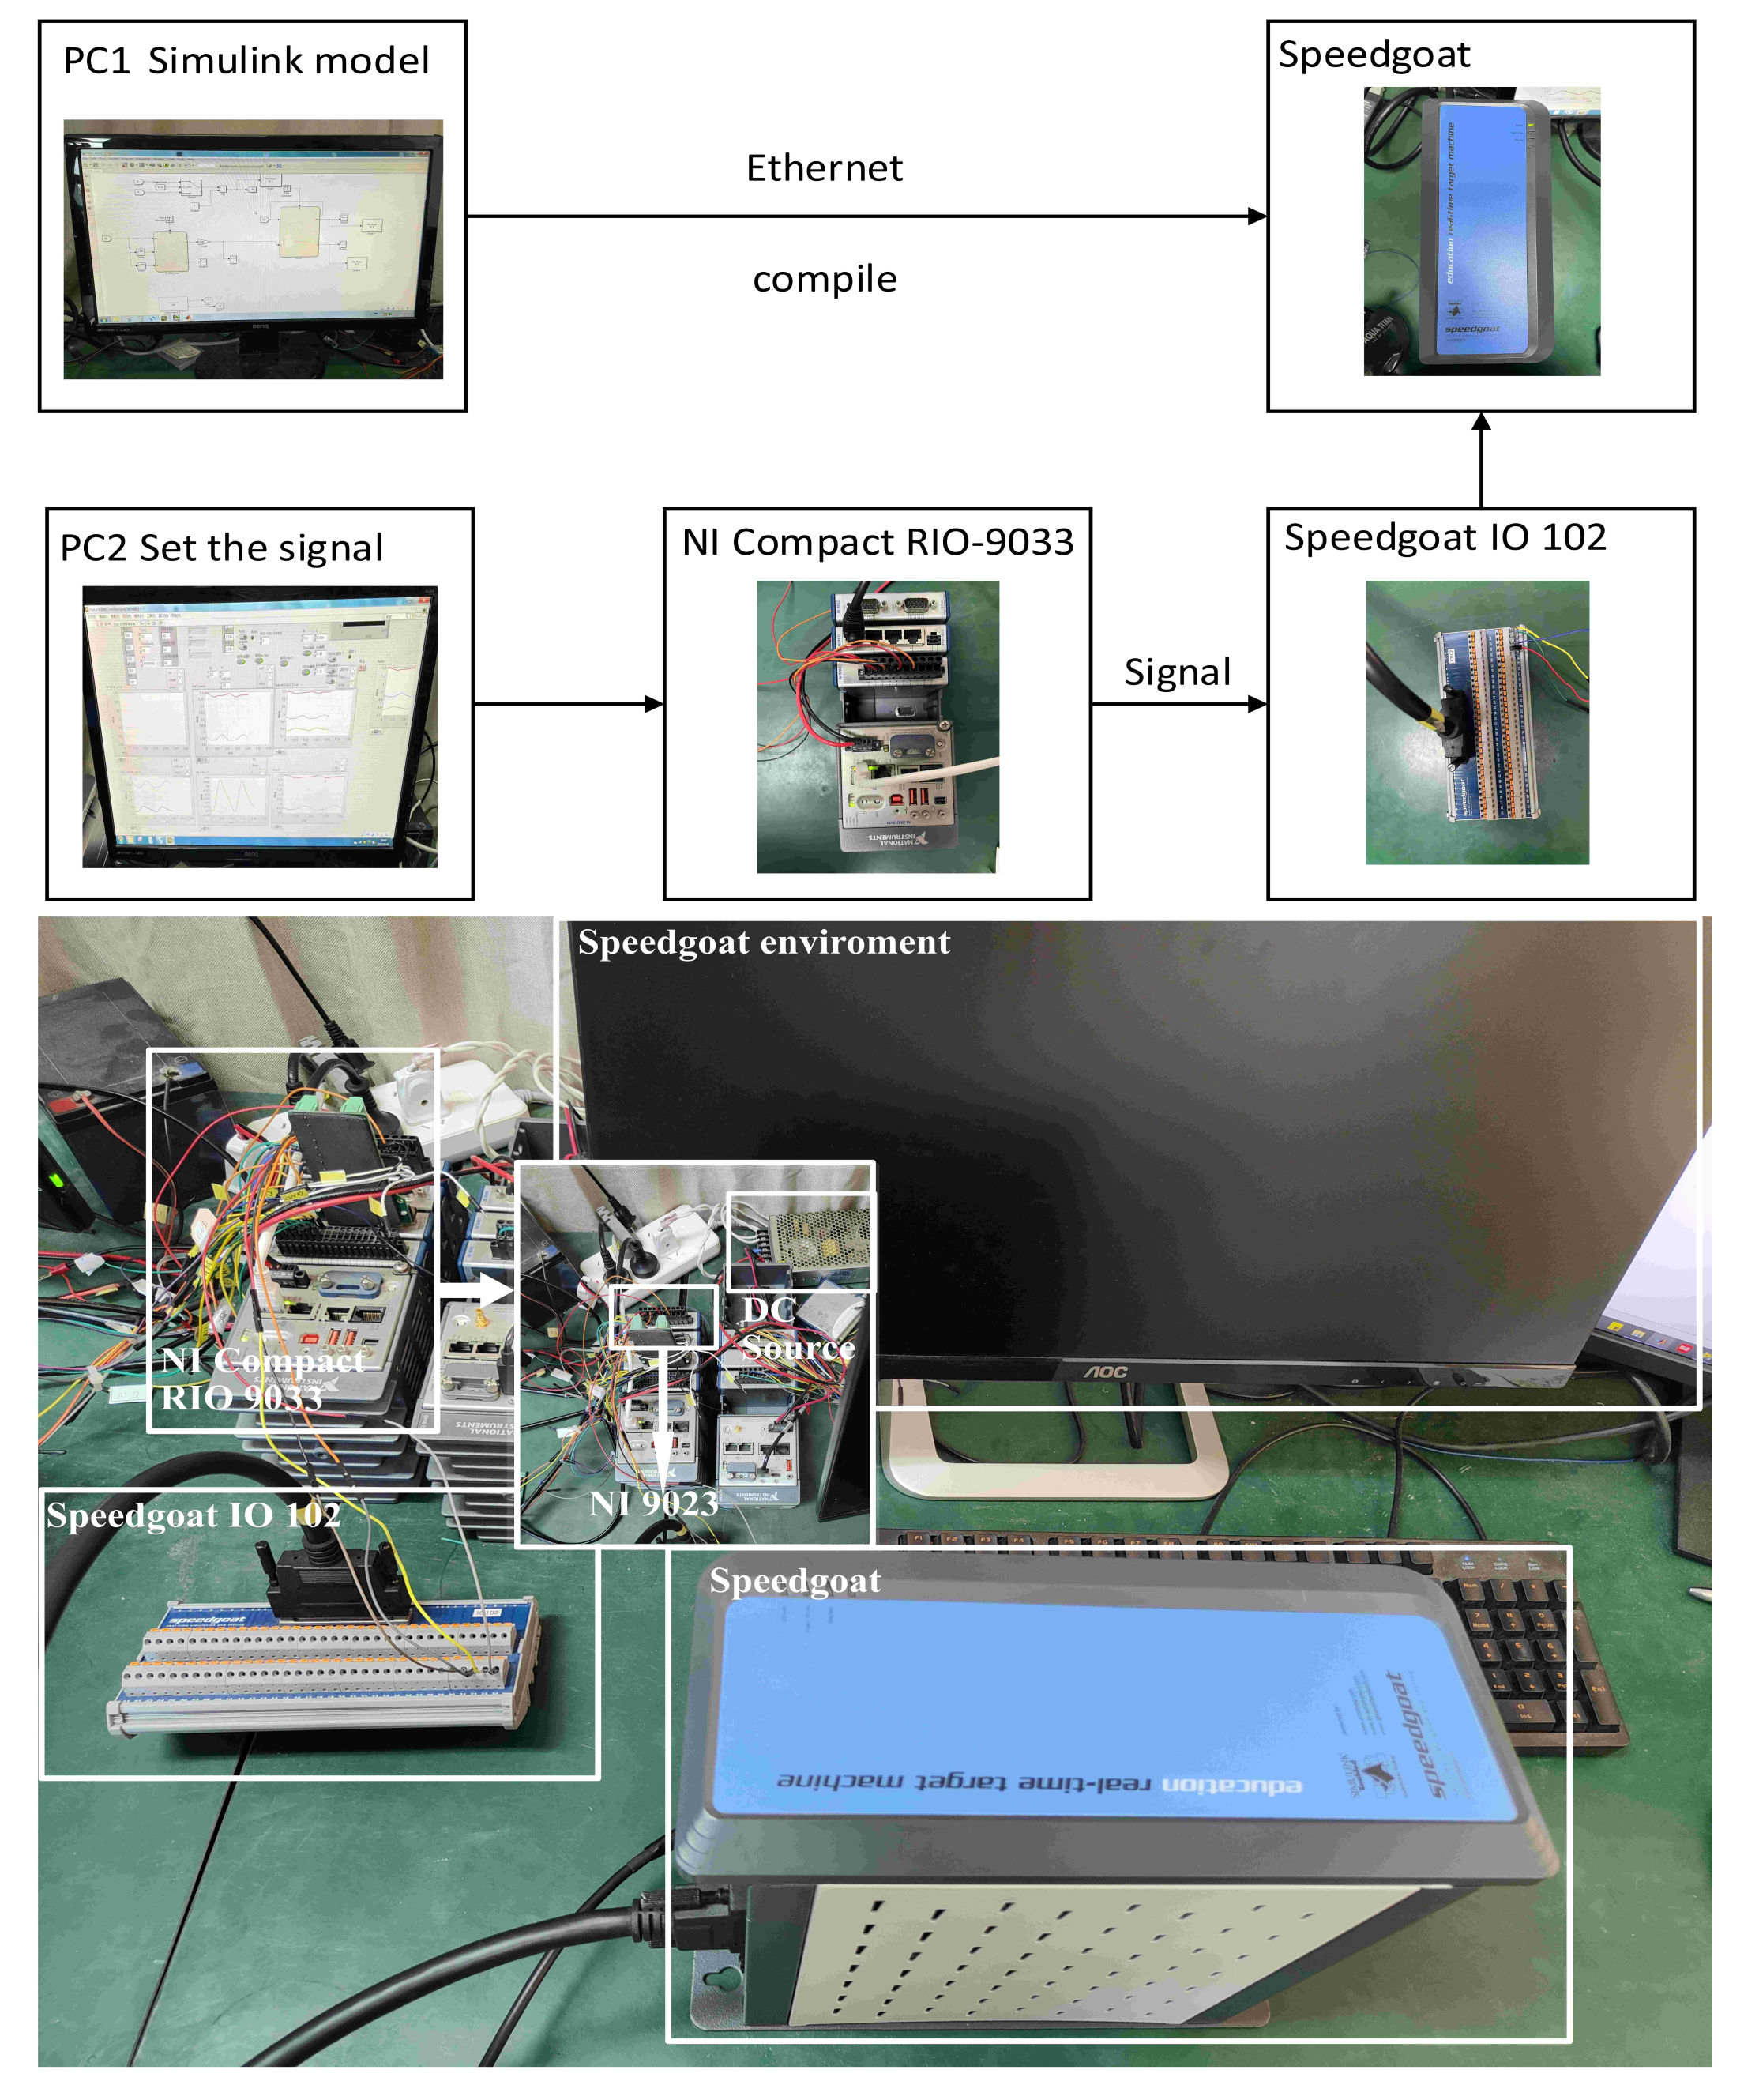
In order to further verify the effectiveness of the harmonic detection method proposed in this paper, this part will be tested on the Speedgoat experimental platform. The experimental platform is shown in Figure 12. The platform consists of three parts: the host computer, the Speedgoat real-time target machine, and the NICompactRIO-9033. The SIMULINK model is first compiled to the Speedgoet real-time target via an Ethernet connection, and the signal to be tested is sent by the NI 9263, which is then fed to the real-time target via the analog input port of the I0 102 board.

4.1. Experiment on a Harmonic Observation System with Frequency Estimation

Using the above experimental platform, the constructed observer model is tested. In order to contrast the experimental results with the simulation results, the same conditions as those in the simulation are used for the experiment. Three sets of experiments were designed to test each of the systems by combining the two frequency estimation methods. Because the amplitude fluctuation is not obvious on the experimental platform, the conditions of Case 1 have changed.
In this case, the sampling time T s = 5 × 10 5 s, with the initial input of the original signal as v = 4 s i n ω t + 0.5 s i n 5 ω t + 0.25 s i n 7 ω t + 0.125 s i n 11 ω t + 0.01 s i n 13 ω t , where ω = 2 π × 50 .
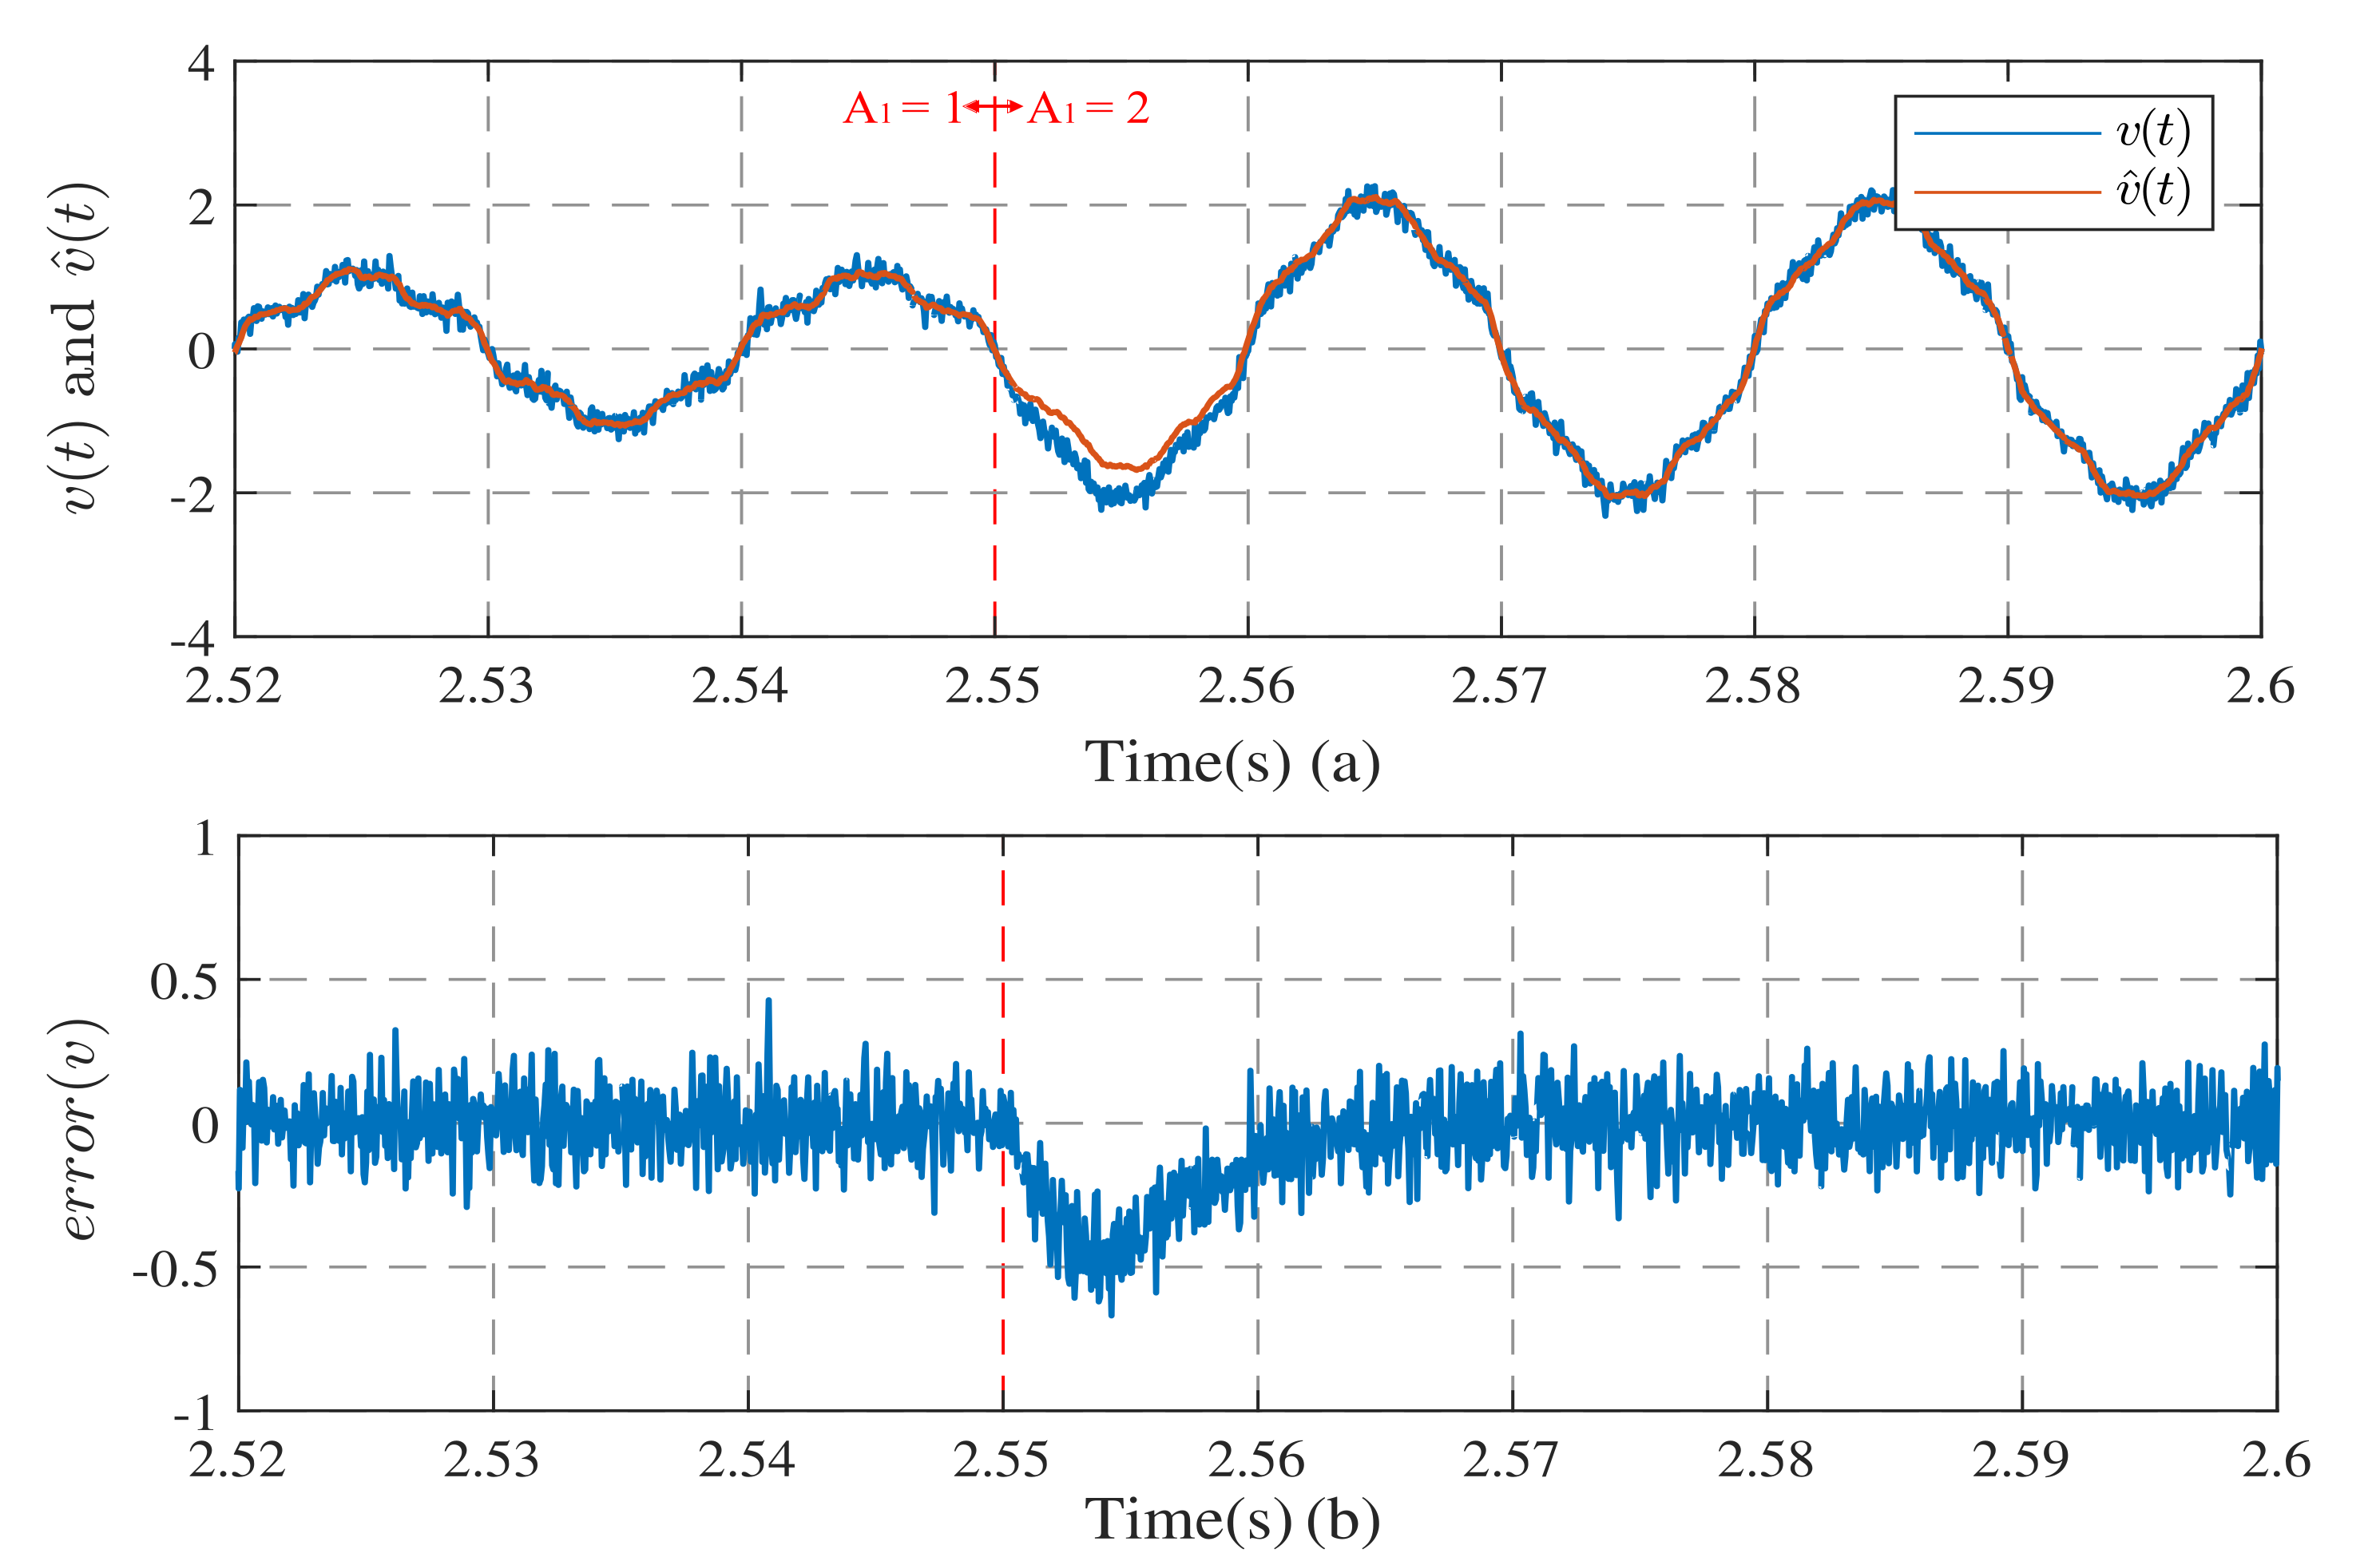
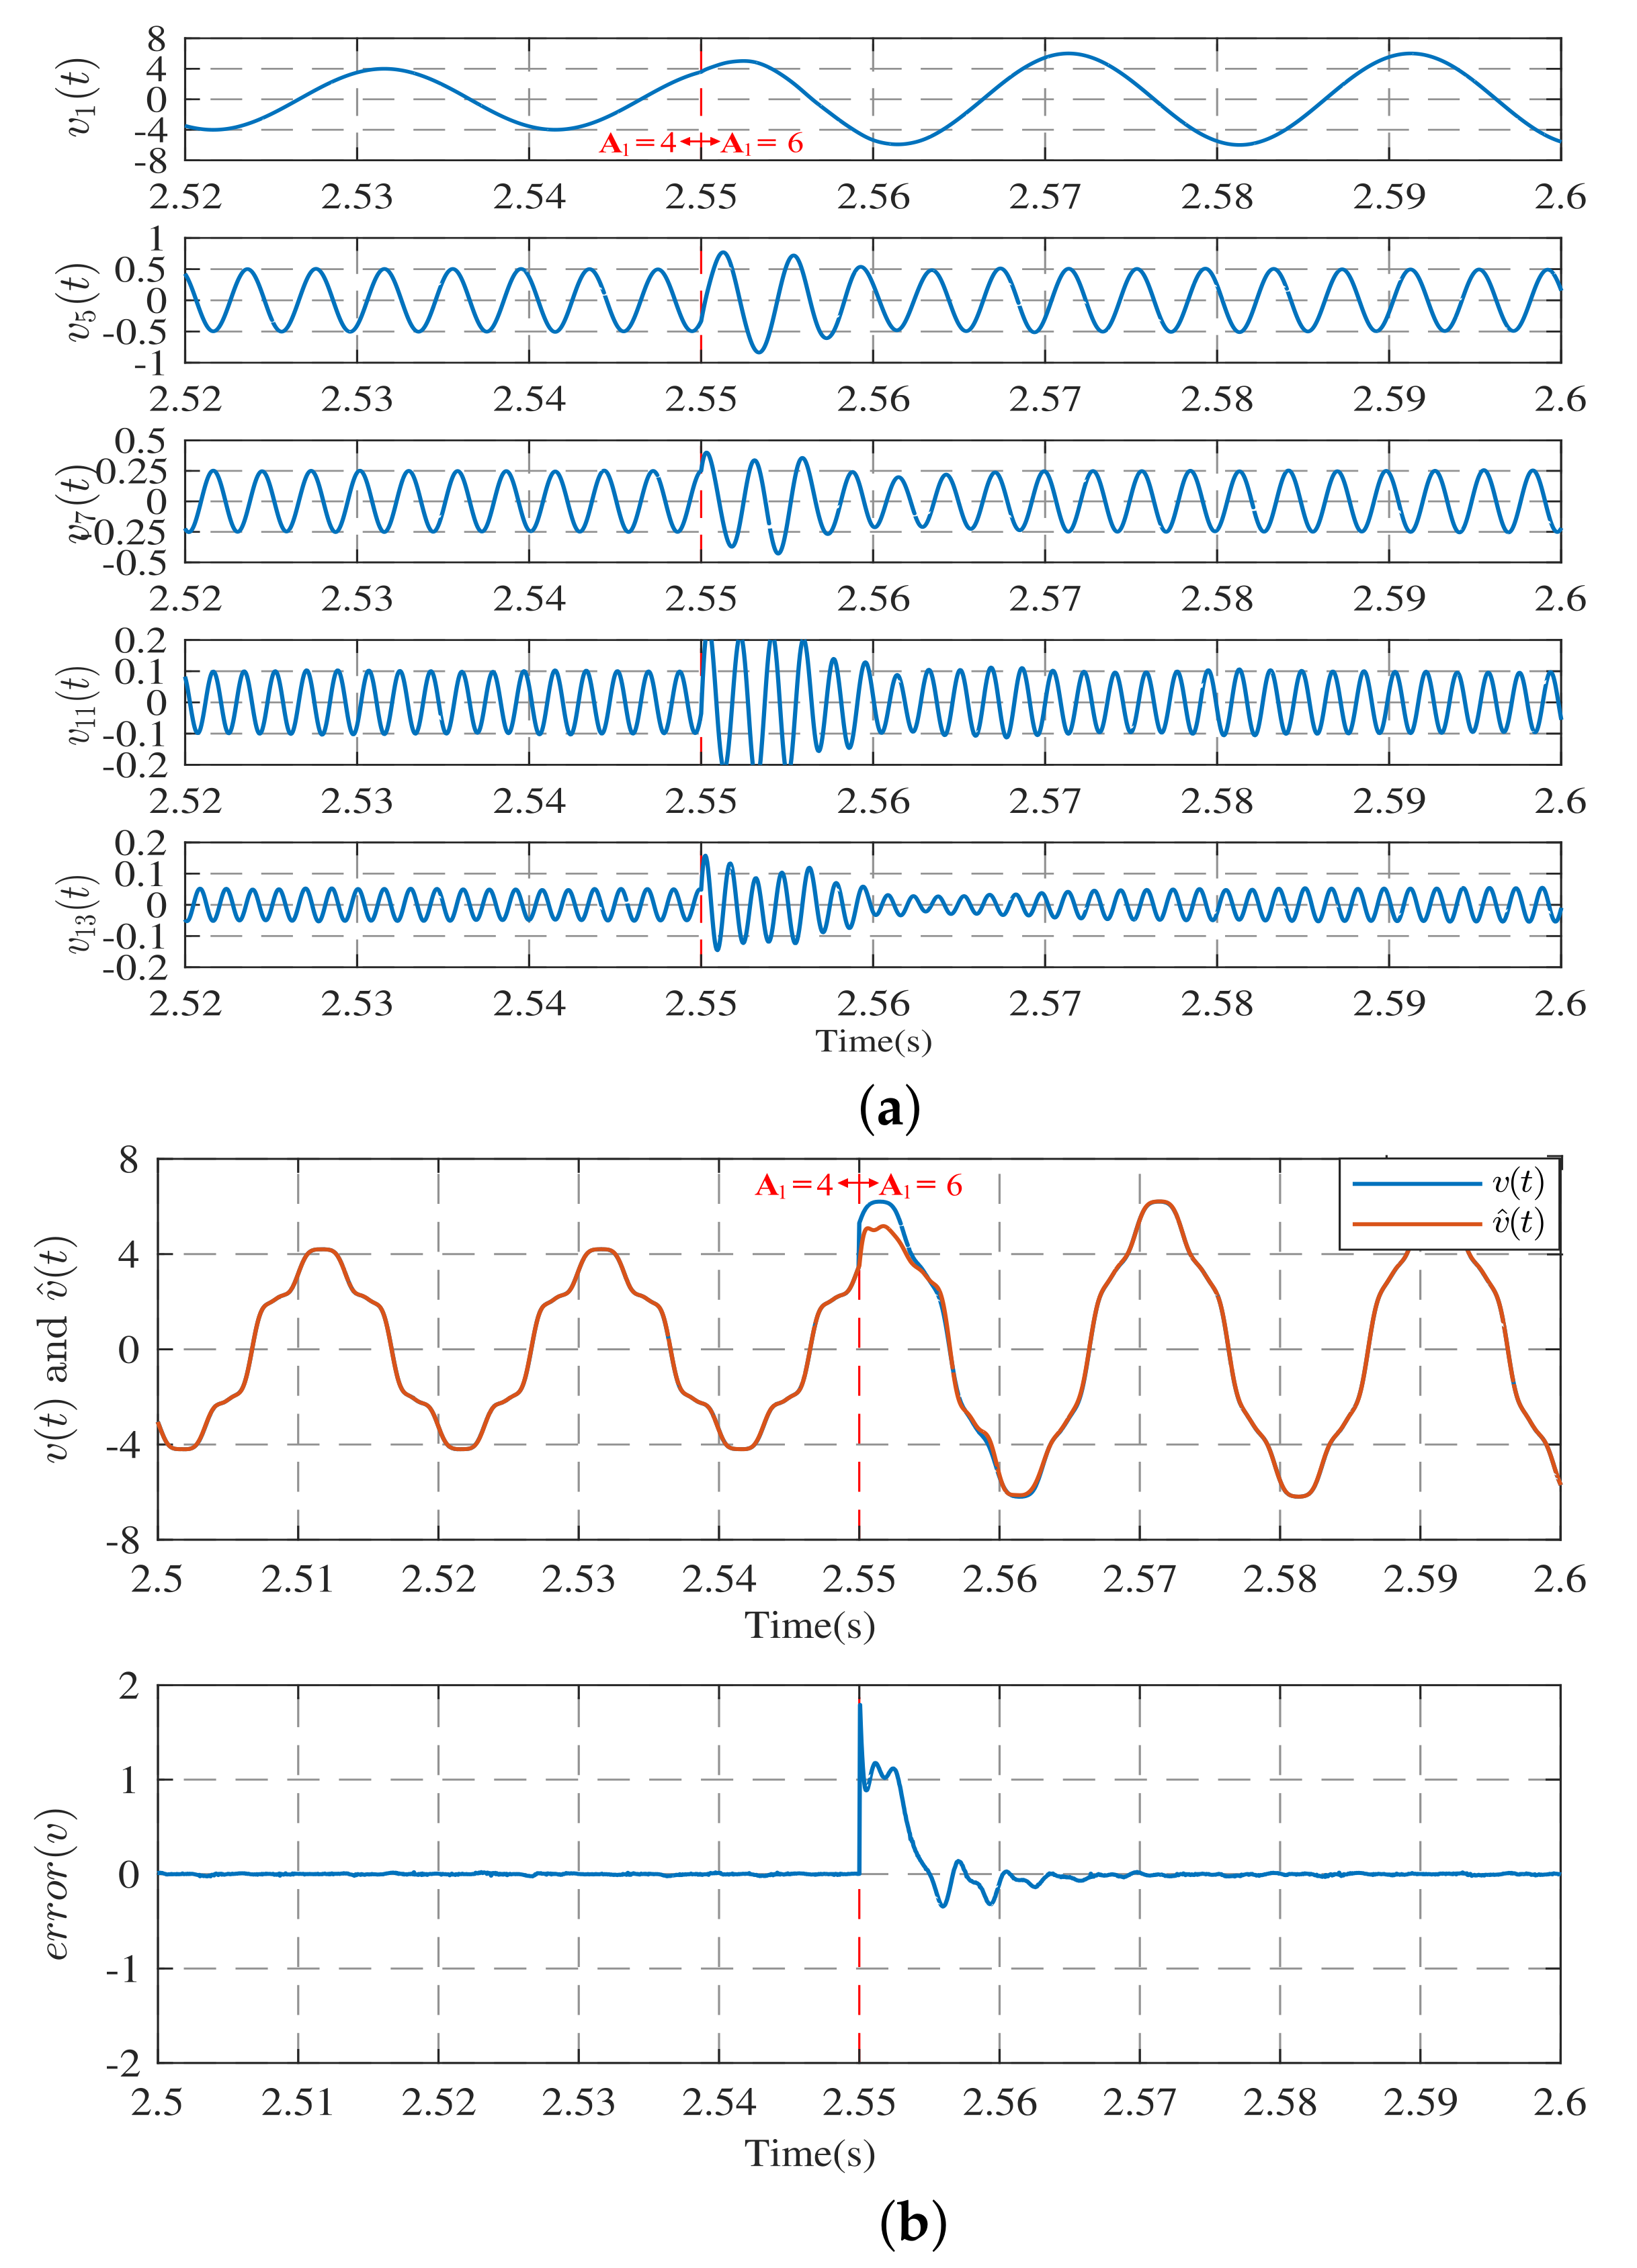
Similar to Section 3.1, the observer shows large fluctuations when the fundamental amplitude of the input signal is changed at the specified time of 2.55 s. As can be seen by the error curve in Figure 13b, after the fluctuation, the observer is able to quickly re-track the input signal and achieve convergence. The whole process can be completed within 20 ms. It is worth noting that for the specified number of observations, the higher harmonics can be stabilized quickly even after the occurrence of jitter. However, the higher the number of observations is, the longer the time required for stabilization will be.
Figure 14 shows the detection effect when there is a sudden change in the fundamental frequency of the input signal. With Figure 14, it can be seen that when the fundamental frequency changes, the detection of the higher harmonics is disturbed more than the amplitude changes and the recovery takes longer. This also proves the results of the simulation. However, for the overall signal detection effect, fast convergence can still be achieved.
Figure 15 shows the detection effect when the phase angle of the input signal fundamental changes abruptly. In Figure 15a, it can be seen that when the fundamental phase angle changes, similar to the abrupt change in fundamental frequency, the detection of higher harmonics is disturbed more, but the recovery time is faster. Through Figure 15b, it can be seen that for the overall signal detection, the error between the observed results and the actual signal is able to converge to 0 within 15 ms.
The experimental results of three sets of experiments similar to the simulation conditions are set up. The rapidity and accuracy of the harmonic detection method proposed in this paper are verified. Even when the signal fluctuation occurs in the distorted grid situation, the proposed method is still able to approach the changed signal and achieve accurate detection.

4.2. Comparison with Other Methods

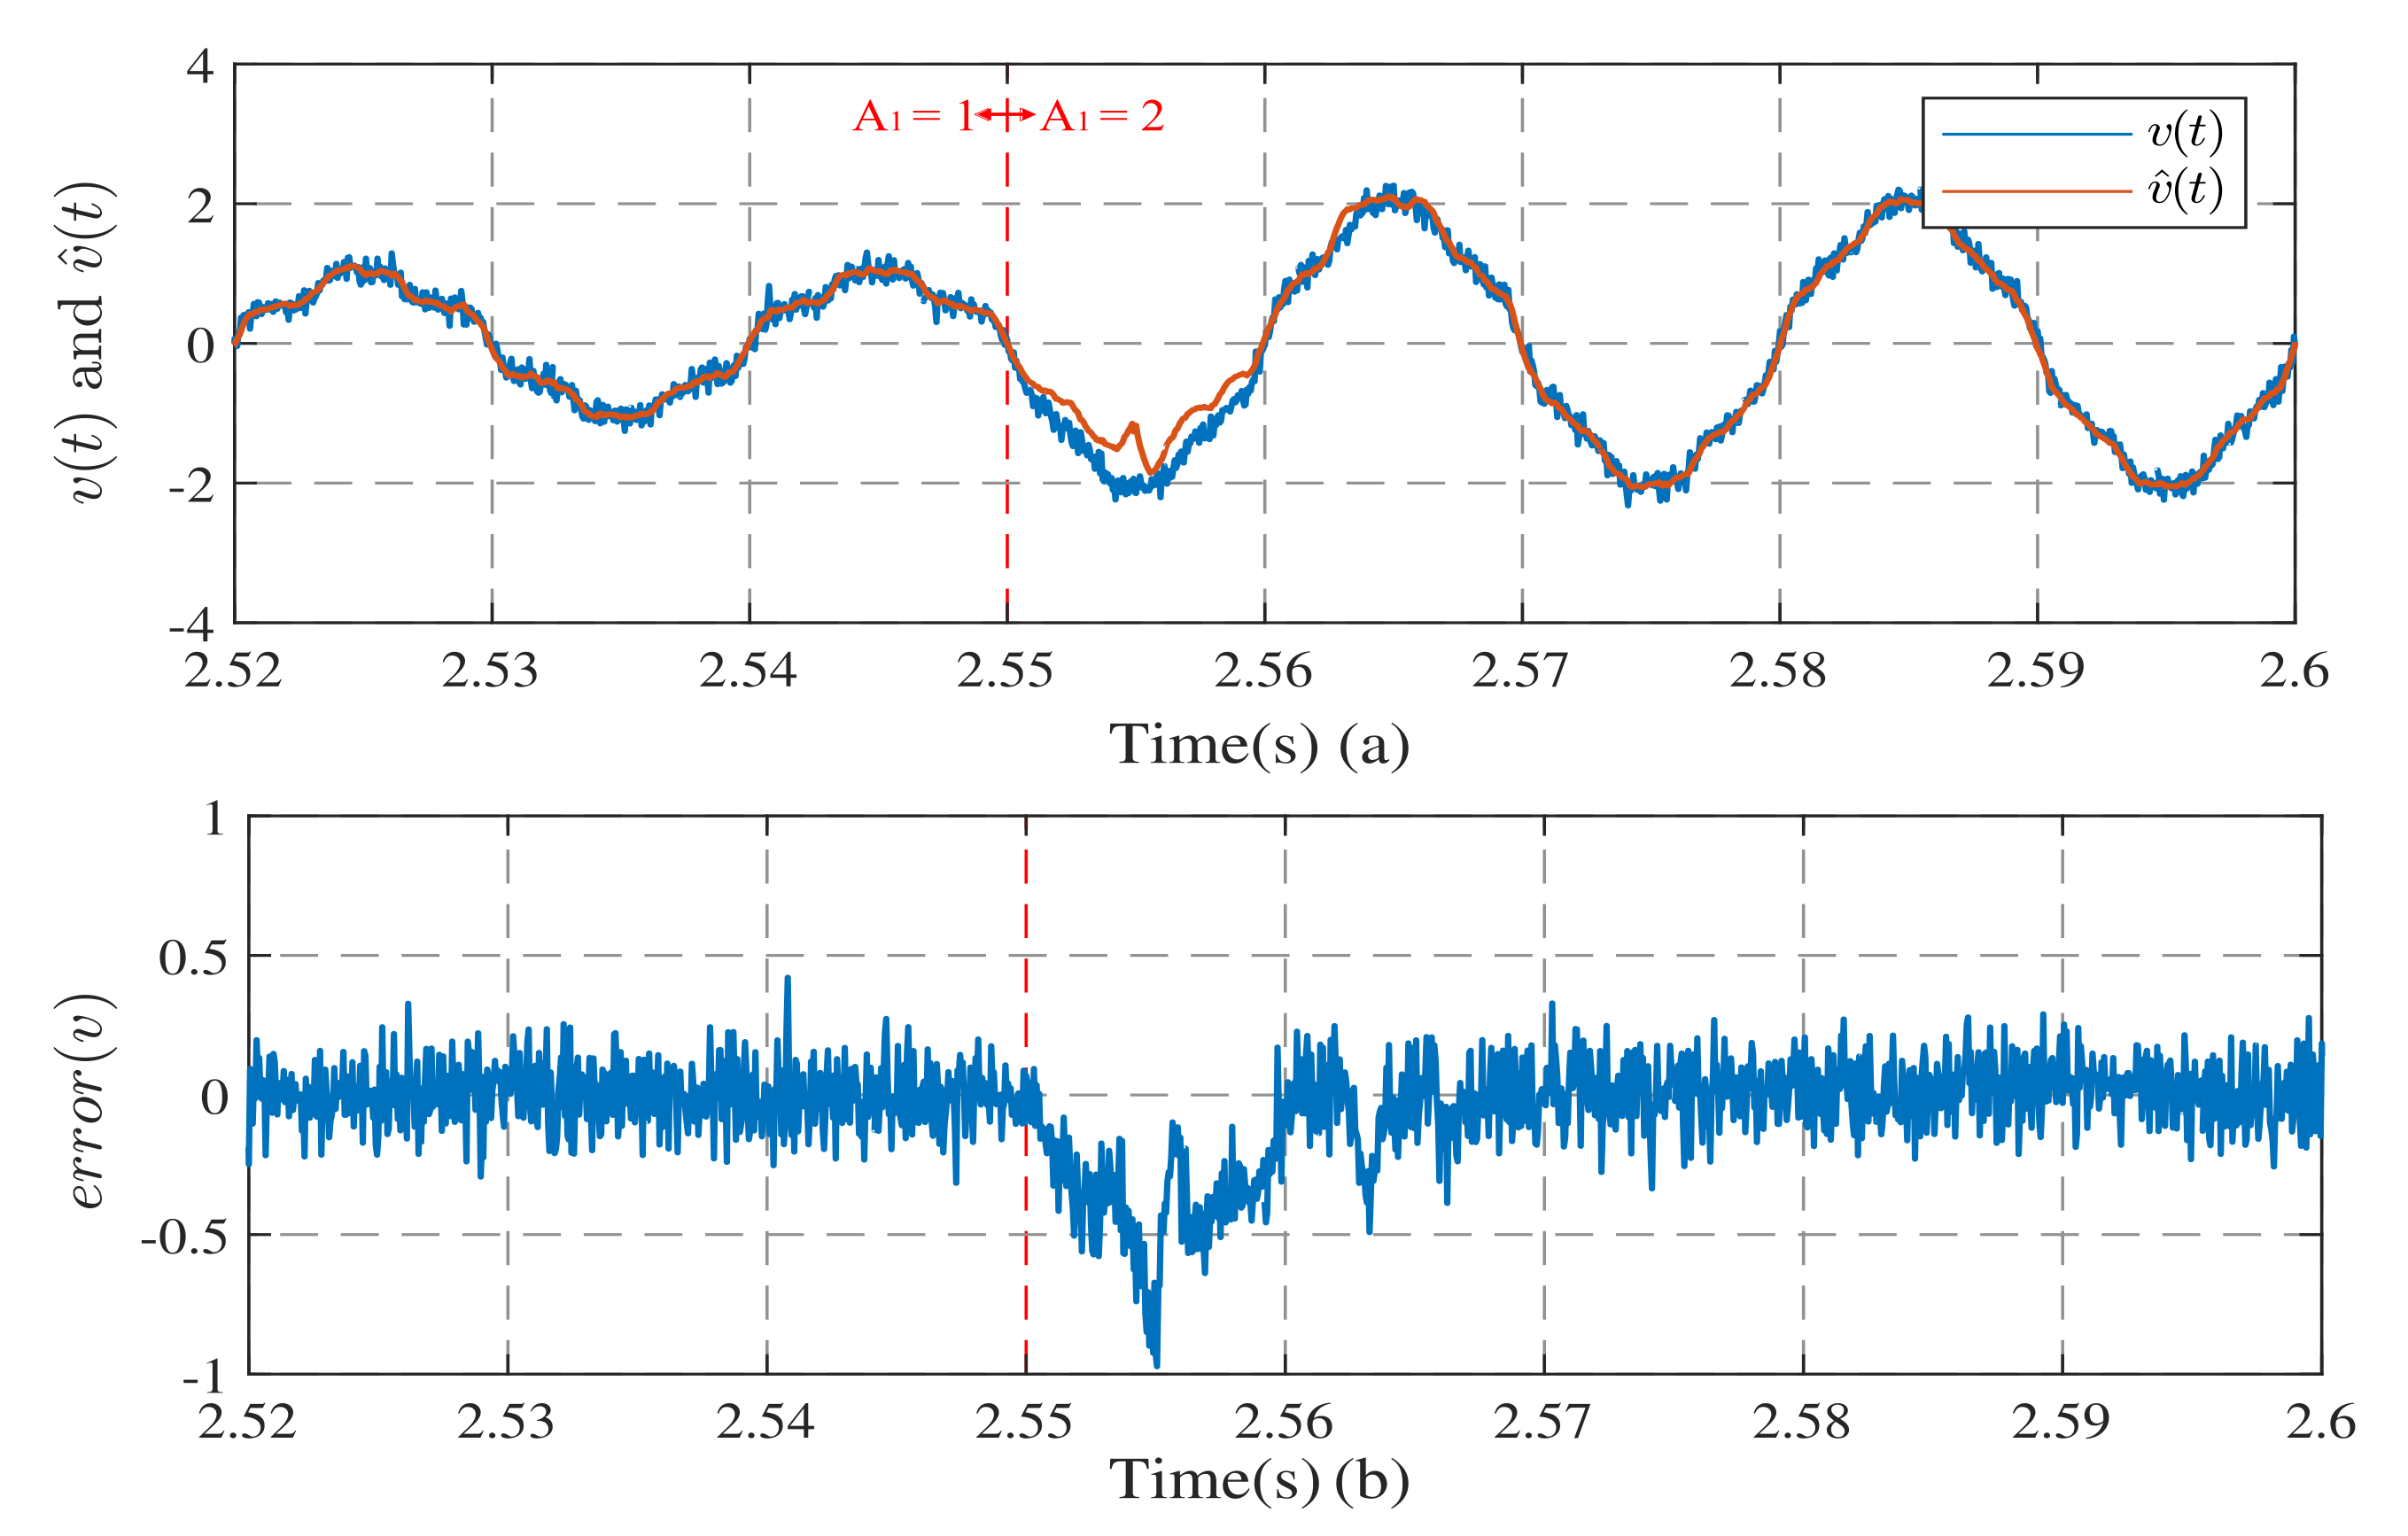
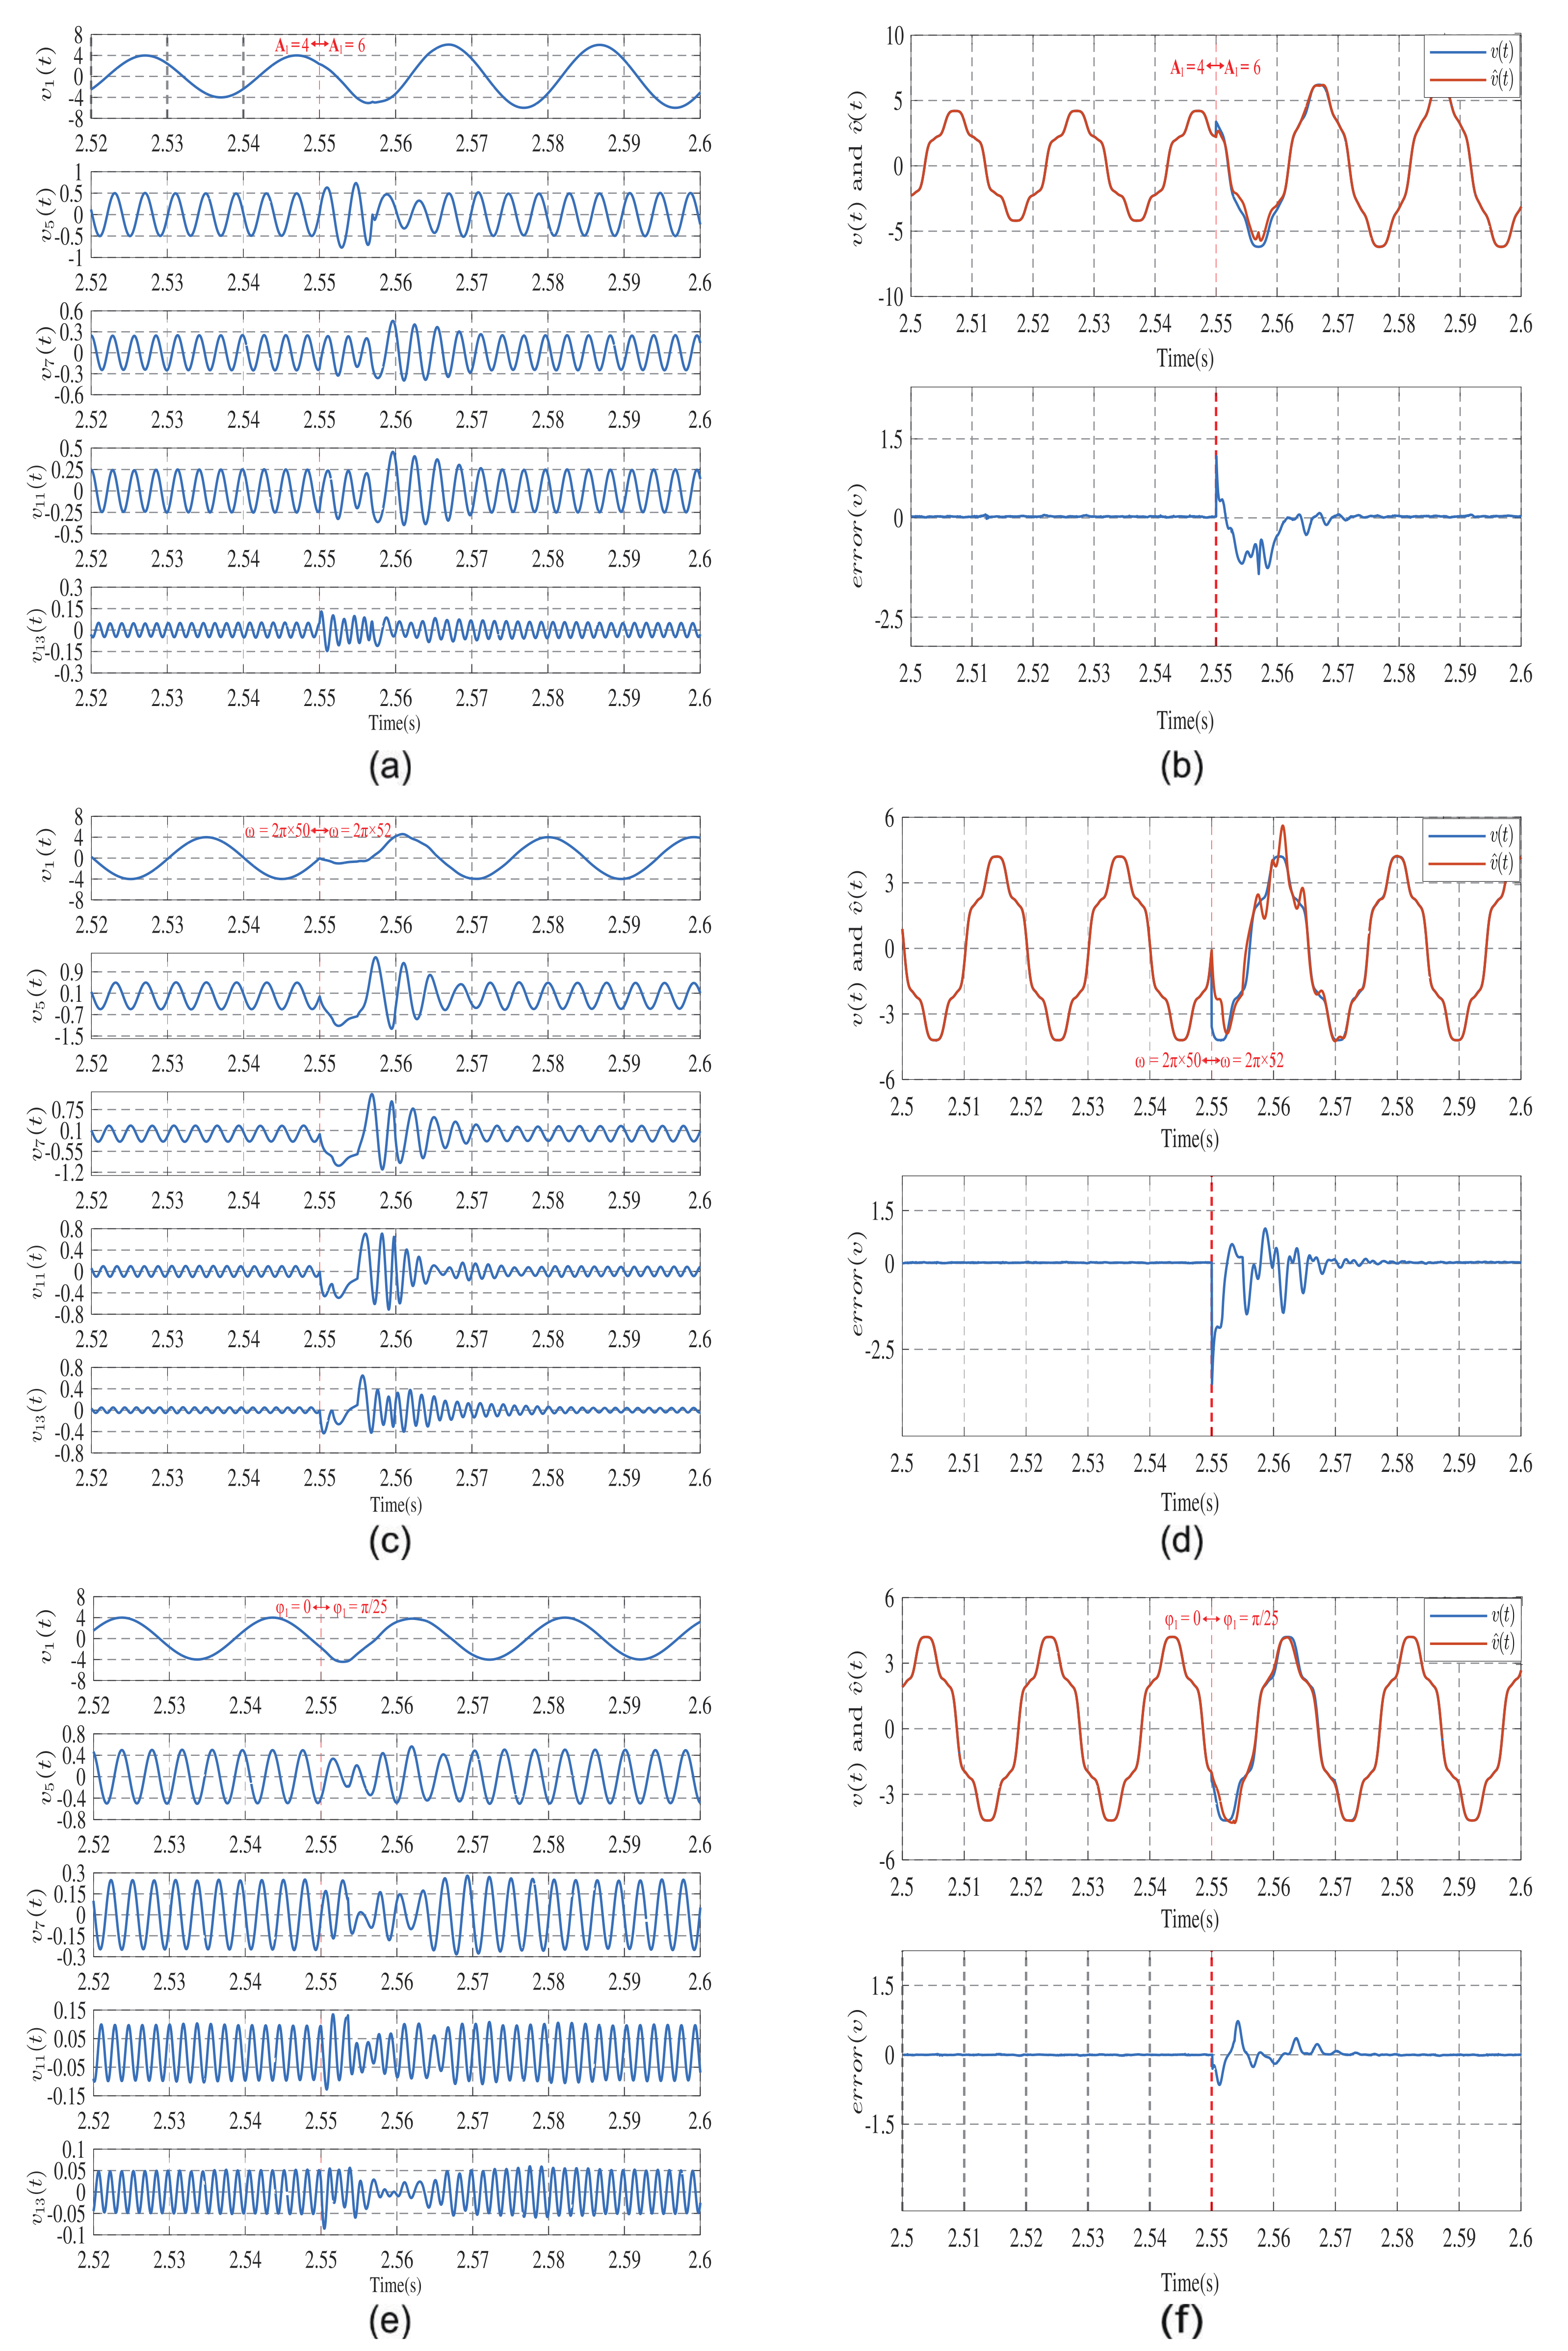
To verify that the design of this paper has a more rapid performance, the harmonic detection system using the cascaded 3CS method was experimented with again for Cases 1, 2, and 3. The resulting images are shown in Figure 16.
From Figure 16a, it can be seen that the 3CS system has a general observation effect on each harmonic, showing irregular waveforms. The tracking effect of the observed signal is also worse than that of the harmonic detection system designed in this paper, as shown in Figure 16b,c shows that the experimental convergence speed of the 3CS system is around 25 ms, and the stability after convergence is not strong. This is basically consistent with the simulation results. It can be concluded that the SOGI frequency estimation method is more adaptable to the harmonic observation module.
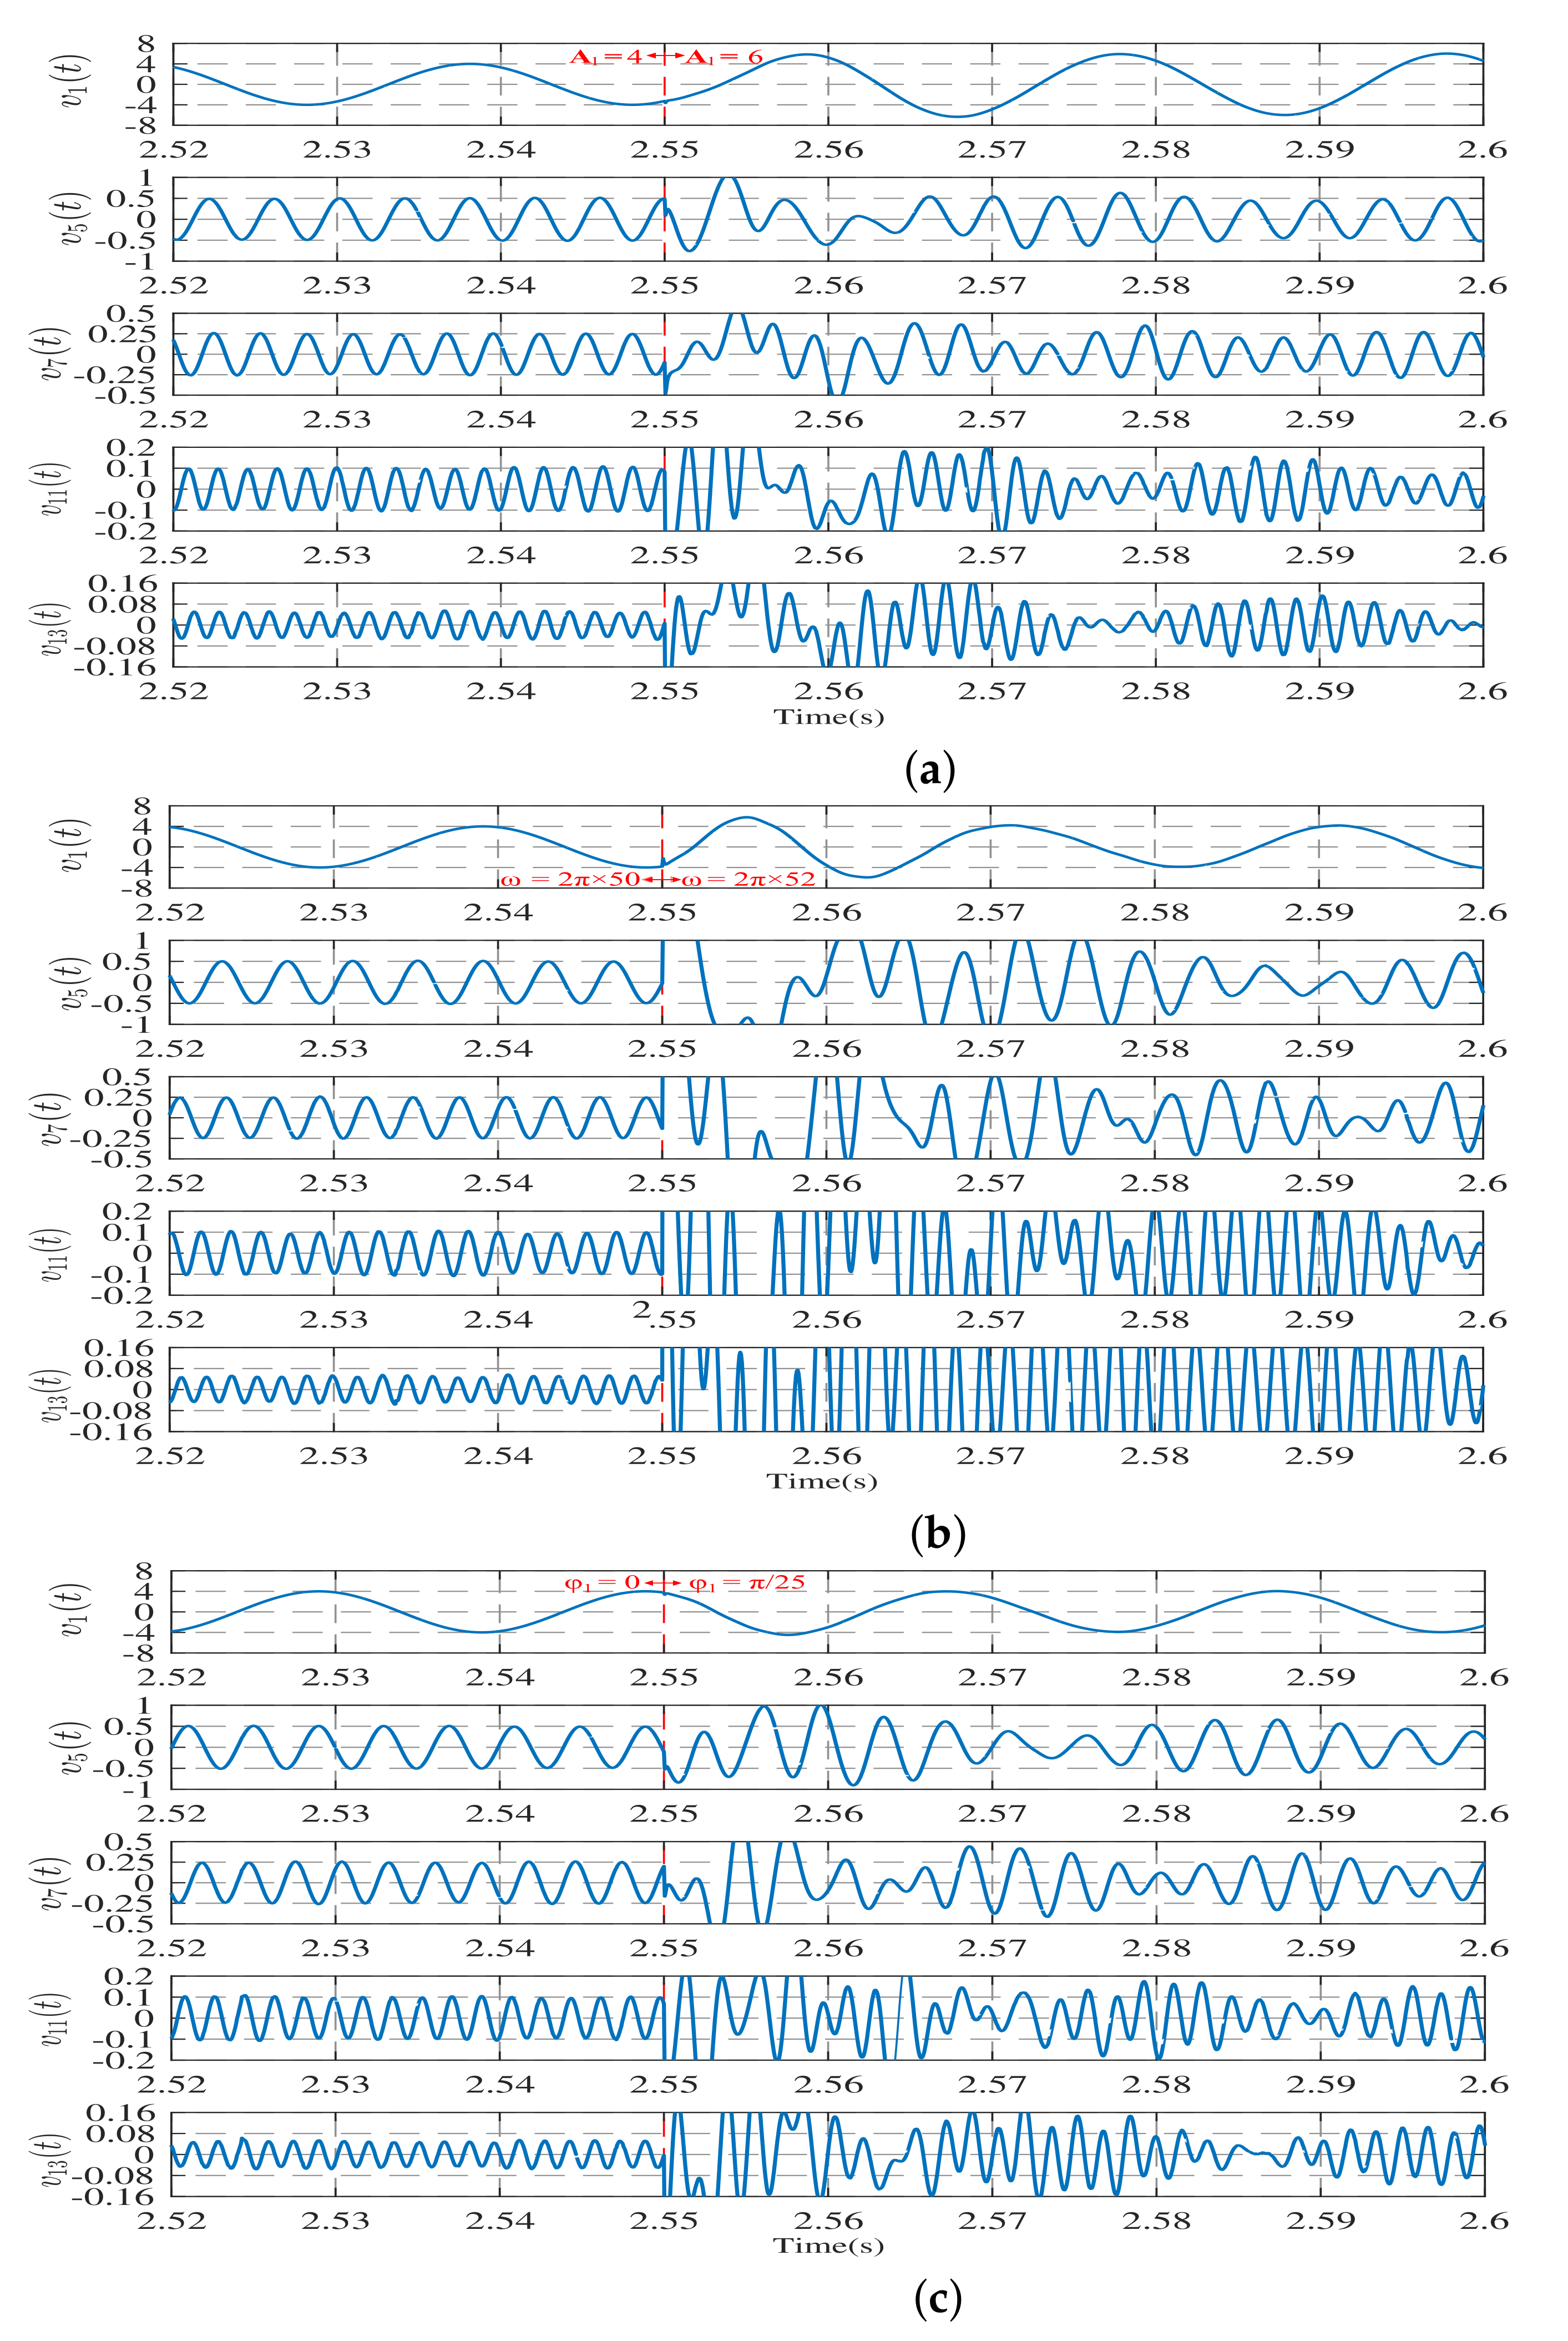
In addition, this paper replicates the composite observer model from the literature [19] and uses this system to conduct experiments for Case 1, 2, and 3 as a way to further validate the rapidity of the design in this paper. The results obtained are shown in Figure 17.
Harmonic detection systems based on compound observers have poor detection accuracy for higher harmonics. The detection of fundamental waves converges within 60 ms. In contrast, the design in this paper is faster and more accurate.

5. Conclusions

This paper addresses the task of improving the convergence speed of harmonic detection by designing an algorithm based on the input observer architecture, the Luenberger observer. The observer model constructs a state space model based on the original signal and harmonic components, estimates the state variables so as to achieve harmonic extraction, and proves the convergence of the observer using characteristic roots. In addition, the SOGI frequency estimation method is cascaded to satisfy a case with unknown frequency.
Simulations and experiments show that the proposed method has a superior dynamic performance compared to general harmonic observation methods. In addition, a frequency estimation method based on the SOGI algorithm is introduced to adapt it to practical situations. Simulations and experiments were conducted to verify its rapidity and effectiveness with fluctuations in the amplitude, frequency, and phase of the input raw signal, and the method can converge within 20 ms. The comparison experimental results show that the method has a faster convergence speed. How to perform harmonic detection for signals with interharmonics and DC components is a problem to be solved in the future.

Author Contributions

Conceptualization, Z.Z. and M.X.; methodology, Q.W.; software, Z.Z. and P.L.; validation, Z.Z., M.X. and P.L.; investigation, P.L. and Z.Z.; data curation, M.X. and Q.W.; writing—original draft preparation, M.X. and Q.W.; writing—review and editing, M.X. and Q.W.; funding acquisition, P.L. All authors have read and agreed to the published version of the manuscript.

Funding

This research was funded by Fundamental Research Funds for the Central Universities under Grant 20720220071.

Conflicts of Interest

The authors declare no conflict of interest.

Abbreviations

The following abbreviations are used in this manuscript:
SOGISecond-Order Generalized Integration
RCPRapid Control Prototype
FFTFast Fourier Transform
WTWavelet transform
DFTDiscrete Fourier Transform
KFKalman filter
DCDirect Current
LMSLeast Mean Square
RMSRoot Mean Square
SNRSignal–Noise Ratio
3CSThee-Consecutive-Sample

References

  1. Ujile, A.; Ding, Z. A dynamic approach to identification of multiple harmonic sources in power distribution systems. Int. J. Electr. Power Energy Syst. 2016, 81, 175–183. [Google Scholar] [CrossRef]
  2. Shi, J.; Liu, Z. Harmonic Detection Technology for Power Grids Based on Adaptive Ensemble Empirical Mode Decomposition. IEEE Access 2021, 9, 21218–21226. [Google Scholar] [CrossRef]
  3. Shi, H.; Li, Y.; Jiang, Z.; Zhang, J. Comprehensive power quality evaluation method of microgrid with dynamic weighting based on CRITIC. Meas. Control. 2021, 54, 1097–1104. [Google Scholar] [CrossRef]
  4. Jain, S.K.; Singh, S.N. Harmonics estimation in emerging power system: Key issues and challenges. Electr. Power Syst. Res. 2011, 81, 1754–1766. [Google Scholar] [CrossRef]
  5. Eskandarian, N.; Beromi, Y.A.; Farhangi, S. Improvement of dynamic behavior of shunt active power filter using fuzzy instantaneous power theory. J. Power Electron. 2014, 14, 1303–1313. [Google Scholar] [CrossRef]
  6. Wang, P.; Lu, J.; Shi, L.; Zhang, Y.; Tong, Z.; Wang, N. Method for extracting current envelope for broken rotor bar fault detection of induction motors at time-varying loads. IET Electr. Power Appl. 2019, 14, 1067–1077. [Google Scholar] [CrossRef]
  7. Akhil Vinayak, B.; Anjali Anand, K.; Jagadanand, G. Wavelet-based real-time stator fault detection of inverter-fed induction motor. IET Electr. Power Appl. 2020, 14, 82–90. [Google Scholar] [CrossRef]
  8. Wang, Z.; Li, Y.; Zhang, H. Harmonic Detection Method Based on Windowed Double-Spectrum Interpolation FFT. In Proceedings of the 2019 International Conference on Robots & Intelligent System (ICRIS), IEEE, Haikou, China, 15–16 June 2019; pp. 74280–74290. [Google Scholar] [CrossRef]
  9. Xuming, W.A.N.G.; Kejun, L.E.I.; Yang, X.; Li, M.; Wang, X. Harmonic Analysis Based on Blackman-Harris Self-Multiplication Window. In Proceedings of the 2020 5th Asia Conference on Power and Electrical Engineering (ACPEE), IEEE, Chengdu, China, 4–7 June 2020; pp. 2165–2169. [Google Scholar] [CrossRef]
  10. Li, C.; An, Q. Harmonic Detection Algorithm Based on Kaiser Window. In Proceedings of the 2020 IEEE Conference on Telecommunications, Optics and Computer Science (TOCS), IEEE, Shenyang, China, 11–13 December 2020; pp. 60–63. [Google Scholar] [CrossRef]
  11. Wen, H.; Zhang, J.; Yao, W.; Tang, L. LFFT-Based Amplitude Estimation of Power Distribution Systems Signal Distorted by Harmonics and Noise. IEEE Trans. Ind. Inform. 2017, 14, 447–1455. [Google Scholar] [CrossRef]
  12. Yan, H.; Yin, B.; Gao, M. Harmonic Detection in Electric Power System Using Wavelet Transform and Particle Swarm Optimization. In Proceedings of the 2018 IEEE 4th Information Technology and Mechatronics Engineering Conference (ITOEC), IEEE, Chongqing, China, 14–16 December 2018; pp. 701–704. [Google Scholar] [CrossRef]
  13. Wang, X.-L.; Wang, W.-B. Harmonic signal extraction from noisy chaotic interference based on synchrosqueezed wavelet transform. Chin. Phys. B 2015, 24, 080203. [Google Scholar] [CrossRef]
  14. Zhou, X.S.; Chen, G.Z.; Ma, Y.J. A Survey on Detecting Methods for Harmonic of power system. Adv. Mater. Res. 2013, 614, 907–910. [Google Scholar] [CrossRef]
  15. Sun, S.-G.; Wang, J.-Q.; Shi, S.-Q. Study on real-time detection of harmonics and reactive currents in single phase circuit. Electr. Meas. Instrum. 2008, 45, 4–7. [Google Scholar]
  16. Guo, J.; Jiang, C.; Guan, C.; Zhang, T.; Pu, J. Modeling and Simulation of Power Grid Voltage Harmonic Detection Method Based on Adaptive Kalman Filter. In Proceedings of the 2021 33rd Chinese Control and Decision Conference (CCDC), Kunming, China, 22–24 May 2021; pp. 6166–6172. [Google Scholar] [CrossRef]
  17. Cherif, H.; Benakcha, A.; Laib, I.; Chehaidia, S.E.; Menacer, A.; Soudan, B.; Olabi, A.G. Early detection and localization of stator inter-turn faults based on discrete wavelet energy ratio and neural networks in induction motor. Energy 2020, 212, 118684. [Google Scholar] [CrossRef]
  18. Ibrahim, W.A.; Morcos, M.M. Artificial intelligence and advanced mathematical tools for power quality applications: A survey. IEEE Trans. Power Deliv. 2002, 17, 668–673. [Google Scholar] [CrossRef]
  19. Zhao, Y.; Zhen, Z.; Cui, J.; Wang, Y. Harmonic Detection for Harmonic/Inter-Harmonic Based on Improved Glowworm Swarm Optimization and Neural Network. IEEJ Trans. Electr. Electron. Eng. 2020, 15, 1769–1779. [Google Scholar] [CrossRef]
  20. Selvajyothi, K.; Janakiraman, P.A. Extraction of harmonics using composite observers. IEEE Trans. Power Deliv. 2007, 23, 31–40. [Google Scholar] [CrossRef]
  21. Li, P.; Jin, W.; Li, R.; Guan, M. Harmonics detection via input observer with grid frequency fluctuation. Int. J. Electr. Power Energy Syst. 2020, 115, 105461. [Google Scholar] [CrossRef]
  22. Xu, M.; Sang, Z.; Li, X.; You, Y.; Dai, D. An Observer-Based Harmonic Extraction Method with Front SOGI. Machines 2022, 10, 95. [Google Scholar] [CrossRef]
  23. Wen, X.Y.; Wang, Z.; Zhang, W. K; Sun, J.G. Research on harmonic extraction method based on pairwise observer. Control. Decis. Mak. 2022, 2022, 1–6. [Google Scholar]
  24. Xu, B.Q.; Li, G.B.A. Study on the Improved Harmonic Current Detecting Method Based on ip—iqCalculating Modes. Adv. Mater. Res. 2012, 433, 6144–6150. [Google Scholar] [CrossRef]
  25. Xu, Y.; Du, Y.; Cheng, S. A method of de-noise and harmonics detection in power system based on periodicity analysis. MAPAN 2018, 33, 169–177. [Google Scholar] [CrossRef]
  26. Wang, G.; Wang, X.; Zhao, C. An Iterative Hybrid Harmonics Detection Method Based on Discrete Wavelet Transform and Bartlett–Hann Window. Appl. Sci. 2020, 10, 3922. [Google Scholar] [CrossRef]
  27. Zhou, J.; Wang, X.; Qi, C. Estimation of electrical harmonic parameters by using the Interpolated FFT algorithm based on Blackman window. J. Zhejiang Univ. Sci. Ed. 2006, 33, 650. [Google Scholar]
  28. Yilmaz, A.S.; Alkan, A.; Asyali, M.H. Applications of parametric spectral estimation methods on detection of power system harmonics. Electr. Power Syst. Res. 2008, 78, 683–693. [Google Scholar] [CrossRef]
  29. Yang, J.; Yang, G.; Gao, J.-H. A power harmonic detection method based on Wavelet Neural Network. In Proceedings of the 2009 International Conference on Machine Learning and Cybernetics, Baoding, China, 12–15 July 2009; Volume 6, pp. 3645–3649. [Google Scholar] [CrossRef]
  30. Sykora, T.; Brettschneider, Z.; Svec, J.; Tlusty, J.; Valouch, V. The Possibility of 3rd Harmonic Filtration. In Proceedings of the 4th International Scientific Symposium on Electric Power Engineering, Stara Lesna, Slovakia, 9–21 September 2007; pp. 494–500. [Google Scholar]
  31. Roncero-Sanchez, P.; del Toro Garcia, X.; Torres, A.P.; Feliu, V. Robust Frequency-Estimation Method for Distorted and Imbalanced Three-Phase Systems Using Discrete Filters. IEEE Trans. Power Electron. 2011, 26, 1089–1101. [Google Scholar] [CrossRef]
Figure 1. A simple scheme of the input observer.
Electronics 11 02860 g001
Figure 2. Harmonic detection system.
Electronics 11 02860 g002
Figure 3. Observation chart for each harmonic: (a) 1st, (b) 5th, (c) 7th, (d) 11th, and (e) 13th.
Electronics 11 02860 g003
Figure 4. Tracking of the input signal and error. (a) Tracking of the input signal and (b) error.
Electronics 11 02860 g004
Figure 5. Tracking of the input signal and error by the observers after adding white noise. (a) Tracking of the input signal and (b) error.
Electronics 11 02860 g005
Figure 6. Real-time simulation results: (a) The effect of extracting each harmonic after the jump in the fundamental amplitude of the input signal; (b) Comparison of the observer results with the real signal and the error curve.
Electronics 11 02860 g006
Figure 7. Real-time simulation results: (a); The effect of extracting each harmonic after the jump in the fundamental frequency of the input signal; (b) Comparison of the observer results with the real signal and the error curve.
Electronics 11 02860 g007
Figure 8. Real-time simulation results: (a) The effect of extracting each harmonic after the phase angle jump of the fundamental of the input signal; (b) Comparison of the observer results with the real signal and the error curve.
Electronics 11 02860 g008
Figure 9. Tracking of the input signal and error by the system after adding white noise: (a) Tracking of the input signal and; (b) error.
Electronics 11 02860 g009
Figure 10. Harmonic observation system detection results for the cascaded 3CS frequency estimation method. (a,c,e) Harmonics before and after amplitude, frequency, and phase jumps. (b,d,f) Tracking and error before and after amplitude, frequency, and phase jumps.
Electronics 11 02860 g010
Figure 11. Observations of a harmonic observation system with the cascaded 3CS method after the addition of white noise: (a) Tracking of the input signal and; (b) error.
Electronics 11 02860 g011
Figure 12. The test bench.
Electronics 11 02860 g012
Figure 13. Experimental results: (a) The effect of extracting each harmonic after a jump in the fundamental amplitude of the input signal. (b) Comparison of the results of the observer with the real signal and the error curve.
Electronics 11 02860 g013
Figure 14. Experimental results: (a) The effect of extracting each harmonic after a jump in the fundamental frequency of the input signal; (b) Comparison of the results of the observer with the real signal and the error curve.
Electronics 11 02860 g014
Figure 15. Experimental results: (a) The effect of extracting each harmonic after the phase angle jump of the fundamental of the input signal; (b) Comparison of the results of the observer with the real signal and the error curve.
Electronics 11 02860 g015
Figure 16. Harmonic observation system detection results obtained for the cascaded 3CS method before and after amplitude, frequency, and phase jumps. (a, c,e) Harmonics before and after amplitude, frequency, and phase jumps. (b,d,f) Tracking and error before and after amplitude, frequency, and phase jumps.
Electronics 11 02860 g016
Figure 17. Observations of each harmonic from the composite observer before and after amplitude, frequency, and phase jumps: (a) Harmonics before and after amplitude jump; (b) harmonics before and after frequency jump; and (c) harmonics before and after phase jump.
Electronics 11 02860 g017
Table 1. Error at different SNRs.
SNR(db)Error MeanRMS-Error
24.06−2.158 × 10 5 4.843 × 10 1
21.05−3.249 × 10 5 6.696 × 10 2
19.29−4.087 × 10 5 8.137 × 10 2
18.04−4.793 × 10 5 9.359 × 10 2
17.07−5.415 × 10 5 1.044 × 10 1
Table 2. Error at different SNRs.
SNR(db)Error MeanRMS-Error
24.06−2.147 × 10 5 4.852 × 10 2
21.05−3.237 × 10 5 6.703 × 10 2
19.29−4.073 × 10 5 8.143 × 10 2
18.04−4.778 × 10 5 9.364 × 10 2
17.07−5.399 × 10 5 1.044 × 10 1
Table 3. Comparison between the FFT method and the harmonic observation system.
No.Set ValuesFFTObverserRelative Error
11001001000.000%
512.512.53212.5320.252%
76.256.24136.2391−0.175%
113.753.75903.75210.056%
131.251.24751.2430−0.563%
Table 4. The 3CS method error at different levels of noise power.
SNR(db)Error Mean of 3CSRMS-Error of 3CS
24.061.331 × 10 4 4.933 × 10 2
21.051.266 × 10 4 6.795 × 10 2
19.292.657 × 10 4 8.241 × 10 2
18.043.234 × 10 4 9.459 × 10 2
17.072.819 × 10 4 1.054 × 10 1
Publisher’s Note: MDPI stays neutral with regard to jurisdictional claims in published maps and institutional affiliations.