Abstract
Data science and machine learning are subjects largely debated in practice and in mainstream research. Very often, they are overlapping due to their common purpose: prediction. Therefore, data science techniques mix with machine earning techniques in their mutual attempt to gain insights from data. Data contains multiple possible predictors, not necessarily structured, and it becomes difficult to extract insights. Identifying important or relevant features that can help improve the prediction power or to better characterize clusters of data is still debated in the scientific literature. This article uses diverse data science and machine learning techniques to identify the most relevant aspects which differentiate data science and machine learning. We used a publicly available dataset that describes multiple users who work in the field of data engineering. Among them, we selected data scientists and machine learning engineers and analyzed the resulting dataset. We designed the feature engineering process and identified the specific differences in terms of features that best describe data scientists and machine learning engineers by using the SelectKBest algorithm, neural networks, random forest classifier, support vector classifier, cluster analysis, and self-organizing maps. We validated our model through different statistics. Better insights lead to better classification. Classifying between data scientists and machine learning engineers proved to be more accurate after features engineering.
1. Introduction
Data science (DS) and machine learning (ML) are two subjects that have been much debated lately. The Clarivate collection of scientific articles published on the subject confirms an increasing trend of published articles in the recent years. In terms of what exactly differentiates these two subjects, there are few studies. As technologies evolve, the fields tend to overlap.
We are studying the DS and ML interrelations because we are trying to learn if DS and ML engineers differ. Moreover, we intended to find the most important and significant differences and common characteristics between the two types of scientists.
The motivation and research challenges were driven by the fact that a right distinction is useful as, very often, ML needs DS and vice versa. However, mastering both is not that common, and practitioners need to know the tools and techniques on which to gain expertise. In a report realized by Flowers [1] entitled “The right skills for the right tech jobs” the author mentions that data scientists tend to use Python, R, or both, along with ML methods. Other top data science skills are not programming languages, but rather statistical methods or disciplines. Machine learning, the umbrella term for statistical techniques used for prediction, is the second-ranking tech skill for data scientists, while deep learning is the tenth.
The main difference between DS and ML comes from the fact that data science involves data analysis, data visualization, and statistical analysis which requires a background in computer science, statistics, and mathematics [2,3,4], whereas machine learning involves learning from data [5,6,7,8,9] and the creation of learning models based on data. DS includes data analytics [10,11]. Data analytics involves checking a hypothesis, whereas data science is a whole which tries to build connections and shapes the questions to answer them for the future.
Machine learning is considered a disruptive technology that is applied in many industries. The promise of machine learning is the lowering of product and service costs, the speeding up of business processes, and better customer service [12,13]. According to Culbertson [14] the demand for workers with AI talent has more than doubled over the past three years, with an increase of approximately 119% in AI-related vacancies. At this moment, big data [15] and cloud computing [16,17] are two technologies used in BI. Different authors [18,19,20] have stated that there is a need for initiatives that will address the integration with machine learning for big data processing. Although data science and machine learning often are used together and are very interrelated, this article presents an analysis of the differences between them by studying the characteristics that data scientists and machine learning engineers share, and by studying the characteristics by which they differ. The differences are brought to the surface by engineering the ten most important features so that the identified features are the most relevant. We chose to conduct a very granular classification between data scientists and machine learning engineers by employing different analyses, statistics, and metrics, as both DS and ML engineers use, very often, the same tools and they often have a common knowledge background. The focus is on the tools and on the knowledge that these professionals use.
To our knowledge, the differences between data scientists and ML engineers has not been studied yet. We used a palette of ML techniques as we worked with a fine granulation between two categories of professionals which, most often, share the same knowledge. The subject of feature engineering is important for building good machine learning models. A feature is an individual measurable property or characteristic of a phenomenon or a measurable piece of data or an individual independent variable. The purpose of machine learning models can be to classify, predict or, in general, to learn a behavior from existing data. When the volume of data is large, identifying the most important features is difficult and, depending on the area of applicability, the need to obtain the best possible model of machine learning is essential. Our purpose was to identify the top ten features that best describe DS and ML. This is the main contribution of our research. This article shows not only the major differences in terms of ML techniques and object-detection methods used by data scientists and ML engineers, including programming languages and specialized hardware, but also main activities performed in the workplace, salary, and country.
The rest of the paper is organized in three sections: Materials and Methods, Results, and Discussion. The Materials and Methods section presents the dataset we used in the analysis, the research questions, the research methodology, and the clustering analysis which proves that records can be grouped into two clusters. The Results section presents the feature engineering process together with its validation by using neural networks, support vector classifier and random forest classifier. Moreover, the Results section describes data scientists and ML engineers on each identified feature. The Discussion section presents the main contributions in relation with the current achievements in the field.
2. Materials and Methods
To engineer the features that best characterize and help to classify between data scientists and ML engineers, we used a publicly available dataset—the 2021 Kaggle Machine Learning & Data Science Survey competition. The dataset contains over 39 questions and 20,036 responses related to the tools they use in the workplace, their techniques, and the activities in which they are involved. We considered that the number of questions and responses helps to address our research purpose, which is to engineer the features that best characterize the data scientists and ML engineers.
The dataset contains information about different individuals who are engaged in activities related to DS and ML. The variables are 100% categorical as the questions are multiple-choice questions. Data scientists represent 13.9% from the total number of Kaggle’s survey respondents, and machine learning engineers represent 5.6% from the total (Figure 1).
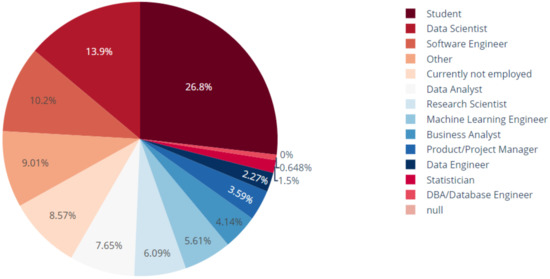
Figure 1.
Respondents’ role distribution.
After filtering the dataset for data scientists and ML engineers, we noticed that there are 2676 data scientists and 1082 ML engineers. Because the dataset is unbalanced, we applied the over-sampling ADASYN technique in order to obtain accurate classifiers. ADSYN focuses on generating samples next to the original samples which are wrongly classified by using a k-nearest neighbors classifier [21].
The research questions we established are:
(Q1): Is it possible to differentiate between different professionals working in the field of DS and ML?
(Q2): Are DS and ML engineers differing in their use of DS and ML tools, techniques, and algorithms?
To answer our research questions, we established a set of steps, called the methodology of research.
- Acquire and preprocess the dataset in order to analyze DS and ML engineers’ responses.
- Conduct an unsupervised clustering in order to distinguish groups of DS and ML engineers.
- Engineer the features.
- Validate the set of features by testing the accuracy of predicting the classification among these professionals in two cases: (1) without feature engineering and (2) after applying feature engineering. We used 80% of the entire dataset for training and 20% for testing.
The research tools and methods that we use in order to conduct our methodology were as follows.
- Python as a programming language and functions belonging to open source libraries like: pandas, seaborn, plotly and plotly.express (preprocess the dataset).
- Neural network model, support vector classifier and random forest classifier for classification (the classification between data scientists and ML engineers), self-organizing Maps, and KModes (for clustering). We used functions and classes from keras library and minisom library.
- We studied the accuracy and other classification metrics by using the metrics package from the sklearn library.
- We identified the best predictors and engineer the features by using the functions from the feature_selection package belonging to sklearn library.
- We validated the research hypothesis by testing the ML models on the identified features.
Our study identifies the most important features from the dataset by using SelectKBest, an algorithm for feature selection. Feature selection is a technique by which we choose those features in our data that contribute most to the target variable. In other words, we choose the best predictors for the target variable. The two most used feature selection methods for categorical input data when the target variable is also categorical are the chi-squared statistic and the mutual information statistic. We validated the total number of features by using principal component analysis (PCA). PCA is an unsupervised dimensionality reduction technique. We used PCA because we wanted to reduce the dimensionality by not taking into consideration the target variable.
2.1. Data Preprocessing
The dataset we used is publicly available on the Kaggle website. It contains answers to over 39 questions. Among the questions we enumerate are: (1) the number of years spent on writing code and/or programming; (2) the programming languages, IDE, hosted notebook products, computing platform, specialized hardware, data visualization libraries, ML frameworks, algorithms, computer vision methods, natural language processing methods used on a regular basis; and (3) the size of the company where they are employed and the activities in which they are involved. The resulting number of columns was 355. We eliminated one column related to the time taken to complete the survey. The initial list of features which we took into consideration contains all the variables.
2.2. Clustering Data Scientists and ML Engineers
As the number of categorical variables from our analysis was big (after getting the dummies, we ended up with 351 variables), we decided to perform feature engineering to better characterize the two groups. Our analyses started with a cluster analysis. We used the KModes algorithm and the Elbow technique to identify the optimal number of clusters. The Elbow method (Figure 2) runs a KModes clustering algorithm on the dataset for a range of values for k (number of the clusters) (we chose 20) and then for each value of k computes an average score for all clusters. By default, the distortion score is computed as the sum of square distances from each point to its assigned center. We tested the performance of the clustering by computing three metrics: silhouette score, Calinski–Harabasz Index for K-Means, and Davies–Bouldin score.
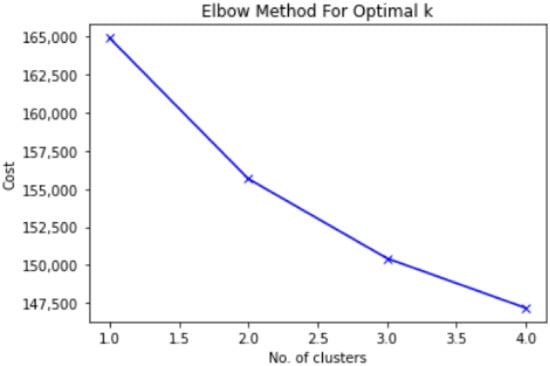
Figure 2.
The Elbow method for finding the optimal number of clusters.
We plotted the data by using three clusters, as the Elbow method suggested three clusters, to observe if there are data points far away from the their centroids. Figure 3 suggests that the clustering is a good choice in getting insights from data.
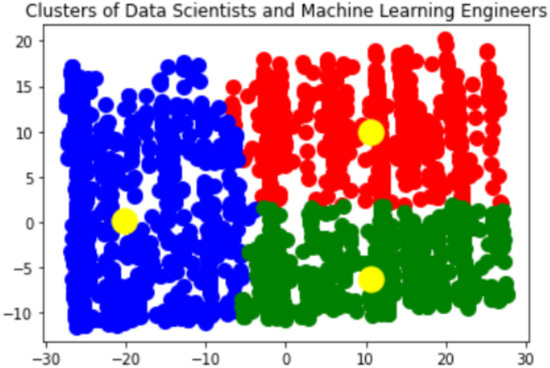
Figure 3.
Data scientists and machine learning engineers grouped in three clusters (The picture is a visualization which clusters our data into 3 groups. One can easily notice that the positions of centroids, in the centre of each group, suggest that there are 3 clusters or groups of data. The analysis for each group follows this plot).
The inflection point is around three clusters, but we tested the specific statistics for two, three, and four clusters. The results are presented in Table 1.

Table 1.
Statistics values obtained for k = 2, 3, 4 number of clusters.
The silhouette score is favorable for grouping into two clusters. The Calinski–Harabasz Index for K-Means (also known as the variance ratio criterion) is calculated as a ratio of the sum of intercluster dispersion and the sum of intracluster dispersion for all clusters. Therefore, the metric favors a total number of four clusters. A Davies–Bouldin score is defined as the average similarity measure of each cluster with its most similar cluster, where similarity is the ratio of within-cluster distances to between-cluster distances. A Davies–Bouldin score closer to zero is the one for the case of two clusters. We can conclude that there are some outliers which transform the process of clustering into a challenging one, but this is not an uncommon setting in any dataset case. As the variables are categorical, we decided to run a self-organizing map to focus on the outliers. The map is presented in Figure 4.
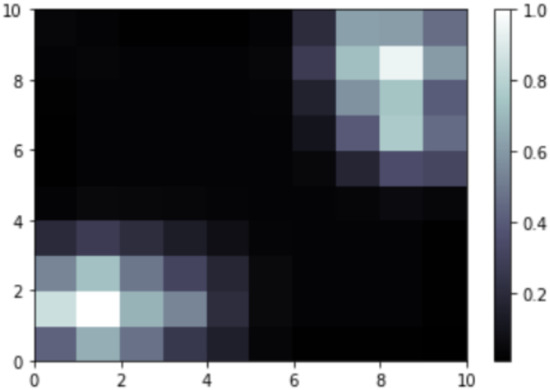
Figure 4.
The self-organizing map (outliers = brighter cells. Numbers on the right vertical axis show the distance from each centroid. Numbers on the left vertical axis show the coordinates of each data point).
There are two groups of outliers, one of them at (1,1) and the other one at (8,9) coordinates, suggesting somehow that there are two clusters. The outliers from (1,1) are 104 in total, 96 of them are 25–29 years old, and 8 of them are 30–34 years old. Among them, 26 are from Romania. Out of the totals, 75 hold a PhD degree. All of them are men. All the outliers use PyCharm, Spyder, Notepad++, scikit-learn, TensorFlow, or Xgboost. Among them, 70 do not use ML at work, and the rest of the 34 are exploring ML methods. A total of 59 declare to gain 0–999 USD per year; therefore they are not permanently employed. We would characterize this group as being among data scientists but sharing common characteristics with ML engineers as they declare to use different ML methods. The outliers from (8,9) coordinates are 237 in total. Among them, 122 are 25–29 years old, 92 of them are from Greece, 221 of them prefer not to declare their studies, and the rest of them hold a PhD degree. A total of 153 of them have well-established ML methods at the workplace, and 84 are exploring ML methods. They are using Google Cloud BigQuery and Google Cloud SQL, Auto-keras, Auto ML, and Auto sklearn. We would characterize this group as being among ML engineers but sharing some common characteristics with data scientists. It is a specific group—52 of the declare to earn yearly in the range of 300,000 and 500,000 USD. However, the inclusion into the ML engineers’ group is not that evident, as they use different predictive techniques, but at the same time they are quite involved in ML tasks. These ideas make us believe that, in total, there are three possible clusters: one is for data scientists, one is for ML engineers, and one is for data scientists or ML engineers who work with predictive tasks and with BigData, as they declare to work with multiple cloud platforms and use BigQuery tools.
We conducted again the KModes and the Elbow method, after excluding the outliers. The dataset to work with contained, after removing the outliers, 3521 rows.
The inflection point is approximately three clusters, but we tested the specific statistics for 2, 3, and for 4 clusters. The results are presented in Table 2.
Table 2.
Cluster’ statistics for k = 2,3,4 after removing the outliers.
The silhouette score is still favorable for grouping into two clusters. The results for the two other tests are very close to the previous ones, therefore we decided to favor both the split and the nonoverlapping inner clustering and choose to work with two clusters.
3. Results
The Results section is grouped into two subsections: in the first section, we engineered the features. The second subsection contains the differences discussed for each feature.
After filtering the dataset for DS and ML engineers, we verified if the responses could help train a classification neural network model. If this model has a good accuracy, we considered that we can further analyze the most important features that differentiate data scientists from machine learning engineers and test if the accuracy improves after applying feature engineering. We placed all the response columns in a list of features, except for the dependent variable or the target Q5 (the current role/job) and the time spent by each respondent to answer the survey (we thought that the response time is not important for our research purposes).
As we specified in the Introduction section, a big number of features available from the start helps to employ classification ML models, which have good accuracy, but although the ML models classify with good results, they are considered black boxes because they do not offer insights into the best predictors of the model. We analyzed metrics specific to classification before and after feature engineering.
3.1. Feature Engineering to Identify Top 10 Features
We designed a classification neural network with two hidden layers, 200 neurons per layer, a batch size of 12, and a number of 150 epochs. As activation functions for the input and hidden layers, we used the rectifier linear unit (ReLU). For the output layer, we used the sigmoid function. Choosing ReLU for the hidden layers and sigmoid for the output layer are considered by the current literature to be the best choices in designing a supervised neural network model. The supervised neural network had an accuracy of 69.14%. The classification metrics are presented in Figure 5.
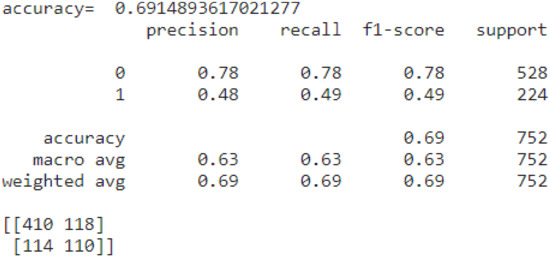
Figure 5.
The classification metrics (neural network model).
We considered that the recall values were not very good and decided to upsample the dataset. After upsampling the imbalanced dataset, for which we used the ADASYN technique, the f1 score for the one class increased, and the accuracy decreased (Figure 6).
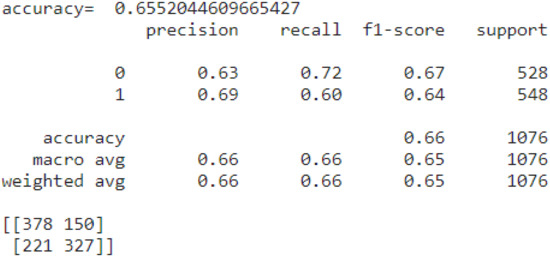
Figure 6.
The accuracy after upsampling.
Even so, the accuracy remains low. Therefore, we decided to move to feature engineering. We applied SelectKBest, a univariate feature selection algorithm which works by selecting the best features based on univariate statistical tests.
We validated the number of features by applying PCA. The explained variance ratio is depicted in Figure 7.
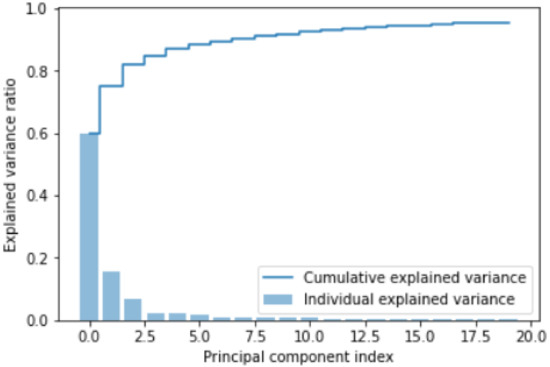
Figure 7.
Explained variance ratio (around 21 components the cumulative explained variance reaches almost the value of 1).
By applying the Kaiser rule (values greater than 1) on the explained variance (Table 1), we validated a total number of 21 variables to build our new features.
The top 21 variables and the 10 engineered features that we identified are presented in Table 3.
Table 3.
The top 21 variables and the top 10 features identified important in classifying between DS and ML engineers.
We validated our model by studying the accuracy metrics resulting from training a classification model.
The results from applying ML again appear in Figure 8.
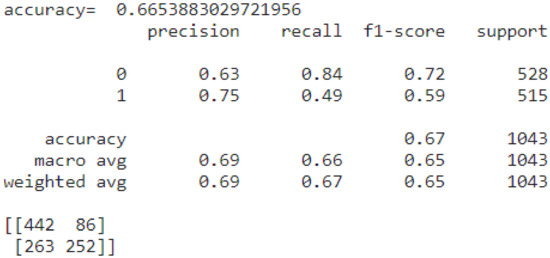
Figure 8.
The accuracy, f1 score, precision, and recall after applying feature engineering.
We validated our model by applying Support Vector Classifier algorithm before and after applying feature engineering. The results are presented in Figure 9a,b.
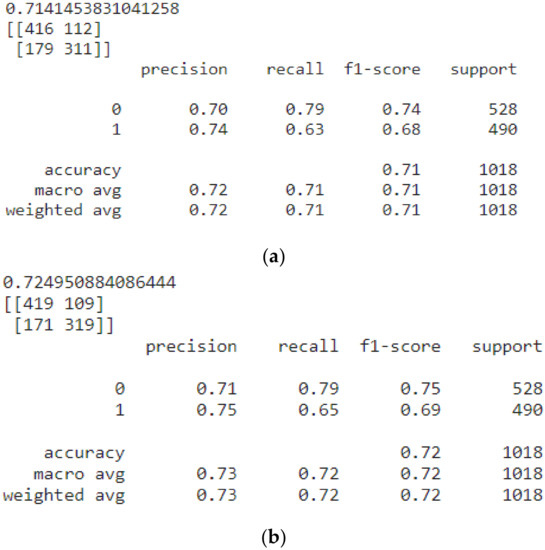
Figure 9.
(a) The accuracy, f1 score, precision and recall of SVC before applying feature engineering. (b) The accuracy, f1 score, precision and recall of SVC after applying feature engineering.
We validated our model by applying the random forest classifier algorithm before and after applying feature engineering. The results are presented in Figure 10a,b.
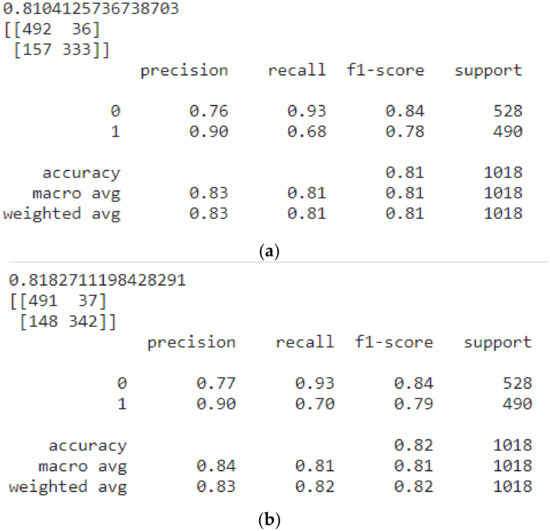
Figure 10.
(a) The accuracy, f1 score, precision, and recall of random forest classifier before applying feature engineering. (b) The accuracy, f1 score, precision, and recall of random forest classifier after applying feature engineering.
We observe definite improvement on all metrics and managed to identify the top 10 features that best help to differentiate between DS and ML engineers: (1) BI tools, (2) programming languages, (3) computer vision methods, (4) big data, (5) analyze data at the workplace, (6) ML algorithm frequently used, (7) IDE, (8) data visualization libraries or tools, (9) age, and (10) salary and country. We validated our first hypothesis. Therefore, we proceeded to analyze the dataset by considering each feature, to discuss the differences. We used the initial dataset and created crosstabs. We plotted DS and ML engineers to notice the differences through comparisons (DS and ML are represented as stacked bars).
3.2. Differences between DS and ML Engineers
3.2.1. Salary and Country
The first feature to yearly compensation. The yearly compensation for DS and ML engineers is presented in Figure 11.
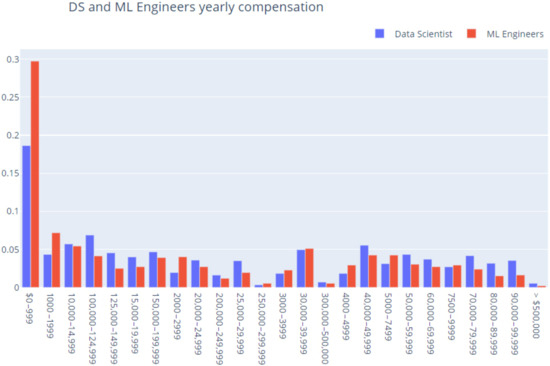
Figure 11.
DS and ML yearly compensation (percent).
There is a difference between data scientists and machine learning engineers at the middle level of the yearly compensation interval. It seems that there are more data scientists that earn an amount greater than 100,000 USD than data scientists that earn a total amount of up to 50,000 USD. Machine learning engineers are not in the same situation. The number of them who earn a total between 100,000 and 124,999 USD is almost equal with the total number of those who earn between 40,000 and 50,000 USD.
Figure 12 shows the distribution of DS and ML engineers per each country.
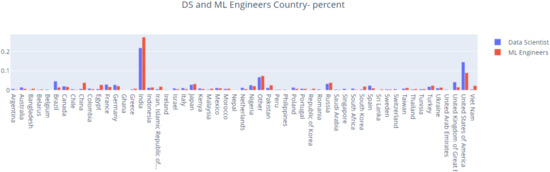
Figure 12.
DS and ML engineers per country (percent).
Most ML engineers are from India. The second country is the USA with the main difference being that in the USA, data scientists are in a higher percentage than ML engineers.
3.2.2. BI Tools
Furthermore, we studied data scientists and machine learning engineers from the perspective of business intelligence tools that they use (Figure 13).
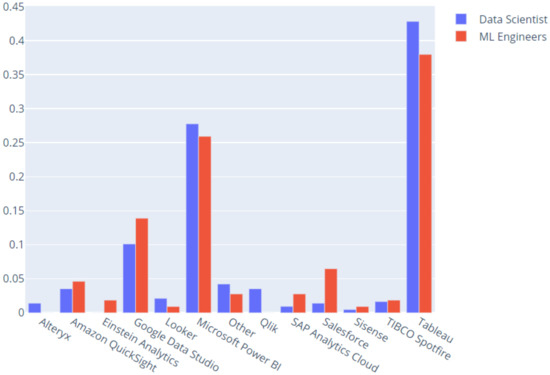
Figure 13.
Business intelligence tools preferences (percent).
More machine learning engineers use Salesforce than data scientists. Moreover, data scientists use Looker more than machine learning engineers. It seems that machine learning engineers use Google Data Studio and Amazon QuickSight in a greater proportion than data scientists do.
To better characterize the preferences in terms of business intelligence tools that DS and ML engineers prefer, we studied the primary tools used to analyze data (Figure 14).
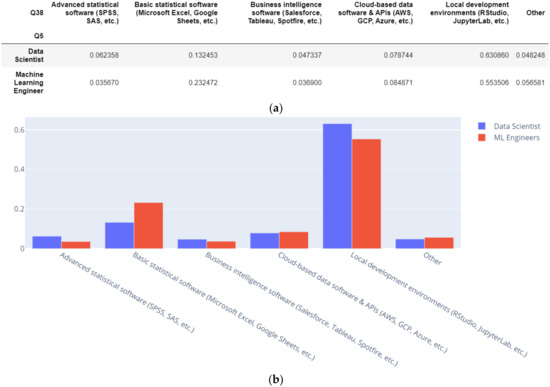
Figure 14.
(a) Primary tools used to analyze data (percent). (b) Primary tools used to analyze data (percent).
Data scientists use advanced statistical software in a greater proportion than ML engineers. ML engineers use basic statistical software in a greater proportion than data scientists. There is a slight difference concerning the preference of ML engineers for cloud-based data software (AWS, GCP, Azure). We further analyzed the data in terms of big data products usage.
3.2.3. Big Data
Furthermore, we studied the differences between data scientists and ML engineers in terms of big data product usage (Figure 15).
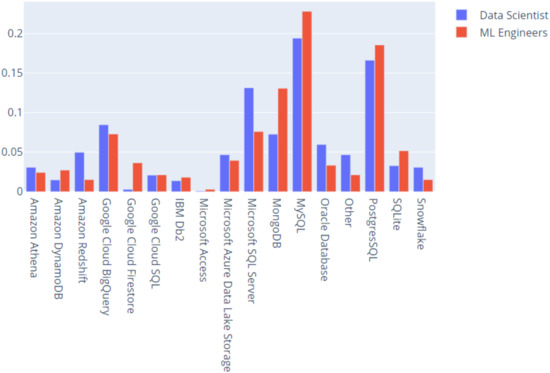
Figure 15.
Big data products usage (percent).
Google Cloud Firestore is a big data product used in a greater percentage by ML engineers. Moreover, MongoDB is another product used by them, but data scientists also prefer it. Data scientists use Microsoft SQL Server in a greater proportion than ML engineers. MySQL, SQLite and PostgresSQL are used more by ML engineers.
3.2.4. ML Technique and Object-Detection Methods
Data scientists use Ggplot, decision tree or random forest classifiers, Microsoft SQL Server, Xgboost, Tableau, and gradient boosting machines in a bigger proportion than ML engineers.
Data scientists and machine learning engineers differ when we talk about object-detection methods usage. Machine learning engineers use these methods in a greater proportion than data scientists.
3.2.5. Programming Languages
Are data scientists and machine learning engineers using programming languages, and what programming language is the best predictor in classifying a Kaggler as being a data scientist or a machine learning engineer? Figure 16 presents the usage of the R language among DS and ML engineers.
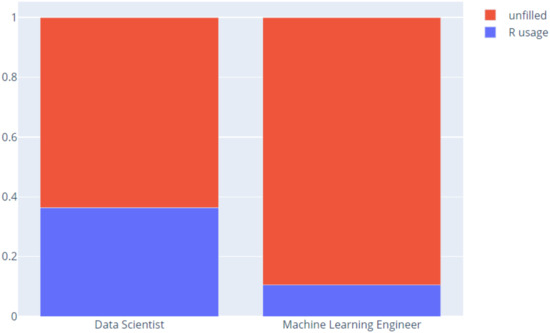
Figure 16.
R Language usage.
There are some machine learning engineers who use R, but in a lesser amount than data scientists. In fact, it is obvious that using R is a good predictor for classifying between ML engineers and data scientists.
3.2.6. Age
It seems that age is an important feature in classifying DS and ML engineers. Data scientists and ML engineers’ distribution per age is presented in Figure 17.
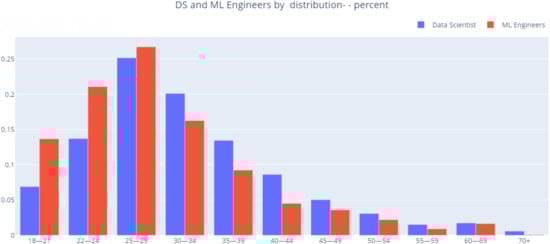
Figure 17.
DS and ML engineers by age distribution (percent).
Data scientists’ age distribution is not as left-sided as ML engineers’ age distribution. It seems that the intervals of age between 18 and 21 years old and 25 and 29 years old are characterized by the presence of more ML engineers.
3.2.7. Main Activity at the Workplace
Not only is age an important predictor, but the task of analyzing and understanding data to influence product or business decisions at the workplace is significant (Figure 18).
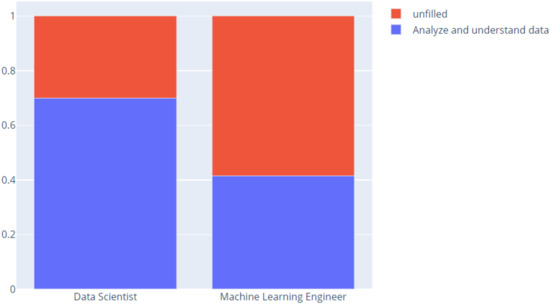
Figure 18.
Analyze and understand data to influence product or business decisions.
Data scientists analyze data to influence product or business decisions if we compare them with ML engineers.
3.2.8. Specialized Hardware
Another predictor was Q12_Part_3—Specialized hardware—NONE. Table 4 presents the distribution among DS and ML engineers in terms of not using specialized software.
Table 4.
Q12_Part_3- Specialized hardware- NONE distribution.
ML engineers use specialized hardware. As expected, the next predictor was Q18_Part_4 Image classification and other general-purpose networks. Figure 19 presents DS and ML engineers’ distribution in terms of using image classification and other general-purpose networks in terms of percentage.
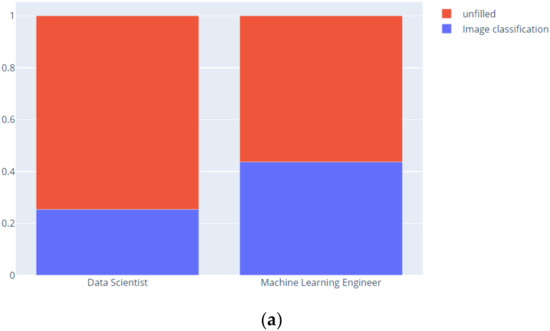
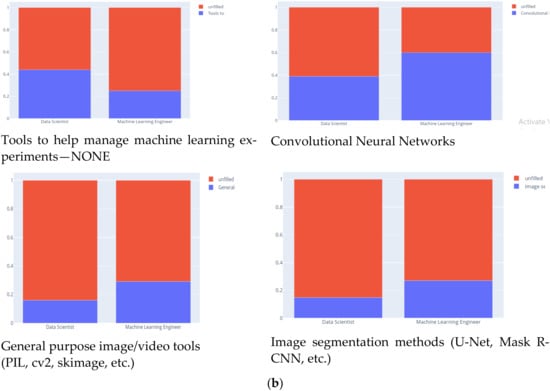
Figure 19.
(a) Image classification and other general-purpose networks. (b) Image classification and other general-purpose networks.
3.2.9. SQL Usage
Another feature is related SQL usage (Figure 20).
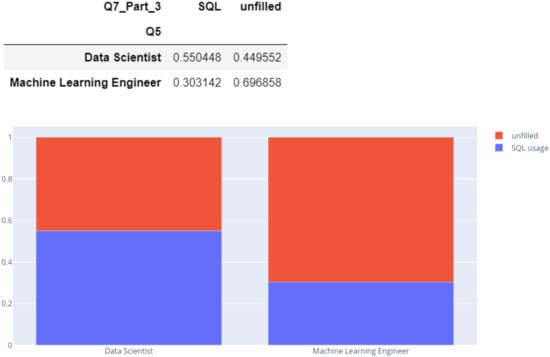
Figure 20.
SQL usage.
Data scientists use SQL more than ML engineers. As gathering data, querying, aggregating, and joining data are mandatory steps in data science, it is understandable that SQL came out as an important predictor in differentiating between DS and ML engineers.
4. Discussion
Our approach was oriented toward obtaining better descriptions about DS and ML, and we chose to engineer the features because, as [22] states, feature-selection techniques do not alter the original representation of the variables, but merely select a subset of them.
Having knowledge in the field is a good source of information in identifying the most important features, but identifying some features difficult to anticipate previously is the concern of features engineering [23]. We considered age, country, and salary because we considered these factors as being non-characteristic to the domain knowledge, but dependent on the current situation of DS and ML engineers. We removed the variables from 22 to 39 as the results from PCA suggested that data can be described by a number of 21 variables, which we then grouped into features. To remove an irrelevant feature, a feature selection criterion is required that can measure the relevance of each feature with the output class/labels. Our idea is confirmed by [23].
Concerning the efficiency of feature selection, we respected [24], which states that one of the key aspects is to measure the goodness of a feature subset in determining an optimal one; therefore, we analyzed the accuracy of ML models before feature engineering and after.
The dataset suffered from class imbalance. Therefore, we applied the ADASYN upsampling technique in order to have no bias on the classification performance. The authors of [25] suggest that ROC curves are unable to deal with within-class imbalances and different within-class misclassification costs, and that it is important to select features that can capture the high skew in the class distribution. We employed the explained variance analysis and chose features which had an explained variance greater than 1.
It is not uncommon for the ML process to use a dataset of available features without computing the predictive value of each. Such an approach makes the process vulnerable to overfit, predictive errors, bias, and poor generalization [13]. Feature engineering is the task of improving predictive modeling performance on a dataset by transforming its feature space. There are authors who applied the random forest algorithm for feature selection [26]. We used neural networks to validate our set of selected features, as the random forest classifier tends to overfit.
As stated by [27], feature selection for classification attempts to select the minimally sized subset of features according to the following criteria: (1) the classification accuracy does not significantly decrease; and (2) the resulting class distribution, given only the values for the selected features, is as close as possible to the original class distribution, given all features.
However, given the fact that our variables were entirely categorical, our research brought in place the use of KMode and self-organizing map clustering techniques, as the KMeans would not have been possible to conduct.
In addition to our analysis on what differentiates DS and ML, we observed DS and ML engineering’s common characteristics:
- They do not differ from the perspective of their number of years spent to code or programming (Q6).
- They do not differ from the perspective of their preferences for hosted notebooks (Q10).
- They do not differ from the perspective of their specific preference for a particular computing platform (Q11).
- They do not differ from the perspective of how many times they used TPU (Q13).
- They do not differ from the point of view of the number of years because they use ML methods (Q15).
- They do not differ from the point of view of how much money have they (or their team) spent on machine learning and/or cloud computing services at home (or at work) in the past five years (Q25).
- They do not differ from the point of view of the cloud computing platforms or cloud computing products they use on a regular basis (Q26 and Q27).
- They do not differ from the point of view of the machine learning products they use on a regular basis (Q28).
- They do not differ from the point of view of the automated machine learning tools (or partial AutoML tools) they use on a regular basis (Q34).
- They do not differ from the point of view of where do they publicly share or deploy their data analysis or machine learning applications (Q36).
- They do not differ from the point of view of their preference for the favorite media sources that report on data science topics (Q39).
Concerning the future trends, data scientists are interested in investing time in learning Tableau in the next two years in a greater proportion than ML engineers. Regarding their intention to learn any other BI tool (not specified in the survey) in the next two years, we can say that ML engineers have, in a very small amount, greater expectations than data scientists in learning another BI tool. Data scientists and ML engineers are interested in learning in the next two years more automated machine learning tools (or partial AutoML tools), but this is true of ML engineers in a bigger proportion.
We consider, therefore, that our research contributes to the mainstream of scientific research by providing guidance for later studies on engineering categorical features, besides being enlightening about the differences between data scientists and machine learning engineers. As easily predicted, there is no black-and-white distinction between data scientists and machine learning engineers, and our research proved this by extensively analyzing the outliers in addition to studying the characteristics of each group.
Open Issues
We consider that our research addressed these questions and answered properly. The results facilitate discussions on improving the performance of ML models after applying feature engineering and feature selection. Future directions of research would be in the area of improving ML classifiers or regressors by applying linear discriminant analysis, PCA, and diverse feature selection techniques. Another important future research direction is the one dedicated to study the impact of our findings on improving curricula in master program studies [28].
Author Contributions
Conceptualization, S.-C.N.; Formal analysis, S.-C.N. and C.S.; investigation, S.-C.N.; methodology, S.-C.N. and C.S.; software, S.-C.N.; validation, C.S.; visualization, S.-C.N.; resources, C.S. All authors have read and agreed to the published version of the manuscript.
Funding
This research received no external funding.
Data Availability Statement
Publicly available datasets were analyzed in this study. This data can be found here: https://www.kaggle.com/competitions/kaggle-survey-2020 (accessed on 11 March 2022).
Acknowledgments
This paper is partially supported by the Competitiveness Operational Programme Romania under project number SMIS 124759—RaaS-IS (Research as a Service Iasi).
Conflicts of Interest
The authors declare no conflict of interest.
References
- Flowers, A. Indeed Tech Skills Explorer: Right Skills for the Right Tech Job. 2020. Available online: https://www.hiringlab.org/2020/01/09/right-skills-right-tech-job/ (accessed on 1 January 2020).
- Bruce, P.; Bruce, A.; Gedeck, P. Practical Statistics for Data Scientists: 50+ Essential Concepts Using R and Python; O’Reilly Media: Boston, MA, USA, 2020. [Google Scholar]
- Cleveland, W.S. Data science: An action plan for expanding the technical areas of the field of statistics. Int. Stat. Rev. 2001, 69, 21–26. [Google Scholar] [CrossRef]
- Hernán, M.A.; Hsu, J.; Healy, B. A second chance to get causal inference right: A classification of data science tasks. Chance 2019, 32, 42–49. [Google Scholar] [CrossRef]
- Dogan, A.; Birant, D. Machine learning and data mining in manufacturing. Expert Syst. Appl. 2021, 166, 114060. [Google Scholar] [CrossRef]
- Adi, E.; Anwar, A.; Baig, Z.; Zeadally, S. Machine learning and data analytics for the IoT. Neural Comput. Appl. 2020, 32, 16205–16233. [Google Scholar] [CrossRef]
- Moubayed, A.; Injadat, M.; Nassif, A.B.; Lutfiyya, H.; Shami, A. E-learning: Challenges and research opportunities using machine learning & data analytics. IEEE Access 2018, 6, 39117–39138. [Google Scholar] [CrossRef]
- Angelopoulos, A.; Michailidis, E.T.; Nomikos, N.; Trakadas, P.; Hatziefremidis, A.; Voliotis, S.; Zahariadis, T. Tackling faults in the industry 4.0 era—A survey of machine-learning solutions and key aspects. Sensors 2019, 20, 109. [Google Scholar] [CrossRef] [PubMed]
- Tariq, Z.; Aljawad, M.S.; Hasan, A.; Murtaza, M.; Mohammed, E.; El-Husseiny, A.; Abdulraheem, A. A systematic review of data science and machine learning applications to the oil and gas industry. J. Pet. Explor. Prod. Technol. 2021, 11, 4339–4374. [Google Scholar] [CrossRef]
- Jordan, M.I.; Mitchell, T.M. Machine learning: Trends, perspectives, and prospects. Science 2015, 349, 255–260. [Google Scholar] [CrossRef]
- Reznik, L. Computer Security with Artificial Intelligence, Machine Learning, and Data Science Combination. In Intelligent Security Systems: How Artificial Intelligence, Machine Learning and Data Science Work for and against Computer Security; IEEE: Piscataway, NJ, USA, 2022; pp. 1–56. [Google Scholar] [CrossRef]
- Lee, I.; Shin, Y.J. Machine learning for enterprises: Applications, algorithm selection, and challenges. Bus. Horiz. 2020, 63, 157–170. [Google Scholar] [CrossRef]
- Brownlee, J. Overfitting and Underfitting with Machine Learning Algorithms. 2016. Available online: https://machinelearningmastery.com/overfitting-and-underfitting-with-machine-learning-algorithms/ (accessed on 11 March 2022).
- Culbertson, D. Demand for AI Talent on the Rise. 2018. Available online: https://www.hiringlab.org/2018/03/01/demand-ai-talent-rise/ (accessed on 11 March 2022).
- Gandomi, A.H.; Chen, F.; Abualigah, L. Machine learning technologies for big data analytics. Electronics 2022, 11, 421. [Google Scholar] [CrossRef]
- Tofighy, S.; Rahmanian, A.A.; Ghobaei-Arani, M. An ensemble CPU load prediction algorithm using a Bayesian information criterion and smooth filters in a cloud computing environment. Softw. Pract. Exp. 2018, 48, 2257–2277. [Google Scholar] [CrossRef]
- Ghobaei-Arani, M. A workload clustering based resource provisioning mechanism using Biogeography based optimization technique in the cloud based systems. Soft Comput. 2021, 25, 3813–3830. [Google Scholar] [CrossRef]
- Ain, N.; Vaia, G.; DeLone, W.H.; Waheed, M. Two decades of research on business intelligence system adoption, utilization and success–A systematic literature review. Decis. Support Syst. 2019, 125, 113113. [Google Scholar] [CrossRef]
- Saggi, M.K.; Jain, S. A survey towards an integration of big data analytics to big insights for value-creation. Inf. Process. Manag. 2018, 54, 758–790. [Google Scholar] [CrossRef]
- Tsai, C.W.; Lai, C.F.; Chao, H.C.; Vasilakos, A.V. Big data analytics: A survey. J. Big Data 2015, 2, 21. [Google Scholar] [CrossRef]
- He, H.; Bai, Y.; Garcia, E.A.; Li, S. Adasyn: Adaptive synthetic sampling approach for imbalanced learning. In Proceedings of the 2008 IEEE International Joint Conference on Neural Networks (IEEE World Congress on Computational Intelligence), Hong Kong, 1–8 June 2008; pp. 1322–1328. [Google Scholar] [CrossRef]
- Saeys, Y.; Inza, I.; Larranaga, P. A review of feature selection techniques in bioinformatics. Bioinformatics 2007, 23, 2507–2517. [Google Scholar] [CrossRef]
- Chandrashekar, G.; Sahin, F. A survey on feature selection methods. Comput. Electr. Eng. 2014, 40, 16–28. [Google Scholar] [CrossRef]
- Yu, L.; Liu, H. Efficient feature selection via analysis of relevance and redundancy. J. Mach. Learn. Res. 2004, 5, 1205–1224. [Google Scholar]
- Chawla, N.V.; Japkowicz, N.; Kotcz, A. Special issue on learning from imbalanced data sets. ACM SIGKDD Explor. Newsl. 2004, 6, 1–6. [Google Scholar] [CrossRef]
- Genuer, R.; Poggi, J.M.; Tuleau-Malot, C. Variable selection using random forests. Pattern Recognit. Lett. 2010, 31, 2225–2236. [Google Scholar] [CrossRef]
- Li, J.; Cheng, K.; Wang, S.; Morstatter, F.; Trevino, R.P.; Tang, J.; Liu, H. Feature selection: A data perspective. ACM Comput. Surv. 2017, 50, 1–45. [Google Scholar] [CrossRef]
- Hurbean, L.; Păvăloaia, V.D.; Fotache, D. Improving graduates’ employability in IT field. The case of Accounting and Information Systems study program. Rev. Econ. Bus. Stud. 2015, 135. [Google Scholar] [CrossRef]


Publisher’s Note: MDPI stays neutral with regard to jurisdictional claims in published maps and institutional affiliations. |
© 2022 by the authors. Licensee MDPI, Basel, Switzerland. This article is an open access article distributed under the terms and conditions of the Creative Commons Attribution (CC BY) license (https://creativecommons.org/licenses/by/4.0/).