Abstract
Social networks such as twitter have emerged as social platforms that can impart a massive knowledge base for people to share their unique ideas and perspectives on various topics and issues with friends and families. Sentiment analysis based on machine learning has been successful in discovering the opinion of the people using redundantly available data. However, recent studies have pointed out that imbalanced data can have a negative impact on the results. In this paper, we propose a framework for improved sentiment analysis through various ordered preprocessing steps with the combination of resampling of minority classes to produce greater performance. The performance of the technique can vary depending on the dataset as its initial focus is on feature selection and feature combination. Multiple machine learning algorithms are utilized for the classification of tweets into positive, negative, or neutral. Results have revealed that random minority oversampling can provide improved performance and it can tackle the issue of class imbalance.
1. Introduction
Social networking has become a massive influence in our lives. People create new content on applications such as twitter every day and it seems that this trend will continue with substantially more content in the near future. People on twitter create new content which becomes the source for various decision-making procedures in many unique areas. There is a simple reason for it, as we know that user data is an important asset which helps us understand the sentiment of the general public. We can identify problems of one group of people by investigating another group of people.
The way our society functions has been significantly altered by the Internet and related online technologies. Social media applications such as Facebook, Instagram, and Twitter are now commonly used for idea exchange, information sharing, business- and trading-related promotions, political, sociological, and ideological campaigning, and product as well as service promotion [1]. Social media is typically investigated from a variety of angles, such as gathering business intelligence for the promotion of goods and services, keeping an eye out for criminal activity to identify and mitigate cyber threats, and using sentiment analysis to evaluate customer feedback and reviews [2]. Researchers have been studying sentiment analysis extensively in recent years. Several tested techniques have been put forth in the past decade within this context [3].
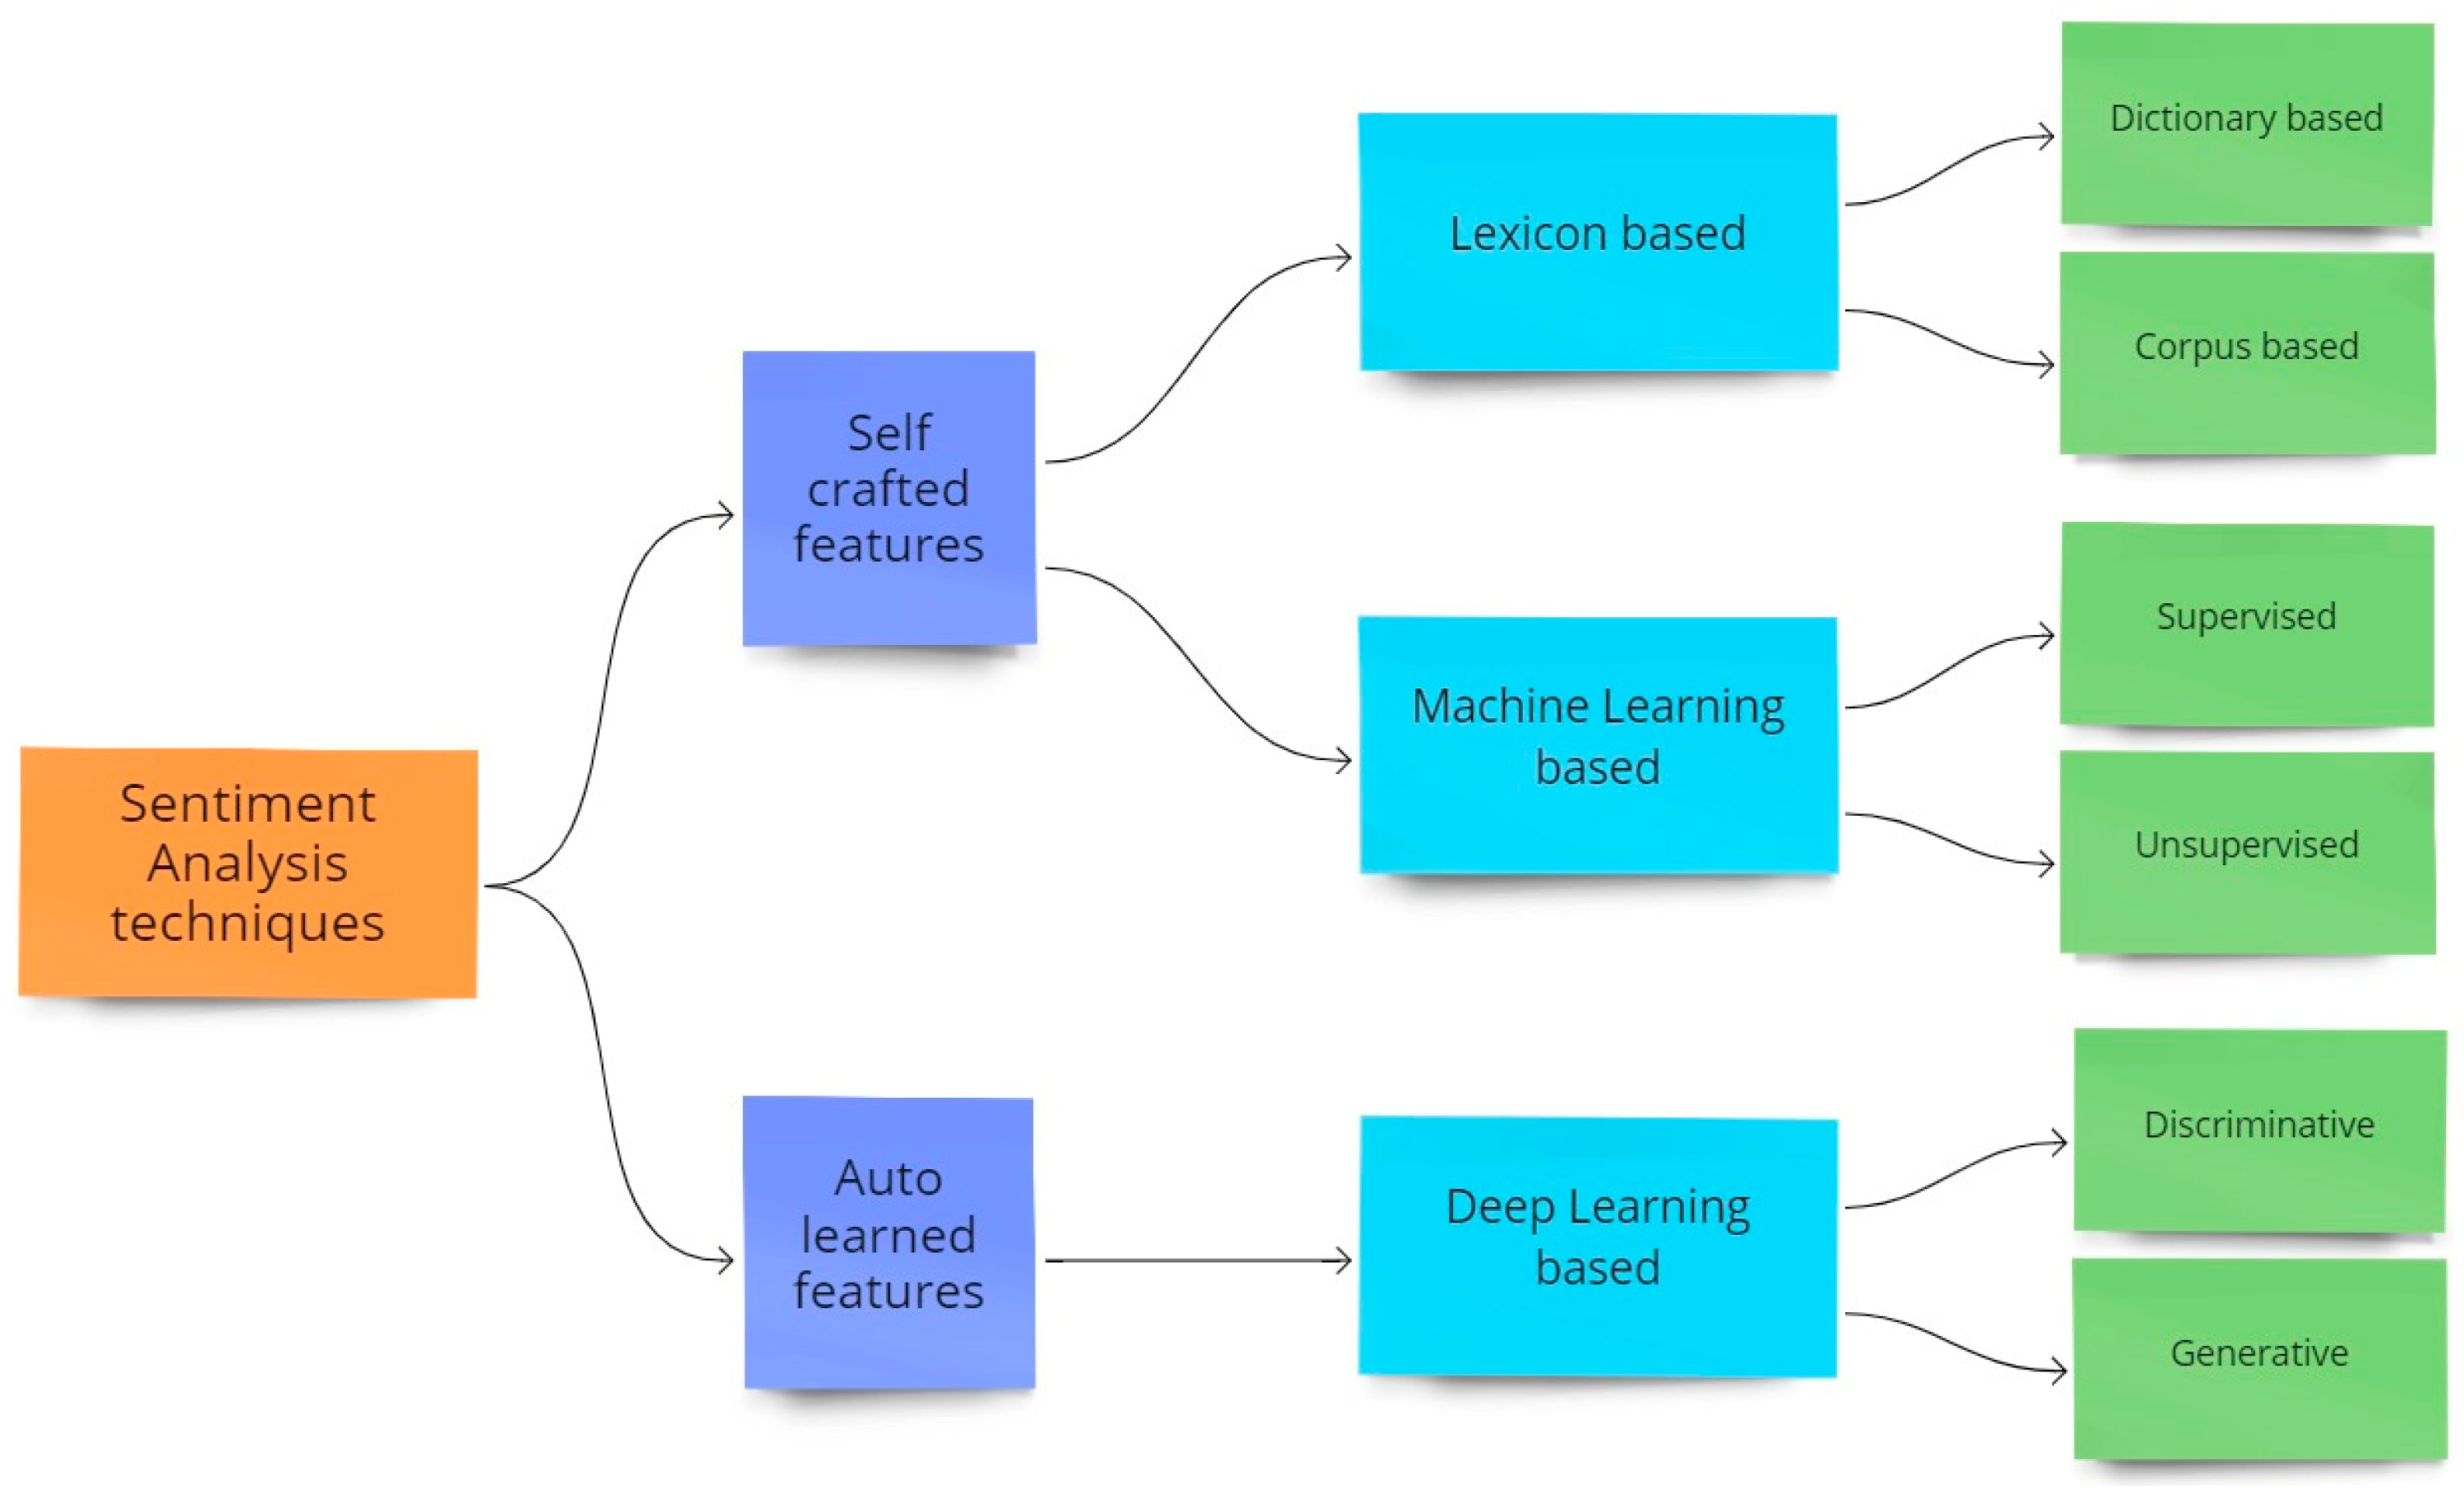
The primary methods for sentiment analysis are shown below in the Figure 1:

Figure 1.
Sentiment Analysis techniques.
- Lexicon-related [4]
- Machine Learning (ML) related [5]
- Deep learning (DL) related [6]
The lexicon-related methods [4] depend on categorizing words according to their sentiments. Normal word categorizations include two (+ve and −ve), three (+ve, neutral, and −ve), or five categories (very +ve, +ve, neutral, −ve, and very −ve). The high caliber of sentiment dictionaries that contain the substantial word corpus is categorized in the techniques indicated above, which are necessary for the efficiency of lexicon-related approaches [5]. The requirement to add a sizable number of linguistic resources in order to identify the crucial terms for sentiment analysis is a significant downside [7] of this method.
Both supervised and unsupervised learning techniques are used in the ML-based approach [8,9]. In the former, entire texts are tagged with sentiment categories rather than individual words. It is a complicated, labor-intensive, and error-prone process that calls for properly crafted instructions. In the latter, there is no label available for the tweet text as there are no previous assumptions for the model. The data is simply inserted, and the model learns the structure of the data itself.
In order to speed up text labeling and improve its quality, it seems sensible to develop semi-automatic approaches that use sentiment dictionaries [10]. Our chosen dataset is partitioned into a training set and testing set to accurately test the performance. The TF-IDF metric is then utilized to unsheathe attributes from texts in the following stage. Texts are then categorized using machine learning (ML) methods, such as naive Bayes classifier (NBF), logistic regression classifier (LRC), support vector machine classifier (SVMC), k-nearest neighbor classifier (k-NNC), decision tree classifier (DTC), random forest classifier (RFC), XGBoost, and Gradient Boost classifier (GBC). Unsupervised learning [9] does not use labelled training data and does not call for human involvement. K-means clustering [11] is the unsupervised technique which is utilized most frequently. This technique gathers related data points around centroids, which serve as the clusters’ nuclei, and identifies their shared characteristics. Despite not requiring an early preparation of dataset by human specialists, clustering-based techniques are sensitive to the location of central points. Additionally, the clustering method combines instances depending on factors that are implicit in the grouping process. A recent study [12] has focused on a DL-related strategy that aims to improve text classification performance due to its improved results when trained with a large enough data. In order to do this, the employment of various neural networks such convolution based (CNN) and recurrent based (RNN) has been extensively described in the literature [6]. In recent years, transformer-based sentiment analysis such as with DistilBERT has also been researched [13].
The focal point of three above mentioned methodologies is on the current sentiment analysis research. There is a lack of tools, available data, and approaches for sentiment analysis that enable users to play around with, and test various algorithms. The data that is available to test might not be balanced which leads to further issues. This conversation has made it evident that there is an increasing demand for a comprehensive sentiment analysis framework that will close the gap shown in the earlier studies [14].
Furthermore, SA is fraught with difficulties [15]. The first is about ambiguity: in one scenario, a term may be regarded good while yet being considered bad in another. A second problem is diverse methods of expressing thoughts—people do not always communicate their opinions in the same manner. Famously, with sites such as Twitter or blogs, people communicate various viewpoints in the same sentence, which a person can comprehend but a machine cannot. The third one is related to the preprocessing of data and the dataset itself [14,15]. Sometimes the datasets are highly imbalanced in the case of any classification task such as sentiment analysis. So therefore, a complete framework is required to not only handle the imbalanced data but also provide a complete preprocessing method that can lead to a correct handling of the imbalanced data. Therefore, it is important for us to improve the process of sentiment analysis with new techniques, so that unseen data can be predicted with accuracy. In this paper we have made the following contributions:
- Presenting a comprehensive framework for improved sentiment analysis which is specifically designed for imbalanced datasets;
- Handling the imbalanced dataset for multiclass classification problem through the use of random oversampling;
- Selection of best features for sentiment analysis. This task must be performed manually as it is highly dependent on the dataset and it must not be automated;
- Finding the best preprocessing order for the tweet text so that accurate oversampling can be performed without causing the problem of overfitting;
- Finding the actual impact of over-sampling when compared to the results generated with non-oversampled data.
2. Literature Review
The research being completed in the fields of sentiment analysis are covered in this section. There are numerous studies that analyze the opinions expressed by individuals on Twitter and categorize the tweets as good, negative, or neutral. Massive amounts of literature on sentiment analysis are available to be explored; however, as our paper is focused on resampling and machine learning, we will, therefore, primarily focus on those studies. A taxonomy of previous literature is provided in Table 1 which focuses on ML-related as well as DL-related methods for sentiment analysis.

Table 1.
Taxonomy of SA literature related to ML and DL methods.
3. Methology
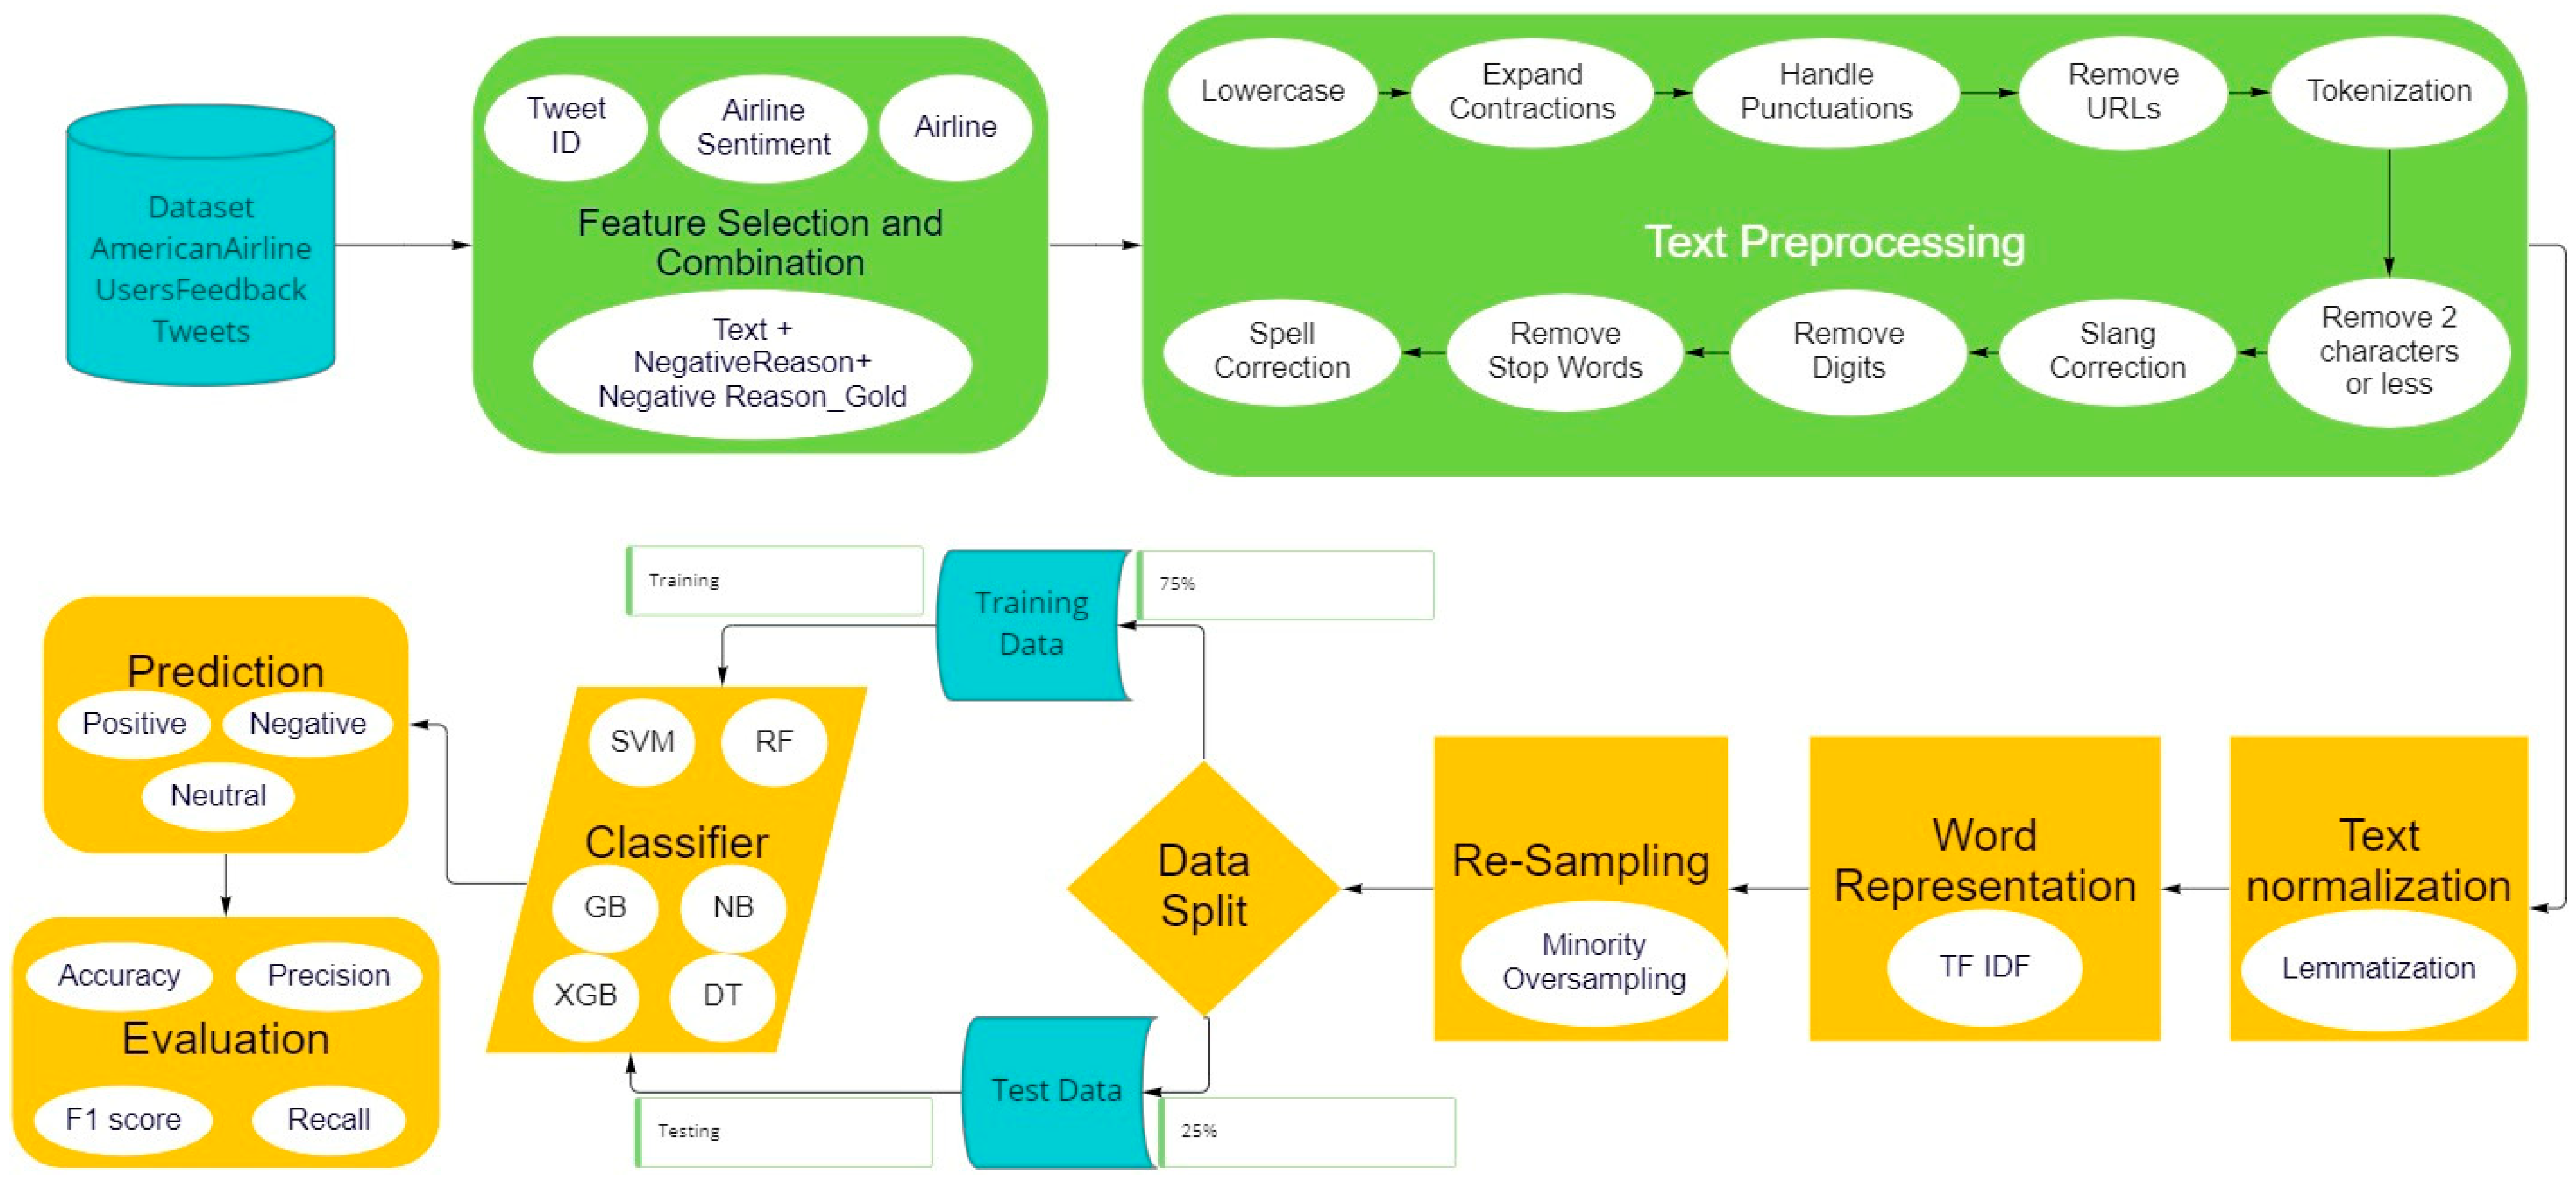
In this section we will present a detailed framework for improved sentiment analysis. We will also discuss all the elements of the framework in an ordered manner. Framework diagram is shown below in Figure 2.

Figure 2.
Framework diagram for sentiment analysis through resampling.
3.1. Proposed Framework
In this study, a unified framework that contains all the elements needed for sentiment analysis has been constructed. This modular approach offers many sentiment analysis philosophies with an emphasis on improvements. The suggested framework is made up of various modules that control how the system functions internally. We use a pipeline-based method to automate the entire framework, performing several modules such as feature selection and combination, multistage text preprocessing, text normalization, Word representation and resampling.
3.1.1. Feature Selection and Combination
In order for this framework to effectively perform its task, we need to spend some time on manual inspection of the dataset. Since we are performing sentiment analysis on the US airline dataset (details in Section 4), we need the features which have class labels. In this dataset column, “airline_sentiment” contains class labels. We have also chosen column “tweetID” for uniquely identifying the tweets. We also combined the features “text” which contains the tweets and the feature “negative reasons”. This was done to enhance tweets sentiment.
3.1.2. Text Preprocessing
The second stage of this framework includes preprocessing of the tweets. This is completed by various functions to remove unwanted text from the data. This results in faster preprocessing of text thus reducing the time complexity of all the upcoming modules of the framework.
- Converting all characters to lowercase
Transforming all words to lowercase is also a very common preprocessing step. This step can reduce the required processing power. For example, for a computer ‘good’ and ‘Good’ are two separate words that would need to be processed separately. Table 2 provides an example of this process.
Table 2.
Output after lowercasing of sample tweet.
- Expanding contractions
A word created by condensing and combining two words is known as a contraction. They include words such as can’t (can + not), don’t (do + not), and I’ve (I + have). Expanding contractions can be an effective preprocessing strategy for most NLP tasks. Table 3 provides an example for expanding contractions.
Table 3.
Output after expanding contractions of sample tweet.
- Tokenization
Tokenization is a method where any amount of text is split into tokens, which could be words, sentences or paragraphs etc. Initially, we utilized StringTokenizer, but because to its flaws, we chose the far superior LingPipeTokenizer. It is vital to note that each document’s tokens (keywords) and sentences (list of keywords) are stored in proprietary data structures.
- Removing words less than two characters
Since words of two characters or less do not provide any key information, we have excluded those words from the dataset.
- Removing repeating words
When dealing with twitter data, it is important to remember that most hashtags repeat too often to present any useful information for the training of our classifier. Therefore, removing words that start with ‘@’ can be useful for our dataset. For example, words that mentioned the name of an airline or the name of a person do not provide any information in the context of sentiment analysis, so we have removed these words from the tweets. These words include ‘@VirginAmerica’, ‘@united’, ‘@SouthwestAir’, ‘@JetBlue’, ‘@USAirways’, ‘@AmericanAir’, ‘@Americ’, etc.
- Removing punctuations
Punctuation includes characters such as a full stop, comma, question mark, exclamation mark, semi-colon, colon, ellipsis, brackets, etc. We removed punctuations from the data using string.punctuation. Certain punctuations were not removed by the automated function; therefore, a separate string replacement line of code was required to remove some special characters. For example, ‘@’ in words such as @UnitedAirlines. Table 4 provides an example of removing punctuations.
Table 4.
Output after removing punctuations from sample tweet.
- Removing digits
We have removed numbers because they do not provide any information for our data. However, that is not the case for all NLP tasks. Table 5 provides an example of removing digits from the text.
Table 5.
Output after removing digits from sample tweet.
- Slang correction
This phase entails fixing any slang or acronyms used in internet communications. To convert slang or abbreviations to their original and abbreviated forms, we employ predetermined dictionaries and maps: for instance, GOAT—‘Greatest of All Time’; or OML—an abbreviation for ‘Oh my lord’. Table 6 provides an example of slang correction.
Table 6.
Output after handling slangs and abbreviations.
- Removing stop-words
A stop word is a commonly used word such as ‘the’, ‘a’, ‘an’, ‘in’, etc. Since these words do not provide any value in terms of sentiment, they are therefore excluded from the dataset. Table 7 provides an example of stop-word removal from the text.
Table 7.
Output after removing stop-words.
- Spell correction
It can be very useful to include spell correction as a preprocessing step. Since most user tweets contain spelling mistakes, it can create several word features that might belong to the same class. For example, different users might misspell the word “abbreviation” in three different ways thus creating three separate word features that will need to be processed which will consume more time. Table 8 provides an example of spell correction.
Table 8.
Output after spell correction.
3.1.3. Text Normalization
Lemmatization is the method of transforming a word to its base form. The method of stemming involves reducing an infected term to its fundamental or root word. Each token is converted to its stem form via the Porter-2 algorithm [27] and stored in the keyword object along with the original token. Lemmatization was applied by using POS tagging and ‘WordNetLemmatizer()’. We chose lemmatization because it provides better results as compared to stemming but takes a lot more time. This was a decision of quality vs. speed, and we chose quality through lemmatization.
3.1.4. Word Representation
We will be using a bag of words model to create features from our text. It is a method of extracting words as attributes from text, such as tweets, for use in a framework, which can be supplied to ML algorithms. It is important to perform this step before the oversampling because it will considerably save processing time. We used TF-IDF vectorizer for creating word embedding because it provided the best results for our model. TF-IDF assesses how significant a word is to a record within a group of records. In order to perform this task, two separate equations are multiplied: the no. of times a word appears in a record and the inverse document frequency of a single word over a group of records.
3.1.5. Oversampling
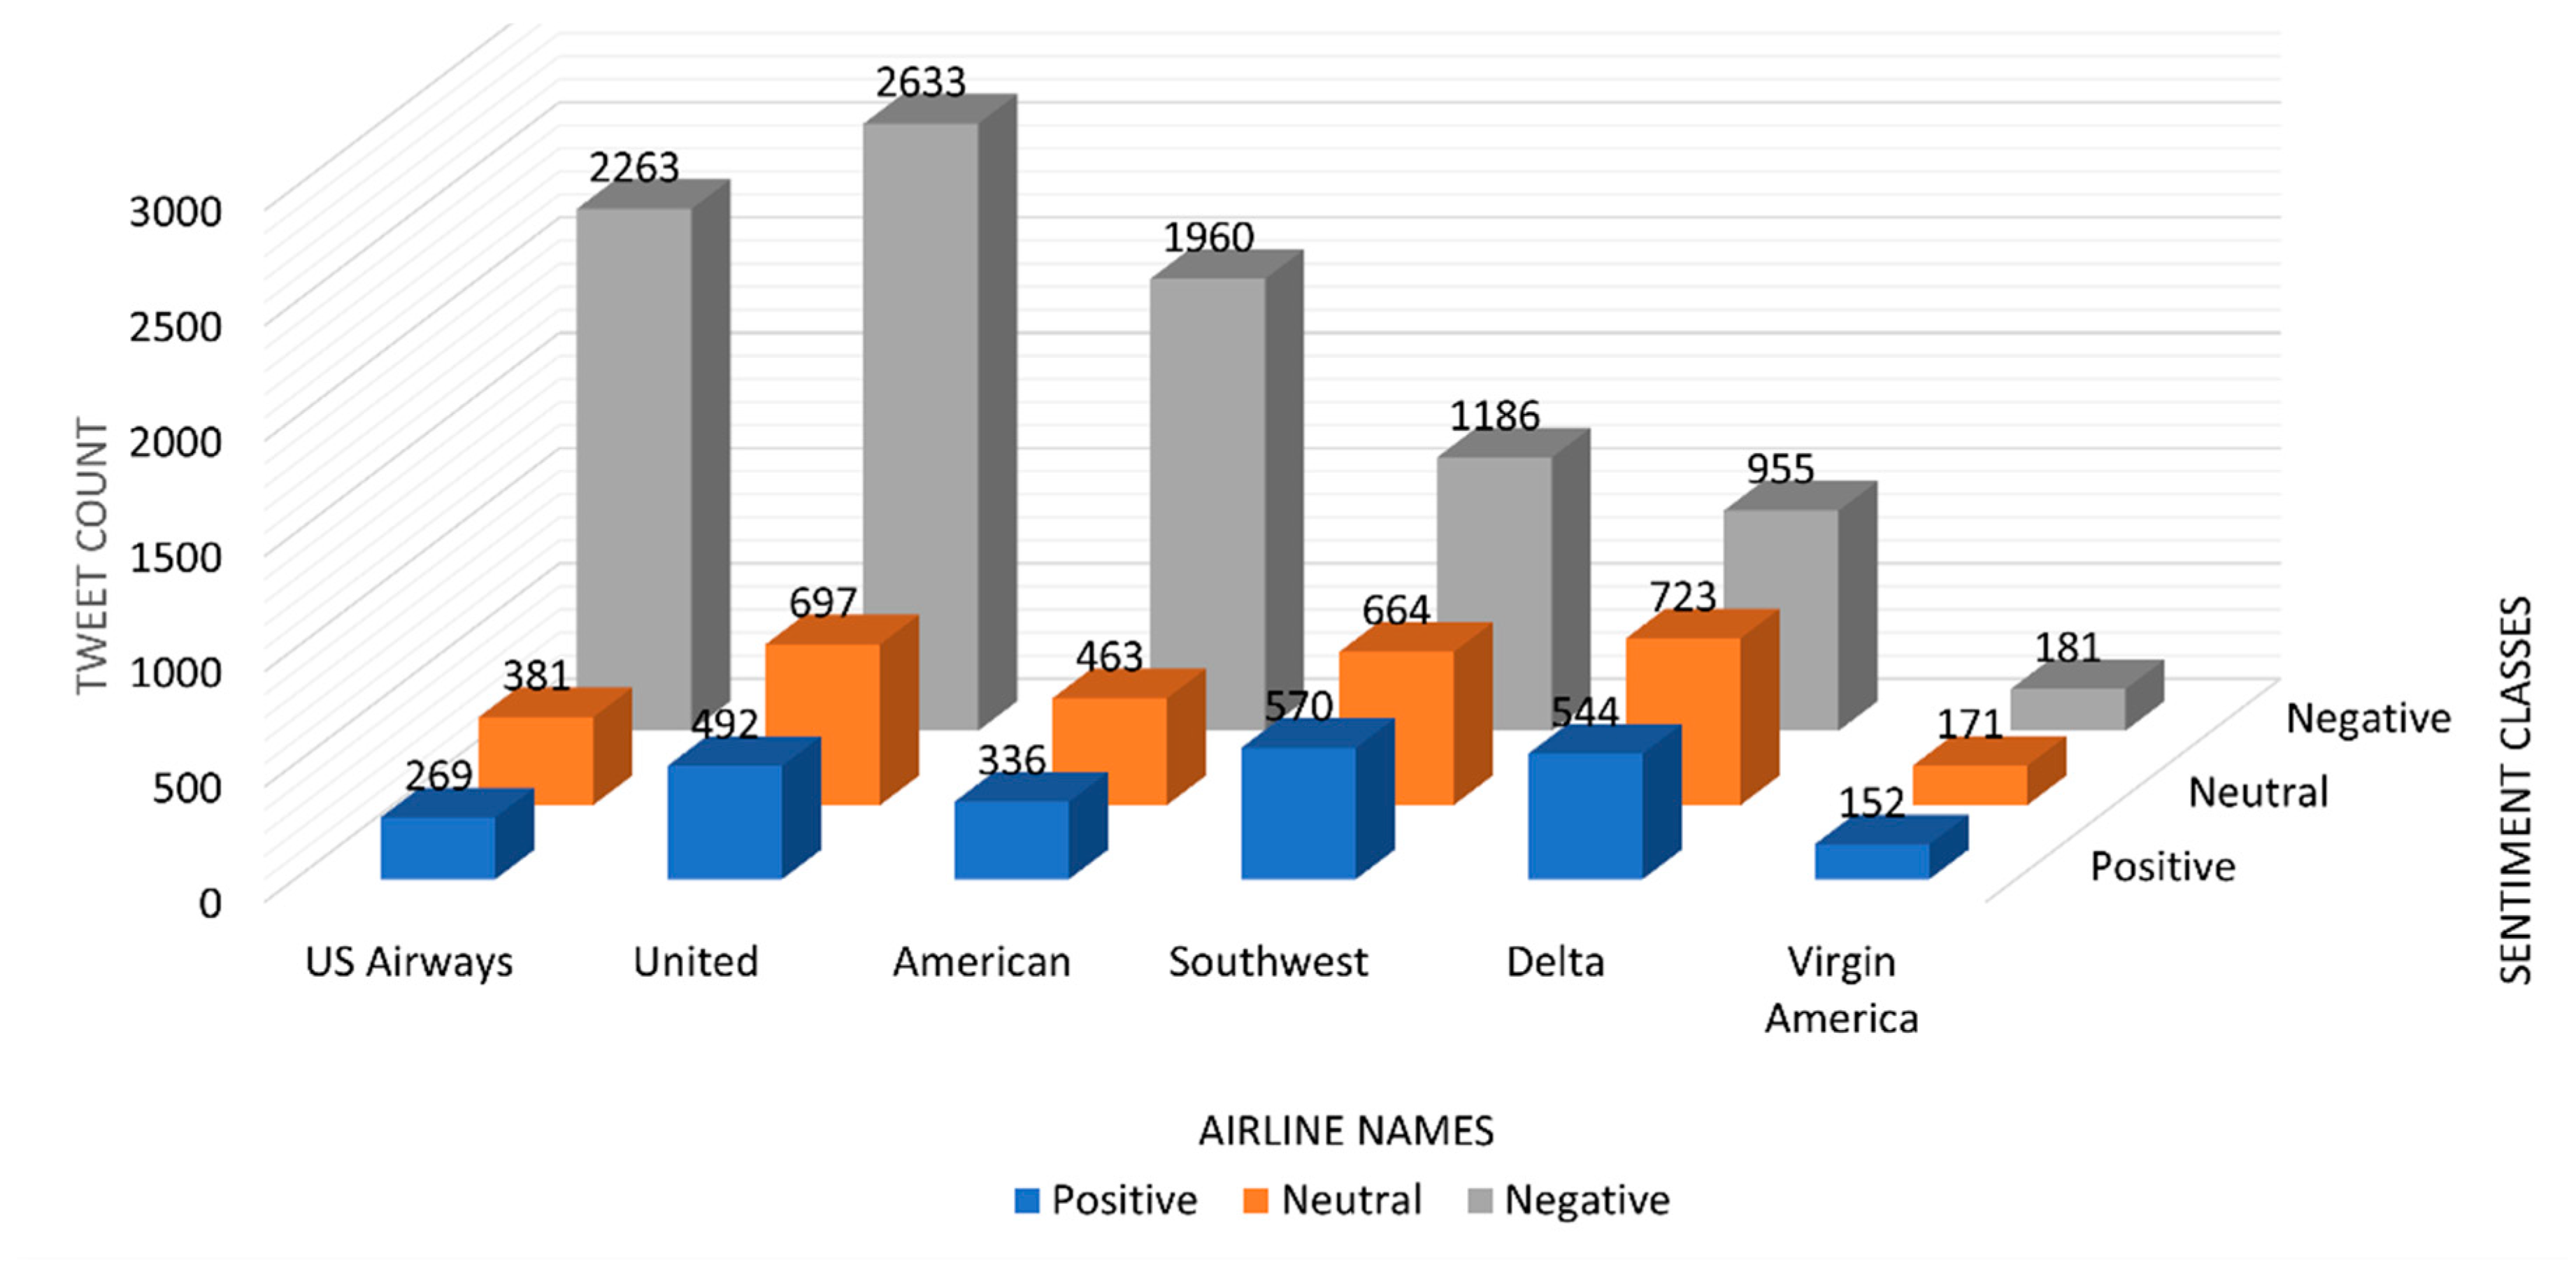
Various strategies have been put out to address the issue of class imbalance. The oversampling method is the most well-liked of them all. The essential idea behind the strategy is to introduce various ratios of synthetic samples while oversampling the minority class [33]. For binary and multi-class classification tasks, imbalanced classes present a significant challenge in the training of an effective classifier [34,35]. Due to the extreme imbalance between the classes, a majority classifier would produce very accurate results by assigning the most prevalent class to each instance but failing on majority items from the other present classes will lead to a decreased performance in terms of low accuracy and F1-score, which are our main performance criteria. In order to get around this issue, class resampling approaches give us several distinct additional options. In under-sampling techniques, the part of the predominant class is removed from the training data, bringing the size of the training dataset closer to or on par with the minority class. The disadvantage of such a strategy is that the less dominant class is too small to make the other present classes equal to its size, which results in the loss of a significant amount of important and valuable information. A contrasting process is accomplished using the oversampling method. By multiplying the instances of the minority class to the required size, the minority class is made larger to match the size of the predominant class. The benefit of this approach is that it keeps all of the dataset’s important data. Numerous algorithms have been presented that are based on oversampling as discussed in the literature review. The most important aspect of proposing an efficient algorithm is to lose the least amount of data possible. The most effective way to solve this issue is through oversampling. As it is visible from Figure 3, that dataset has a lot more tweets that belong to the negative class. Negative sentiment tweets have over 9000 tweets which is about 63% of the dataset, whereas the neutral class is 21% and positive class is only 16%. Our framework addresses the class inequality by oversampling the less dominant classes randomly. One of the most recently used oversampling method is SMOTE [29], but for our framework we chose a random oversampling approach which involves making copies of instances in the less dominant classes, although these instances will not add any new information to the framework, but new instances will be copied from the existing instances.

Figure 3.
Total number of sentiment tweets for each airline.
3.1.6. Sentiment Classification
We applied six different ML algorithms to test the results with our proposed framework. Machine learning classifiers including Random Forest classifier (RF-C), Multinomial Naive Bayes (MNB-C), Support Vector Machine classifier (SVM-C), Gradient boost, XGB, and Decision Tree Classifier (DTC) have been implicitly used in our experiment on the testing dataset.
4. Results and Discussion
In this section, we will discuss the data that is utilized for the experiments. We will also be outlining our hardware and software configuration for tests. Later, we go over various evaluation criteria and how well our system performed against them. Precision, recall, F-measure, and execution time are just a few of the performance measures we have utilized. We also compare various ML classifiers.
4.1. Dataset
Following dataset was used to check the performance of our model:
- Twitter US Airline Sentiment
This dataset uses tweets to find the satisfaction level of the customers. The dataset conains tweets of six different airlines which include ‘VirginAmerica’, ‘united’, ‘SouthwestAir’, ‘JetBlue’, ‘USAirways’, and ‘AmericanAir’. We will be using the text of the customers tweets to train the classifier so that predictions can be made on unseen tweet data. We have split the dataset by using 75/25, where 75% is training data and 25% is test data. Table 9 lists the features of the dataset used in this study.
Table 9.
Feature description of selected dataset.
Discussion on Dataset
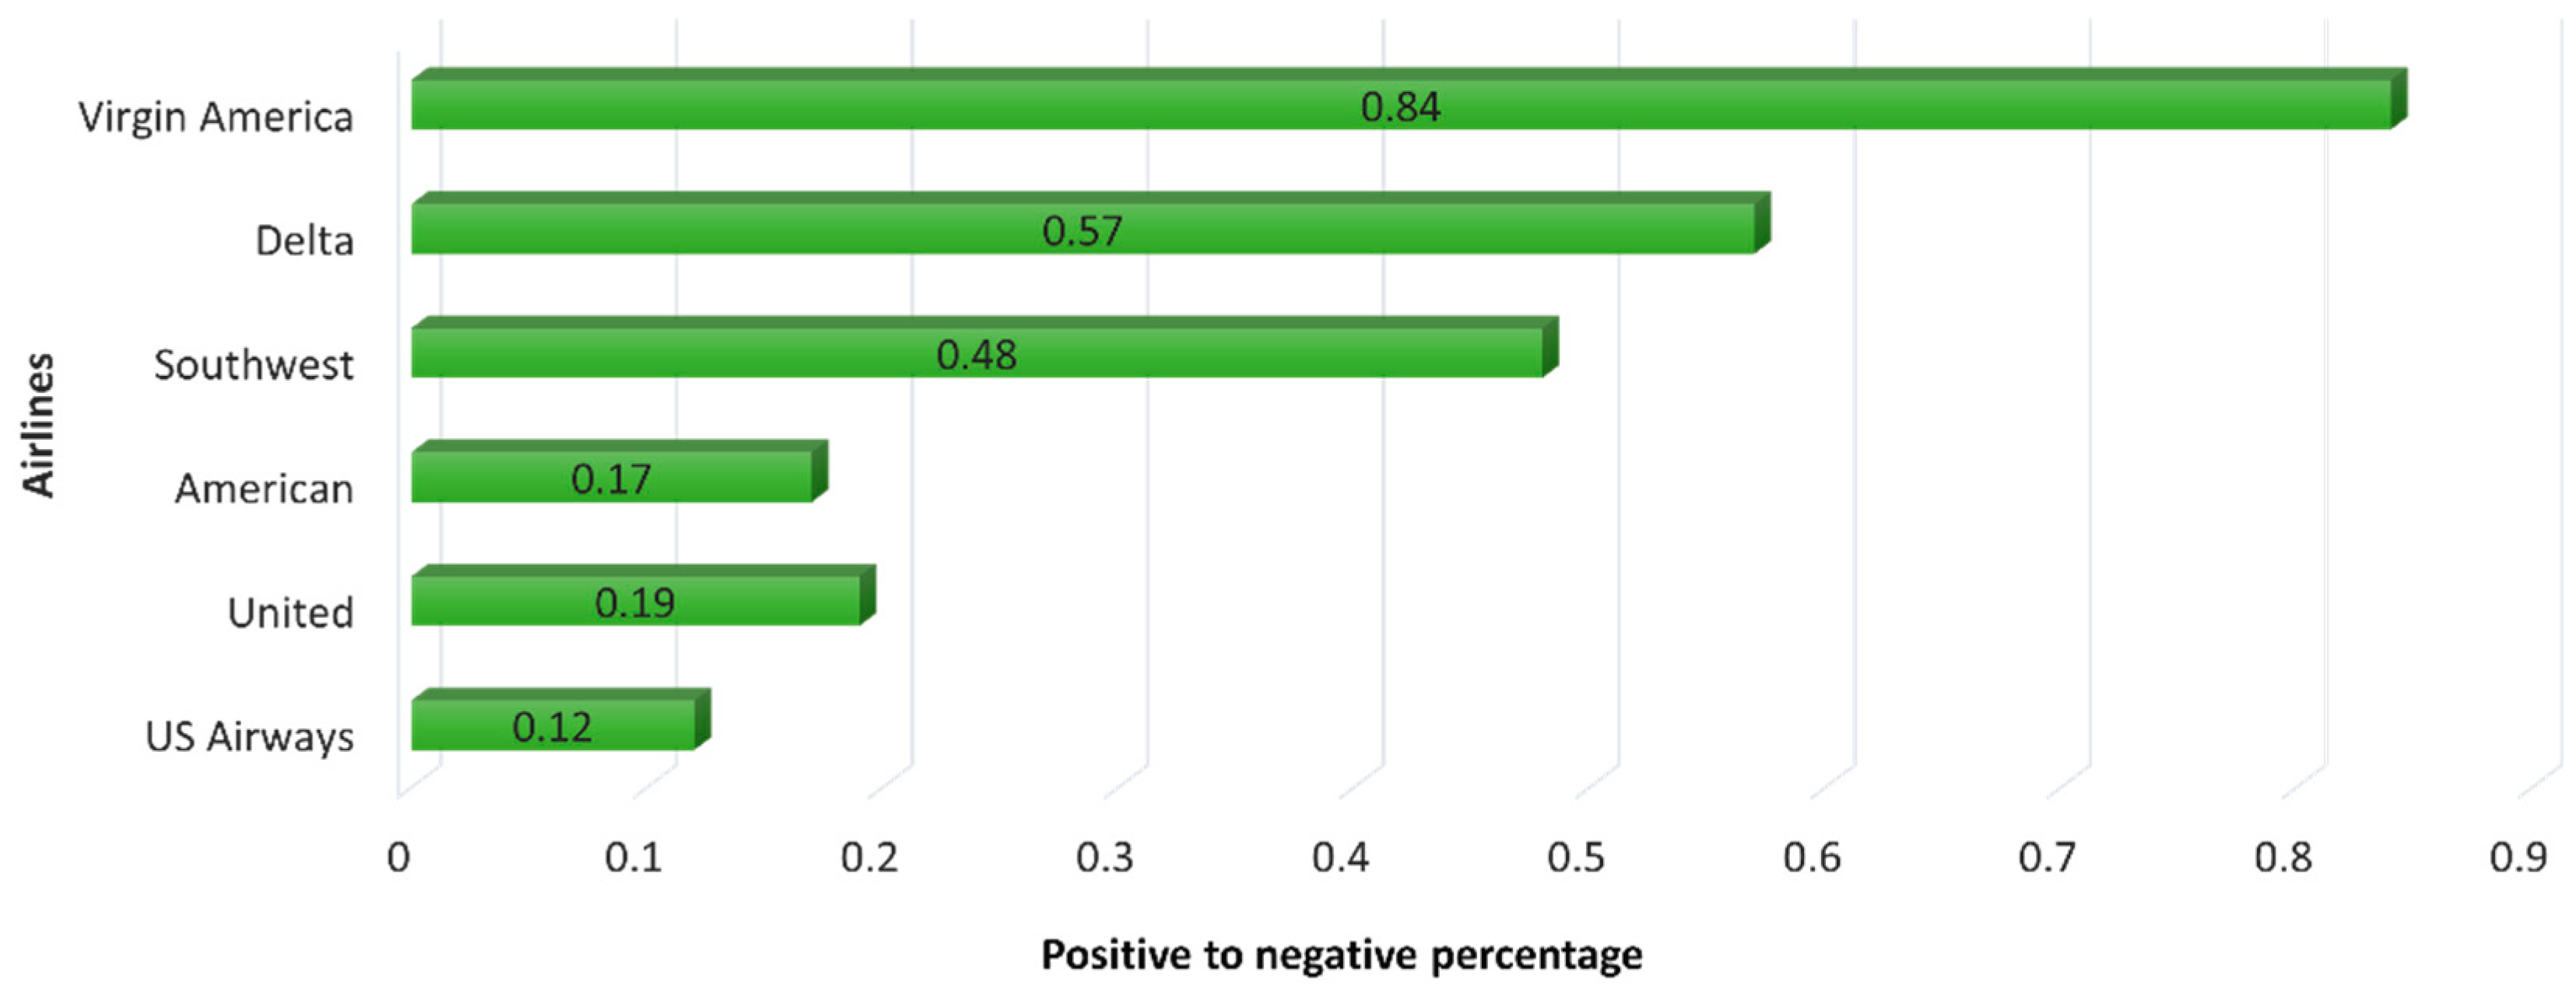
Figure 3 shows the number of tweets for each airline in terms of sentiment classes. It shows that the tweet distribution is not equal with respect to each airline and their sentiment classes. After thoroughly looking at the results of different classification algorithms, it is clear that ‘South West’ airline have the most positive tweets, but that does not mean that it has the most user satisfaction level, because we also have to look at the negative tweets. If we just look at the positive tweets, then ‘South West’ can be considered to have the most user satisfaction level. Another way is to calculate the ratio of positive to negative tweets to calculate user satisfaction level. Although virgin America has the least amount of positive to negative tweets ratio but since its data is very small, the ratio cannot be considered. Therefore, the logical conclusion is that the Delta airline can be considered to provide the most user satisfaction level.
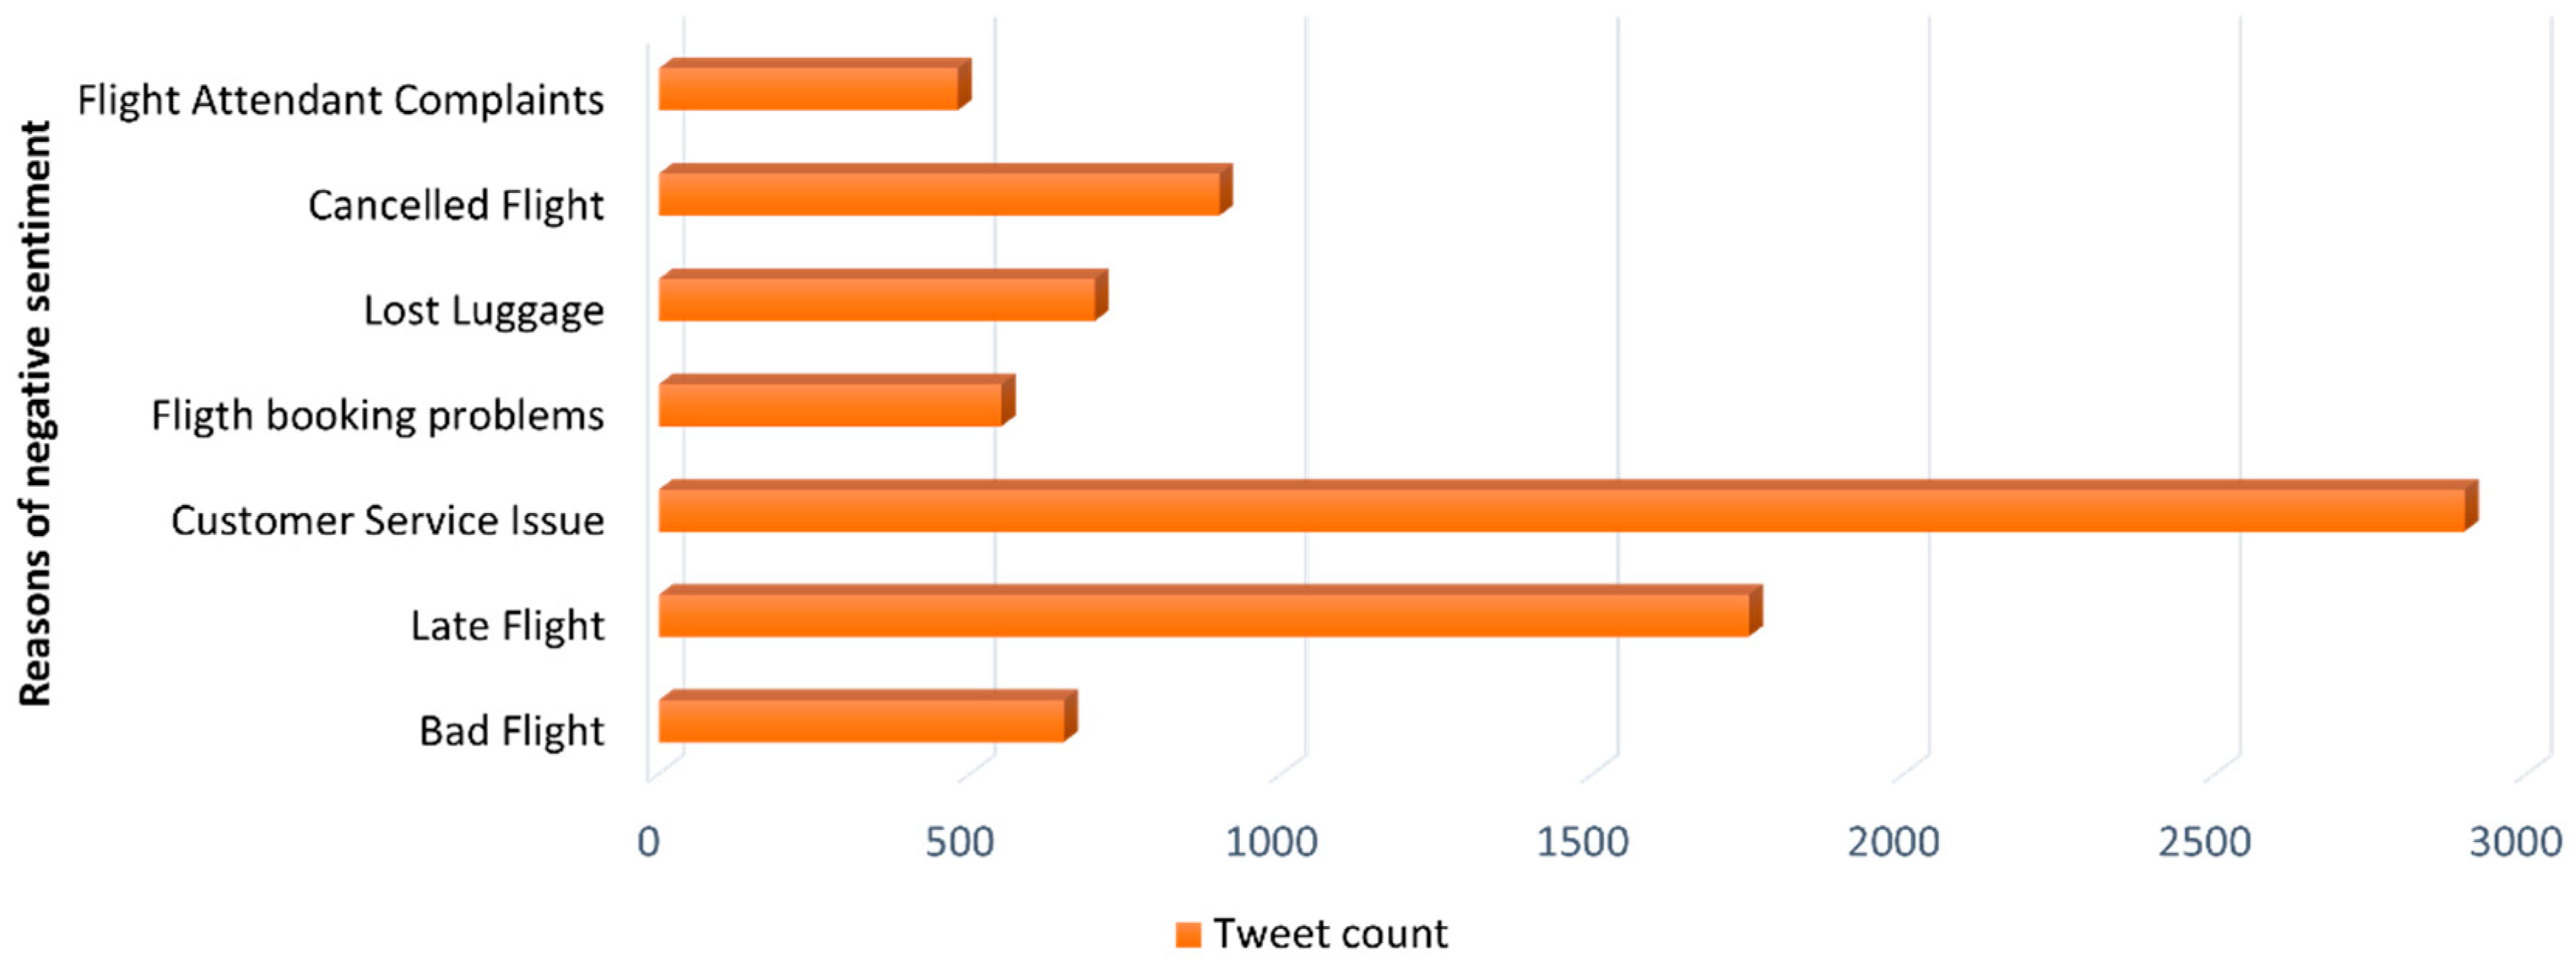
We can also extract useful information about the various reasons for unsatisfied customers as shown in Figure 4 and Figure 5 above. However, it is important to remember that this information must be extracted after the preprocessing has been performed. As most of the common keywords before preprocessing are stop-words or other non-useful words, proper preprocessing is hence performed, which results in valuable data which can be used for sentiment analysis.

Figure 4.
Positive to negative tweet ratio of each airline.
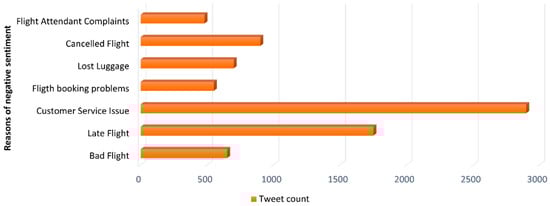
Figure 5.
Top seven reasons for unsatisfied customers.
4.2. Experimental Setup
The experimentations were performed on a computer with an AMD Ryzen 5 3rd generation processor running at 4.2 GHz, 16 GB of RAM, and a 512 GB solid state drive. The development of the framework and the experimentation was carried out in python computer programming language using spyder v5 developed by spyder project contributors under MIT license in USA.
4.3. Evaluation Metrics
The main metrics utilized in this study for the evaluation of our framework are accuracy and F1 measure, but we have also included the results with precision and recall for better understanding of the results. These evaluation metrics are consistent with those utilized in another research [36,37]. We have defined the evaluation technique as follows:
- True Positive (TP): It produces an output which shows the right prediction made for the +ve class.
- True Negative (TN): It produces an output which shows the right predictions made for the −ve class.
- False Positive (FP): It produces an output which shows the wrong predictions made for the +ve class.
- False Negative (FN): It produces an output which shows the wrong predictions made for the −ve class.
Accuracy: It is usually not a good measure for the imbalanced dataset, but as we have used up-sampling to deal with class inequality problem, accuracy is therefore an accurate measure in this scenario. It is more formally defined as [38,39]:
Precision: A classification algorithm’s capacity to detect only meaningful data items. More formally, the proportion of positively predicted data items to the total number of positively predicted data items. Mathematically, we define it as:
Recall: A classifier’s capacity to discover all relevant examples within a data collection. More formally, the proportion of accurately predicted positive data items in relation to all data items in the actual class. Mathematically, we define it as:
F1 Measure: Precision as well as Recall are the usual techniques that consider the issue of class inequality. F1 measure utilizes both to produce a new metric. Mathematically, we define it as:
4.4. Classification Results
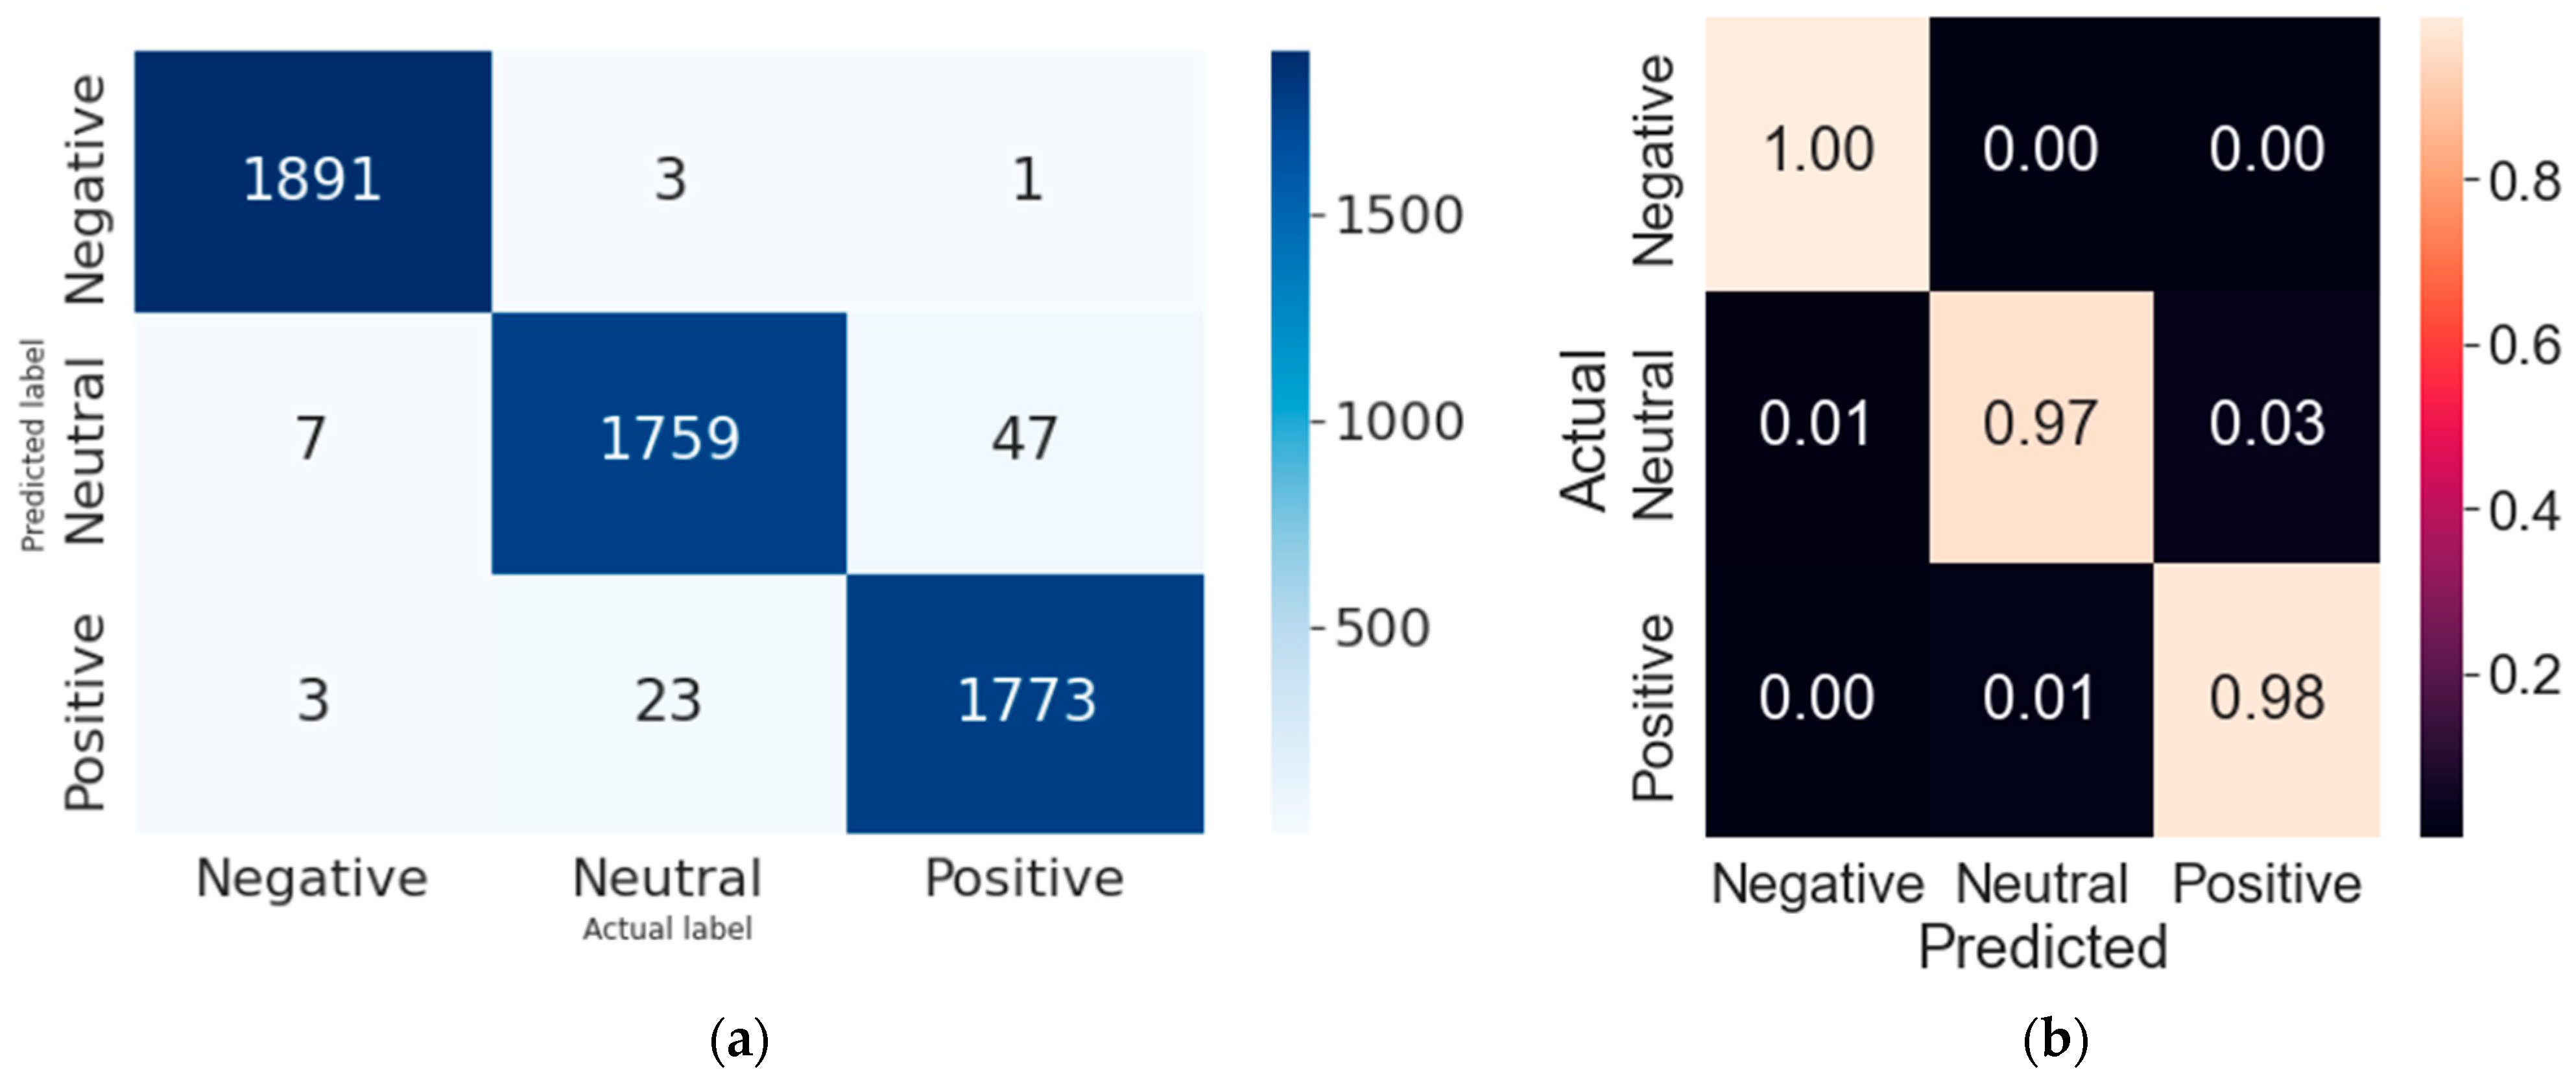
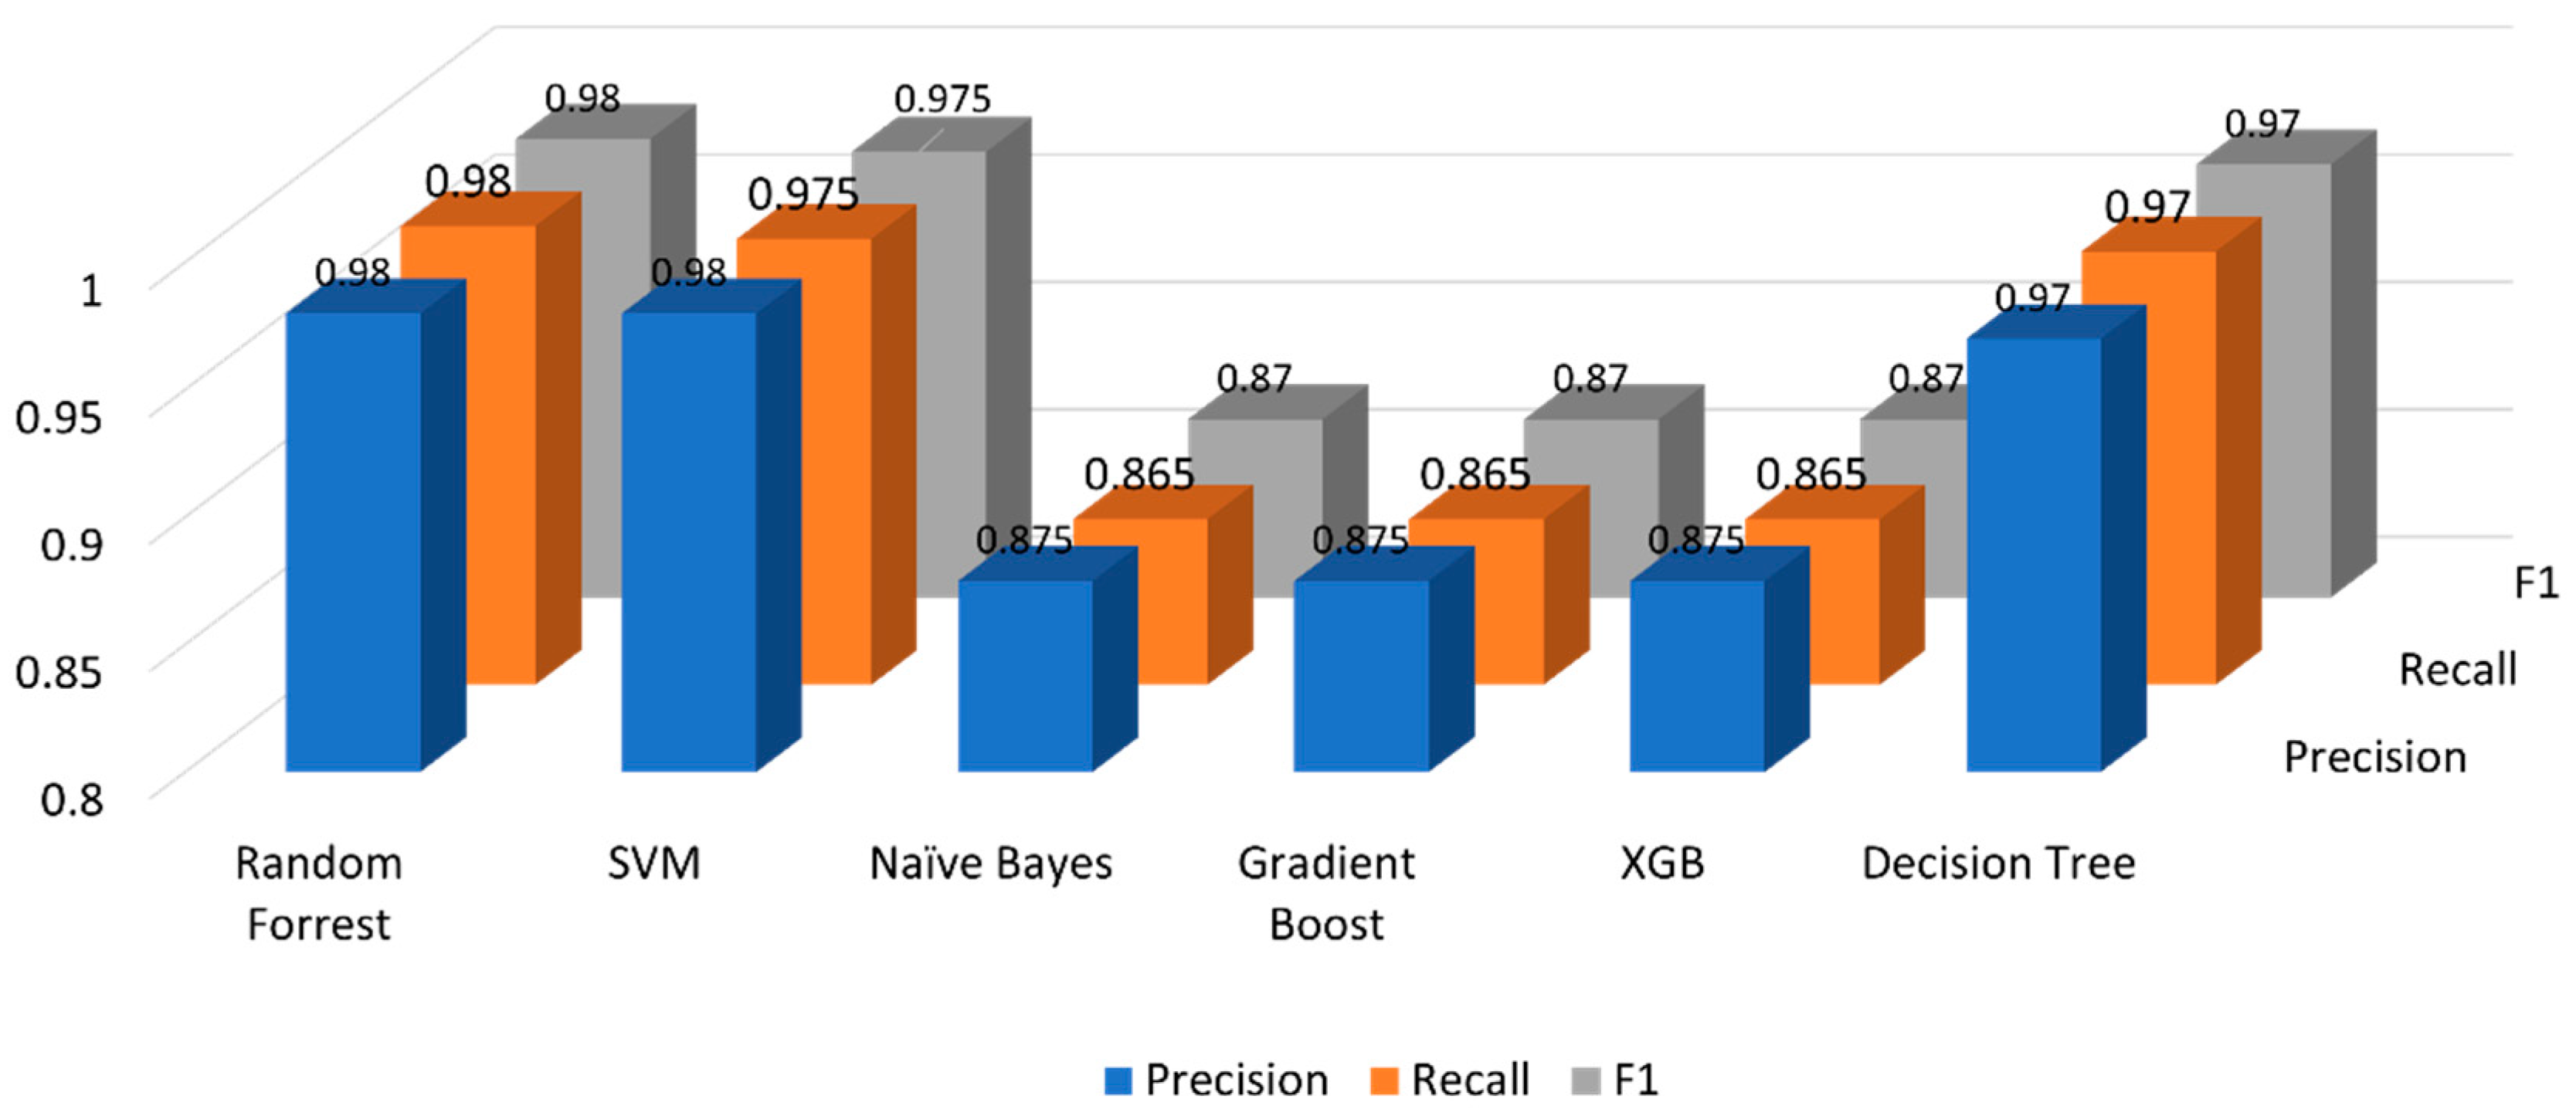
Random Forest produced the best results with the selected dataset for sentiment analysis with an accuracy of 98.3% and F1 score of 0.98. The confusion matrix in Figure 6 provides the actual vs. predicted labels of our classifier. Actual labels are presented on the horizontal axis whereas the predictions made by the classifier are shown on the vertical axis. Diagonal values in blue color from top left to bottom right show the ‘’true positives’’ of negative, neutral, and positive sentiment class, respectively. SVM also produced extremely good results with the selected dataset for Sentiment Analysis providing the accuracy of 97.8%. Comprehensive results for each classifier have been provided in Figure 7. Table 10 provides a direct comparison of results for each sentiment class.

Figure 6.
(a) Confusion matrix with Random Forest classifier with best predictions; (b) Confusion matrix of RF classifier with normalized values.

Figure 7.
Classifier performance comparison.
Table 10.
Classification report for all classifiers.
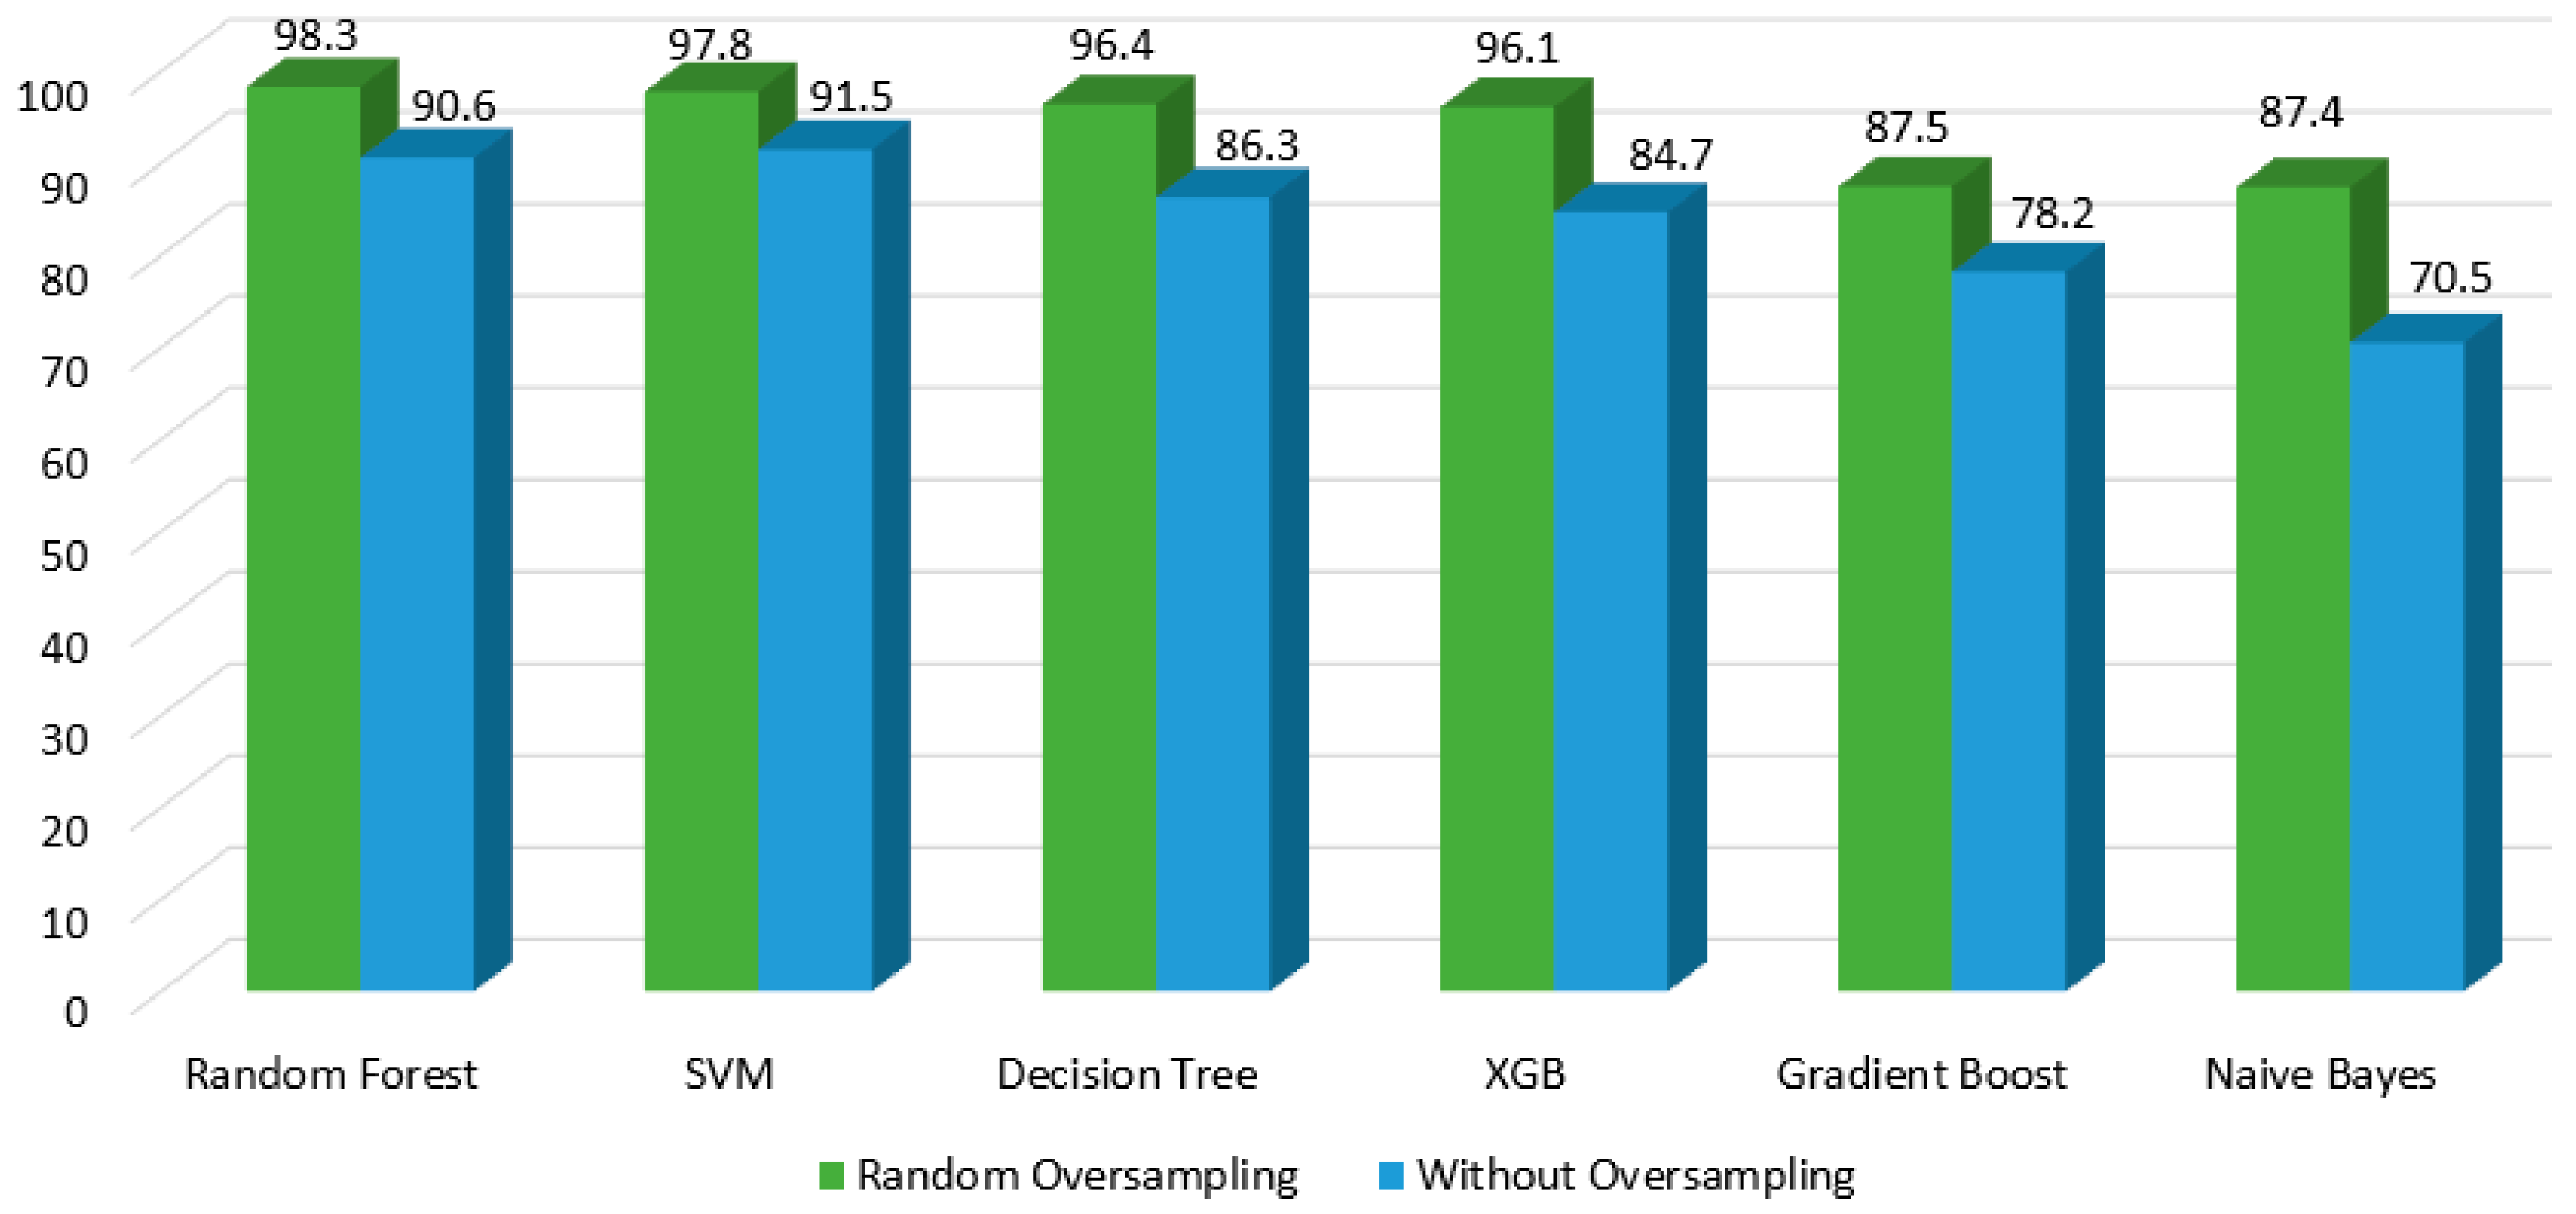
4.5. Results Comparison: Oversampling vs. No Oversampling
It is clear from the results below that resampling effects the results of each classifier. Using oversampling might be useful but it may cause overfitting, whereas under sampling results in huge loss in accuracy due to underfitting, which is caused by a reduction in the majority class of an already small dataset. Figure 8 presents the direct accuracy comparison between oversampling and no oversampling results. We can see that the results have been dramatically improved when random oversampling is utilized for the data imbalance. For certain classifiers, the improvement is extremely evident. This result was possible because we handled the data imbalance correctly.
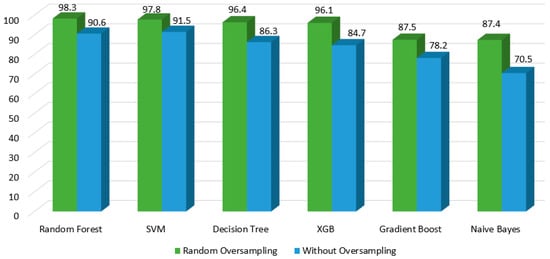
Figure 8.
Accuracy comparison with and without oversampling.
5. Result Visualization and Discussion
Our findings and discussion are presented in this section.
The results of Sentiment Analysis depend on several factors such as preprocessing the data. Another important factor is the selection of the classifier to train and test on the given dataset. To choose the best classifier, we have tested the results with many different classifiers such as SVM, naïve Bayes, etc. ‘Random Forest’ provided the best accuracy out of all the other classifiers. It makes sense since it is an ensemble machine learning algorithm for classification tasks.
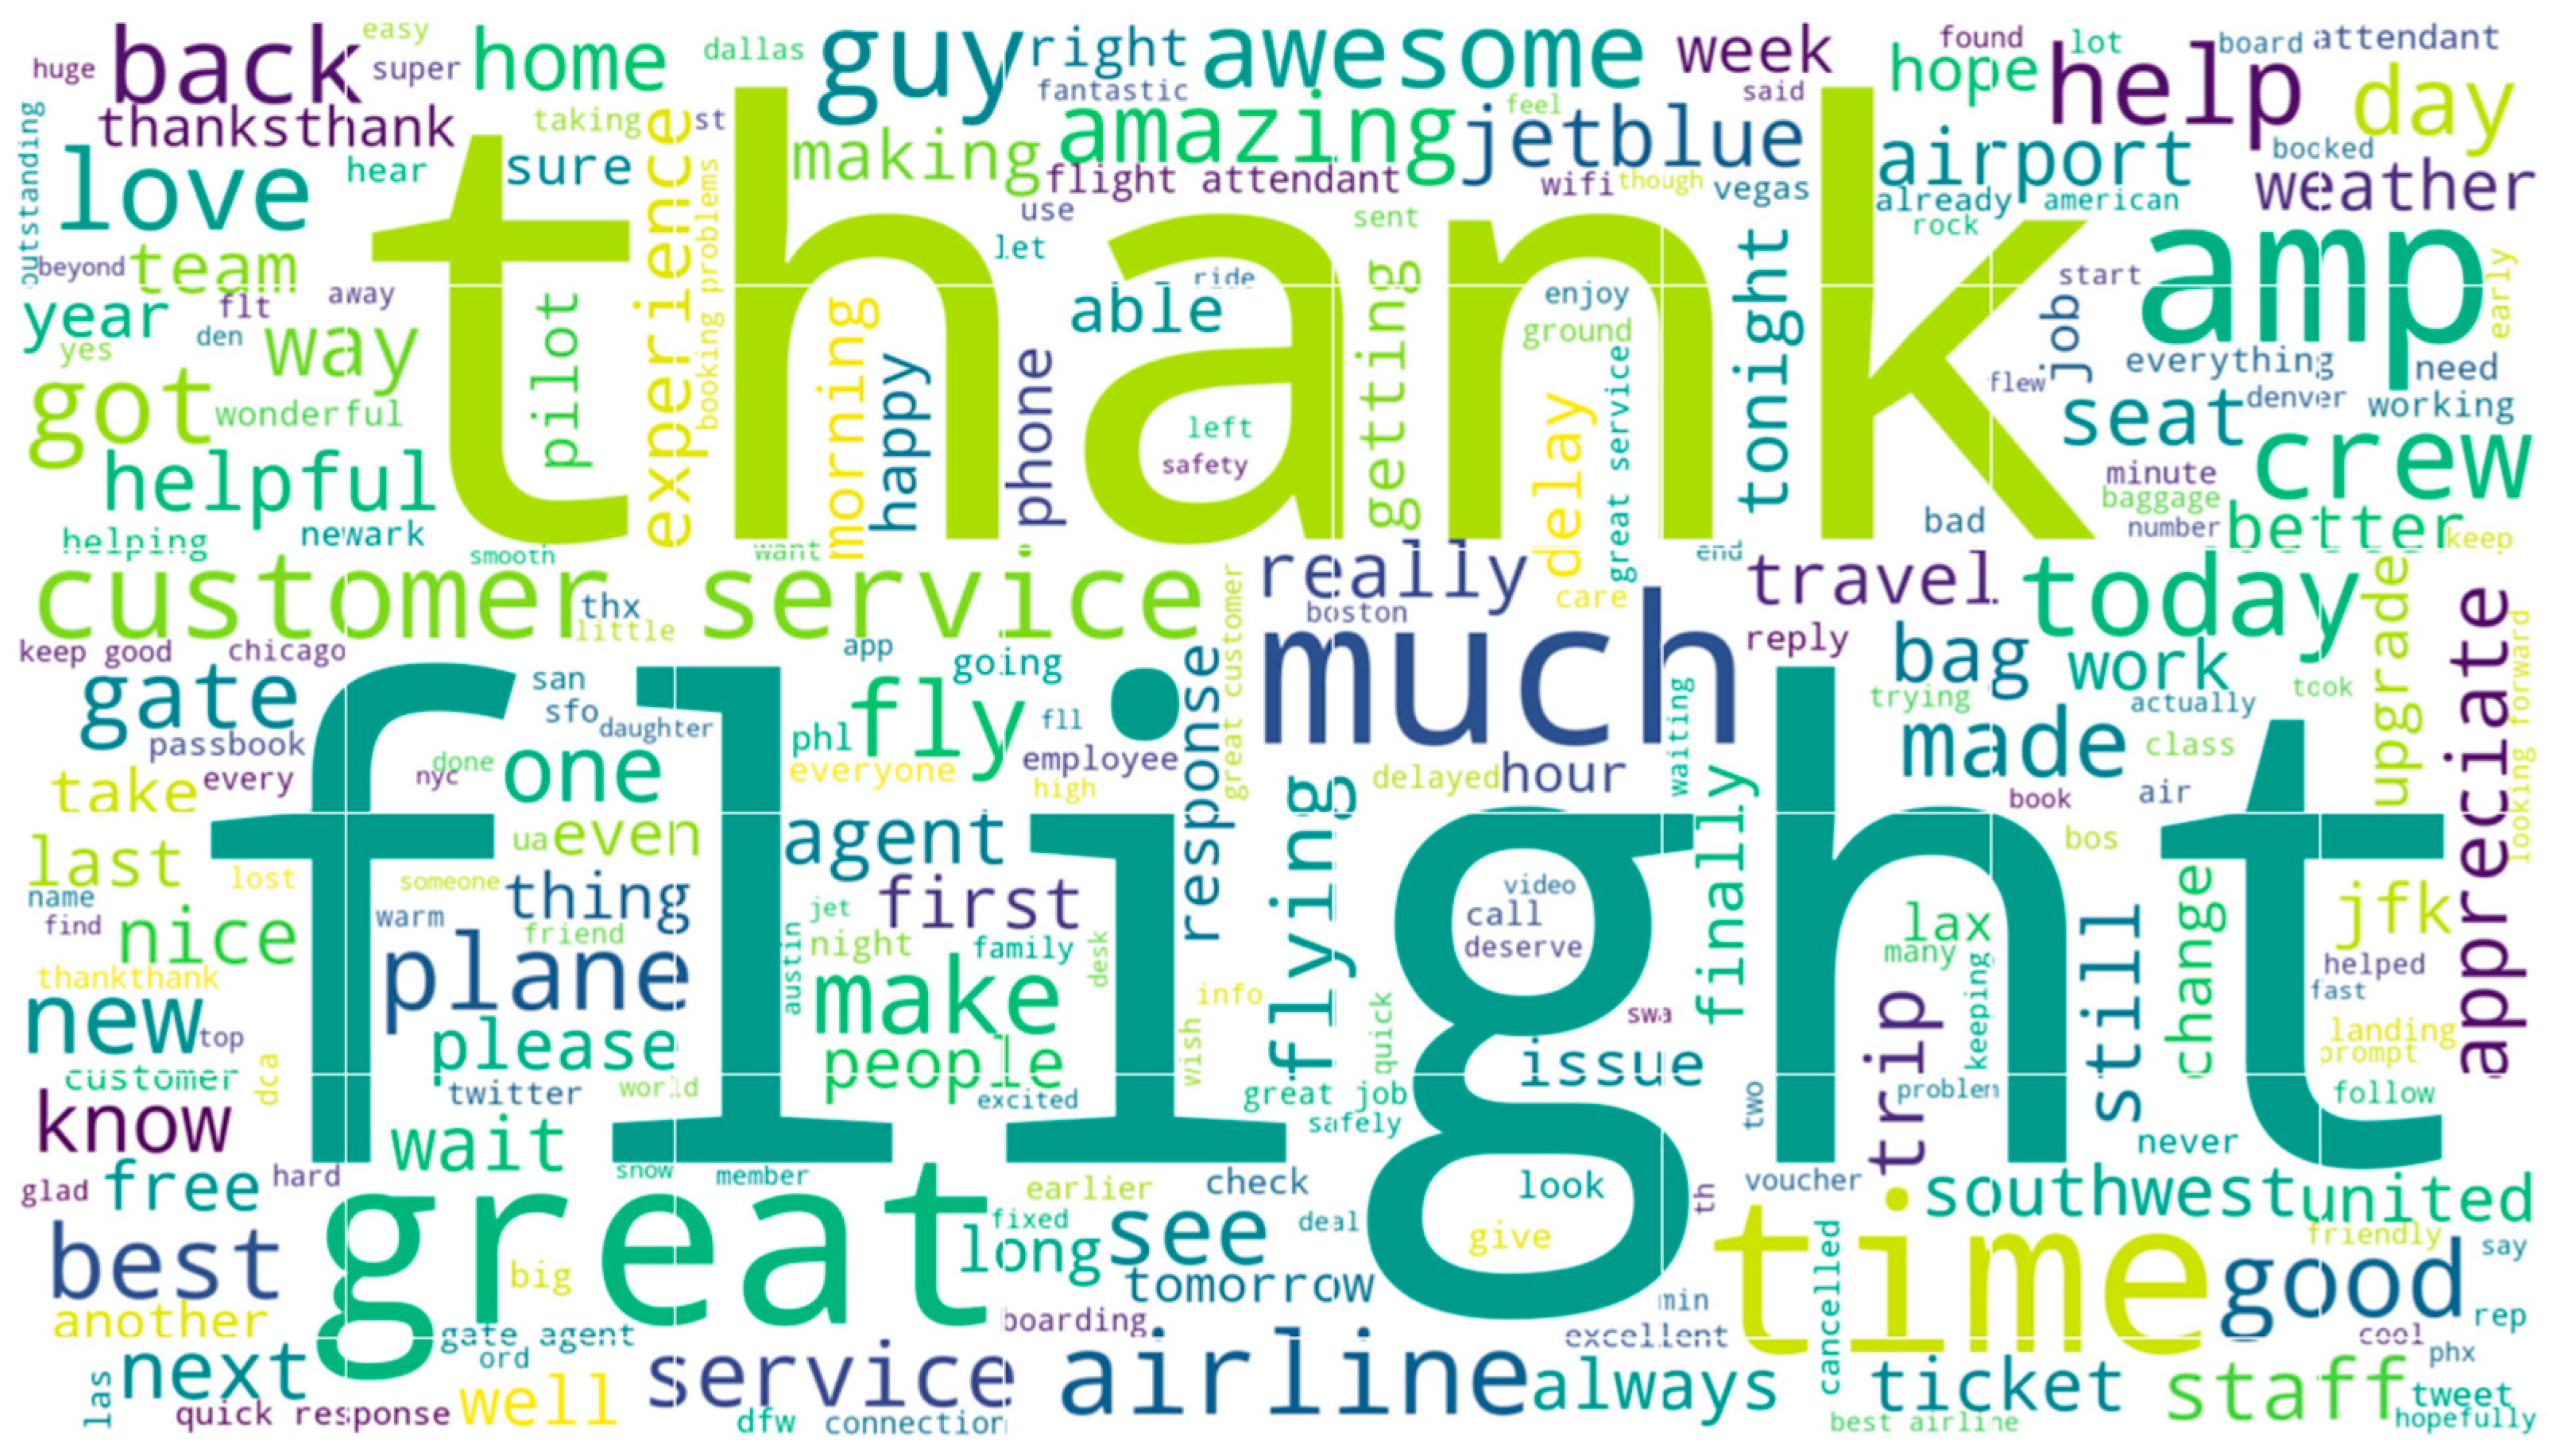
5.1. Word Cloud of Positive Tweets after Processing
The word cloud below shows the top words that had an impact in classifying a tweet as positive. We can see that words such as ‘thank’, ‘flight’, ‘good’, ‘best’, etc., are predominantly visible on the word cloud which represent positive sentiments about the airlines. Figure 9 below shows the top 250 words that were useful in identifying a tweet as positive with respect to sentiment analysis.
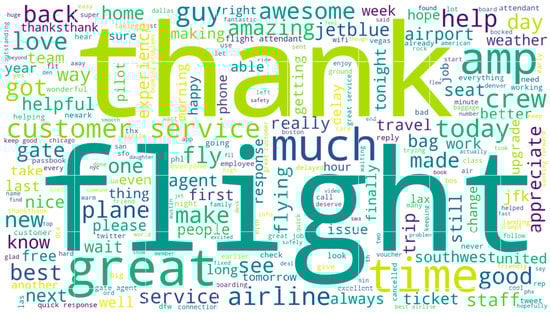
Figure 9.
Word cloud of Positive tweets.
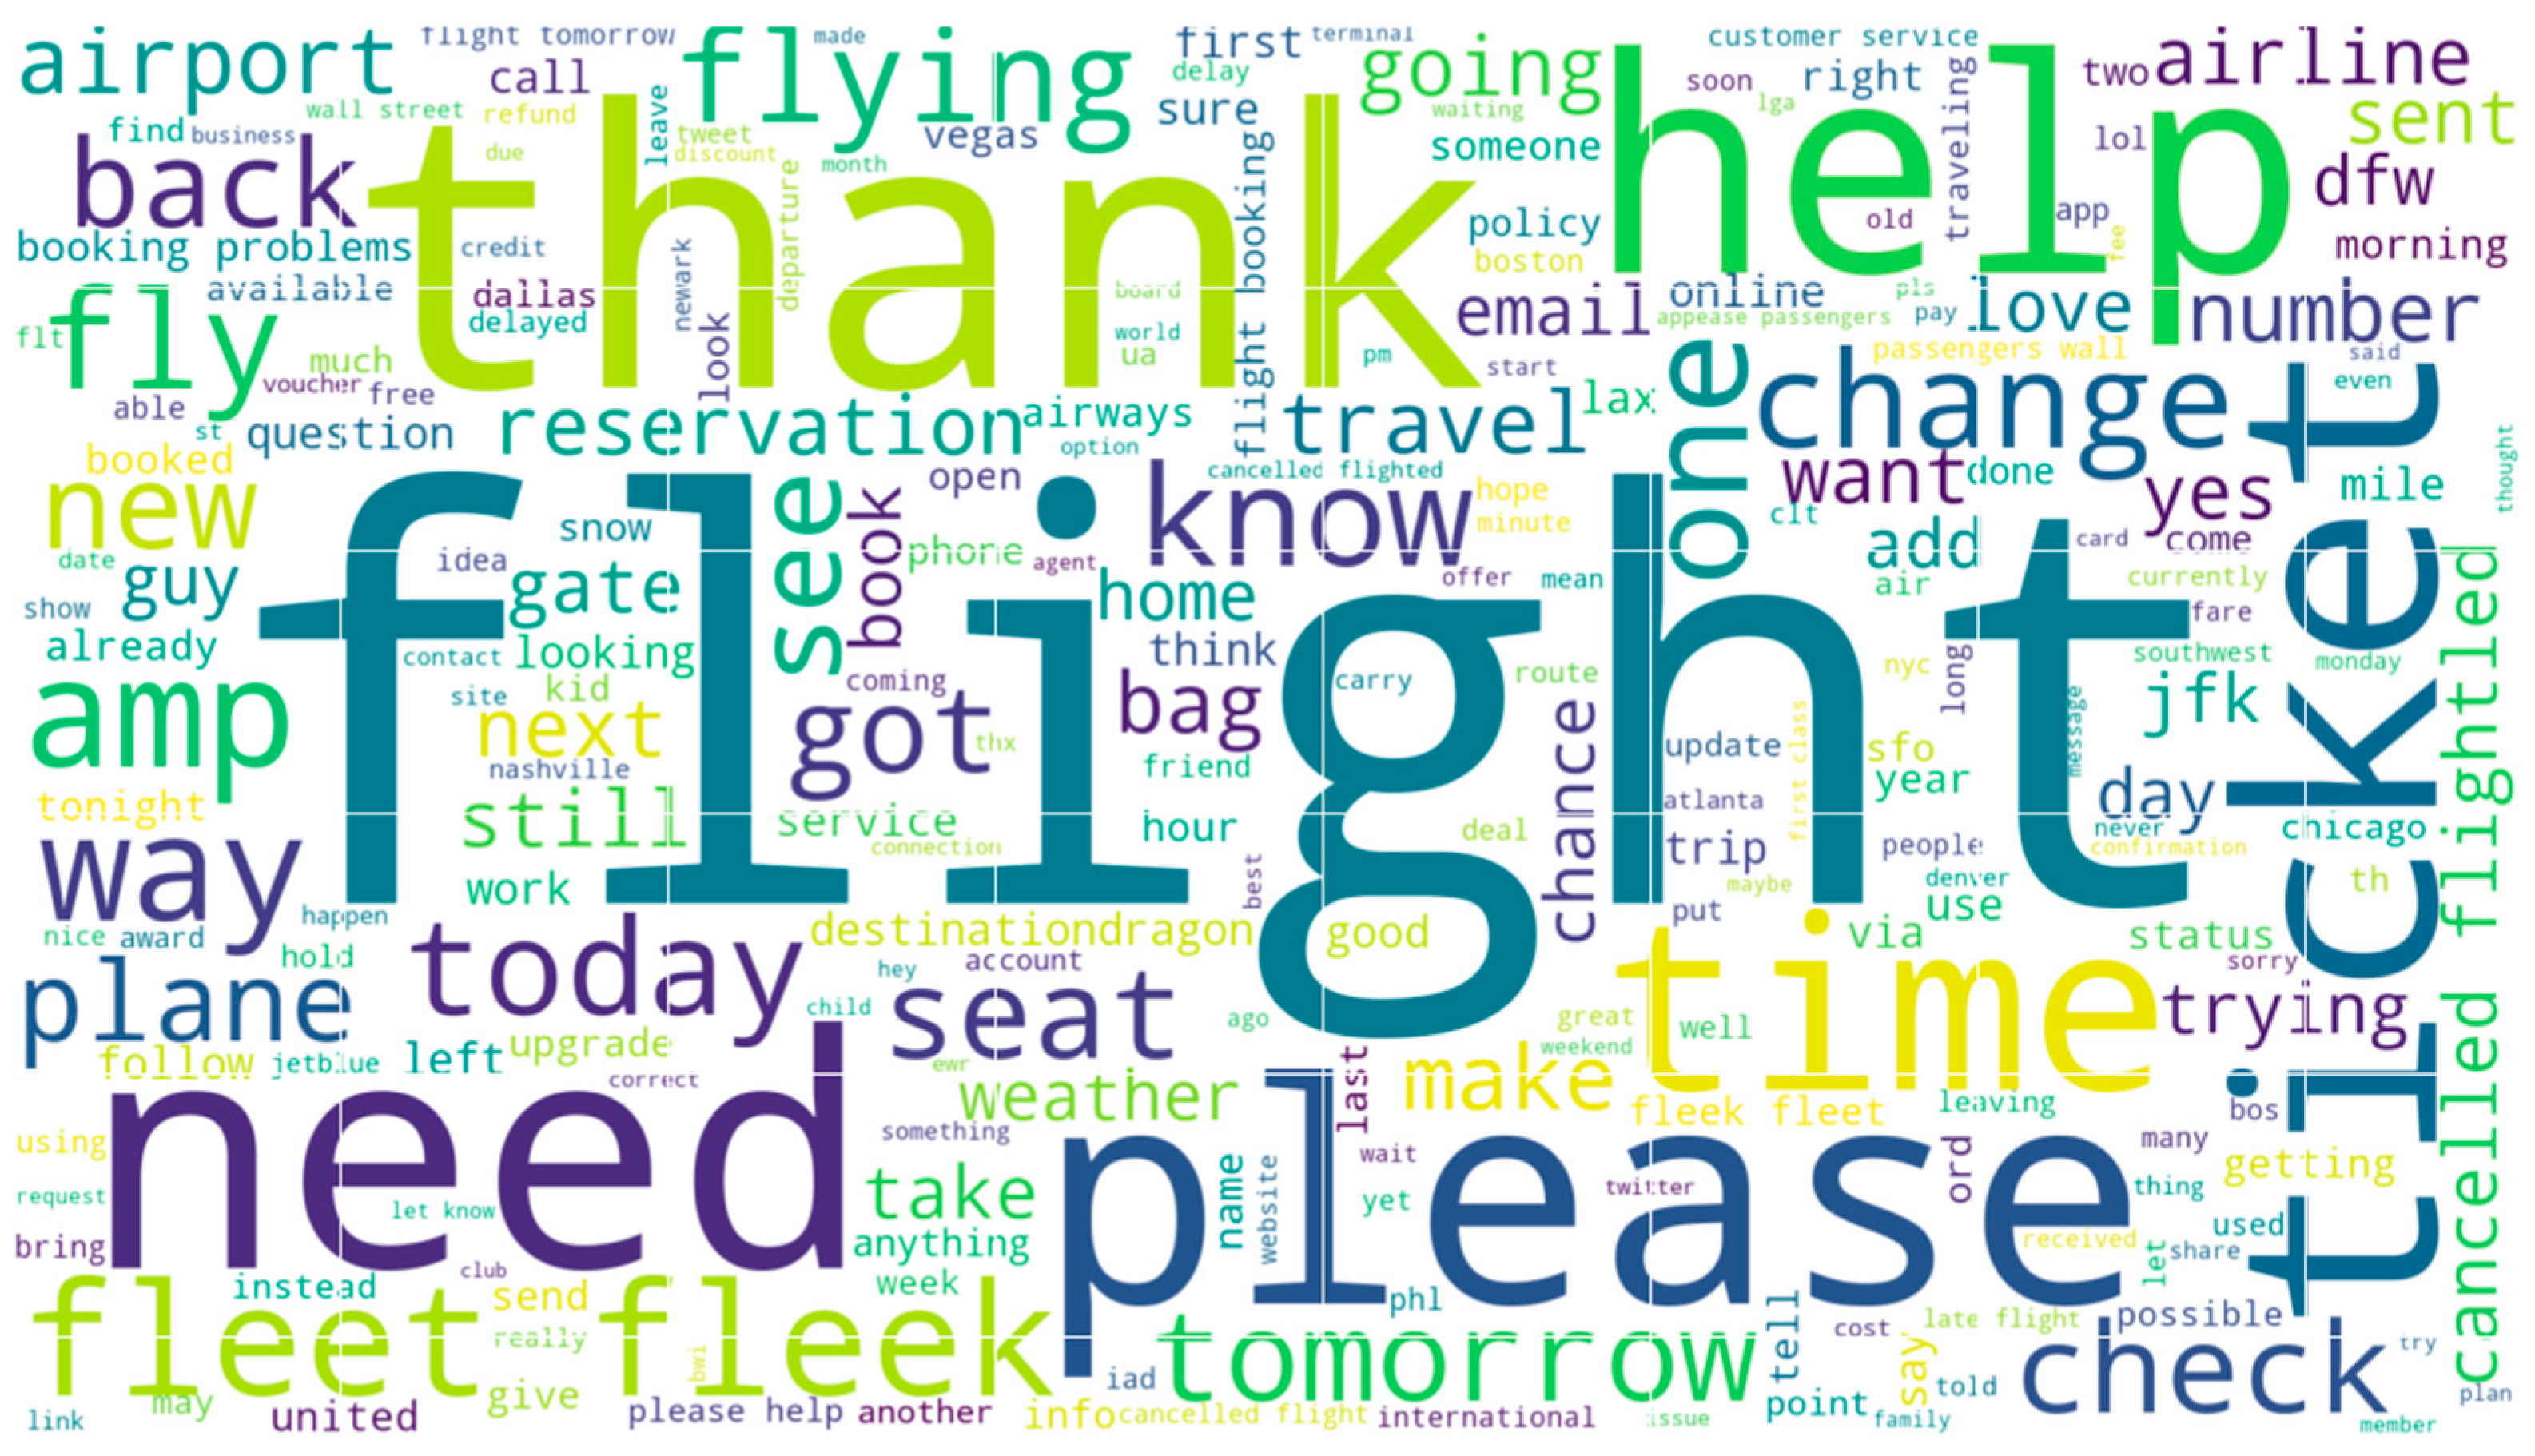
5.2. Word Cloud of Neutral Tweets after Processing
The word cloud below shows the top words that had an impact in classifying a tweet as neutral. In the neutral sentiment word cloud, most words do not carry any positive or negative sentiment. Figure 10 below shows the top 250 words that were useful in identifying a tweet as neutral with respect to sentiment analysis.
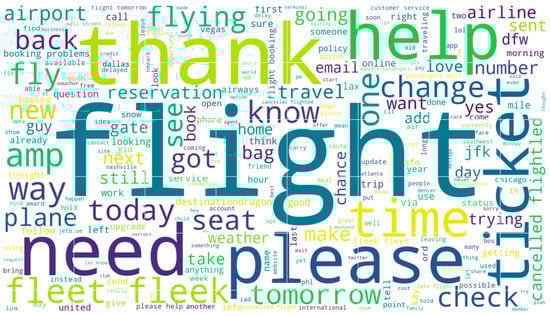
Figure 10.
Word cloud of neutral tweets.
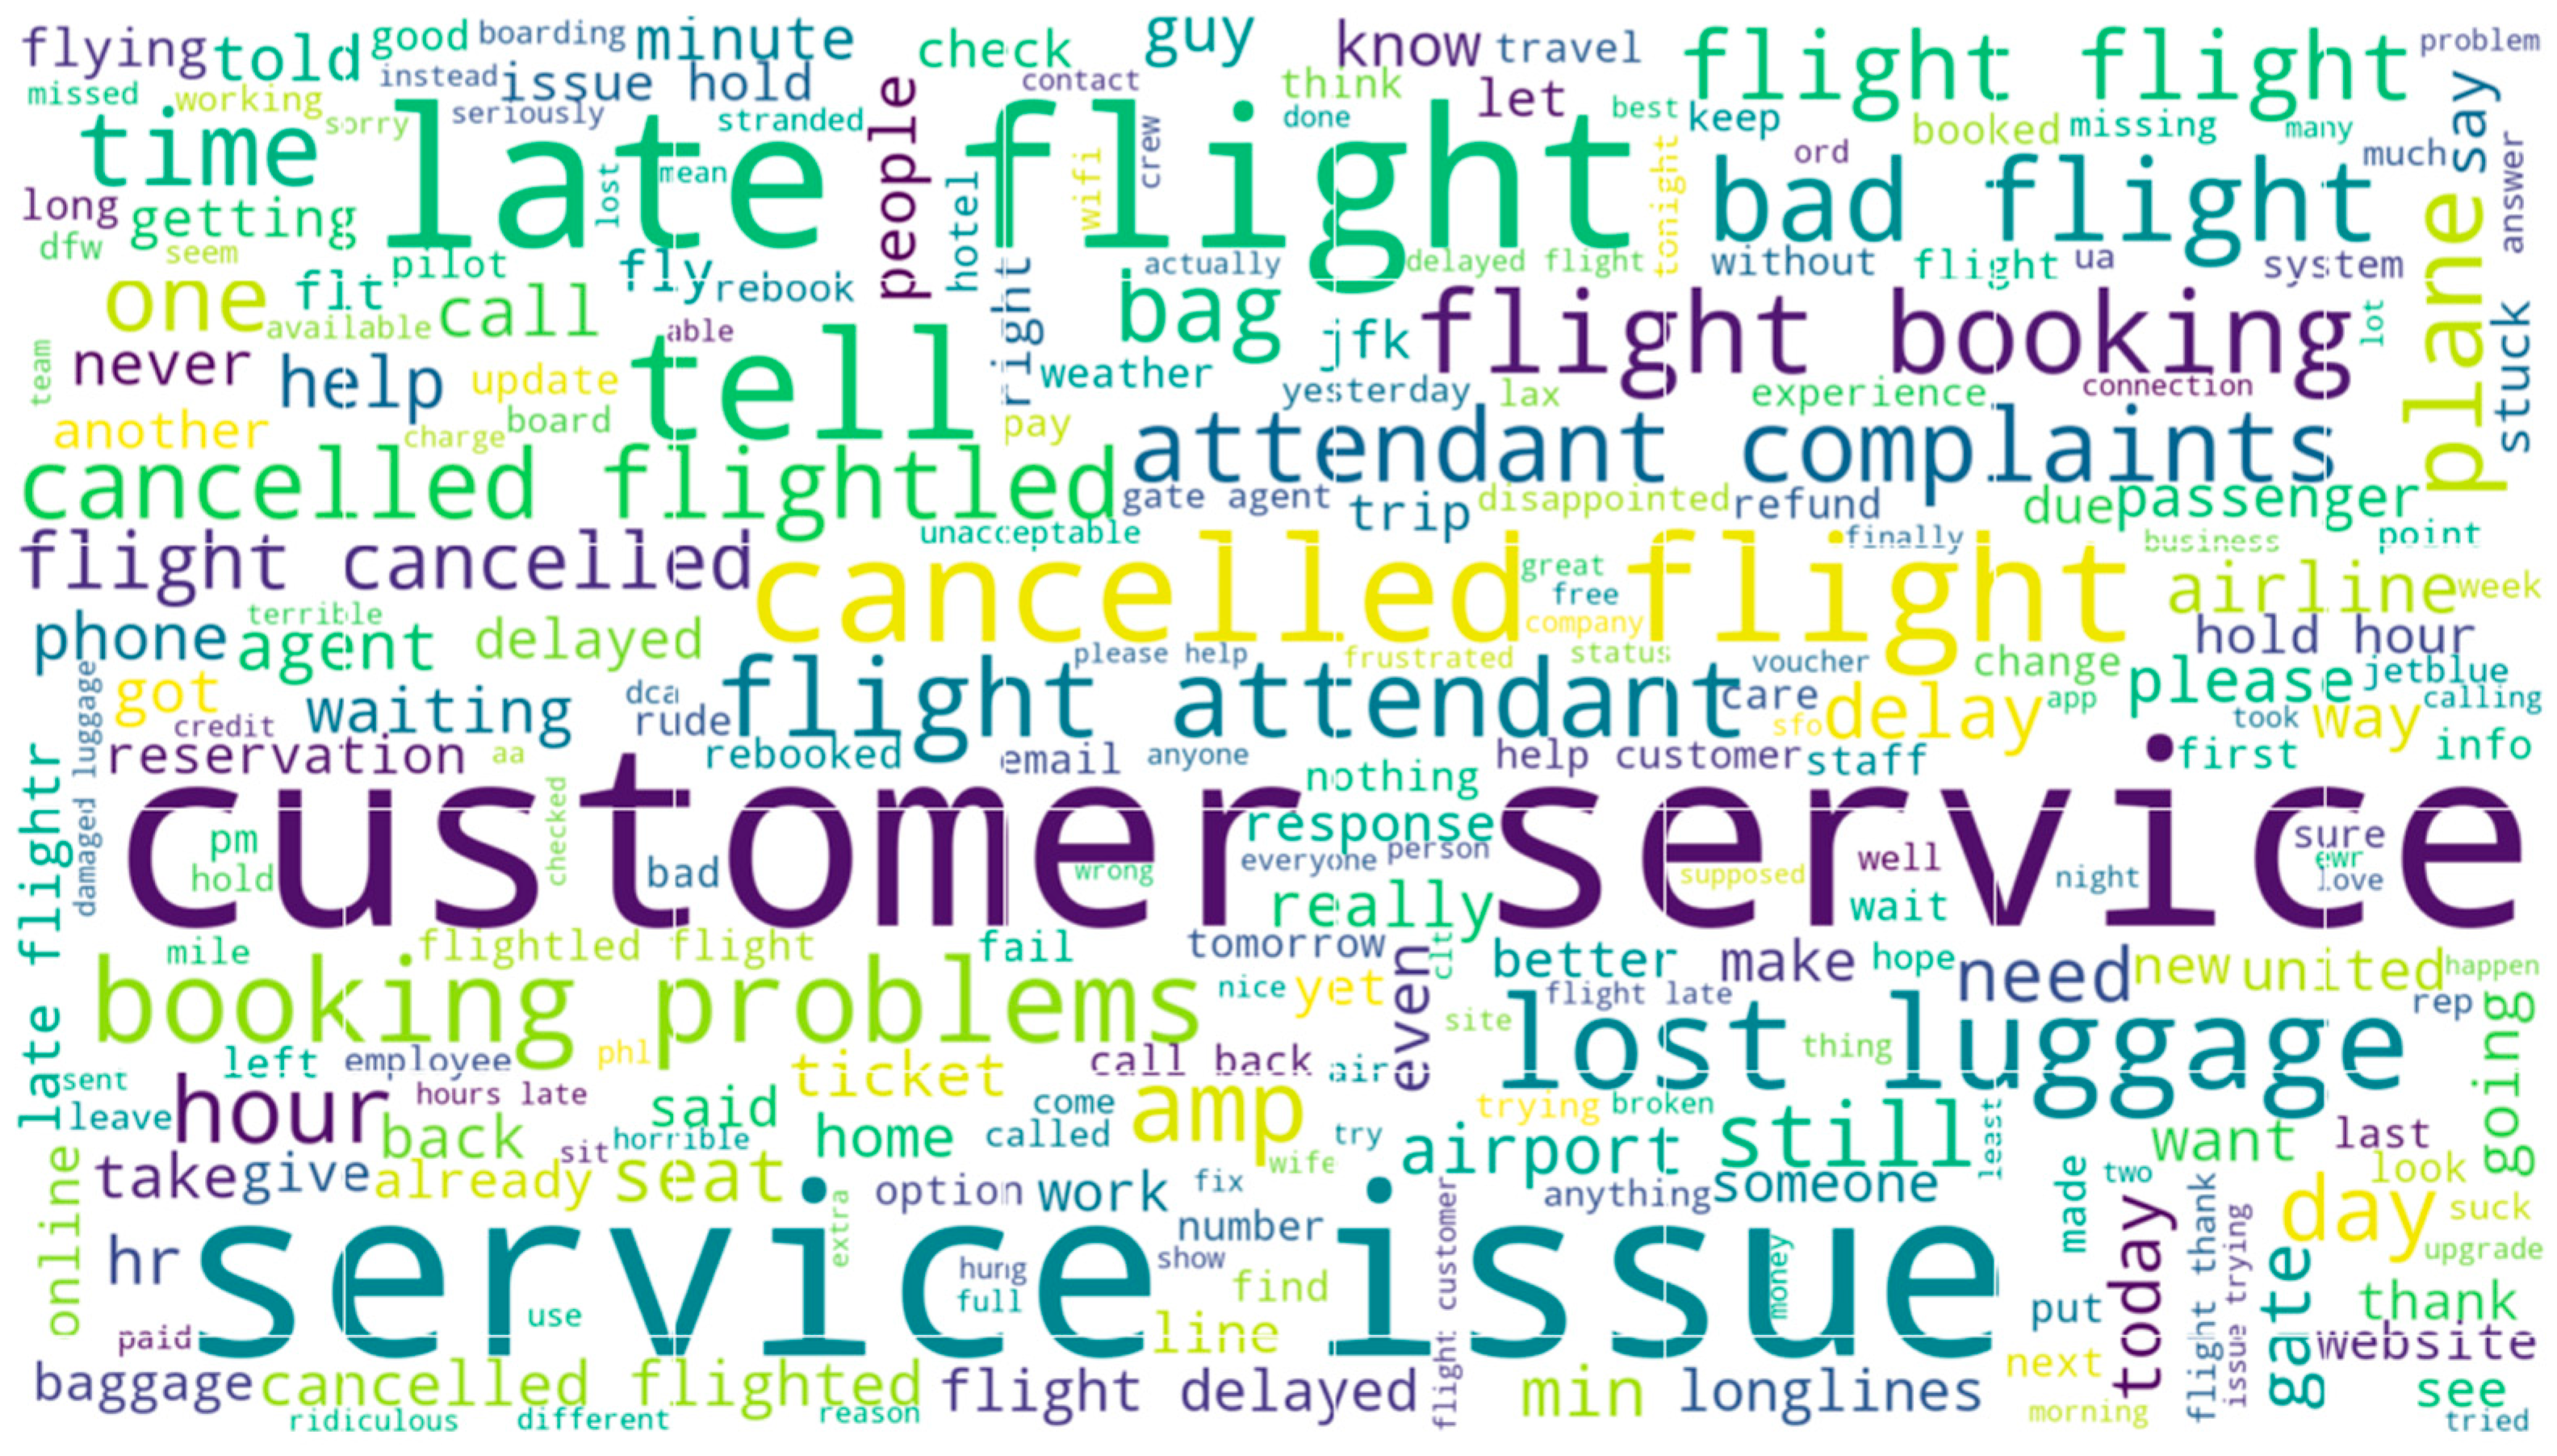
5.3. Word Cloud of Negative Tweets after Processing
The word cloud below shows the top words that had an impact in classifying a tweet as negative. We can see that words such as ‘customer’, ‘service’, ‘issue’, ‘cancelled’, and ‘flight’ are predominantly visible on the word cloud. Those words describe the reasons for negative feedback. Figure 11 below shows the top 250 words that were useful in identifying a tweet as negative with respect to sentiment analysis.
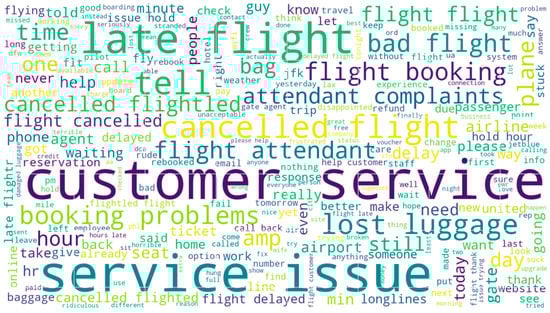
Figure 11.
Word cloud of negative tweets.
6. Conclusions
The design, implementation, and evaluation of our comprehensive SA framework have all been thoroughly covered in this study. The Random Forest classifier offers the best accuracy (above 98%) when utilizing the Twitter dataset. Often, the tweet text alone is not enough to produce good classification results. Therefore, it is important to look at other features of the dataset. In the first dataset, the feature of ‘negative reasons’ were mentioned for each negative tweet. Therefore, combining the ‘negative reasons’ and ‘negative reasons gold’ with the tweet text increased the classification accuracy for the negative class. Although that might cause slight overfitting, but since the words mentioned in the negative reasons might be useful to predict unseen data, it was therefore chosen to be included in the final text.
Handling imbalanced data is an important part for any given dataset as most of the datasets have class imbalance problem. Therefore, it is important to include a resampling technique within your methodology. If the dataset is very large, then we can use under sampling of the majority class. In the other case, if we have a smaller dataset, then we can use oversampling of the minority class. However, if the dataset is highly imbalanced this can cause the classifier to overfit the less dominant class, which can lead to a higher generalization error. Since this dataset is not as highly imbalanced, we therefore chose to include oversampling. We draw the conclusion that our methodology for sentiment analysis has contributed significantly to the field of sentiment analysis. For future directions, we would like to analyze the impact of transformer-based models and create a new transformer-based SA framework for an imbalanced dataset which handles multiclass classification problems. We can also analyze the impact of various graph-based techniques, such as graph neural networks for multi-class classification problems of sentiment analysis.
Author Contributions
Data curation, M.H. and D.J.; formal analysis, S.N.A. and M.F.A.; funding acquisition, S.N.A.; investigation, M.H.; methodology, D.J.; project administration, N.Z.J.; resources, M.F.A.; supervision, N.Z.J.; writing—original draft, M.H.; writing—review and editing, D.J. All authors have read and agreed to the published version of the manuscript.
Funding
This work was funded by the Deanship of Scientific Research at Jouf University under Grant Number (DSR2022-RG-0105).
Institutional Review Board Statement
Not applicable.
Informed Consent Statement
Not applicable.
Data Availability Statement
Will be furnished on request.
Conflicts of Interest
The authors declare no conflict of interest.
References
- Wang, C.; Zhang, P. The Evolution of Social Commerce: The People, Management, Technology, and Information Dimensions. Commun. Assoc. Inf. Syst. 2012, 31, 105–127. [Google Scholar] [CrossRef]
- Davies, A.; Ghahramani, Z. Language-Independent Bayesian Sentiment Mining of Twitter. In Proceedings of the Fifth International Workshop on Social Network Mining and Analysis (SNAKDD 2011), San Diego, CA, USA, 21–24 August 2011; pp. 99–106. [Google Scholar]
- Pang, B.; Lee, L. Opinion Mining and Sentiment Analysis. Found. Trends Inf. Retr. 2008, 2, 1–135. [Google Scholar] [CrossRef]
- Taboada, M.; Brooke, J.; Tofiloski, M.; Voll, K.; Stede, M. Lexicon-Based Methods for Sentiment Analysis. 2011. Available online: http://direct.mit.edu/coli/article-pdf/37/2/267/1798865/coli_a_00049.pdf (accessed on 25 July 2022).
- Jain, P.K.; Pamula, R.; Srivastava, G. A systematic literature review on machine learning applications for consumer sentiment analysis using online reviews. Comput. Sci. Rev. 2021, 41, 100413. [Google Scholar] [CrossRef]
- Yadav, A.; Vishwakarma, D.K. Sentiment analysis using deep learning architectures: A review. Artif. Intell. Rev. 2020, 53, 4335–4385. [Google Scholar] [CrossRef]
- Arabnia, H.R.; Deligiannidis, L.; Hashemi, R.R.; Tinetti, F.G. Information and Knowledge Engineering; Center for the Study of Race and Ethnicity in America: Providence, RI, USA, 2018. [Google Scholar]
- Rustam, F.; Khalid, M.; Aslam, W.; Rupapara, V.; Mehmood, A.; Choi, G.S. A performance comparison of supervised machine learning models for COVID-19 tweets sentiment analysis. PLoS ONE 2021, 16, e0245909. [Google Scholar] [CrossRef]
- Vashishtha, S.; Susan, S. Fuzzy rule based unsupervised sentiment analysis from social media posts. Expert Syst. Appl. 2019, 138, 112834. [Google Scholar] [CrossRef]
- Wassan, S.; Chen, X.; Shen, T.; Waqar, M.; Jhanjhi, N.Z. Amazon Product Sentiment Analysis using Machine Learning Techniques. Rev. Argent. Clín. Psicol. 2021, 30, 695–703. [Google Scholar] [CrossRef]
- Korovkinas, K.; Danėnas, P.; Garšva, G. SVM and k-Means Hybrid Method for Textual Data Sentiment Analysis. Balt. J. Mod. Comput. 2019, 7, 47–60. [Google Scholar] [CrossRef]
- Chakraborty, K.; Bhatia, S.; Bhattacharyya, S.; Platos, J.; Bag, R.; Hassanien, A.E. Sentiment Analysis of COVID-19 tweets by Deep Learning Classifiers—A study to show how popularity is affecting accuracy in social media. Appl. Soft Comput. 2020, 97, 106754. [Google Scholar] [CrossRef]
- Dogra, V.; Singh, A.; Verma, S.; Kavita; Jhanjhi, N.Z.; Talib, M.N. Analyzing DistilBERT for Sentiment Classification of Banking Financial News. Lect. Notes Netw. Syst. 2021, 248, 501–510. [Google Scholar] [CrossRef]
- Birjali, M.; Kasri, M.; Beni-Hssane, A. A comprehensive survey on sentiment analysis: Approaches, challenges and trends. Knowl.-Based Syst. 2021, 226, 107134. [Google Scholar] [CrossRef]
- Hussein, D.M.E.-D.M. A survey on sentiment analysis challenges. J. King Saud Univ.-Eng. Sci. 2018, 30, 330–338. [Google Scholar] [CrossRef]
- Yang, L.; Li, Y.; Wang, J.; Sherratt, R.S. Sentiment Analysis for E-Commerce Product Reviews in Chinese Based on Sentiment Lexicon and Deep Learning. IEEE Access 2020, 8, 23522–23530. [Google Scholar] [CrossRef]
- Ghosh, K.; Banerjee, A.; Chatterjee, S.; Sen, S. Imbalanced Twitter Sentiment Analysis using Minority Oversampling. In Proceedings of the 2019 IEEE 10th International Conference on Awareness Science and Technology (iCAST), Morioka, Japan, 23–25 October 2019. [Google Scholar]
- Rao, K.N.; Reddy, C.S. A novel under sampling strategy for efficient software defect analysis of skewed distributed data. Evol. Syst. 2020, 11, 119–131. [Google Scholar] [CrossRef]
- Zhou, S.; Li, X.; Dong, Y.; Xu, H. A Decoupling and Bidirectional Resampling Method for Multilabel Classification of Imbalanced Data with Label Concurrence. Sci. Program. 2020, 2020, 8829432. [Google Scholar] [CrossRef]
- Aljarah, I.; Al-Shboul, B.; Hakh, H. Online Social Media-Based Sentiment Analysis for US Airline Companies. 2017. Available online: https://www.researchgate.net/publication/315643035 (accessed on 25 July 2022).
- Liu, Y.; Bi, J.-W.; Fan, Z.-P. Multi-class sentiment classification: The experimental comparisons of feature selection and machine learning algorithms. Expert Syst. Appl. 2017, 80, 323–339. [Google Scholar] [CrossRef]
- Hasan, A.; Moin, S.; Karim, A.; Shamshirband, S. Machine Learning-Based Sentiment Analysis for Twitter Accounts. Math. Comput. Appl. 2018, 23, 11. [Google Scholar] [CrossRef]
- Catal, C.; Nangir, M. A sentiment classification model based on multiple classifiers. Appl. Soft Comput. 2017, 50, 135–141. [Google Scholar] [CrossRef]
- Eler, D.M.; Grosa, D.; Pola, I.; Garcia, R.; Correia, R.; Teixeira, J. Analysis of Document Pre-Processing Effects in Text and Opinion Mining. Information 2018, 9, 100. [Google Scholar] [CrossRef]
- Dzisevic, R.; Sesok, D. Text Classification using Different Feature Extraction Approaches. In Proceedings of the 2019 Open Conference of Electrical, Electronic and Information Sciences (eStream), Vilnius, Lithuania, 25 April 2019; pp. 1–4. [Google Scholar]
- Jing, N.; Wu, Z.; Wang, H. A hybrid model integrating deep learning with investor sentiment analysis for stock price prediction. Expert Syst. Appl. 2021, 178, 115019. [Google Scholar] [CrossRef]
- Obiedat, R.; Qaddoura, R.; Al-Zoubi, A.M.; Al-Qaisi, L.; Harfoushi, O.; Alrefai, M.; Faris, H. Sentiment Analysis of Customers’ Reviews Using a Hybrid Evolutionary SVM-Based Approach in an Imbalanced Data Distribution. IEEE Access 2022, 10, 22260–22273. [Google Scholar] [CrossRef]
- Jiang, W.; Zhou, K.; Xiong, C.; Du, G.; Ou, C.; Zhang, J. KSCB: A Novel Unsupervised Method for Text Sentiment Analysis. Appl. Intell. 2022. [Google Scholar] [CrossRef]
- Dablain, D.; Krawczyk, B.; Chawla, N.V. DeepSMOTE: Fusing Deep Learning and SMOTE for Imbalanced Data. IEEE Trans. Neural Netw. Learn. Syst. 2022, 31, 1–15. [Google Scholar] [CrossRef] [PubMed]
- Rahmanda, R.; Setiawan, E.B. Word2Vec on Sentiment Analysis with Synthetic Minority Oversampling Technique and Boosting Algorithm. J. RESTI 2022, 6, 599–605. [Google Scholar] [CrossRef]
- Bibi, M.; Abbasi, W.A.; Aziz, W.; Khalil, S.; Uddin, M.; Iwendi, C.; Gadekallu, T.R. A novel unsupervised ensemble framework using concept-based linguistic methods and machine learning for twitter sentiment analysis. Pattern Recognit. Lett. 2022, 158, 80–86. [Google Scholar] [CrossRef]
- Atmaja, B.T.; Sasou, A. Sentiment Analysis and Emotion Recognition from Speech Using Universal Speech Representations. Sensors 2022, 22, 6369. [Google Scholar] [CrossRef]
- IEEE Thailand Section and Institute of Electrical and Electronics Engineers. ICEAST 2018. In Proceedings of the 4th International Conference on Engineering, Applied Sciences, and Technology: Exploring Innovative Solutions for Smart Society, Phuket, Thailand, 4–7 July 2018. [Google Scholar]
- Mukherjee, A.; Mukhopadhyay, S.; Panigrahi, P.K.; Goswami, S. Utilization of Oversampling for multiclass sentiment analysis on Amazon Review Dataset. In Proceedings of the 2019 IEEE 10th International Conference on Awareness Science and Technology (iCAST), Morioka, Japan, 23–25 October 2019. [Google Scholar]
- Alnatara, W.D.; Khodra, M.L. Imbalanced data handling in multi-label aspect categorization using oversampling and ensemble learning. In Proceedings of the 2020 International Conference on Advanced Computer Science and Information Systems (ICACSIS), Depok, Indonesia, 17–18 October 2020; pp. 165–170. [Google Scholar] [CrossRef]
- Alwakid, G.; Osman, T.; El Haj, M.; Alanazi, S.; Humayun, M.; Sama, N.U. MULDASA: Multifactor Lexical Sentiment Analysis of Social-Media Content in Nonstandard Arabic Social Media. Appl. Sci. 2022, 12, 3806. [Google Scholar] [CrossRef]
- Khalil, M.I.; Tehsin, S.; Humayun, M.; Jhanjhi, N.; AlZain, M.A. Multi-Scale Network for Thoracic Organs Segmentation. Comput. Mater. Contin. 2022, 70, 3251–3265. [Google Scholar]
- Humayun, M.; Sujatha, R.; Almuayqil, S.N.; Jhanjhi, N.Z. A Transfer Learning Approach with a Convolutional Neural Network for the Classification of Lung Carcinoma. Healthcare 2022, 10, 1058. [Google Scholar] [CrossRef]
- Attaullah, M.; Ali, M.; Almufareh, M.F.; Ahmad, M.; Hussain, L.; Jhanjhi, N.; Humayun, M. Initial Stage COVID-19 Detection System Based on Patients’ Symptoms and Chest X-Ray Images. Appl. Artif. Intell. 2022, 36, 1–20. [Google Scholar] [CrossRef]
Publisher’s Note: MDPI stays neutral with regard to jurisdictional claims in published maps and institutional affiliations. |
© 2022 by the authors. Licensee MDPI, Basel, Switzerland. This article is an open access article distributed under the terms and conditions of the Creative Commons Attribution (CC BY) license (https://creativecommons.org/licenses/by/4.0/).