Article

Bee Sound Detector: An Easy-to-Install, Low-Power, Low-Cost Beehive Conditions Monitoring System

by
Dimitrios I. Kiromitis
1,*,
Christos V. Bellos
1,*,
Konstantinos A. Stefanou
1,
Georgios S. Stergios
1,
Thomas Katsantas
1 and
Sotirios Kontogiannis
2
1
Lime Technology IKE, 45221 Ioannina, Greece
2
Laboratory Team of Distributed Microcomputer System, Department of Mathematics, University of Ioannina, 45110 Ioannina, Greece
*
Authors to whom correspondence should be addressed.
Electronics 2022, 11(19), 3152; https://doi.org/10.3390/electronics11193152
Submission received: 9 September 2022 / Revised: 27 September 2022 / Accepted: 28 September 2022 / Published: 30 September 2022
(This article belongs to the Special Issue Applications for Distributed Networking Systems)

Abstract

:
One of the most significant agricultural tasks in beekeeping involves continually observing the conditions inside and outside the beehive. This is mainly performed for the early detection of some harmful events. There have been many studies on how to detect and prevent such occurrences by performing periodic interventions or, when the frequency of such actions is hard to enforce, by using sensory systems that record the temperature, humidity, and weight of the beehive. Nevertheless, such methods are inaccurate, and their delivered outcomes usually diverge from the actual event or false trigger and introduce more effort and damage. In this paper, the authors propose a new low-cost, low-power system called Bee Sound Detector (BeeSD). BeeSD is a low-cost, embedded solution for beehive quality control. It incorporates the sensors mentioned above as well as real-time sound monitoring. With the combination of temperature, humidity, and sound sensors, the BeeSD can spot Colony Collapse Disorder events due to famine and extreme weather events, queen loss, and swarming. Furthermore, as a system, the BeeSD uses cloud logging and an appropriate mobile phone application to push notifications of extreme measurements to the farmers. Based on achieved performance indicators, the authors present their BeeSD IoT device and system operation, focusing on its advantages of low-cost, low-power, and easy-to-install characteristics.

1. Introduction

The Internet of Things (IoT) industry is evolving at frenetic rates in the agricultural sector, offering new solutions and assisting in turning traditional problem-solving processes into automated technologies. Internet of Everything, the next progression of the IoT, includes the concept of all-around things and transparent connectivity to the cloud. Moreover, current IoT trends favor processes or algorithms supported by cloud-provided data visualization and probing monitoring, as well as detection, prediction, and decision-making with the use of data mining algorithms and machine learning models.
One of the most important sections of agriculture is the apiary industry, which is threatened by many illnesses and harmful events [1]. Beehive harmful events can be categorized into six major categories, as shown in Table 1.
The categories C3, C4, and C5 are considered to be the most important, as they include events that can cause the loss of an entire colony, but also because they are the ones that can be prevented. Many studies have shown that these events can be detected early using sound signals, images, or weight [7]. Detecting and preventing such harmful events could make apiary practices more profitable while reducing the risk of CCD.
This paper presents a new system, called BeeSD, that allows observation of the dominant conditions inside and outside the beehive while using innovative low-power and low-cost architecture.
The BeeSD system’s innovation includes continuous observation of beehives to detect harmful events, and its easy implementation makes BeeSD an easy-to-install system for every beekeeper. This goes beyond state of the art and includes a system coupled with low-cost, low-power sensors and peripherals, which can identify, assess, and cluster episodes of any of the events shown in Figure 1 [7,8].
This paper’s structure is as follows: Section 2 presents related work, focusing on existing IoT solutions for apiary incidents and their capabilities. Then, focusing on the critical incidents mentioned in Table 1, the authors present their proposed solution of an end-node device and system architecture in Section 3. Finally, Section 4 presents the authors’ system experimentation and validation, while Section 5 presents conclusions related to their proposition.

2. Related Work

The use of IoT in beehive monitoring started about a century ago when Gates manually extracted temperature data and published his findings [9]. Since then, many studies have been carried out to automate the conditions data logging procedures from beehives. Moreover, with the evolution of technology in embedded systems, more and more parameters have been added to the function of monitoring, with features such as humidity, gas concentrations, and weight being some of them [8].
Since the early studies, research has shown that besides activity inside the beehive, the environment greatly influences bee behavior. Thus, Wireless Sensor Networks (WSNs) have been used to record environmental factors such as Temperature, Humidity, CO 2 and O 2 levels, and dust, which may account for specific events (see Table 1, C2) [10,11]. Later studies showed that weight monitoring can provide useful information about colony status (Table 1, C1, and C3 cases) [12,13,14].
With the evolution of image processing, some studies have focused on detecting diseases, parasites, or even external attacks (Table 1, C5, and C6 cases) using camera modules [15,16]. However, despite research on these methods, sound processing seems to dominate in the detection of many harmful events in apiaries, such as swarming, external attacks, or even CCD (Table 1, C1, C3, C6 cases). As a result, researchers trying to detect these events have focused on creating IoT devices that collect sound data [17,18,19].
In recent years, many systems have been created to combine the abovementioned research, creating systems that collect different kinds of data simultaneously [20,21]. For example, in [22], a new IoT beehive management system was presented to continuously observe and monitor bee behavior to record colonies’ behavior during harmful events. In addition, several systems have been developed to gather and process sensory data that allow each node to wirelessly communicate with the main concentrator, which acts as an Internet Gateway, sending the unprocessed data to remote database services [23].
Finally, several IoT market products help beekeepers to monitor their ‘beehives’ status [24,25,26]. These products provide the potential to collect data and prevent harmful events by installing sensor motes inside and outside the beehive while increasing the system’s complexity. The proposed BeeSD system provides an easy-to-install device that is easily installed in a beehive’s lid (or comes with a new lid with the device attached) without harming or disturbing the bees. Section 3 describes the proposed system architecture and components.

3. Proposed High-Level BeeSD System Architecture

The authors propose a new beehive conditions monitoring system called Bee Sound Detection system, named for its core sensing functionality. The proposed BeeSD system includes three stages, as shown in Figure 1, and includes the following components: (1) the BeeSD end-node device, (2) the BeeSD concentrator, (3) the BeeSD cloud services, and (4) the BeeSD monitoring mobile phone application.
The first stage of component functionality is the collection of temperature, humidity, and sound data from the beehives through the implemented IoT BeeSD device (1). Next, the end-node devices communicate using Wi-Fi with a central node device called a concentrator (2). Each concentrator can support up to 10 devices simultaneously. Data are then sent to and stored in the cloud (3) data-logging service via the concentrator to be cloud processed (Figure 1(3)), which concludes with a decision about imminent harmful condition events being sent via push notifications. BeeSD concentrator devices offer the ability to remotely monitor and control each one of the end-node devices over the cloud via an independent VPN service channel per end-node device.
The authors utilized Wi-Fi high-bandwidth and low-power technology, among other power-efficient technologies such as LoRaWAN and RF-based or direct NBIoT transmissions. Moreover, the transfer of raw sound data cannot be easily performed over LoRaWAN or RF-based technologies due to their narrow bandwidth, small data transmission payloads, and frequency channel time-usage limitations [27]. In addition, using NBIoT technology can achieve the required bandwidth for data uplinks. However, telecommunication costs per beehive increase significantly according to existing telecommunication cost plans, offering a monthly usage of 25 MB and 0.3–0.5 € per additional MB spent. For this reason, a much cheaper concentrator device that utilizes a Wi-Fi to 3G/4G transponder for cloud data transmissions was selected. If telecommunication costs drop in the following years, the proposed architecture will be much easier to migrate transparently to Wi-Fi over NBIoT concentrators.
The default measurement period (probing period) is 5 min per hour per end-node device. However, the monitoring and probing service can adjust this period by utilizing the power on/off actuator component. New on/off periods can be defined and uploaded periodically to the end-node devices, with the on and off time intervals expressed in minutes. A detailed description of the on/off interval setup is provided in Section 3.1.
The cloud server illustrated in Figure 1(3) controls the data processing and bee conditions detection service, capable of covering and differentiating amongst condition cases, as mentioned in Table 1. Finally, the beekeepers are alerted to harmful condition events via the BeeSD mobile phone application through a cloud push notification service (4). The beekeepers can also visualize real-time BeeSD measurements and trends (daily, weekly, monthly) of temperature, humidity, sound intensity, and spectrogram frequency response, i.e., most contributing frequencies provided by the FFT spectrogram analysis performed at the BeeSD end-node device and uploaded to the cloud data-logging services.

3.1. BeeSD IoT Device Component

The authors propose a new end-node IoT device called the Bee Sound Detector device to support their system’s distributed architecture. The proposed BeeSD consists of two components, as shown in Figure 1: (A) the end-node device and (B) the photovoltaic (PV) panel. The end-node device component includes: (1) main process unit, (2) microcontroller unit (MCU) power controller, (3) humidity and temperature sensors, (4) lavalier microphone, and (5) power actuator. The PV panel component includes (6) PV panel, (7) voltage regulator, (8) pull-down converter (PDC), and (9) Lithium iron phosphate(LiFePO) battery. All the abovementioned components are shown in Figure 2.
The BeeSD end-node IoT prototype includes the following:
  • The four-core ARM CPU (main processor unit), where the sensors are attached. The card reader contains a MicroSD card of 32 GB, which contains the appropriate scripts and storage for the extracted files.
  • A waterproof temperature sensor probe that returns the targeted temperature values amongst frames inside the beehive.
  • The lavalier microphone that is used to record the sounds made by the bees, stored in raw WAV data files.
  • The temperature and humidity sensor attached to the lid monitor the temperature and the relative humidity values inside the beehive.
  • A micro-USB cable that used to power the ARM CPU via the PV panel component.
  • A power actuator that switches the device on and off as scheduled.
To the end-node device component’s main processing board are attached the peripherals for the collection of (3) temperature, humidity, and (4) sound data from the beehive, as well as the (2) MCU power controller that controls the power on/off actuator.
The authors’ proposed BeeSD IoT main processor consists of an embedded four-core ARM CPU with 512 MB of RAM, wireless LAN, and Bluetooth transponders attached, and a card reader of at least a 16 GB MicroSD card. BeeSD requires four cores and more than 512 MB RAM because sound processing necessitates these specs, and this can maintain BeeSD as a low-cost system.
The PV panel component includes a (6) PV panel 20 W/12 V that charges through a (7) voltage regulator and the (9) battery. Finally, an (8) 12 V to 5 V PDC supplies the end-node device’s main processing ARM CPU unit.
Temperature and humidity sensors are connected to the ARM’s GPIO pins, whereas the microphone is connected to it through the device’s USB port. The end node is placed on the beehive’s lid. Every BeeSD system has a device working as the main concentrator, to which all the other devices send their data. The concentrator device is permanently connected to the cloud server through a VPN and continually uploads the data.
The power actuator (6) is connected to the MCU power controller and controls the power feed of the main processor unit. The MCU power controller initially reads each EEPROM start and stop interval value (in minutes) and controls the actuator accordingly for a period of TP = Tstart + Tstop. It then waits for a command sent by the microprocessing unit through its UART using the power serial protocol. If a command is received, then it updates its start and stop intervals. This cycle is periodically repeated.
Each of the main processor-attached sensors automatically records and sends its data (raw sound data or FFT response textual data, temperature °C, and humidity) to the cloud or information management system after the user has programmed the scripts. The temperature and humidity sensor is installed at the top of the beehive’s lid, while the waterproof temperature sensor and the microphone are installed between the beehive’s frames.
The end-node devices communicate using Wi-Fi with a central communication and cloud upload node device called the BeeSD concentrator. Each concentrator can support up to 10 end-node devices simultaneously. Data are then sent via the concentrator and stored in the cloud (see Figure 1) data-logging service. Furthermore, BeeSD concentrator devices offer the ability to remotely monitor each one of the end-node devices through the cloud via an independent VPN service channel per end-node device. Furthermore, the cloud instantiates the data-processing and bee condition detection service capable of covering and differentiating amongst condition cases, as mentioned in Table 1. Finally, the beekeepers are alerted to harmful condition events via the BeeSD mobile phone application through a cloud push notification service (see Figure 1(3)). The beekeepers can also visualize real-time BeeSD measurements and trends (daily, weekly, monthly) of temperature, humidity, sound intensity, and spectrogram frequency response. Most contributing frequencies are provided by the fast Fourier transform (FFT) spectrogram analysis performed at the BeeSD end-node device and uploaded to the cloud data-logging services.
Finally, the procedure becomes cheaper and faster as the processed data do not exceed one percent of the unprocessed file size. Additionally, the new data reduce and minimize energy consumption due to their low-energy components.
The BeeSD IoT device provides a revolutionary way of implementing its end-node devices in the beehive, as it just replaces the simple lid that beekeepers tend to use. It is also a low-cost device as it uses the newest ARM CPU, which provides four-core power to process the data before sending it to the main concentrator. This method requires less data consumption as both the temperature and humidity and sound data are transferred as CSV or image files, with sound data converted to whatever is needed, using the power of the four-core ARM CPU attached.

3.2. BeeSD Services and Service Capabilities

The BeeSD system, as described in Figure 1, includes the following services:
  • Audio data-logging service;
  • Sensory measurements logging service;
  • Synchronization service;
  • Monitoring and probing service;
  • Cloud processing service;
  • Push notification service;
  • Statistical trends service.
First, the audio data-logging service is responsible for sending the recorded raw data to the cloud over FTP. In contrast, the sensory measurement-logging service (including FFT results if textual sound preprocessing is selected or raw sound data) sends textual data measurements over HTTP PUT. The stored WAV or CSV files are cloud processed, reaching the result of the existence or not of the events listed in Table 1.
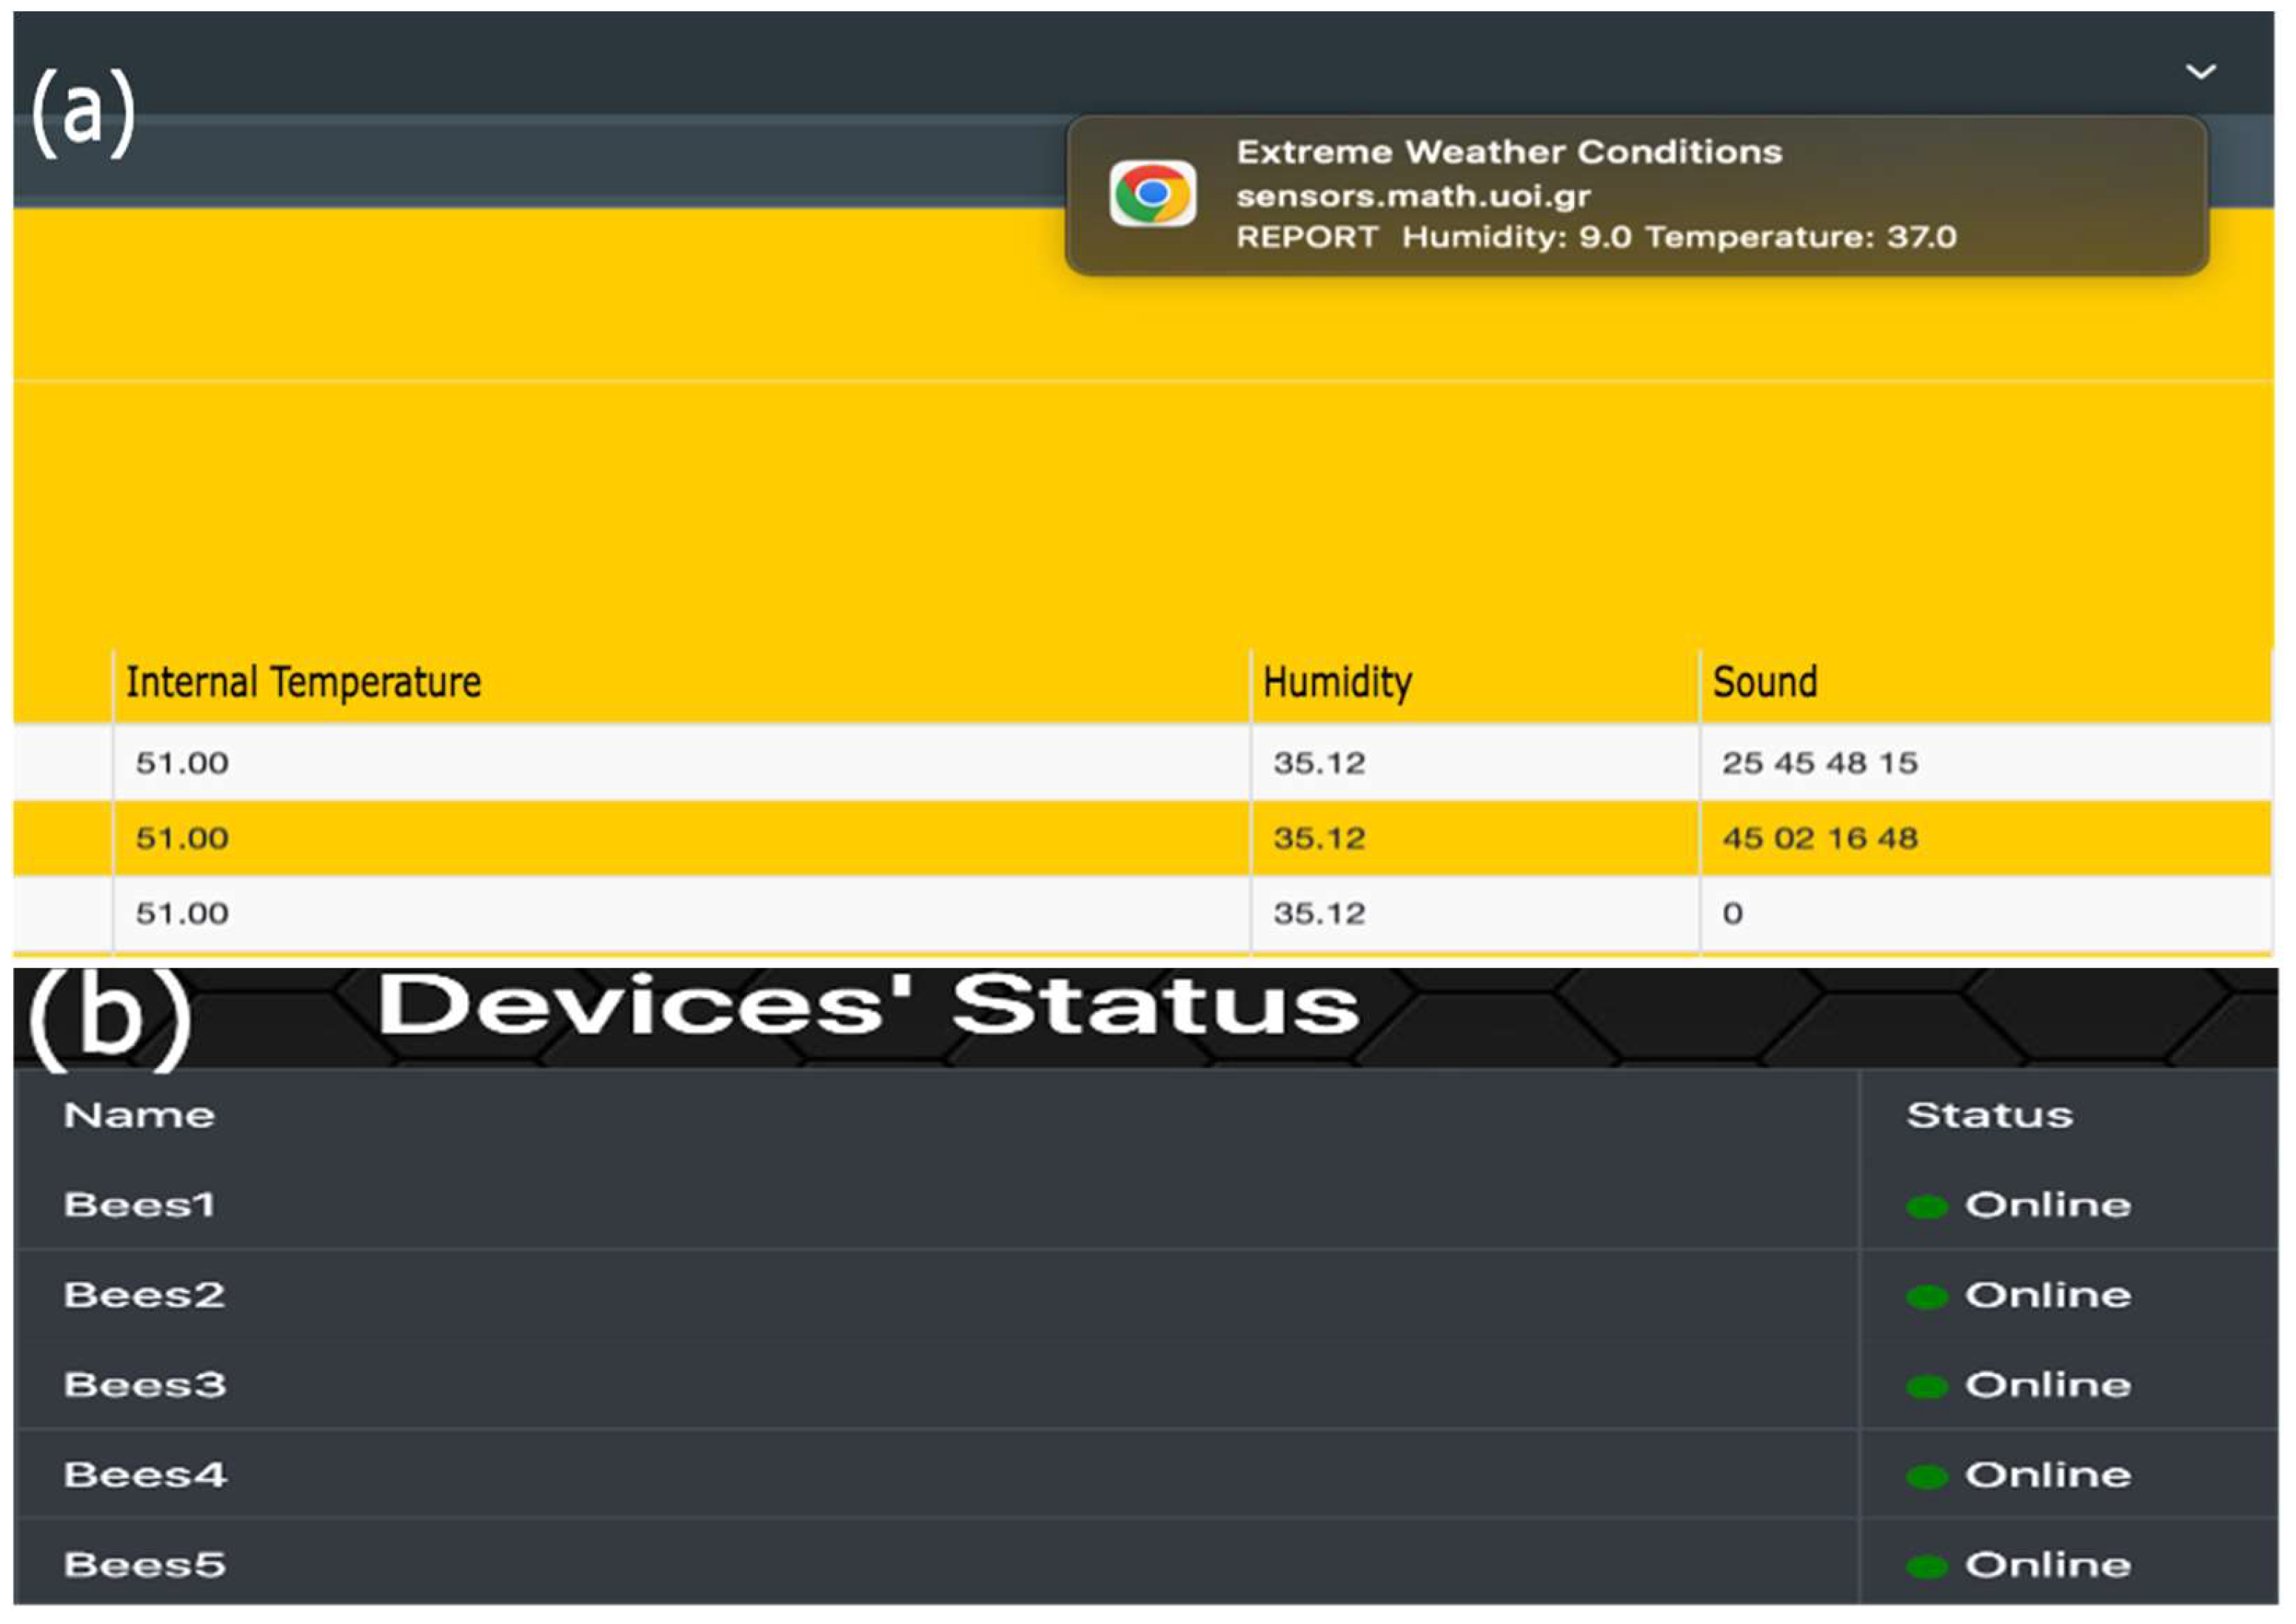
Along with the results from sound processing, there are some critical threshold values of temperature and humidity to which beekeepers can be alerted by the push notification service (Figure 3a) over HTTP JSON POST, providing information about unsuitable conditions inside and outside of the beehives, as described in Table 1. Alert push messages include temperature threshold values exceeding 35 °C or below 10 °C and relative humidity values below 10% or above 90%.
NTP service synchronization over VPN is also implemented in BeeSD to keep the devices synchronized with the time zone. This kind of synchronization provides the capability to ensure that the recording session, depending on user preferences, works as scheduled and is not affected by any kind of disruption, such as devices shutting down or any sudden reboots.
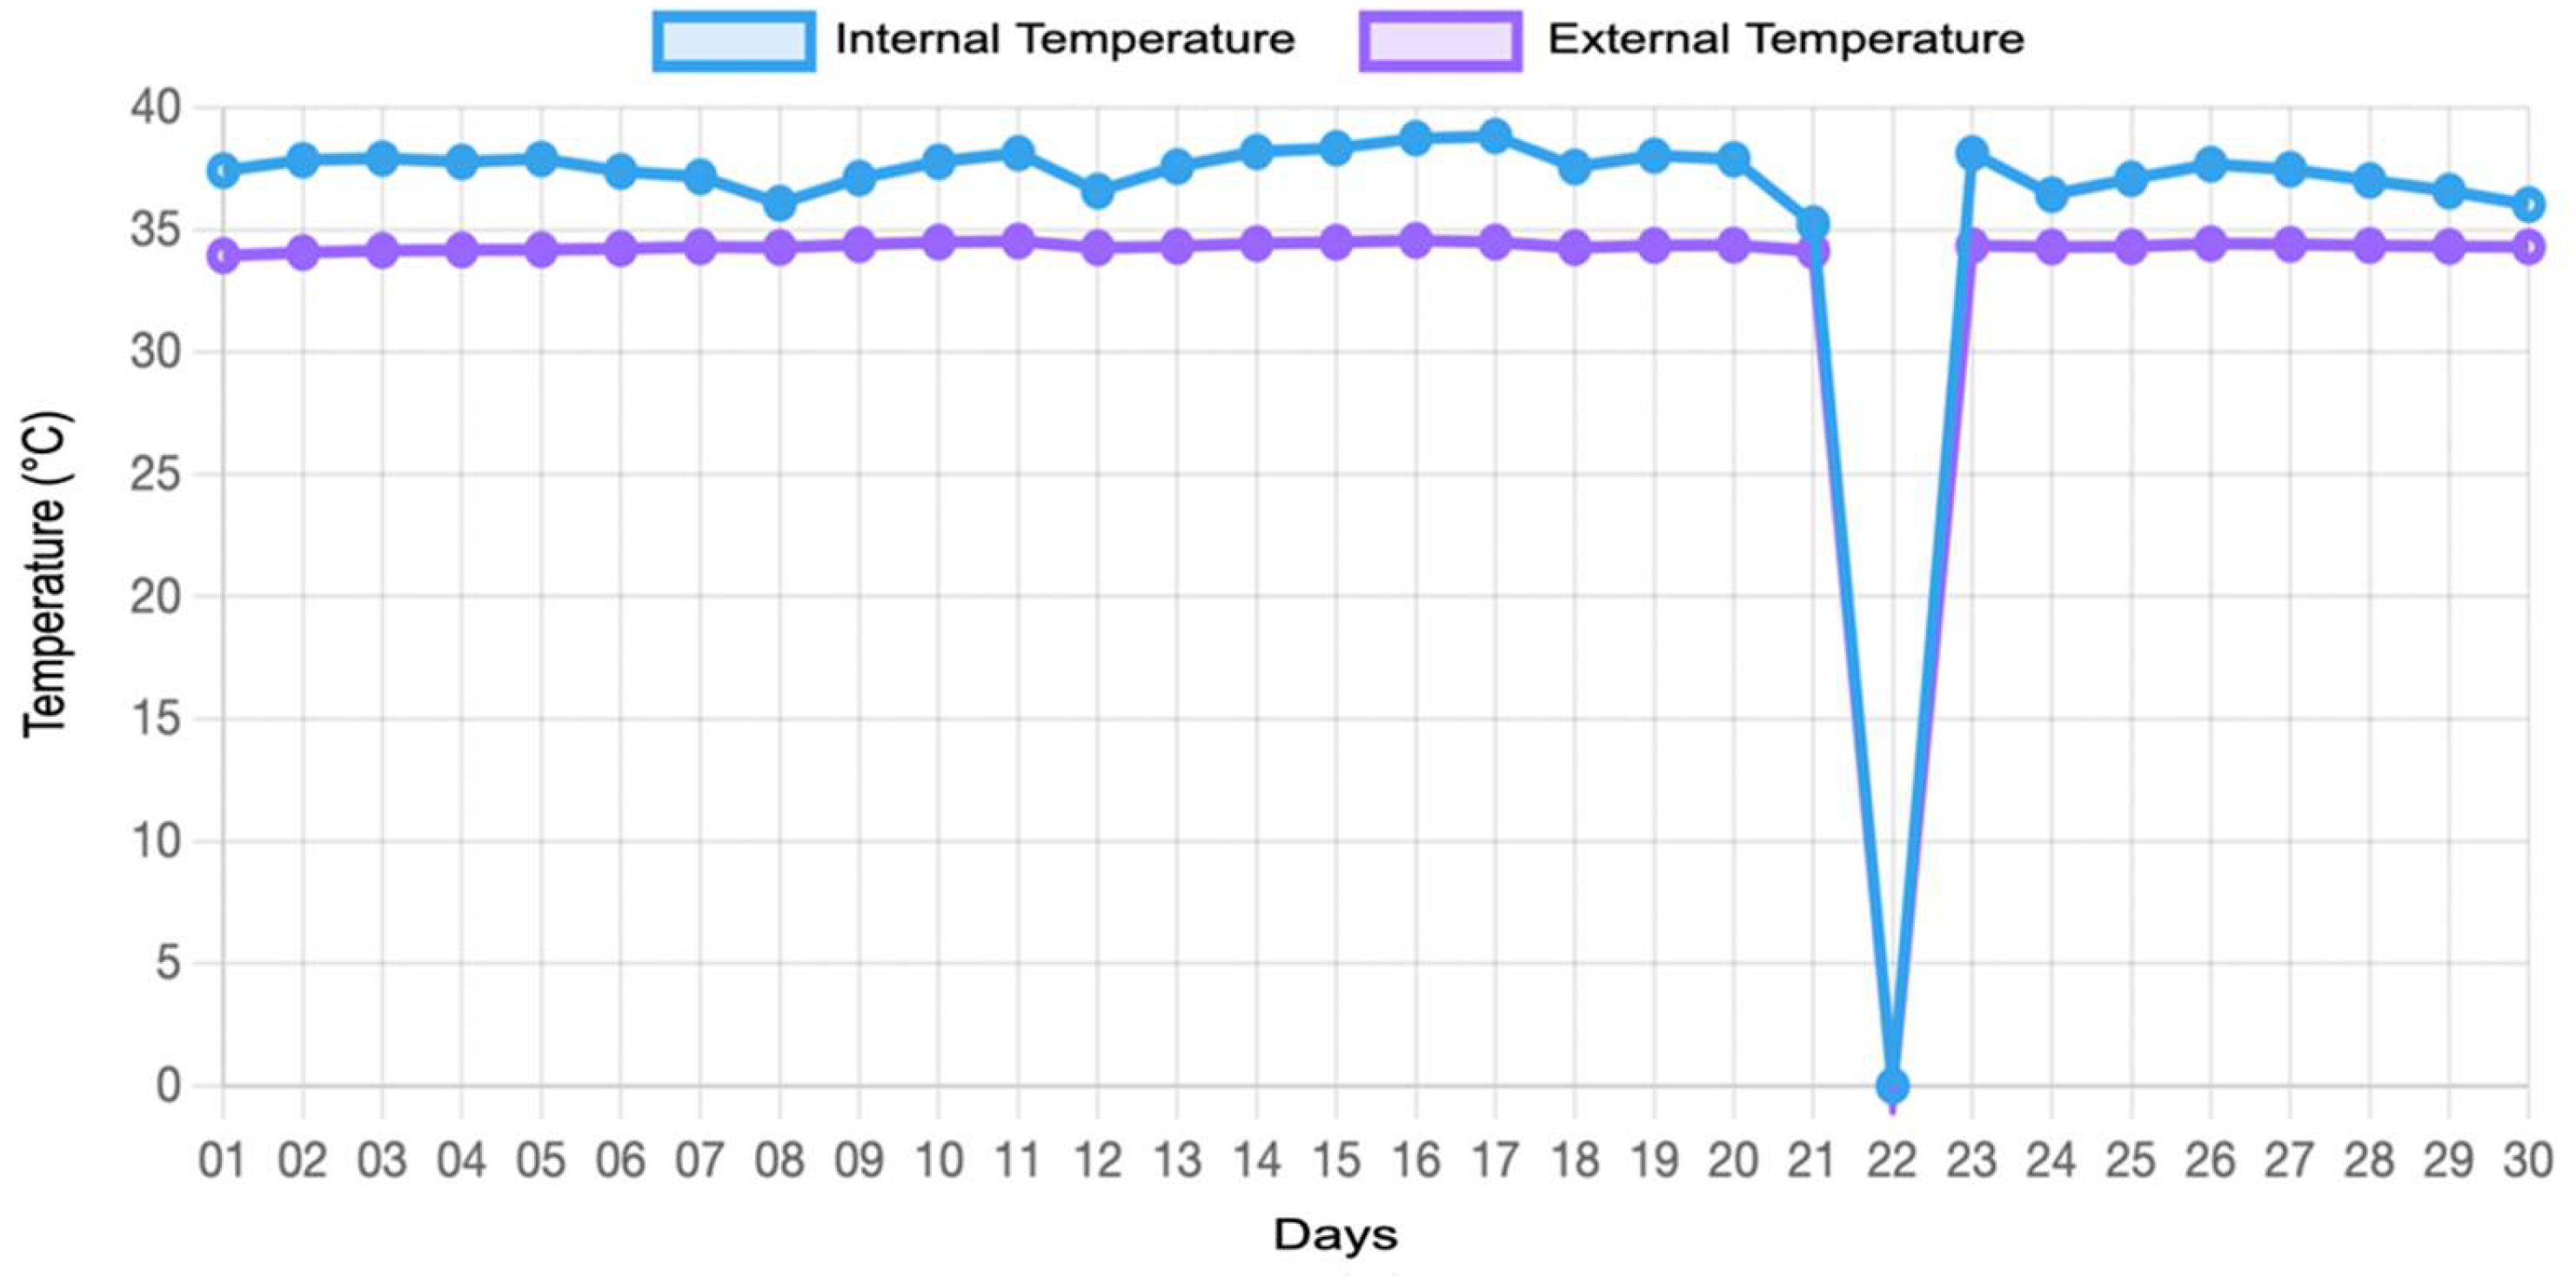
The statistical trends service sends JSON temperature and humidity data over the requested HTTP post time interval. Temperature data at the beehive lid (external temperature) and inside frames (internal temperature probe) are illustrated in Figure 4 as mean daily values for July 2022. Similar statistical trends for internal humidity values can be shown for each BeeSD device by the BeeSD statistical trends Web panel.
Monitoring and probing services (see Figure 3b) allow users to know the status of implemented devices and peripherals (online or offline). Besides this, this service can set the on/off actuator intervals per beehive and provide real-time information for the end-node sensors. Finally, this service allows users to choose the data they want to upload (text or raw).
Regarding sound analysis and visualization, the input of the cloud-uploaded WAV files from each beehive is split into minute raw sound data files. Next, for each of these files, a low-pass filter is applied with a center frequency of fc = 2 kHz, focusing on the sound frequency range produced by bees. A fast Fourier transformation (FFT) is then applied per raw data minute file, producing an FFT spectrogram (FFT diagrams over time). Figure 5a,b illustrates the original signals, with FFT accordingly, where the y axis contains the amplitude measured in dBV (where d B V = (   20 log m V V + 60   )).
In addition, focusing on the Table 1 C3 and C4 cases, these values are narrowed down to the frequency range of 300−600 Hz and then classified into 10–25 Hz frequency bins (300–325, 325–350,…, 57,5600). Each bin consists of a one-minute sum of amplitudes for the specified frequency range (e.g., 200–235). The response to this classification process is illustrated in Figure 5c. In swarming or queen loss events, there is a significant response increase (in mV) in the monitoring frequency bins in that frequency range. Appropriate push notification for swarming or queen loss is sent if at least 5/10 bins signify a 70% increase of their amplitude values between two consecutive probes.
Appropriate VPN service infrastructure is set to monitor BeeSD sensor and node status and send push notifications whenever any of them develop any minor or major connectivity or functionality issues. In addition, through the VPN probing service, beekeepers can check and change the number of probes for as long as the recording duration.
The beekeepers can also monitor all the BeeSD devices working under the same concentrator. However, as is explained in the next section, this affects the energy and data consumption of the system. Thus, one of the biggest challenges of BeeSD is to maximize the quality of data while keeping the energy footprint and data consumption as low as possible. The authors’ experimentation and BeeSD system validation follow.

4. BeeSD System Experimentation

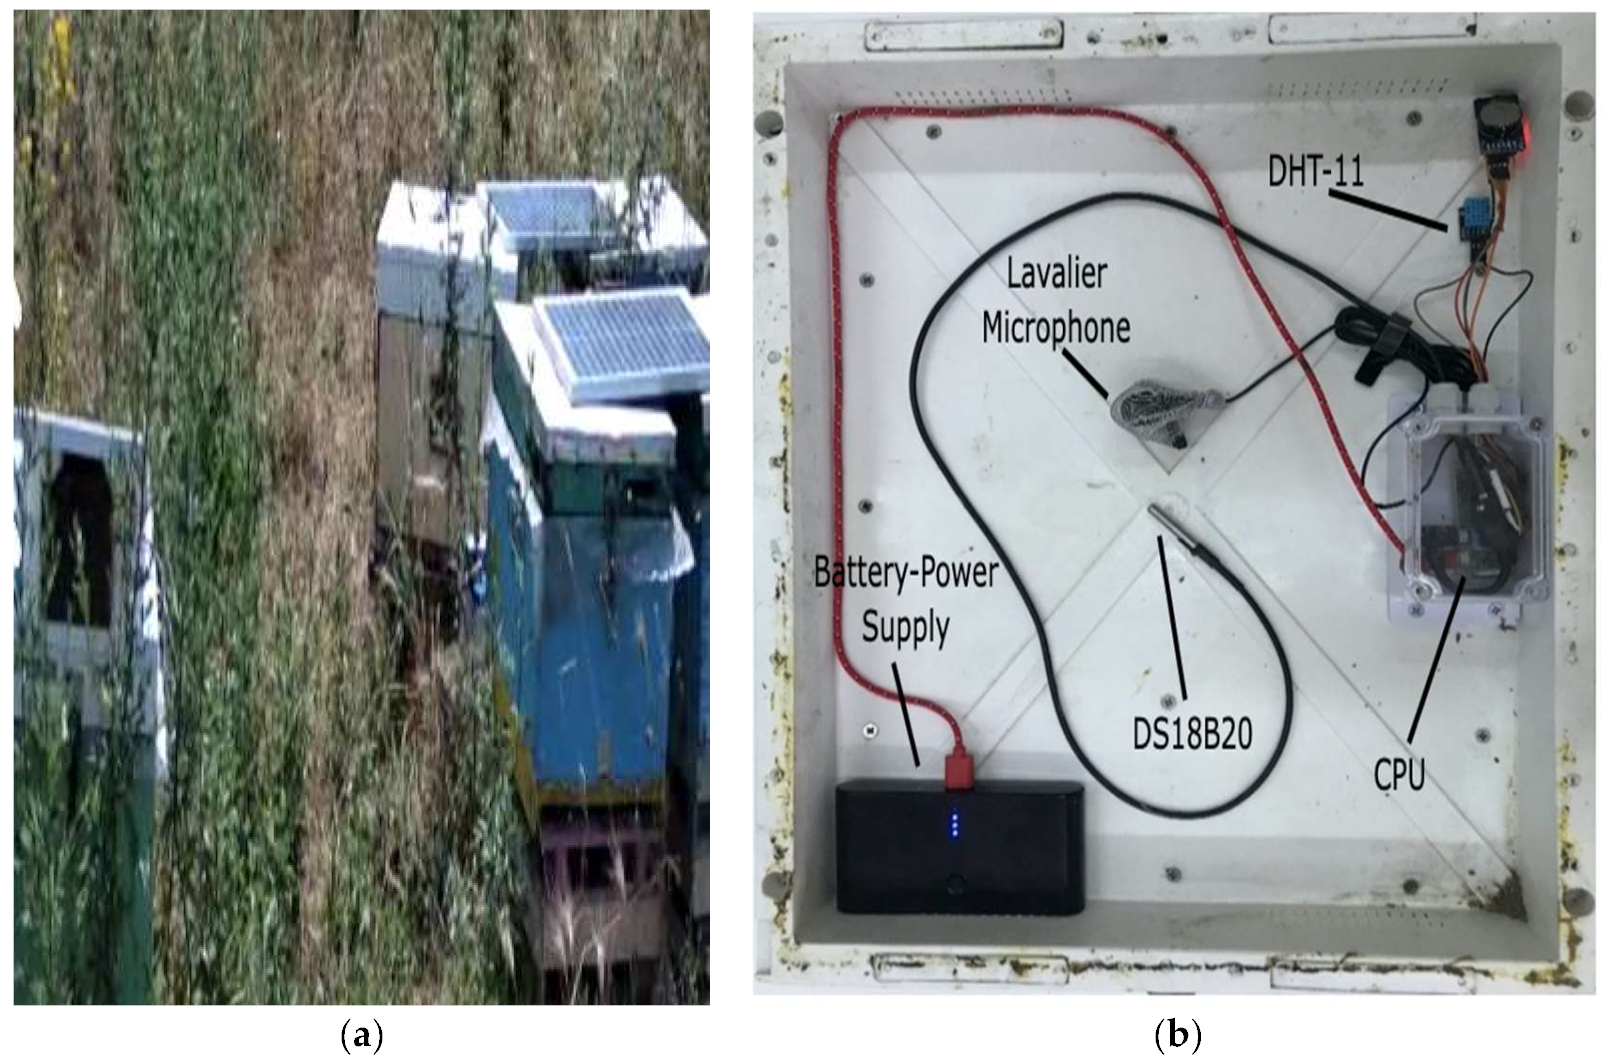
The authors implemented an experimental BeeSD system setup to validate their system, as shown in Figure 6a. The experimental setup included five end-node beehive prototypes, one primary concentrator (Wi-Fi to 5G), and three battery-enabled solar panels to turn the BeeSD end-node component into an autonomous one. Figure 6b illustrates the internal parts of the end-node prototypes. Prototype sensory parts were mostly low-cost IoT sensors, including the DS18B20 temperature probe, DHT11 humidity and temperature sensor attached to the beehive lid, and an omnidirectional microphone with a frequency range of 35 Hz–18 kHz and −30 dB sensitivity. The ARM CPU, Wi-Fi transponder, and MCU power controller were included in the transparent IP-56 plastic case.
The proof-of-concept system device was tested for its operational durability, data transmissions to the cloud (data delivery capabilities), and energy consumption. In addition, the BeeSD end-node sensors and system services were confirmed as functional in field operations, providing a Technology Readiness 7 (TRL-7) system prototype demonstration in an operational environment. As a result of these tests, three Key Performance Indicators (KPIs), presented in Section 4.1, were defined to confirm that BeeSD is a low-cost, easy-to-install, and low-power system. The KPI expected values were set using references to the functional capabilities of existing autonomous system used by the beehive industry (specifically GPS safety systems and weight scales).

4.1. BeeSD Key Performance Indicators

BeeSD aims to become a low-power, easy-to-use, and low-cost system. To elaborate and prove that the BeeSD prototype implementation maintains those attributes, some Key Performance Indicators were determined from the authors’ proof-of-concept experimentation and market research. The BeeSD system KPIs and their corresponding reference attributes are presented in Table 2.
The main concentrator used by the BeeSD system operates autonomously, with power supplied by a 60 Ah/12 V battery connected to a 20 Wh/12 V solar panel. The concentrator requires more energy than the other end-node devices because it works continuously, receiving data from 5–10 devices and uploading the sensory data to the cloud.

4.2. BeeSD End-Node Device Power Consumption

Several experiments were performed to verify BeeSD end nodes as low-energy devices to determine the least possible power needed. The first experiment was to disable every power-consuming part of the ARM peripherals and GPIO port and calculate its consumption. The results showed that the ARM cores while being idle with no active peripherals (Wi-Fi, HDMI, LEDs, and USB ports), consumed around 100 mA, whereas upon activating Wi-Fi and USB, this rose to 120 mA.
BeeSD, as presented above, uses USB connectivity for the microphone on a 5 V power supply and GPIO connectivity for its sensors, which work on a 3.3 V power supply. The power consumption results for the sensors and microphone used for the prototype are shown in Table 3. Apart from the minimum consumption of the temperature and humidity sensors, the microphone through USB seemed to consume 75 mA on average, no matter whether it was in standby mode or recording. As it seemed to happen and was proven by the experiments, the USB port was supplied with power even if the connected device was not recording. To make the BeeSD device consume less power, a periodic agent was installed that disabled the USB port when the device was not recording. Under this change, the consumption of the USB port in standby mode was rapidly reduced to 2 mA.
The ‘BeeSD’s recorded data, including CSV and WAV files, need to be sent to the cloud data-logging services for further manipulation, as described in Section 3.2. This process requires data consumption exceeding 1 GB, depending on the frame rate, when the data are transmitted as WAV files. Such big data transmissions cannot be transferred over a cellular LTE/3G/4G network because they would require a significant amount of time to upload, translating to vast energy expenditure. To solve this issue, BeeSD uses its four-core ARM CPU to convert WAV files into CSV or JPEG preprocessing FFT footprints and then upload minimal information to the cloud. In this way, consumption is minimized.

4.3. BeeSD Data-Logging Upload Experiments

The BeeSD system’s directive is to achieve all three KPIs mentioned in Table 2. Therefore, in each BeeSD sensory probing period, each device records at 22,400 Hz for one minute every time, as many times as scheduled. As well as this recording time, there is some time needed for the end-node system to boot up and initialize, as it is powered off after each probe and put to sleep. Additionally, the greater the WAV raw data size, the more time is needed to transfer it to the cloud. In this experimental scenario, the Wav file size was 1.9–2.1 MB for a recording interval of 1 min. This recording time is enough for the cloud processing service to perform deep learning algorithms on the input delivered. The analytical results of total transmitted sensory data and total time for the data to be sent to the cloud via the concentrator over an LTE 3G/4G network are shown in Table 4.
Focusing on the ‘BeeSD’s optimal number of daily probes achieving all three KPIs, the final analysis is given in Table 5, which shows the correlation between the number of probes and the days of operation using a 10.000 mAh battery. With such a battery, KPI 2 was achieved as the whole system was implemented on the beehive lid, making it easy to install and use. Table 5 shows the number of daily probes performed compared to the number of BeeSD end-node devices per concentrator (n). For each value of probes and devices/concentrator, the total number of operations in days was calculated until the end node’s battery runs out.
Using BeeSD simultaneously with 12 daily probe intervals and one device per concentrator, the BeeSD device provided a battery life expectancy of more than four months. In contrast, combining five devices per concentrator reduced battery life expectancy to 3 months. In both ways, KPI 1 was satisfied. Furthermore, if connecting 10 devices per concentrator, the end nodes’ battery life did not exceed 70 days of operation; thus, the system can be characterized as marginally low energy. In conclusion, using five beehives under one concentrator is the optional choice, as it provides BeeSD with a high battery life expectancy and turns it into a low-cost system (mentioned by KPI 3), as it reduces telecommunication provider costs. Finally, BeeSD achieved all three Key Performance Indicators in at least two setup cases (n = 5 and n ≤ 7). This makes BeeSD a promising low-power, low-cost system.
Beekeepers consider important technology enhancements, IoT devices, and tools offering conditions monitoring and statistical trends, with notifications for monitoring condition outliers. Nevertheless, since the cost of a small three-frame beehive with a young queen is around 60–65 € and that for a single floor 10-frame beehive is around 130–150 €, it is difficult for beekeepers to purchase technological monitoring devices for each beehive. A typical example is the limited use of weight scales that require a per-beehive installation and have prohibitive costs which are close to the cost of a 10-frame beehive (150–200 €). To these expenses, monthly telecommunication provider costs are also added per beehive.
To overcome the telecommunications costs issue, the BeeSD system uses a central hive (used by the BeeSD IoT devices; KPI 3). It thus reduces these telecommunication costs to 1/5 or 1/10 if applied to 5 or 10 beehives. Furthermore, since the one-off cost per device is estimated to be close to 80–100 € (a similar cost also applies for the concentrator device), it is still a significant purchase for the small professional beekeeper. However, if the system is provided as a monthly paid service, the one-off BeeSD equipment costs can be completely deducted from the beekeepers. Therefore, 30–50 € per 5 or 10 beehives equipped with the BeeSD IoT device monthly service costs can be considered a low-cost beekeeping investment.

5. Conclusions

This paper presents a new beehive system capable of logging and visualizing various beehive events. BeeSD aims to evolve traditional beehives, presenting a new era in the apiary field of remote sensing. As presented in this paper, BeeSD has been validated in real conditions. To achieve an efficient solution, the authors defined the key validation indicators for low-cost, low-energy, and easy installation. From the authors’ experimentation, the implementation of the IoT BeeSD system attached inside the beehive lid turns it into an easy-to-install system for every beekeeper.
The BeeSD system’s distributed architecture achieves 80–90% fewer telecommunication costs for cloud data transmissions while maintaining a low energy footprint, providing the system with the ability of autonomous operation of at least 69–90 days if 5 or 10 beehives are utilized per concentrator. Finally, the BeeSD system cloud data-logging and processing services and user interfaces are capable of real-time data visualization and analysis and can send real-time push notifications to the beekeepers regarding critical measurements. The authors will consider data processing and analysis with the incorporation of deep learning algorithms in future work.

Author Contributions

Conceptualization, D.I.K. and S.K.; Funding acquisition, C.V.B., K.A.S. and G.S.S.; Investigation, D.I.K.; Methodology, S.K.; Resources, C.V.B., K.A.S. and G.S.S.; Software, D.I.K. and T.K.; Supervision, S.K.; Writing—original draft, D.I.K.; Writing—review & editing, S.K. All authors have read and agreed to the published version of the manuscript.

Funding

This research has been co-financed by the European Union and Greek national funds through the Operational Program Competitiveness, Entrepreneurship and Innovation, under the call RESEARCH–CREATE–INNOVATE (project code: T21EDK-2402).

Conflicts of Interest

The authors declare no conflict of interest.

References

  1. Etxegarai-Legarreta, O.; Sanchez-Famoso, V. The Role of Beekeeping in the Generation of Goods and Services: The Interrelation between Environmental, Socioeconomic, and Sociocultural Utilities. Agriculture 2022, 12, 551. [Google Scholar] [CrossRef]
  2. Fitzgerald, D.W.; Murphy, F.E.; Wright, W.M.; Whelan, P.M.; Popovici, E.M. Design and development of a smart weighing scale for beehive monitoring. In Proceedings of the 2015 26th Irish Signals and Systems Conference (ISSC), Carlow, Ireland, 24–25 June 2015; pp. 1–6. [Google Scholar] [CrossRef]
  3. Kviesis, A.; Zacepins, A. System architectures for real-time bee colony temperature monitoring. Procedia Comput. Sci. 2015, 43, 86–94. [Google Scholar] [CrossRef]
  4. Cecchi, S.; Terenzi, A.; Orcioni, S.; Piazza, F. Analysis of the sound emitted by honey bees in a beehive. In Proceedings of the Audio Engineering Society Convention 147, New York, NY, USA, 16–19 October 2019. [Google Scholar]
  5. Voudiotis, G.; Kontogiannis, S.; Pikridas, C. Proposed Smart Monitoring System for the Detection of Bee Swarming. Inventions 2021, 6, 87. [Google Scholar] [CrossRef]
  6. Milota, M. Beehive Security System against Unauthorized Manipulation. In Proceedings of the 27th Conference EEICT 2021, Brno, Czech Republic, 27 April 2021. [Google Scholar]
  7. Bellos, C.V.; Fyraridis, A.; Stergios, G.S.; Stefanou, K.A.; Kontogiannis, S. A Quality and disease control system for beekeeping. In Proceedings of the 2021 6th South-East Europe Design Automation, Computer Engineering, Computer Networks and Social Media Conference (SEEDA-CECNSM), Preveza, Greece, 24–26 September 2021; pp. 1–4. [Google Scholar] [CrossRef]
  8. Meikle, W.; Holst, N. Application of continuous monitoring of honeybee colonies. Apidologie 2015, 46, 10–22. [Google Scholar] [CrossRef]
  9. Gates, B.N. The Temperature of the Bee Colony; Number 96; US Department of Agriculture: Washington, DC, USA, 1914. [Google Scholar]
  10. Jiang, J.A.; Wang, C.H.; Chen, C.H.; Liao, M.S.; Su, Y.L.; Chen, W.S.; Huang, C.P.; Yang, E.C.; Chuang, C.L. A WSN-based automatic monitoring system for the foraging behavior of honey bees and environmental factors of beehives. Comput. Electron. Agric. 2016, 123, 304–318. [Google Scholar] [CrossRef]
  11. Murphy, F.E.; Popovici, E.; Whelan, P.; Magno, M. Development of an heterogeneous wireless sensor network for instrumentation and analysis of beehives. In Proceedings of the 2015 IEEE International Instrumentation and Measurement Technology Conference (I2MTC) Proceedings, Pisa, Italy, 11–14 May 2015; pp. 346–351. [Google Scholar] [CrossRef]
  12. Zabasta, A.; Zhiravetska, A.; Kunicina, N.; Kondratjevs, K. Technical Implementation of IoT Concept for Bee Colony Monitoring. In Proceedings of the 2019 8th Mediterranean Conference on Embedded Computing (MECO), Budva, Montenegro, 10–14 June 2019; pp. 1–4. [Google Scholar] [CrossRef]
  13. Zacepins, A.; Kviesis, A.; Pecka, A.; Osadcuks, V. Development of internet of things concept for precision beekeeping. In Proceedings of the 2017 18th International Carpathian Control Conference (ICCC), Sinaia, Romania, 28–31 May 2017; pp. 23–27. [Google Scholar] [CrossRef]
  14. Gil-Lebrero, S.; Quiles-Latorre, F.J.; Ortiz-López, M.; Sánchez-Ruiz, V.; Gámiz-López, V.; Luna-Rodrguez, J.J. Honey bee colonies remote monitoring system. Sensors 2016, 17, 55. [Google Scholar] [CrossRef]
  15. Mrozek, D.; Gȯrny, R.; Wachowicz, A.; Małysiak-Mrozek, B. Edge-Based Detection of Varroosis in Beehives with IoT Devices with Embedded and TPU-Accelerated Machine Learning. Appl. Sci. 2021, 11, 11078. [Google Scholar] [CrossRef]
  16. Bilik, S.; Kratochvila, L.; Ligocki, A.; Bostik, O.; Zemcik, T.; Hybl, M.; Horak, K.; Zalud, L. Visual Diagnosis of the Varroa Destructor Parasitic Mite in Honeybees Using Object Detector Techniques. Sensors 2021, 21, 2764. [Google Scholar] [CrossRef]
  17. Cecchi, S.; Spinsante, S.; Terenzi, A.; Orcioni, S. A smart sensor-based measurement system for advanced bee hive monitoring. Sensors 2020, 20, 2726. [Google Scholar] [CrossRef] [PubMed]
  18. Zgank, A. IoT-Based Bee Swarm Activity Acoustic Classification Using Deep Neural Networks. Sensors 2021, 21, 676. [Google Scholar] [CrossRef] [PubMed]
  19. Imoize, A.L.; Odeyemi, S.D.; Adebisi, J.A. Development of a Low-Cost Wireless Bee-Hive Temperature and Sound Monitoring System. Indones. J. Electr. Eng. Inform. 2020, 8, 476–485. [Google Scholar] [CrossRef]
  20. Ngo, T.N.; Wu, K.C.; Yang, E.C.; Lin, T.T. A real-time imaging system for multiple honey bee tracking and activity monitoring. Comput. Electron. Agric. 2019, 163, 104841. [Google Scholar] [CrossRef]
  21. Marchal, P.; Buatois, A.; Kraus, S.; Klein, S.; Gomez-Moracho, T.; Lihoreau, M. Automated monitoring of bee behaviour using connected hives: Towards a computational apidology. Apidologie 2020, 51, 356–368. [Google Scholar] [CrossRef]
  22. Kontogiannis, S. An internet of things-based low-power integrated beekeeping safety and conditions monitoring system. Inventions 2019, 4, 52. [Google Scholar] [CrossRef]
  23. Kviesis, A.; Zacepins, A.; Durgun, M.; Tekin, S. Application of wireless sensor networks in precision apiculture. In Proceedings of the 14th International Scientific Conference Engineering for Rural Development, Jelgava, Latvia, 20–22 May 2015; Volume 20, pp. 440–445. [Google Scholar]
  24. Zygi Company. Digital Scales for Measuring Beehive Weight and Respond to Critical Incidents, Product. 2017. Available online: http://zygi.gr (accessed on 19 May 2020).
  25. 3Bee Company. Hive-Tech, the Innovative Monitoring System for Beekeeping. 2017. Available online: https://www.3bee.it/en/hive-tech (accessed on 27 September 2022).
  26. Arnia Company. Remote Hive Monitoring System with Alerts. 2018. Available online: http://www.arnia.co.uk (accessed on 27 September 2022).
  27. Tomtsis, D.; Kokkonis, G.; Kontogiannis, S. Evaluating existing wireless technologies for IoT data transferring. In Proceedings of the 2017 South Eastern European Design Automation, Computer Engineering, Computer Networks and Social Media Conference (SEEDA-CECNSM), Kastoria, Greece, 23–25 September 2017; pp. 1–4. [Google Scholar] [CrossRef]
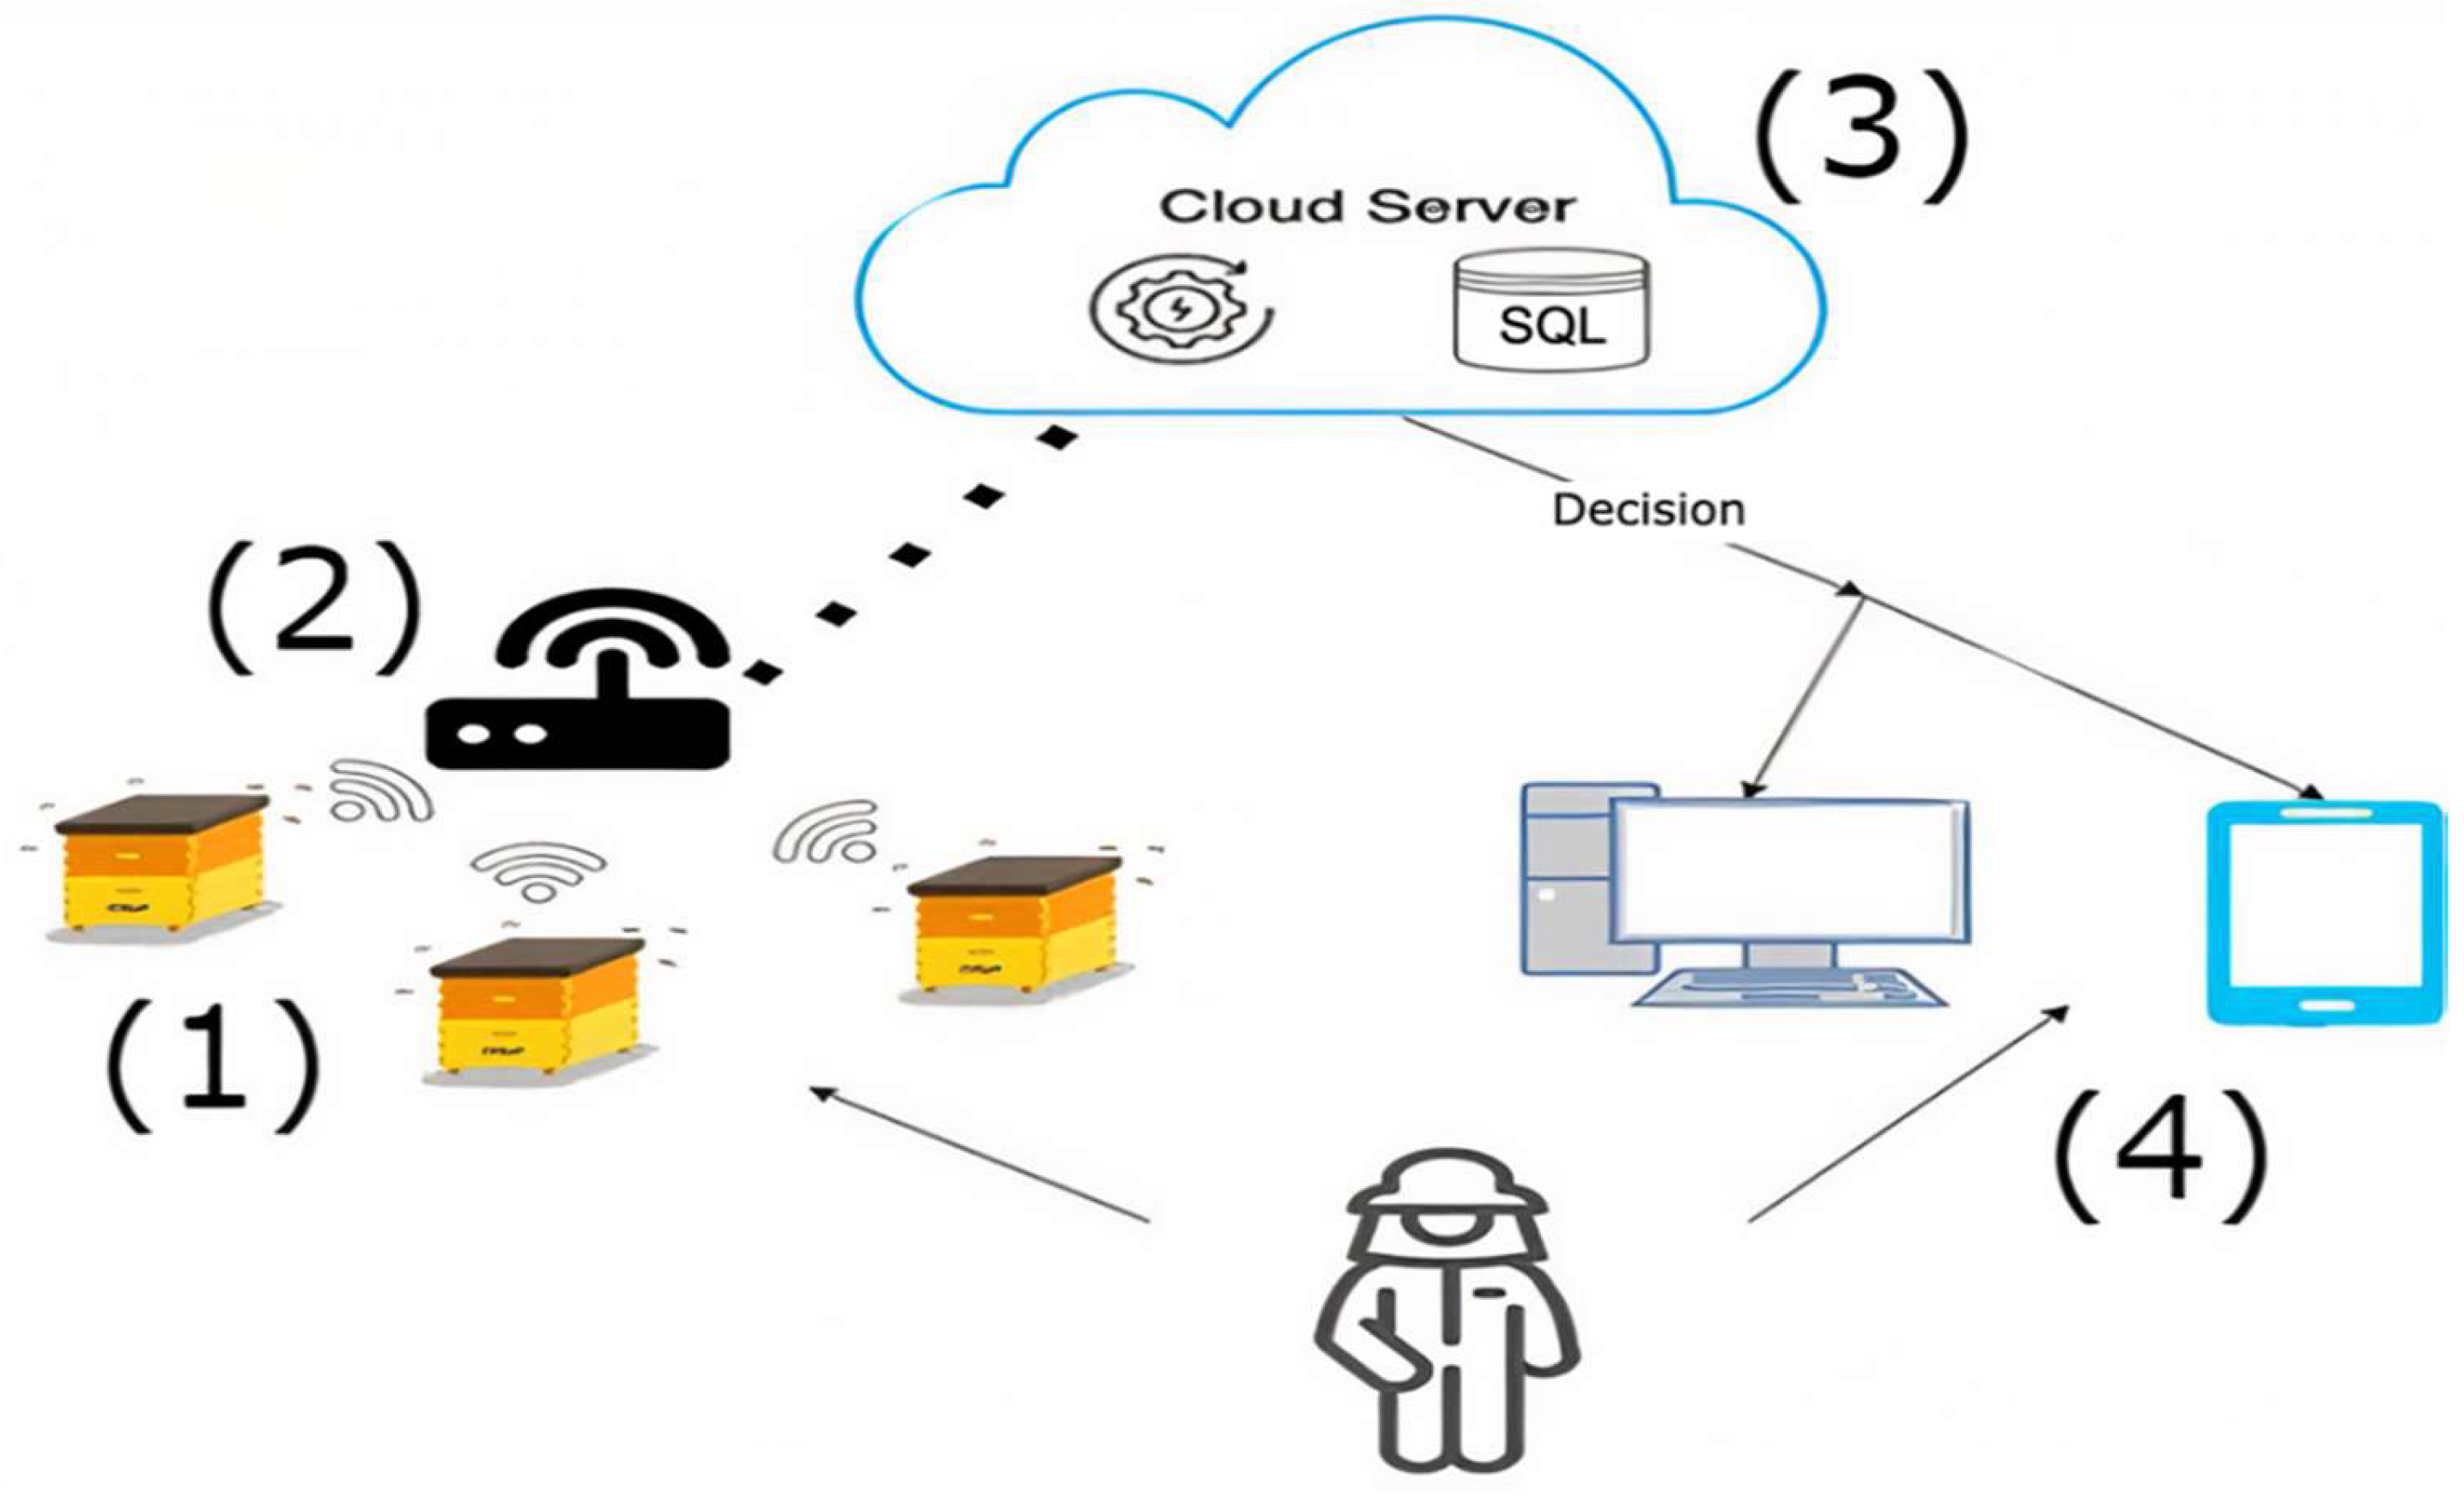
Figure 1. BeeSD system high-level system architecture.
Electronics 11 03152 g001
Figure 2. BeeSD end-node IoT device components and parts.
Electronics 11 03152 g002
Figure 3. (a) Push notification service for unsuitable weather conditions, (b) Monitoring and probing service User Interface.
Electronics 11 03152 g003
Figure 4. Temperature graphs of Jun 2022, taken by the statistical trends service User Interface (Internal frame temperature, External Temperature in the beehive inner lid part).
Electronics 11 03152 g004
Figure 5. Representation of (a) signal during a minute, (b) frequency in the band of (0−2000 Hz), and (c) aggregated frequency response (in 10 bins).
Electronics 11 03152 g005
Figure 6. (a) BeeSD system proof-of-concept setup and end-node prototype. The right figure shows the prototype experimentation performed in the beekeeping station. (b) The BeeSD prototype sensory parts.
Electronics 11 03152 g006
Table 1. Beehive condition incident classification and current sensory technologies used by IoT devices [2,3,4,5,6].
CategoryDescriptionIoT Devices and Sensors
Used
C1: CCD famineColony Collapse Disorder (CCD) due to famine and lack of feeding resources (pollen)Cameras and weight scales [2]
C2: Environmental factorsExtreme environmental conditions due to climate change. Very low/high temperatures. Extended low/high humidity due to rainfalls/aridityTemperature and
humidity sensors. Meteorological stations [3]
C3: SwarmingCCD due to swarmingWeight scales
and microphones [4]
C4: Queen lossCCD due to queen mortality-
C5: Diseases/ParasitesVarroa mite, bee Nosema fungusCameras experimentally, in some cases only [5]
C6: External attacksMammals, wasps, hornetsCameras, vibration sensors, gyroscopes, GPS [6]
Table 2. BeeSD Key Performance Indicators.
Key Performance IndicatorIn-Process KPI
KPI 1: Low energyContinuous operation of at least 90 days.
KPI 2: Easy to installAll components are placed on the lid, including the battery (maximum of 10,000 mAh). Batteries with capacities higher than 10,000mAh cannot fit inside the beehive lid, and their weight makes them hard to attach and operate (remove the battery, charge it, and place it back to the lid case).
KPI 3: Low costScalability of 5–10 beehives per concentrator. Integration of more than 10 beehives per concentrator (20–50) quadruples the concentrator cost and doubles the cost of the required battery and photovoltaic (PV) panel needed to maintain the concentrator’s autonomous operation.
Table 3. Energy consumption of BeeSD end-node device CPU, peripherals, and attached sensors.
StatusTemperature and
Humidity Sensor
Temperature
Sensor Probe
Microphone (USB)
Active0.5 mA1.5 mA82 mA
Standby100 nA700 nA70 mA
Average0.2 mA1 mA75 mA (before disabling
2 mA (after disabling)
Table 4. Relation between the daily number of probes and the total time in minutes needed for upload to the BeeSD data-logging services via the concentrator device (using n = 1, 5, and 10 end-node devices per concentrator).
Number of
Daily Probes
Total Size
(MB)
Total Time
n = 1 (min)
Total Time
n = 5 (min)
Total Time
N = 10 (min)
59.518.1513.3234.33
1222.8116.3026.6468.66
2445.6139.1163.92164.77
4891.2178.23127.84329.53
64121.61104.30170.45439.37
128243.21208.60340.89878.73
Table 5. BeeSD end-node device energy footprint. The number of daily probes in contrast to the number of nodes used per concentrator, with bold showing the values that cover the KPI 1 requirement.
Number of
Daily Probes
Days of Operation
(n = 1)
Days of Operation
(n = 5)
Days of Operation
(n = 10)
5294.51180.1869.9
12147.2690.134.95
2461.3637.5514.56
4830.6818.777.28
6423.0114.085.46
12811.517.042.73
Publisher’s Note: MDPI stays neutral with regard to jurisdictional claims in published maps and institutional affiliations.