Article

Offset Compensation in Resistive Stretch Sensors Using Low-Frequency Feedback Topology

Department of Electronics, AGH University of Science and Technology, 30-059 Kraków, Poland
*
Author to whom correspondence should be addressed.
Electronics 2022, 11(19), 3158; https://doi.org/10.3390/electronics11193158
Submission received: 26 July 2022 / Revised: 6 September 2022 / Accepted: 21 September 2022 / Published: 1 October 2022

Abstract

:
Respiration monitoring systems play an important role in healthcare and fitness. For this purpose, resistive stretch sensors are frequently used, which are cheap and simple in operation. However, they are not free from drawbacks. Varying offset due to patient movement, low signal amplitude, as well as susceptibility to interference, can all pose serious challenges. In this paper, a novel signal conditioning circuit for a resistive respiration sensor is proposed that alleviates some of the above problems. Namely, the proposed low-frequency feedback topology improves the dynamic range by offset compensation, sustaining a high signal amplification. Further advantages of the new configuration are the phase shift of 0.5 degrees in the band of interest and higher gain for the respiration signal than for the offset. The topology was proved to correctly represent signal amplitude changes, as well as to be able to sample human respiration in the home environment. However, the circuit shows some nonlinear behavior around resistance discontinuity points–settling time after body position change of the patient, which can be as long as 40 s. The circuit was tested both in bench tests and in the prototype of a respiratory polygraphy device during actual sleep apnea examinations. The results indicate that resistive stretch sensors, along with low-frequency feedback topology, are a promising development path for future respiration monitoring devices.

1. Introduction

Information about human breathing is vital mostly in medical diagnosis, but can also find applications in sport and fitness monitoring. Such data are important, for example, for tracking training progress, diagnosis of various diseases, or recording of treatment progress [1,2]. However, the quality of these data depends on the measurement process. There are several types of measurements that provide information about breath rate and amplitude. These can record either airflow through the upper airways, or respiratory muscle action and the movement associated with it. A novel design of a circuit for respiratory effort sensors is proposed in this paper. The study of respiratory performance is crucial in the medical diagnosis of some disease entities, including sleep apnea. This disorder is the most common sleep dysfunction and affects 2% of women and 4% of men in the general population [3]. However, the diagnosis of sleep apnea can be complicated and expensive. Polysomnography, which is considered a gold standard for the task, involves the patient having a whole-night stay at a sleep laboratory. Unusual sleeping conditions and stress associated with spending a whole night away from home can render the results of the examination not representative. In such a case, the whole procedure must be repeated, thus increasing the cost. Alternatively, an at-home examination can be conducted, which is usually cheaper [4].
There are two main types of sleep apnea: central and obstructive. Central sleep apnea (CSA) occurs when there is a reduction in ventilatory effort, resulting in airflow reduction. In turn, obstructive sleep apnea (OSA) is associated with a blockade in the upper airway. The respiratory muscles work properly, but an obstruction in the upper airway is preventing the air from getting into the lungs [5]. Risk factors for OSA include increased body mass index (BMI), elevated systolic blood pressure, as well as low oxygen saturation levels [6]. The differentiation between the two types of sleep apnea is obtained by monitoring respiratory effort. It is not present in CSA, but when the patient suffers from OSA, the respiratory muscle action is correct. The main method for conducting this measurement is esophageal manometry. This method is complicated as it requires a skilled technician to prepare the entire setup. However, such a measurement can be more reliable for obstructive and central apnea differentiation [7]. Alternatively, thoracoabdominal belts (either RIP-respiratory inductance plethysmography, PVDF-polyvinylidene fluoride, pneumatic, or piezo) can be applied, since they are sensitive to stretching [8]. A sensor with an impedance output is the PVDF belt. Its signal was compared to a standard RIP belt and found to be of comparable quality for sleep apnea diagnosis [9]. RIP belts also use elastic bands but, unlike the resistive ones discussed earlier, these bands change their inductance when stretched. A traditional way of measuring the elongation of such a band uses it as an inductive element in an LC oscillator. Alternatively, a constant current can be used to measure the inductance of the RIP sensor [10]. Another common technique is impedance pneumography. In this method, either two or four electrodes are attached to the patient’s chest. Then, an AC current is injected through the drive electrodes and the potential difference is measured on the receive electrodes. Respiration causes a change in the chest conductivity, which can be seen on the demodulated signal as a respiratory waveform. This method is accurate, but its implementation requires attaching electrodes to the patient’s body and passing a current through the tissues [11]. OSA/CSA classification is also possible by monitoring the intercostal EMG (electromyogram) [5,12]. Analyzing the ECG (electrocardiogram) can also be an alternative [13]. Another possibility is to employ audio signal [14].
In this work, we present a novel approach to the utilization of resistive belts to measure respiration during an at-home sleep study that could distinguish OSA and CSA in the future. Sensors with resistance output require special signal conditioning circuits to achieve proper performance. Especially, baseline removal and dynamic range increase can be necessary, depending on the sensors’ characteristics. A number of previous works propose different approaches for signal conditioning of various resistive elements in the presence of large, varying offset. The most straightforward approach is to increase the resolution of the ADC (analog to digital converter). A very promising method of unlimited sampling is described in [15]. It presents an ADC that is able to reset itself instead of saturating. In this way, the dynamic range can be extended far beyond the measuring range of a usual converter. This is accomplished at a cost of reduced sampling rate, but in the case of respiration monitoring this is not a problem, since the measured signals have sub-Hz frequencies. However, the use of an external converter has its downsides. Most notably it can increase the cost of the solution by adding additional components and occupying an area of the PCB (printed circuit board). Moreover, supply chain shortages can impact the production of such a design, as a specialized, high-resolution ADC may not be easily replaceable by an alternative part. Therefore, another solution is desirable. The problem of varying initial offset is well known in the field of chemical sensors, where manufacturing tolerances contribute to significant variation in baseline levels between different samples of the same type of sensor. An interesting architecture that aims to compensate for these variations is described in [16]. The method involves an automatic pre-calibration of the output voltage by means of altering the sensor current. During the calibration phase, the sensor current is incrementally increased until the voltage across the sensor reaches the desired level that maximizes the dynamic range. However, this solution does not allow for constant offset tracking and compensation–the calibration phase can only be carried out before the measurement begins. In respiration monitoring, the sensor offset can change multiple times during the night and constant compensation is a must. An elegant attempt to widen the measuring range of the Wheatstone bridge that allows for constant offset compensation is proposed in [17,18,19,20]. It employs one or more VCRs (voltage controlled resistors) to balance the circuit automatically. The VCRs are controlled in a negative feedback manner by dedicated circuitry and bring the output voltage to a level that is within the measuring range of the ADC, which is desired in respiration monitoring. However, this approach has the drawback of using a dedicated multiplier IC that is needed to build a VCR. This specific chip could be hard to replace in the case of supply shortages, hence other options need to be investigated. A method resulting in similar circuit behavior would be to use a digitally controlled signal to realize bridge balancing, either using a ΔΣ modulated resistor [21], a digital potentiometer [22], or a DAC (digital to analog converter) [23]. However, these approaches require additional digital control over the analog circuitry, which could be undesirable as it complicates the software implementation and inserts digital signals in close proximity to the analog signal path. A promising idea is described in the paper dedicated to additive companding [24]. In that work, the authors suggest the insertion of a known offset to the measured signal, which can be realized using comparators. Such an architecture could be adopted to provide an interface between the Wheatstone bridge and an ADC, but an implementation using discrete parts could occupy significant space on a PCB. A method employing external offset control voltages is presented in [25]. This approach utilizes current conveyors and can be used to measure a wide range of resistances, but, unfortunately, the control voltages are not driven automatically. Architectures with digital and quasi-digital output have also been reported [26,27,28,29,30]. They could probably be used for the measurement of resistive stretch sensors with varying offset, but they require a timer peripheral in the MCU (microcontroller unit) instead of an ADC, hence they represent a different class of circuits.
This work describes a new circuit topology for handling resistive belt sensors that was designed specifically to be used during respiratory polygraphy. The architecture implements a balancing scheme that can be realized in a fully analog circuit not requiring external control, using only two operational amplifiers, twelve resistors and two capacitors. The improvement in the dynamic range results from the attenuation of the low-frequency components; however, they can still be measured on the same channel. The architecture is similar to that used in hot-film resistor biasing in the CTD (constant temperature difference) mode [31,32]. However, the purpose of the two setups differs. The CTD is meant to compensate for temperature changes when utilizing a hot-film resistor as a flow sensor, hence it powers the sensor branch from the feedback loop also, which is not the case in the proposed method. The presented topology splits the bridge into two separate resistor dividers. The resistive belt is not currently recommended for sleep apnea diagnosis. However, our design helps to eliminate major difficulties associated with these sensors, such as large offset and insufficient dynamic range. The solution could enable more widespread use of this sensing technique for breath measurement in the future.
This paper is organized as follows: Section 1 presents various methods of collecting the respiration signal. Section 2.1 describes existing topologies and the proposed circuit. Section 3.1 contains the description and results of simulations conducted on the described circuits. Section 3.2 presents data collected with a physical prototype of the circuit. The conclusions and summary are contained in Section 4.

2. Materials and Methods

2.1. Topologies of Signal Conditioning Circuits for Resistive Bands

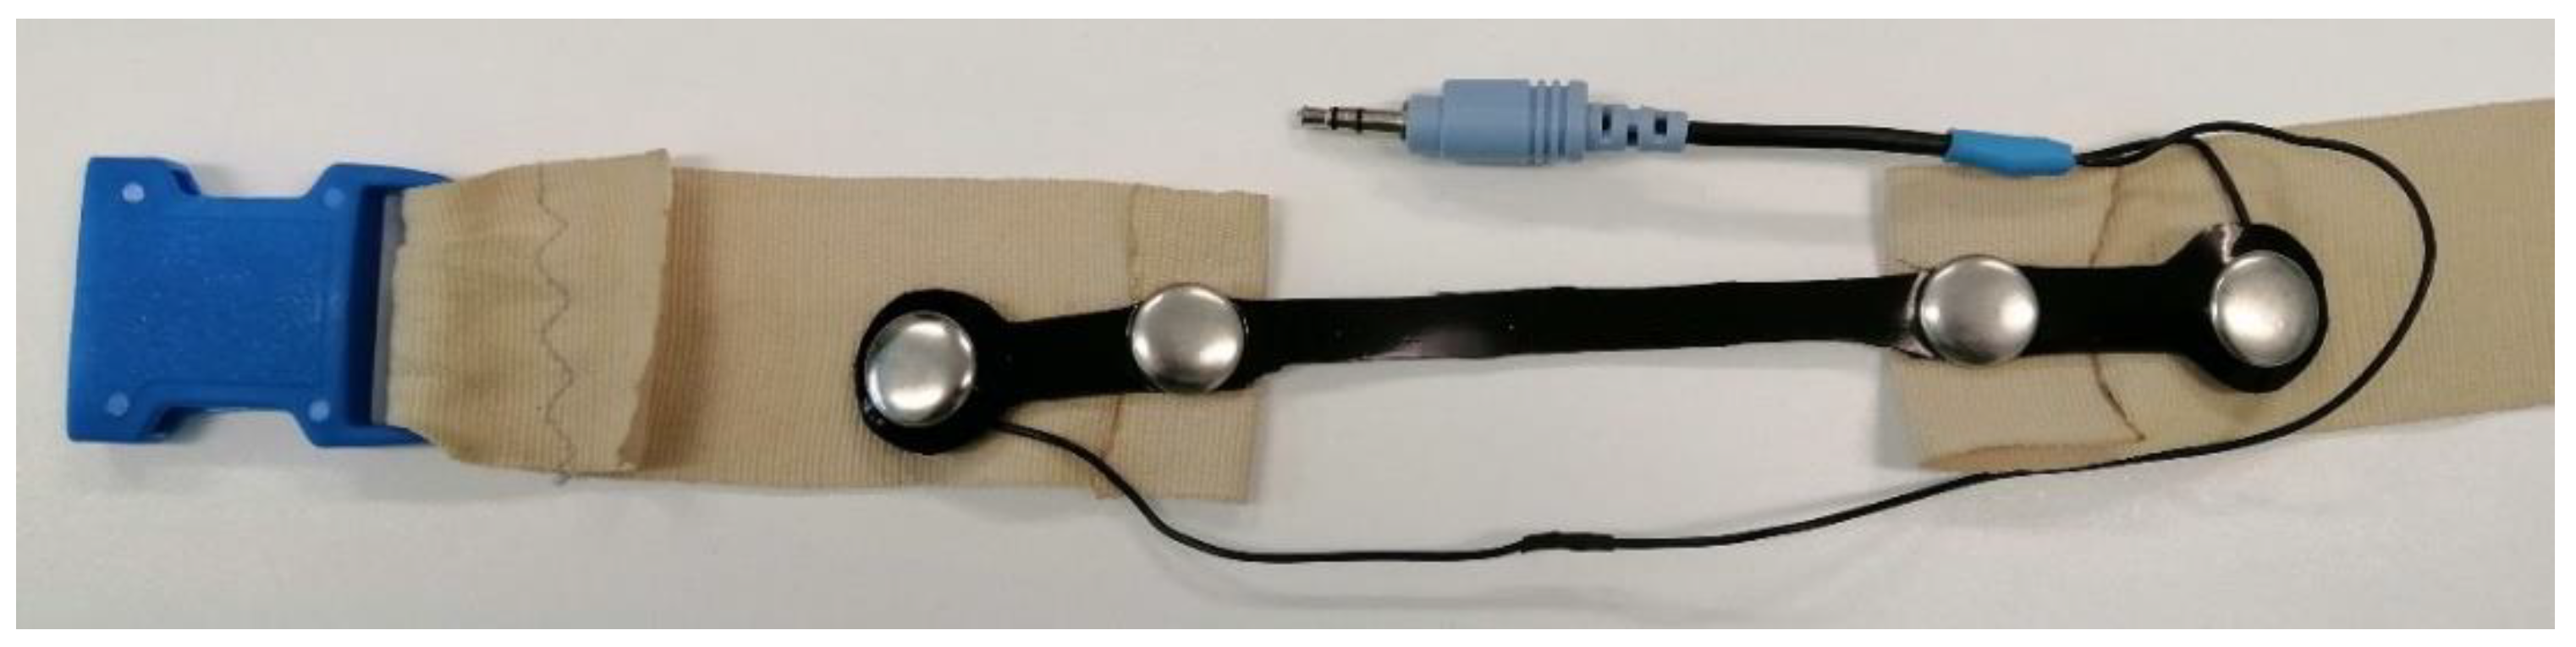
2.1.1. The Prototype of a Resistive Belt

The method used in this work is based on a resistive band, wrapped around the patient’s chest. The belt is made of conductive rubber, which has the property of increasing its resistance when stretched. These changes in resistance can be easily measured utilizing, for example, a Wheatstone bridge circuit and a differential amplifier. Such sensors are nonlinear, and their response also depends on previous stresses that they have been exposed to [12]. The quarter-bridge configuration itself is also nonlinear. These disadvantages, however, do not exclude resistive bands from use as respiration sensors in sleep apnea examination; signal obtained in such a way can be good enough to tell if there was respiratory muscle action, or not. There is no need to calculate tidal volume based on the respiration waveform in such a scenario. In order to evaluate the behavior of the resistive band when applied as a respiration sensor, a prototype was constructed. The material is a carbon-filled silicone normally used for conducting low amperage currents, as well as for electrostatic discharge protection [33]. A stripe of the material was prepared, approx. 190 × 8 × 2 mm. It was then attached to an inextensible textile forming a belt. Plastic devices were sewn in appropriate locations allowing the belt to be put on and taken off, as well as adjusting its length.
The two inner press studs join the rubber strip with the textile belt, while the two outer ones serve as wire terminals. Such an arrangement was found to deliver reliable measurements, because when only two press studs were used (for both joining the belt with strip and wire) the resistance value on the terminals was changing not only due to the strip elongation, but also due to changes in the contact area between the rubber strip and the press stud. The sensor presented in Figure 1 has a resistance of approximately 400 Ω when not stressed. Wrapping the belt around a patient’s chest can raise this value as high as 700 Ω. When the subject is breathing normally, the respiratory waveform of approximately ±10 Ω appears superimposed on the mentioned offset. These observations lead to a conclusion that the useful signal contributes only a few percent of the whole resistance. Moreover, depending on how the belt was initially put on the chest, if it was tight or loose, the offset will change. It varies during the night: it was observed that a patient sleeping on their back can exert different strain on the sensor than when sleeping on their side. This can be due to the fact that the sensing element is short and not enclosing the whole chest.

2.1.2. Standard Differential Amplifier

As previously stated, the Wheatstone bridge is one of the typical circuits used for resistance measurement. Its output can be amplified by a differential amplifier, forming a circuit presented in Figure 2a. An instrumentation amplifier can also be used if a higher CMRR (Common Mode Rejection Ratio) is desired [34]. While the basic Wheatstone bridge is a good method of measuring resistance, when it comes to respiration signal extraction there are certain features of the signal that must be considered. To evaluate the performance of the basic architecture, a circuit consisting of the Wheatstone bridge, followed by a differential amplifier, was constructed in the LTspice software (Analog Devices, Wilmington, MA, USA) as shown in Figure 2a.
The operating principle of such a circuit is as follows: U1 outputs signal that there is a difference between the nodes IN− and IN+, normally amplified by a factor of R3/R4. However, in this case, for the proper calculation of the gain, the impedance of the bridge itself should also be taken into account. IN− is driven by a voltage divider, formed by resistors R2 and R7. Moreover, IN+ is derived from the voltage divider formed by R1 and the stretch sensor, marked on the schematic as R6. Component value selection for such a circuit can be performed as follows: assuming the conductive rubber resistance is not less than 400 Ω, this is the lower limit for the amplifier. The higher limit is assumed to be 750 Ω: 700 Ω of the offset and an additional 50 Ω caused by a deep breath, which can be considered the worst-case scenario. To achieve near 0 V output at 400 Ω and almost 1.8 V at 750 Ω, the component values could be chosen as shown in Figure 2a. This particular circuit outputs a useful signal of no more than 100 mV peak to peak for an assumed ±10 Ω resistance swing. A deep breath, however, would cause a bigger change in the output voltage.
For the circuit to be used in a portable sleep monitoring device, it is preferable that it can be sampled by an internal ADC of a MCU. In this research, the STM32F401 chip has been selected for the final device design, as it features a 12-bit built-in ADC [35]; 12-bit resolution means that 4096 different voltage levels can be distinguished. Such a resolution of the ADC is common among many modern microcontrollers. For the sake of power efficiency, the MCU can be powered from a 1.8 V supply rail, and this often means that the reference voltage of the internal ADC would also be limited to this value. Hence, the 1.8 V reference voltage on the 12-bit ADC gives a resolution of 0.44 mV. The signal conditioning circuit itself can be powered from a higher voltage rail, as long as the voltage at the ADC input does not exceed its reference voltage. In the rest of this paper, the ADC reference voltage is assumed to be 1.8 V, while the analog circuitry supply is set to 3 V.
According to the AASM (American Academy of Sleep Medicine), hypopnea is defined as at least a 30% drop in breath level compared to the level before the episode [8]. Despite the fact that the resistive belts are not mentioned by the AASM as recommended sensors for apnea detection, the hypopnea criterion can still be used to assess the necessary accuracy of the system. Sampling signal produced by a circuit from Figure 2a (100 mV peak to peak) with the aforementioned ADC gives a range of 228 different codes. For hypopnea detection, 30% of 100 mV is 30 mV which results in the range of 68 digital values that differentiate the hypopnea condition from normal breathing. This does not account for noise that can be present in the system. Unfortunately, such a small signal can be seriously disturbed by a moderate noise, for example, during radiated radio frequency electromagnetic field immunity tests. Therefore, it is desirable to increase the dynamic range of the signal to make it less susceptible to such a disturbance.

2.1.3. Conventional Methods of Increasing the Dynamic Range of the Signal

There are methods available to overcome the problems discussed above. One of them is to increase the resolution of the ADC. In this way, more precise data can be created without altering the signal conditioning circuit itself. This modification, however, does not improve the susceptibility to interference of the circuit and can raise the final cost of the solution.
To prevent a disturbance from being injected into the signal, some common methods of PCB design can be adopted. Routing short traces, placing the circuit away from any high-current paths and using proper shielding are all good practices. However, the signal itself can also be made less vulnerable to a noisy environment. Increasing the amplitude of the signal can help to improve the SNR (Signal to Noise Ratio) if the disturbance is being injected into the signal path after the amplifier stage. However, during the design of the signal path, it turned out that simple amplification of the signal from the resistive belt would require increasing the reference voltage of the ADC. That is often unacceptable in portable devices due to power efficiency reasons, as discussed earlier. Therefore, some kind of signal processing must be used in order to satisfy all of the requirements. As the DC offset of the respiration signal only carries information about the belt stretch in an idle condition (when the patient is not breathing), it is of limited use in the sleep apnea diagnosis. This offset, however, is the main cause of problems when increasing the gain of the signal conditioning circuit. If there was no DC offset, or this offset was constant, the signal could easily be moved along the voltage axis to fit the needs of the ADC input. A simple method of removing the offset is to use a high-pass filter. This should result in a waveform with a near-zero DC component, which can be then positioned in the middle of the measuring range to maximize the dynamic range. The schematic in Figure 2b shows an implementation of this idea that was designed for use with the discussed sensor.
The differential amplifier stage works as in the basic setup, but the signal is then high-pass filtered and positioned in the middle of the measuring range by C1, R9, and R10. Since the circuit is meant to be implemented in a portable device and sampled directly by the ADC, component values for this high-pass filter were chosen based on their physical size and the output impedance of the circuit. Capacitors with a nominal capacitance of 47 uF are widely available in the 0805 package. Resistors R9 and R10 were calculated to obtain a cut-off frequency of 0.05 Hz and position the output signal in the measuring range of the ADC. However, as resulted from the simulations of the circuit, such a topology can introduce a significant phase shift, which can be potentially misleading in the apnea scoring.

2.1.4. Proposed Low-Frequency Feedback Topology

To address the limitations of basic architectures, a new circuit for resistive belt signal conditioning has been proposed. The idea is to dynamically obtain the signal offset and use it to alter the IN− branch. In this way, the DC component of the signal can be strongly attenuated, allowing for higher gain configurations without changes in the ADC-related circuitry. The proposed circuit is shown in Figure 3.
The previous simple differential amplifier configuration has been changed to include a second-order low-pass filter, formed by C1, R10, C2, and R11. The filter characteristic should block the respiration signal, passing only DC offset to the next stage. Then, the non-inverting amplifier U2 is utilized to form the feedback signal that supplies the IN− branch of the differential amplifier stage. With the assumption that R 3 = R 8 , R 4 = R 5 , and substituting R s = R 3 + R 4 the DC component of the output signal (i.e., the signal offset) is given as in Equation (1).
V D C = V 1 R 6 R 3 R s R 2 R 7 + R s R 2 + R 7 R 4 R 2 R s + R 4 R 7 R s + R 2 + R 3 R 7 1 + R 9 R 12 R s + R 2 R 1 R 6 + R s R 1 + R 6
The component values in Figure 3 are calculated using Equation (1) to satisfy the requirements of the sensor described in Section 2.1.1. Low-pass filter formed by C1, C2, R10, and R11 is designed to block the respiration signal. The derivation of the Equation (1) is presented in Appendix A.

3. Results

3.1. Simulation Results of Different Circuits

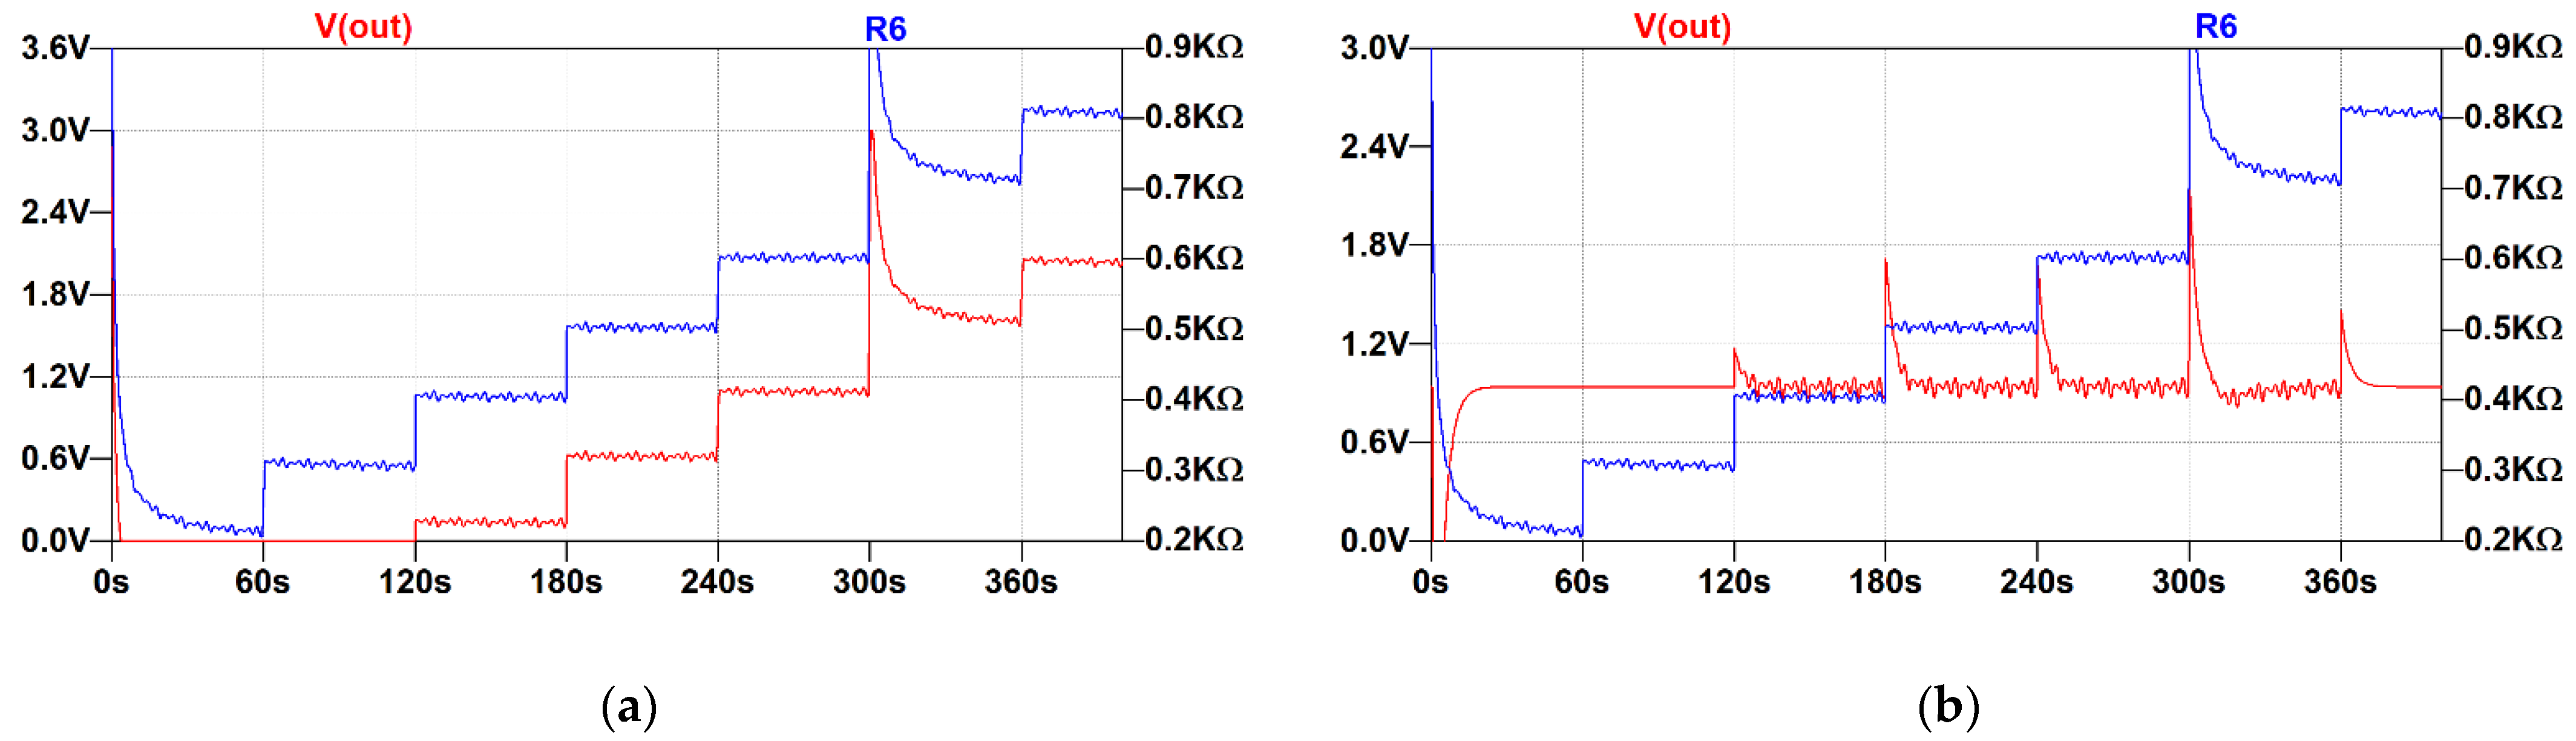
3.1.1. Simple Differential Amplifier

To test how different topologies handle the real-world resistive belt, a number of simulations were carried out. The sensor was represented using a resistor with an arbitrary value of resistance that was the sum of a few components:
  • An initial offset of 200 Ohm.
  • A 0.3 Hz sine wave multiplied by a sawtooth signal. Sawtooth amplitude was 10 Ohm and its period was 10 s.
  • A 100 Ohm step every 60 s, which was added to the initial offset.
  • An 800 Ohm spike at the beginning and after 30 s of the simulation.
The former two factors correspond to the idle resistance of the belt and a normal breathing action of varying amplitude. The latter two were introduced to simulate the real-world respiration measurement conditions that were discussed earlier. An example of a simulation made with the circuit presented in Figure 2a (simple differential amplifier) is shown in Figure 4a. The blue trace represents the resistance changes and the red one corresponds to the output produced by the circuit. This graph summarizes the problem: the more the belt is stretched, the bigger the offset generated at the amplifier input. Eventually, the dynamic range turns out to be too low to accommodate these changes and the amplifier saturates the input of the ADC. Additionally, if the tension of the belt is too weak, the lower bound could be reached. A similar situation can occur after the patient has changed position; the belt that would have previously been tight became loose. Due to the manufacturing tolerance of the conductive rubber belt, its resistance can become too low to be correctly represented by the circuit. The amplifier circuit can be reconfigured to have a wider measuring range, but this means lowering the amplitude of the recorded respiration waveform. Similar results have been observed in different publications: for example in [36], there is a plot that shows exactly the same behavior (respiratory waveform superimposed on a variable offset). The conclusion is that sampling the output of such a stretch sensor can be problematic, and improving this signal, as proposed in this paper, can certainly be beneficial to many applications that rely on this measurement method.

3.1.2. Differential Amplifier with a High-Pass Filter

An approach involving high-pass filtering of the respiration signal was simulated. For this purpose, the circuit presented in Figure 2b was used. The sensor resistance used for this evaluation is identical as described in Section 3.1.1. Figure 4b contains the results of this simulation in the entire measurement range. An enlarged fragment of the two waveforms (the sensor resistance and the signal after high-pass filtering, blue and red traces, respectively) in the time domain is presented in Figure 4c. One of the drawbacks of this approach is the phase shift. The main component of the simulated signal is of 0.3 Hz, which is in the range of normal human breathing. For the used RC component values, the phase shift is about 10 degrees at this frequency, and such a circuit can still need buffering of its output before it can be sampled by an ADC. This is due to high resistance values used in the filter, which are needed to achieve a low cutoff frequency when put together with a reasonably sized ceramic capacitor. Figure 4d shows a graph from an AC analysis of such a circuit. While the phase shift can be reduced by a further increase in the filter resistance values, another limitation is the lack of possibility to increase the gain in the first amplifying stage. The differential amplifier operates on a signal with an offset, and it must not exceed the supply voltage range. Additional gain, however, can be added in the second stage, but this configuration can have worse noise figures. The information about the belt stretch is completely lost from the signal. It does not pose a significant problem in the apnea detection itself, but if such information was needed for other purposes (for example, checking the integrity of the system), this topology would need another ADC channel just for that purpose.

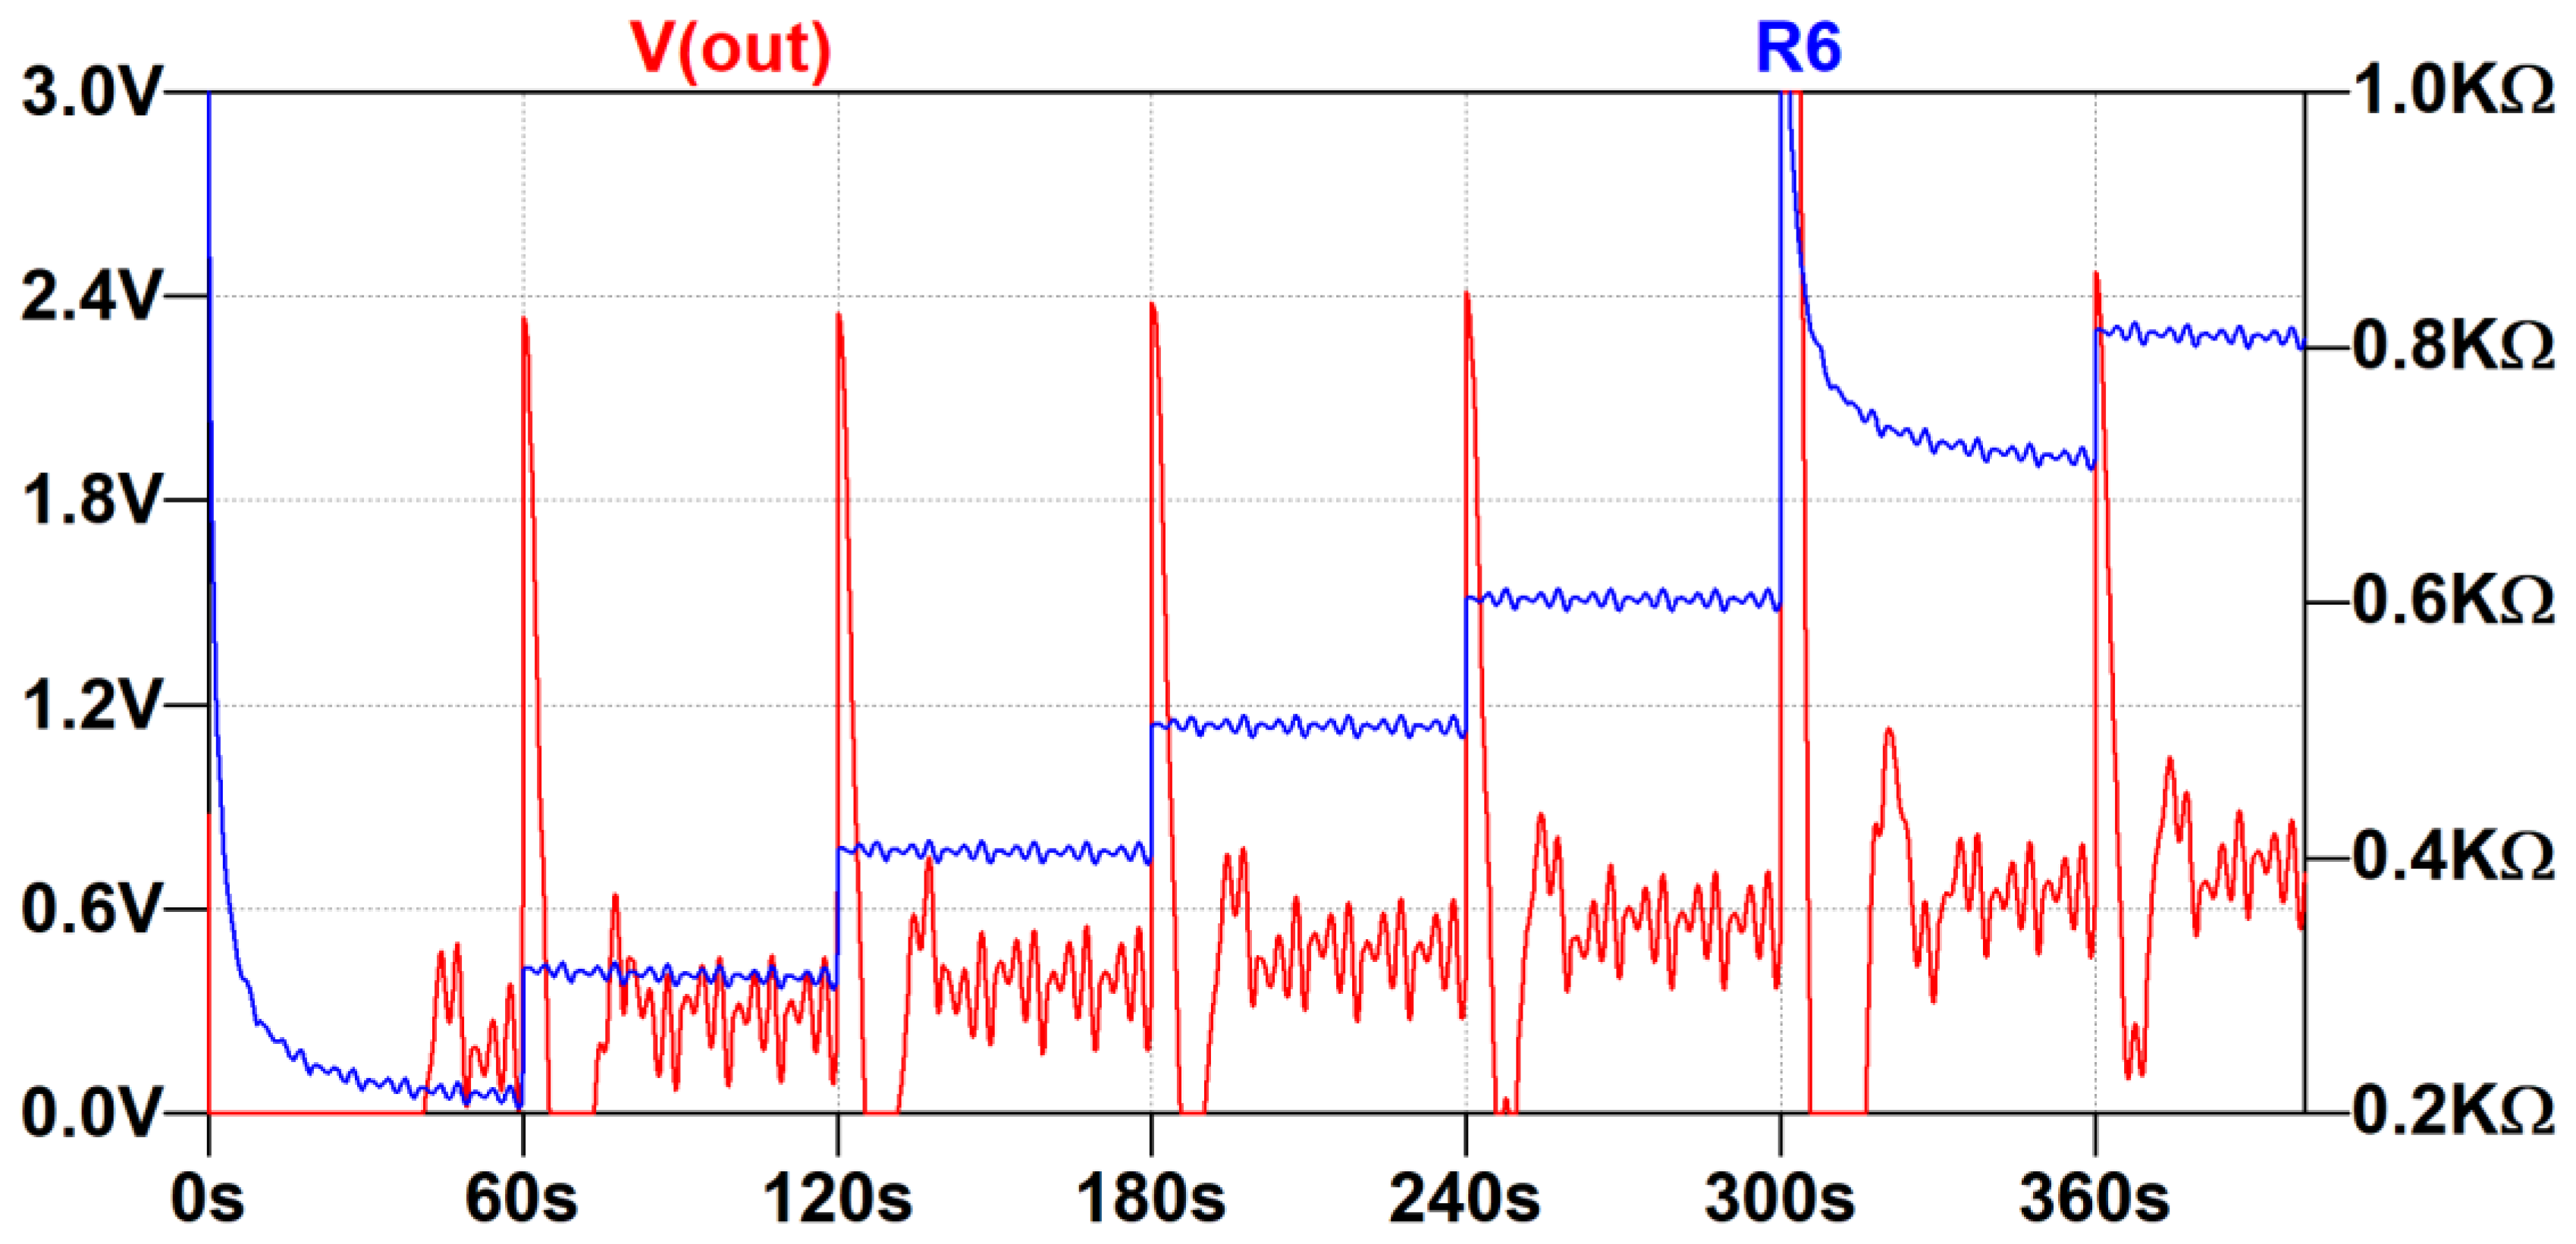
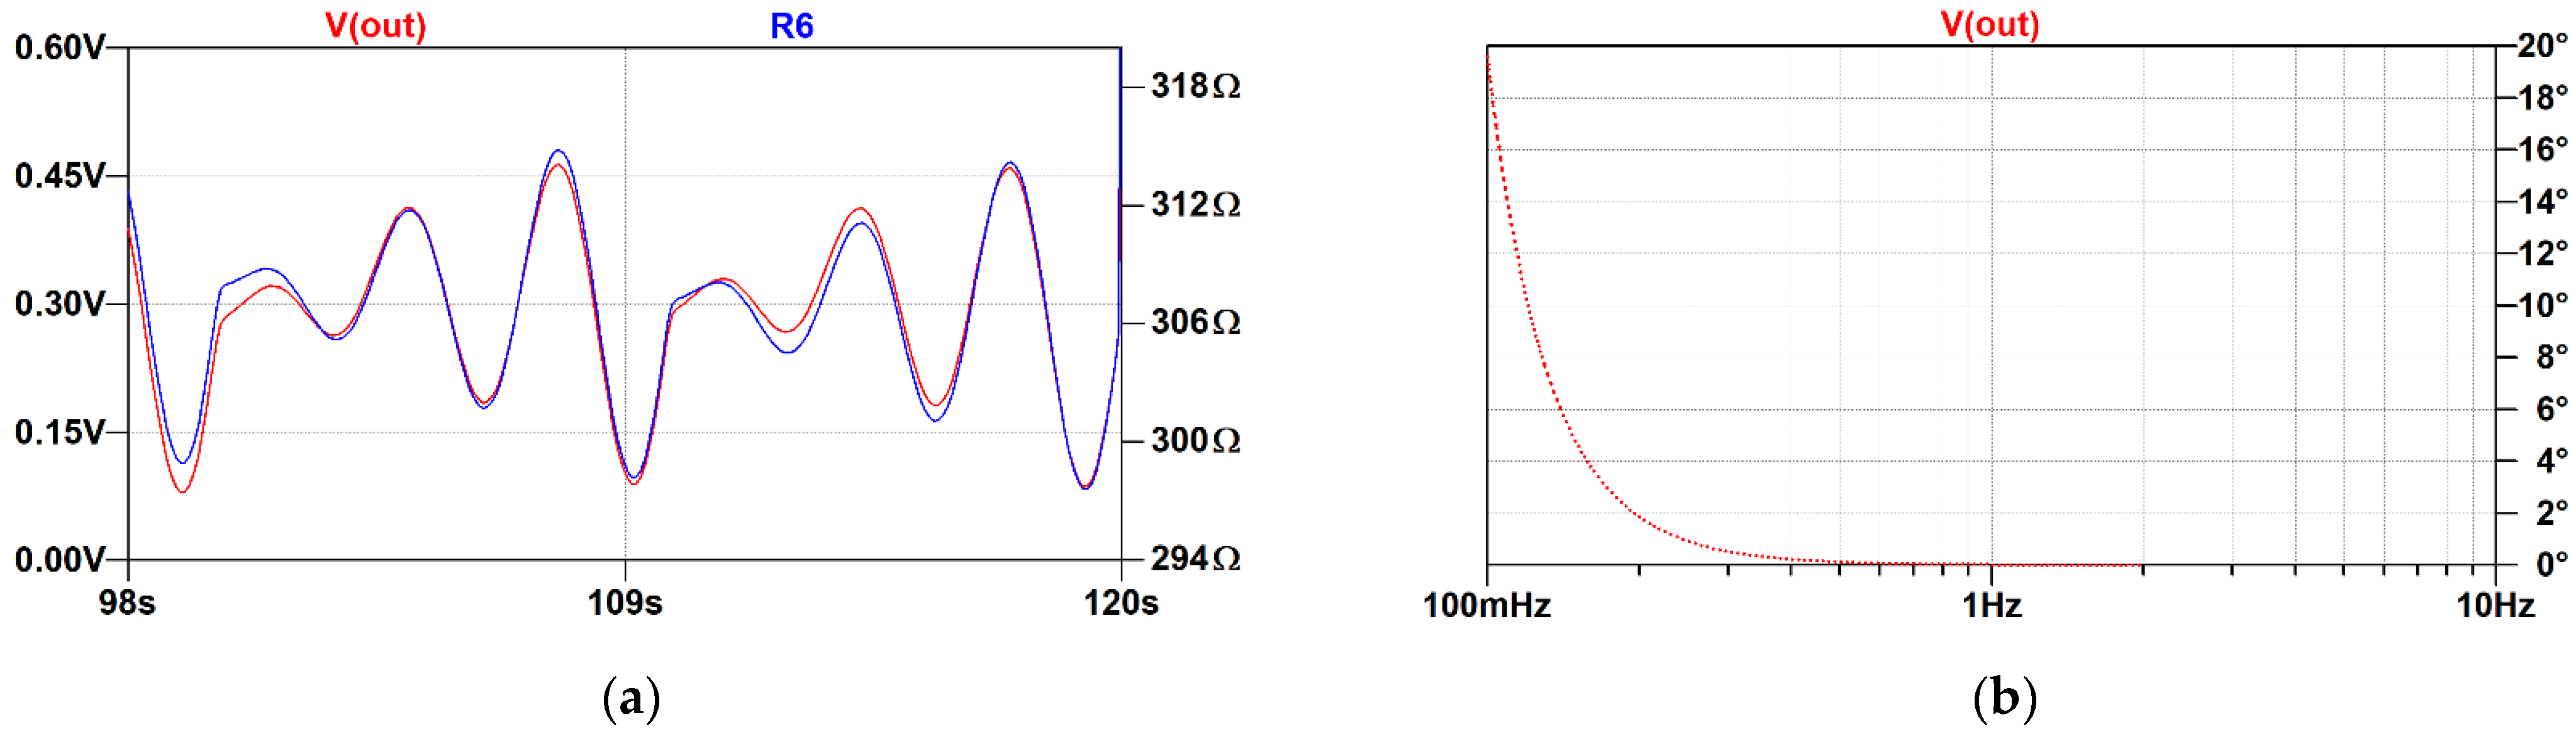
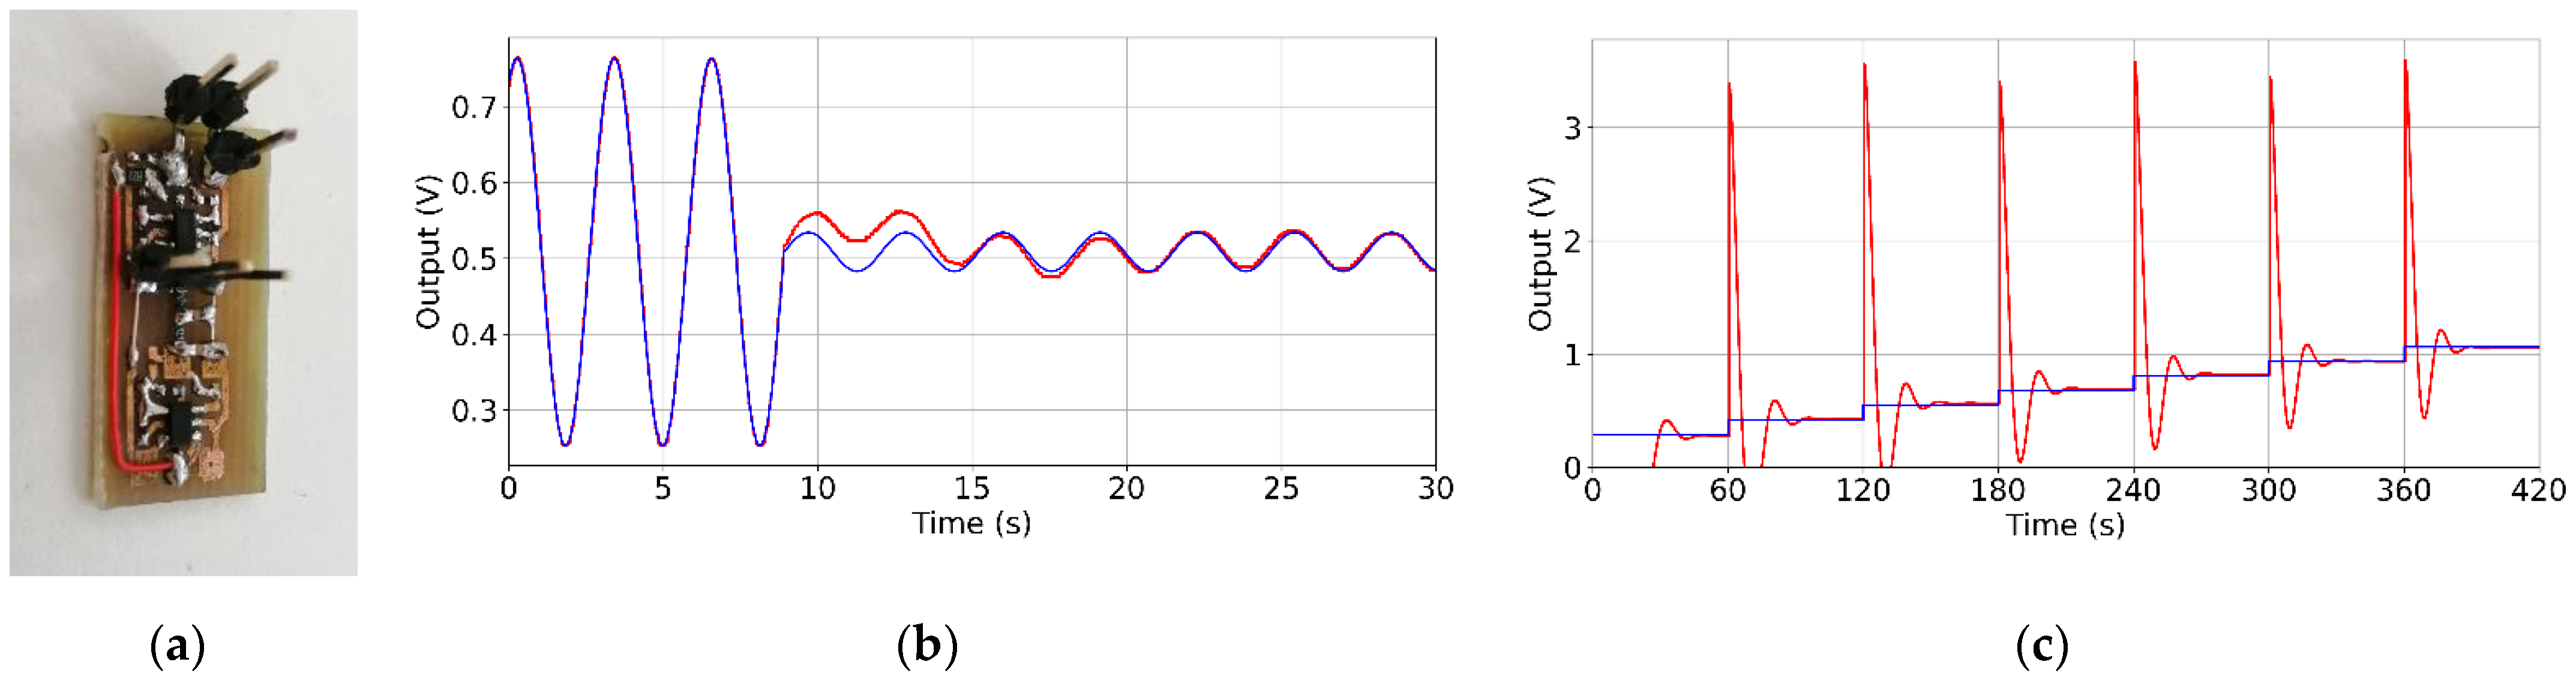
3.1.3. Proposed Low-Frequency Feedback Topology

The proposed low-frequency feedback topology has also been simulated using the LTspice software. The sensor was represented by a resistor, the same as was used in the simulations of the circuits in Section 3.1.1 and Section 3.1.2. The output from the simulation is shown in Figure 5. The blue trace represents the resistance changes and the red one is the output produced by the circuit.
A few observations can be made from this graph, as follows:
  • The improved architecture can correctly represent small changes in the resistance in presence of the offset ranging from 200 Ohm to 800 Ohm and possibly above. In such limits, the output stays well below 1.8 V, thus allowing measurement by an internal ADC of an MCU. This does not account for artifacts generated by rapid movement, and, in this case, the limits of the ADC must be observed.
  • The offset is not completely removed from the signal, but it is significantly attenuated compared with the signal of interest. This feature can be used to extract information about the strain of the respiratory belt if such data are needed.
  • The circuit does not exhibit parasitic oscillations or positive feedback under such conditions.
  • When a rapid change in resistance occurs, the circuit needs a few tens of seconds to converge and establish a new operating point. Compared to the duration of the entire examination (a few hours), these artifacts are negligible. Furthermore, the occurrence of the apnea event during position change is unlikely.
An enlarged part of the same graph is presented in Figure 6a. This figure shows that no significant phase shift is introduced to the signal by the proposed circuit. Also visible on the graph are slight nonlinearities around resistance discontinuity points, for example at 110 s. They are inherent in such configuration, but as was mentioned before, they do not pose a serious problem in sleep apnea detection. Nevertheless, these nonlinearities are probably the main drawback of the presented architecture. Additionally, a phase analysis graph obtained from LTspice is presented in Figure 6b. The plot confirms that the proposed circuit does not introduce any significant phase shift into the signal. At 0.3 Hz, the phase shift is about 0.5 degrees. This can be further reduced by changing the RC values in the low-pass filter.
These observations can lead to a conclusion that the proposed circuit is suitable for apnea detection and differentiation applications.

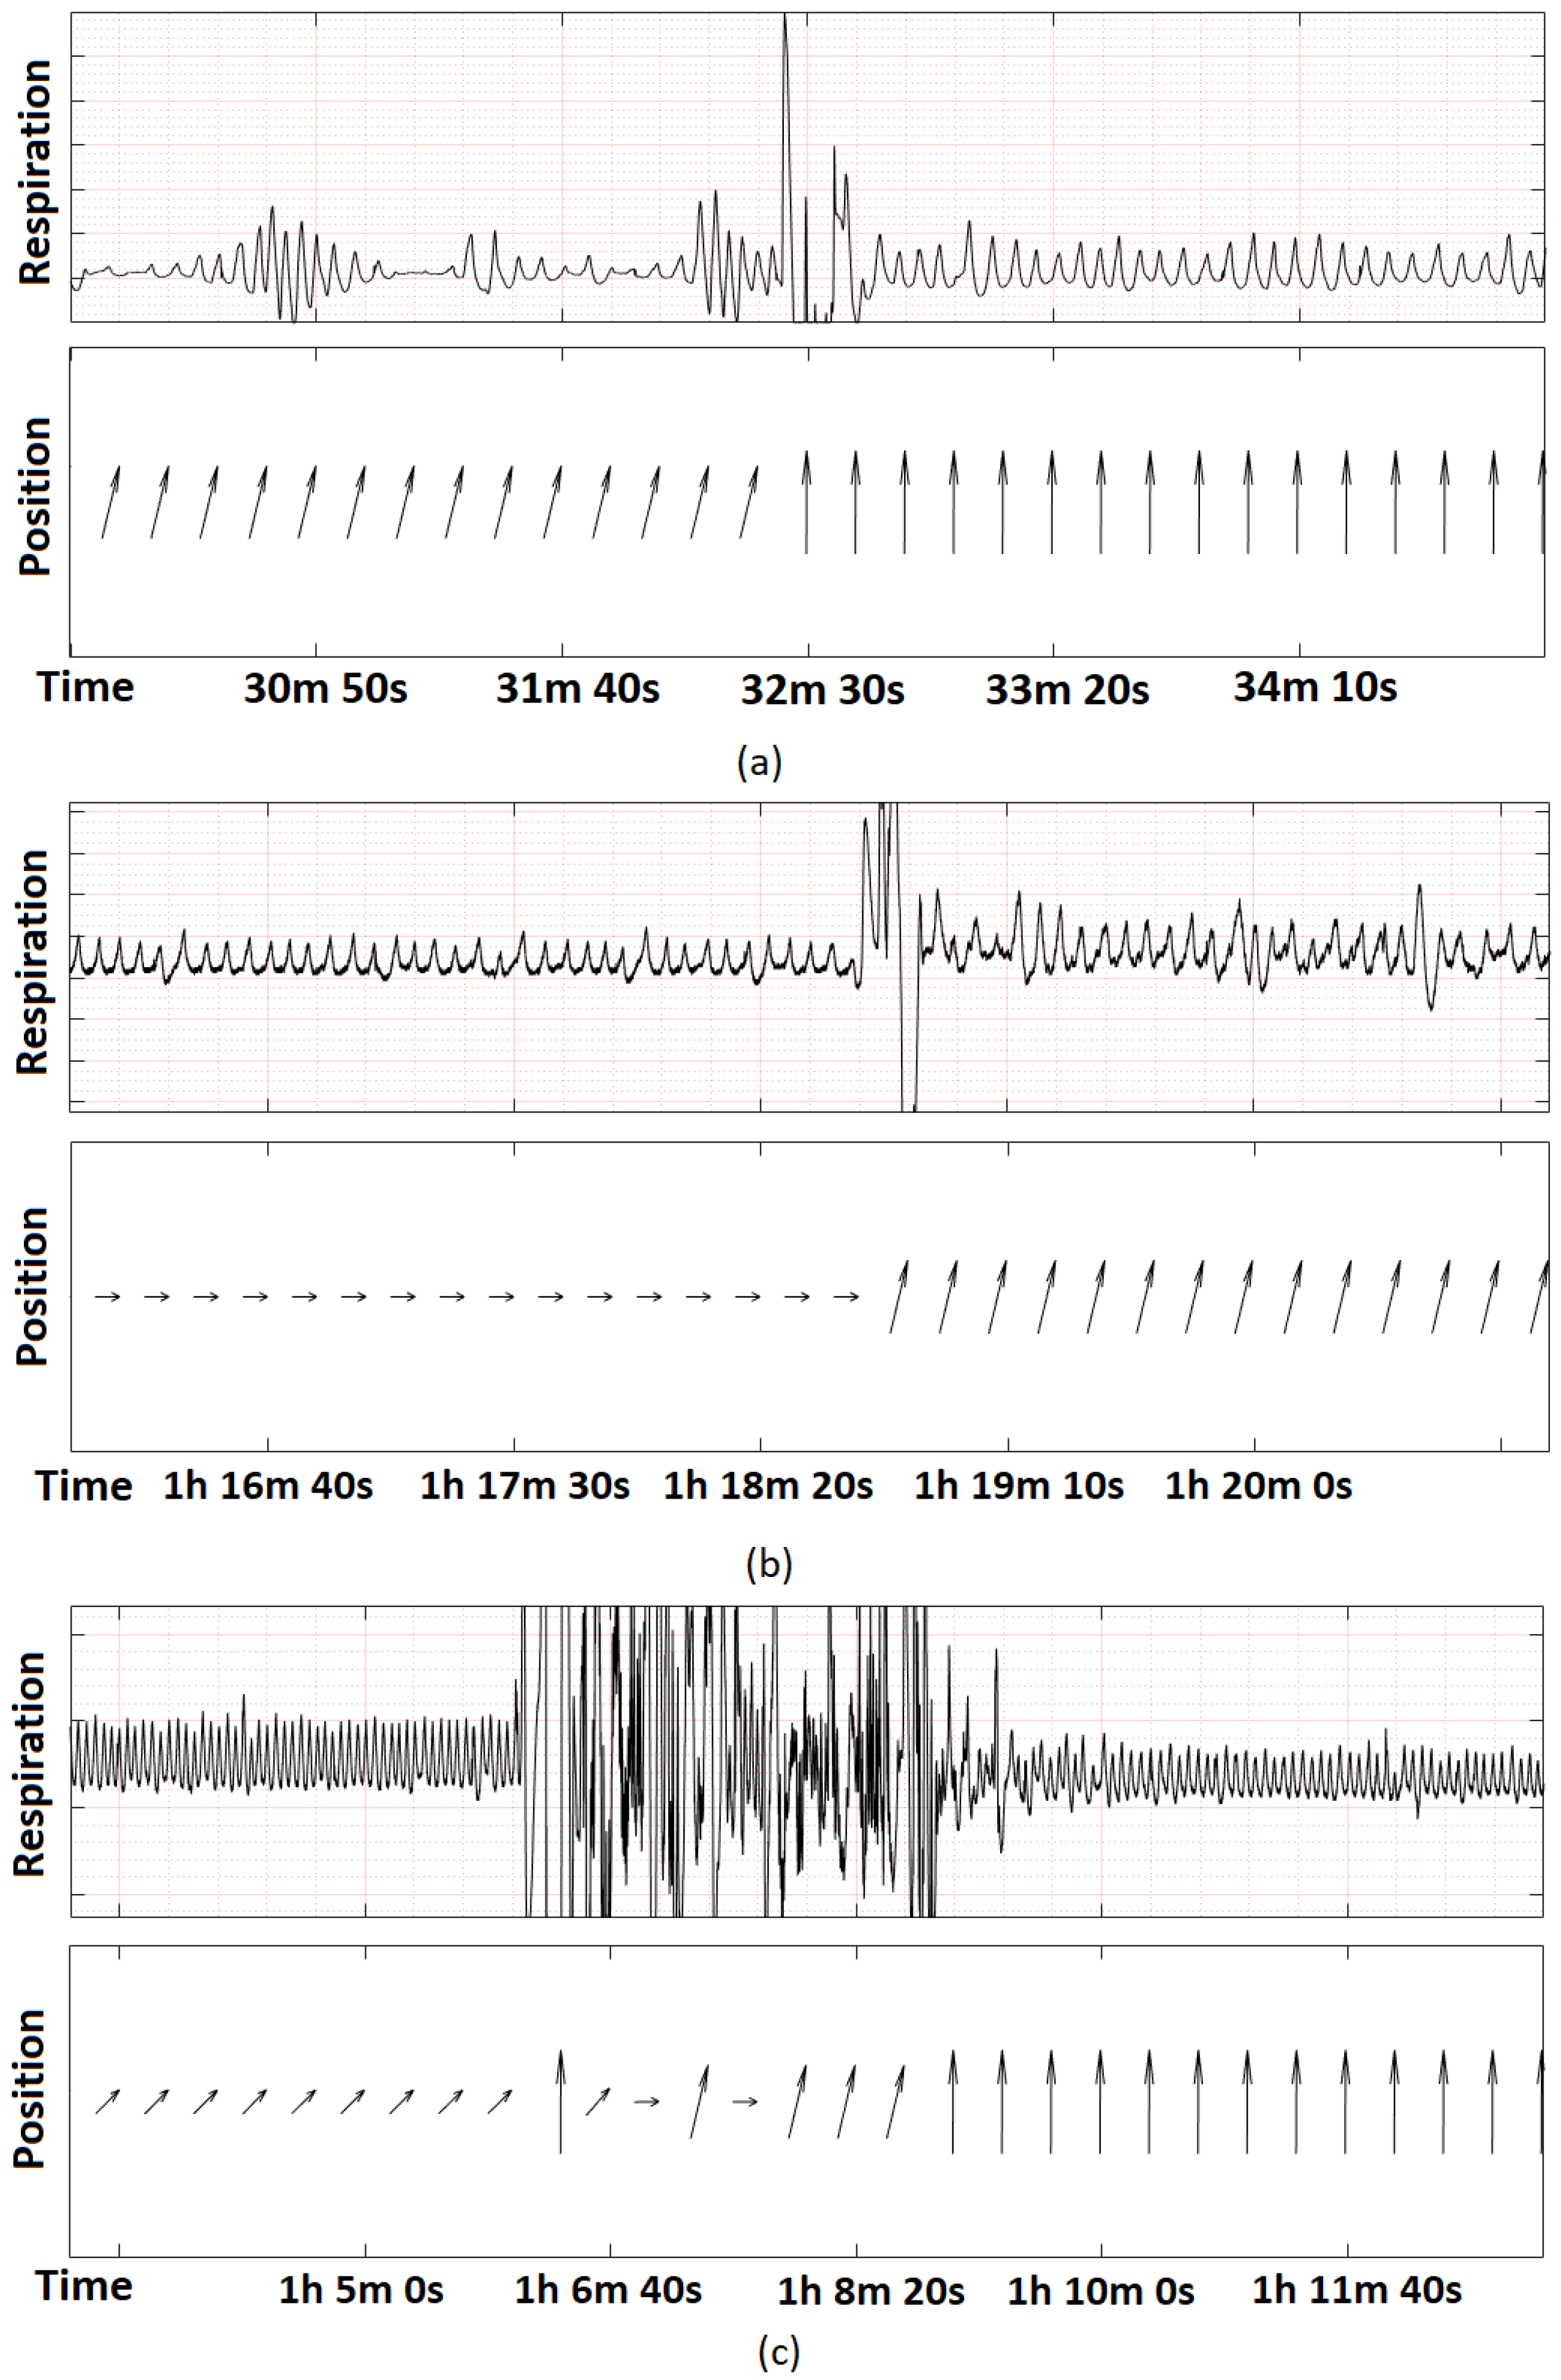
3.2. Evaluation of the Low-Frequency Feedback Prototype

The architecture described in this paper was physically built and evaluated. Figure 7a shows a prototype used for measurements of real signals.
For the generation of arbitrary resistance, an AD8400 digitally controlled variable resistor was used [37]. To increase the resolution in breath-like signal generation, the variable resistor was connected in parallel with a 100 Ohm resistor and then in series with a 330 Ohm resistor. An appropriate equation was used to convert the nonlinear resistance characteristic of such a setup to code values for the AD8400. Two test scenarios were prepared. The first one consists of a 0.33 Hz sine waveform with 410 Ohm offset. The resistance swing is initially 20 Ohm peak to peak, which then reduces to 2 Ohms. The response of the circuit, as recorded by an Analog Discovery 2 USB oscilloscope (Digilent, Pullman, WA, USA), is presented in Figure 7b. The red trace represents the measured output. The blue line is an analytically generated sine wave of the same properties as the input signal, aligned to the output. A comparison of the output with an analytically generated curve reveals a good agreement between signal amplitudes in both parts of the waveform. Low-frequency variation of the signal offset beginning at the resistance discontinuity point is also visible. This scenario mimics the beginning of an apnea, which is defined as a 90% reduction in airflow [8]. To score the apnea, the airflow reduction must be present in the nasal cannula signal, nevertheless, the same scenario was used to assess the performance of the resistive belt sensor. In the second scenario, the input resistance is stepped from 200 Ohm to 800 Ohm in 100 Ohm steps. Each resistance value is held for 60 s. The result of this evaluation is shown in Figure 7c. The output of the signal is plotted as the red line, and an analytical representation of the input signal is blue. After each abrupt change of resistance, the circuit oscillates for approximately 40 s, and then converges to a new DC value. This feature can be used to extract resistance offset from the signal by digital low-pass filtering of the sampled waveform.
To further evaluate the performance of the circuit from Figure 3 in real working conditions, it was incorporated into the prototype of a respiratory polygraph called Comarch PulmoVest. The system was validated on patients suspected of sleep apnea. The resistive element itself was sewn into a larger belt, but the sensor dimensions and properties remained the same. The device, among other sensors, has an embedded accelerometer for recording patient body position. Figure 8 shows excerpts from signals recorded by three different people. Respiration waveforms are at the top, and associated signals showing patients’ positions based on accelerometer recordings are at the bottom of each graph.
The above graphs show moments when the patients changed their positions during sleep. In the first two cases (Figure 8a,b), the position changes caused the respiration graphs to be unreadable due to the settling time of the RC filter. In both cases, this took almost 30 s, but eventually the circuit converged to a state where the device was able to sample the respiration signal correctly again. In Figure 8c, there are heavy motion artifacts present, after which the circuit establishes a new operating point and respiration is recorded correctly again.
The above results indicate that the proposed architecture is suitable for recording human respiration signals. The resistive belt with this circuit could be used wherever there is a need for collecting information about breath rate and amplitude. The possible areas of interest include respiratory polygraphs as well as smart fitness garments, training progress tracking devices, and wearable sensors. The presented solution offers a simple yet reliable way of collecting respiration data in an uncontrolled environment.

4. Discussion

There are a few methods of measuring human respiration. One of the most portable setups is to measure the elongation of the belts wrapped around patients’ bodies. The output of the belt can be resistive or inductive, and the two require different signal conditioning circuits. Such a sensor can be suitable for sleep apnea type differentiation. While sensors with inductive output are an industry standard, this work investigated the use of a resistive band as a respiratory effort sensor. However, existing signal conditioning circuits for such devices have drawbacks, such as an inability to set a high gain due to varying signal offset (in a simple differential amplifier) and the introduction of the phase shift (when a high-pass filter is utilized). To remedy these problems, a novel low-frequency feedback topology was designed and tested, both in the simulation environment as well as the real prototype realization, as presented in this paper. The performance has been compared to well-established methods of measuring resistance with similar complexity. This work contributes to the knowledge about resistive respiration sensors by analyzing the influence of offset attenuation on the quality of the signal and its ability to be sampled by a general purpose ADC. The emphasis is on the parameters crucial for sleep apnea diagnosis and optimization of the topology for this specific task. The main findings of the evaluation are that the new setup enables higher gains in the band of interest, thus facilitating further sampling by an ADC and improving noise figures. Additionally, the proposed architecture does not remove the DC offset from the signal completely, so, if needed, the belt stretch length can be calculated from the collected data. The main drawback is the nonlinear behavior of the circuit around resistance discontinuity points (for example, peaks introduced by the patient when changing position); however, in the case of the investigated use, these artifacts are negligible. Nevertheless, future improvement in the output in such circumstances could be valuable. The resistive sensing element itself needs to be tested for durability, as this work does not cover this issue. Degradation of the parameters of the belt caused by wear and washing could have an impact on the recording performance. The ratio of OSA and CSA episodes that are correctly identified with this technology and RIP belts should also be assessed in the future. Such direct comparison would enable a more informed choice of the solution used in new devices. The proposed circuit can spread the use of resistive belts in sleep apnea detection and differentiation, as well as build inexpensive and available apnea measurement devices. Moreover, it can be used in other electronic setups that require similar measurements to the stretch bands.

5. Patents

Comarch S.A. holds the patent for the presented technology (Pat.239483, UPRP, Kraków, Poland).

Author Contributions

Conceptualization, J.D.; methodology, J.D.; software, J.D.; validation, J.D.; formal analysis, J.D.; investigation, J.D.; data curation, J.D.; writing—original draft preparation, J.D.; writing—review and editing, B.C.; visualization, J.D.; supervision, B.C.; project administration, B.C. All authors have read and agreed to the published version of the manuscript.

Funding

The APC was funded by AGH University of Science and Technology in Krakow, grant number 16.16.230.434.

Institutional Review Board Statement

The study was conducted in accordance with the Declaration of Helsinki, and approved by the Bioethics Commission at the Regional Chamber of Physicians and Dentists in Kraków (Approval ID: 147/KBL/OIL/2020, issued 14 July 2020).

Informed Consent Statement

Informed consent was obtained from all subjects involved in the study.

Data Availability Statement

Not applicable.

Acknowledgments

The presented results are part of PhD research at the AGH University of Science and Technology, Krakow, Poland. The PhD was carried out in cooperation with Comarch S.A., Kraków, Poland. The presented data in Figure 8 were collected in a medical experiment approved by the Bioethics Commission at the Regional Chamber of Physicians and Dentists in Kraków. Approval ID: 147/KBL/OIL/2020, issued 14 July 2020.

Conflicts of Interest

Jakub Drzazga reports a relationship with Comarch S.A. that includes: employment. Equipment and supplies were provided by Comarch S.A.

Appendix A

The derivation of the Equation (1). Component designators from Figure 3 are used, along with the following assumptions: R 3 = R 8 , R 4 = R 5 and R s = R 3 + R 4 .
The output voltage of U 1 is given as:
V o u t = R 3 R 4 V I N + V I N
V I N + can be derived by treating R 1 ,   R 5 ,   R 6 and R 8 as a voltage divider:
V I N + = V 1 R 1 + 1 1 R 6 + 1 R s 1 1 R 6 + 1 R s
Simplifying the above equation:
V I N + = V 1 R 6 R s R 1 R s + R 6 + R 6 R s
V I N can be obtained by analyzing I R 2 :
I R 2 = V F B V I N R 2 = V I N V o u t R s + V I N R 7
Solving (A4) for V I N :
V I N = V o u t R s + V F B R 2 R 2 R 7 R s R 7 R s + R 2 R 7 + R s
Substituting V I N + and V I N in (A1) with (A3) and (A5) and simplifying:
V o u t = V 1 R 6 R 3 R s R 7 R s + R 2 R 7 + R s R 1 R 6 + R s + R 6 R s R 4 R 7 R s + R 2 R 7 + R s + R 2 R 7 R 3 V F B R 7 R 3 R s R 4 R 7 R s + R 2 R 7 + R s + R 2 R 7 R 3
Assuming the DC voltage the formula for the noninverting amplifier U 2 is as in (A7):
V F B = V o u t 1 + R 9 R 12
Substituting V F B in (A6) with (A7) and simplifying:
V D C = V 1 R 6 R 3 R s R 2 R 7 + R s R 2 + R 7 R 4 R 2 R s + R 4 R 7 R s + R 2 + R 3 R 7 1 + R 9 R 12 R s + R 2 R 1 R 6 + R s R 1 + R 6
which is the Equation (1).

References

  1. Nicolò, A.; Massaroni, C.; Schena, E.; Sacchetti, M. The Importance of Respiratory Rate Monitoring: From Healthcare to Sport and Exercise. Sensors 2020, 20, 6396. [Google Scholar] [CrossRef] [PubMed]
  2. Drzazga, J.; Cyganek, B. An LSTM Network for Apnea and Hypopnea Episodes Detection in Respiratory Signals. Sensors 2021, 21, 5858. [Google Scholar] [CrossRef] [PubMed]
  3. Lee, W.; Nagubadi, S.; Kryger, M.H.; Mokhlesi, B. Epidemiology of obstructive sleep apnea: A population-based perspective. Expert Rev. Respir. Med. 2008, 2, 349–364. [Google Scholar] [CrossRef] [PubMed] [Green Version]
  4. Stewart, S.A.; Penz, E.; Fenton, M.; Skomro, R. Investigating Cost Implications of Incorporating Level III At-Home Testing into a Polysomnography Based Sleep Medicine Program Using Administrative Data. Can. Respir. J. 2017, 2017, 1–7. [Google Scholar] [CrossRef]
  5. Berry, R.B.; Budhiraja, R.; Gottlieb, D.J.; Gozal, D.; Iber, C.; Kapur, V.K.; Marcus, C.L.; Mehra, R.; Parthasarathy, S.; Quan, S.F.; et al. Rules for Scoring Respiratory Events in Sleep: Update of the 2007 AASM Manual for the Scoring of Sleep and Associated Events. J. Clin. Sleep Med. 2012, 8, 597–619. [Google Scholar] [CrossRef] [Green Version]
  6. Zhou, X.; Lu, Q.; Li, S.; Pu, Z.; Gao, F.; Zhou, B. Risk factors associated with the severity of obstructive sleep apnea syndrome among adults. Sci. Rep. 2020, 10, 1–6. [Google Scholar] [CrossRef]
  7. Kushida, A.C.; Giacomini, A.; Lee, M.K.; Guilleminault, C.; Dement, W.C. Technical protocol for the use of esophageal manometry in the diagnosis of sleep-related breathing disorders. Sleep Med. 2002, 3, 163–173. [Google Scholar] [CrossRef]
  8. Berry, R.B.; Quan, S.F.; Abreu, A.R.; Bibbs, M.L.; DelRosso, L.; Harding, S.M.; Mao, M.; Plante, D.T.; Pressman, M.R.; Troester, M.M.; et al. The AASM Manual for the Scoring of Sleep and Associated Events: Rules, Terminology and Technical Specifications; V2.6; American Academy of Sleep Medicine: Darien, IL, USA, 2020. [Google Scholar]
  9. Koo, B.B.; Drummond, C.; Surovec, S.; Johnson, N.; Marvin, S.A.; Redline, S. Validation of a Polyvinylidene Fluoride Impedance Sensor for Respiratory Event Classification during Polysomnography. J. Clin. Sleep Med. 2011, 7, 479–485. [Google Scholar] [CrossRef] [Green Version]
  10. Zhang, Z.; Zheng, J.; Wu, H.; Wang, W.; Wang, B.; Liu, H. Development of a Respiratory Inductive Plethysmography Module Supporting Multiple Sensors for Wearable Systems. Sensors 2012, 12, 13167–13184. [Google Scholar] [CrossRef] [Green Version]
  11. Gupta, A.K. Respiration Rate Measurement Based on Impedance Pneumography; Texas Instruments: Dallas, TX, USA, 2011; Available online: https://www.ti.com/lit/an/sbaa181/sbaa181.pdf (accessed on 25 July 2022).
  12. Berry, R.B.; Ryals, S.; Girdhar, A.; Wagner, M.H. Use of Chest Wall Electromyography to Detect Respiratory Effort during Polysomnography. J. Clin. Sleep Med. 2016, 12, 1239–1244. [Google Scholar] [CrossRef] [Green Version]
  13. Gubbi, J.; Khandoker, A.; Palaniswami, M.S. Classification of sleep apnea types using wavelet packet analysis of short-term ECG signals. Int. J. Clin. Monit. Comput. 2011, 26, 1–11. [Google Scholar] [CrossRef]
  14. Hummel, R.; Bradley, T.D.; Packer, D.; Alshaer, H. Distinguishing obstructive from central sleep apneas and hypopneas using linear SVM and acoustic features. In Proceedings of the 2016 38th Annual International Conference of the IEEE Engineering in Medicine and Biology Society (EMBC), Orlando, FL, USA, 16–20 August 2016; pp. 2236–2240. [Google Scholar] [CrossRef]
  15. Bhandari, A.; Krahmer, F.; Raskar, R. On unlimited sampling. In Proceedings of the 2017 International Conference on Sampling Theory and Applications (SampTA), Tallinn, Estonia, 3–7 July 2017; pp. 31–35. [Google Scholar] [CrossRef] [Green Version]
  16. McKennoch, S.; Wilson, D.M. Autoranging compensation for variable baseline chemical sensors. In Proceedings of the SPIE-The International Society for Optical Engineering, Boston, MA, USA, 22 February 2002; pp. 96–107. [Google Scholar] [CrossRef]
  17. Mantenuto, P.; De Marcellis, A.; Ferri, G. Uncalibrated Analog Bridge-Based Interface for Wide-Range Resistive Sensor Estimation. IEEE Sens. J. 2011, 12, 1413–1414. [Google Scholar] [CrossRef]
  18. Kishore, K.; Malik, S.; Baghini, M.S.; Akbar, S.A. A Dual-Differential Subtractor-Based Auto-Nulling Signal Conditioning Circuit for Wide-Range Resistive Sensors. IEEE Sens. J. 2020, 20, 3047–3056. [Google Scholar] [CrossRef]
  19. De Marcellis, A.; Ferri, G.; Mantenuto, P. A novel 6-decades fully-analog uncalibrated Wheatstone bridge-based resistive sensor interface. Sens. Actuators B Chem. 2013, 189, 130–140. [Google Scholar] [CrossRef]
  20. Das, M.; Sivakami, V.; Pal, A.; Vasuki, B. Analog-digital conditioning circuit for RTD temperature measurement. In Proceedings of the 2018 15th IEEE India Council International Conference (INDICON), Coimbatore, India, 16–18 December 2018; pp. 1–5. [Google Scholar] [CrossRef]
  21. Miyazaki, T.; Nakagawa, S.; Ishikuro, H. High-Resolution Auto-Balancing Wheatstone-Bridge with Successive Approximation of ΔΣ-Modulated Digitally Controlled Variable Resistor. In Proceedings of the 2019 26th IEEE International Conference on Electronics, Circuits and Systems (ICECS), Genoa, Italy, 27–29 November 2019; pp. 474–477. [Google Scholar] [CrossRef]
  22. Leinonen, M.; Juuti, J.; Jantunen, H. Interface circuit for resistive sensors utilizing digital potentiometers. Sens. Actuators A Phys. 2007, 138, 97–104. [Google Scholar] [CrossRef]
  23. Johnson, C.; Chen, C. Bridge-to-computer data acquisition system with feedback nulling. IEEE Trans. Instrum. Meas. 1990, 39, 531–534. [Google Scholar] [CrossRef]
  24. Vallerian, M.; Hutu, F.; Miscopein, B.; Villemaud, G.; Risset, T. Additive companding implementation to reduce ADC constraints for multiple signals digitization. In Proceedings of the 2015 IEEE 13th International New Circuits and Systems Conference (NEWCAS), Grenoble, France, 7–10 June 2015; pp. 1–4. [Google Scholar] [CrossRef] [Green Version]
  25. De Marcellis, A.; Reig, C.; Cubells-Beltran, M.-D. Current-Based Measurement Technique for High Sensitivity Detection of Resistive Bridges With External Balancing Through Control Voltages. IEEE Sens. J. 2016, 17, 404–411. [Google Scholar] [CrossRef]
  26. Jain, V.; George, B. Self-balancing digitizer for resistive half-bridge. In Proceedings of the 2018 IEEE International Instrumentation and Measurement Technology Conference (I2MTC), Houston, TX, USA, 14–17 May 2018; pp. 1–5. [Google Scholar] [CrossRef]
  27. Van Der Goes, F.; Meijer, G. A simple accurate bridge-transducer interface with continuous autocalibration. IEEE Trans. Instrum. Meas. 1997, 46, 704–710. [Google Scholar] [CrossRef] [Green Version]
  28. De Marcellis, A.; Ferri, G.; Mantenuto, P. Uncalibrated operational amplifier-based sensor interface for capacitive/resistive sensor applications. IET Circuits Devices Syst. 2015, 9, 249–255. [Google Scholar] [CrossRef]
  29. Mochizuki, K.; Watanabe, K. A high-resolution, linear resistance-to-frequency converter. IEEE Trans. Instrum. Meas. 1996, 45, 761–764. [Google Scholar] [CrossRef] [Green Version]
  30. Elangovan, K.; Anoop, C.S. Simple and Efficient Relaxation-Oscillator-Based Digital Techniques for Resistive Sensors—Design and Performance Evaluation. IEEE Trans. Instrum. Meas. 2020, 69, 6070–6079. [Google Scholar] [CrossRef]
  31. Jiang, P.; Zhu, R. Elimination of Drifts in Long-Duration Monitoring for Apnea-Hypopnea of Human Respiration. Sensors 2016, 16, 1779. [Google Scholar] [CrossRef] [Green Version]
  32. Sosna, C.; Buchner, R.; Lang, W. A Temperature Compensation Circuit for Thermal Flow Sensors Operated in Constant-Temperature-Difference Mode. IEEE Trans. Instrum. Meas. 2010, 59, 1715–1721. [Google Scholar] [CrossRef]
  33. J-Flex Electrically Conductive Silicone Sheet. Available online: https://www.j-flex.com/wp-content/uploads/2019/09/J-Flex-Datasheet_Electrically-Conductive-Silicone-Sheet-65-Shore-A.pdf (accessed on 28 August 2022).
  34. Karki, J. Application Note: Signal Conditioning Wheatstone Resistive Bridge Sensors; Texas Instruments: Dallas, TX, USA, 1999; Available online: http://www.ti.com/lit/an/sloa034/sloa034.pdf (accessed on 25 July 2022).
  35. ST Microelectronics. STM32F401xB STM32F401xC Datasheet. Available online: https://www.st.com/resource/en/datasheet/stm32f401cb.pdf (accessed on 25 July 2022).
  36. Kim, K.A.; Lee, I.K.; Choi, S.S.; Kim, S.S.; Lee, T.S.; Cha, E.J. Wearable transducer to monitor respiration in a wireless way. In Proceedings of the 2007 6th International Special Topic Conference on Information Technology Applications in Biomedicine, Tokyo, Japan, 8–11 November 2007; pp. 174–176. [Google Scholar] [CrossRef]
  37. Analog Devices. Datasheet: AD8402: 2-Channel Digital Potentiometer. 2010. Available online: http://www.analog.com/static/imported-files/data_sheets/AD8400_8402_8403.pdf (accessed on 25 July 2022).
Figure 1. Prototype of a conductive rubber belt.
Electronics 11 03158 g001
Figure 2. Schematics of standard resistance measurement circuits (LTspice). R6 represents resistance of the stretch sensor. (a) Differential amplifier; (b) Differential amplifier with the high-pass filter.
Electronics 11 03158 g002
Figure 3. Proposed low-frequency feedback topology (LTspice).
Electronics 11 03158 g003
Figure 4. Output signals of the standard resistance measurement circuits (LTspice). The red trace is the output and the blue trace represents the input resistance, if applicable. (a) Differential amplifier circuit; (b) Differential amplifier with high-pass filter; (c) Enlarged view of the signal before and after the high-pass filtering; (d) AC analysis of circuit with the high-pass filter.
Electronics 11 03158 g004aElectronics 11 03158 g004b
Figure 5. Output of the low-frequency feedback circuit (LTspice).
Electronics 11 03158 g005
Figure 6. Analysis of the phase shift introduced by the low-frequency feedback topology (LTspice). The red trace is the output signal and the blue trace represents the input resistance, if applicable. (a) Enlarged view of the signals from Figure 5; (b) AC phase analysis of the low-frequency feedback circuit.
Electronics 11 03158 g006
Figure 7. Prototype of the low-frequency feedback topology with the output signals generated by the circuit. The red trace is the output signal and the blue trace represents the input resistance. (a) Picture of the prototype; (b) Sine wave reproduction (LTspice); (c) Step response (LTspice).
Electronics 11 03158 g007
Figure 8. Outputs of the low-frequency feedback circuit with associated body position graphs, measured on patients. (a) Person 1 (b) Person 2 (c) Person 3.
Electronics 11 03158 g008
Publisher’s Note: MDPI stays neutral with regard to jurisdictional claims in published maps and institutional affiliations.

