Article

Comparison of Grid Reactive Voltage Regulation with Reconfiguration Network for Electric Vehicle Penetration

by
Farrukh Nagi
1,*,
Aidil Azwin
2,
Navaamsini Boopalan
2,*,
Agileswari K. Ramasamy
2,
Marayati Marsadek
1 and
Syed Khaleel Ahmed
3
1
Institute of Power Engineering, Universiti Tenaga Nasional, Kajang 4300, Selangor, Malaysia
2
Department of Electrical & Electronic Engineering, Universiti Tenaga Nasional, Kajang 4300, Selangor, Malaysia
3
C3, Alsa Towers, EVR Periyar Salai, Chetpet, Chennai 600010, India
*
Authors to whom correspondence should be addressed.
Electronics 2022, 11(19), 3221; https://doi.org/10.3390/electronics11193221
Submission received: 19 August 2022 / Revised: 22 September 2022 / Accepted: 23 September 2022 / Published: 8 October 2022
(This article belongs to the Special Issue Electric Vehicles Integration and Control in Smart Grids)

Abstract

:
Renewable energy sources and EV growth brings new challenges for grid stabilization. Smart grid techniques are required to reconfigure and compensate for load fluctuation and stabilize power losses and voltage fluctuation. Numerical tools are available to equip the smart grid to deal with such challenges. Distribution Feeder reconfiguration and reactive voltage injection to the disturbed grid are some of the techniques employed for the purpose. However, either reconfiguration or injection alone is used commonly for this purpose. In this study, both techniques are applied to EV penetration as load and compared. A balanced IEEE 33 Radial network is used in this study and selected branches with high power losses are targeted for the reactive voltage injection and Minimum Spanning tree techniques (MST). EV charging loads are usually modelled with time base distribution which requires times base power flow analysis for reactive power injection. A comparison between coordinated, reconfiguration, and reactive voltage injection shows differences in power losses, voltage distortion, and cost saving. The analysis is carried out with an integer linear programming technique for coordinated charging, a minimum spanning tree for network reconfiguration, and genetic optimization for reactive power injection. Besides, all power flow analyses are carried out with the Backward/Forward sweep method. The information would help lowering power losses, grid stabilization, and charging station infrastructure planning.

1. Introduction

The power demand for new emerging electric vehicle technology adds load on power utility companies. Environmental regulated Renewable Energy (RE) sources also play a major role as Distributed Generator (DG) connected to the distribution networks. Energy management of the network ensures the demand and supply unit commitment cost-effectively. EV charging aggregators and stations both for residential and commercial purposes make use of demographic and economic activity at the network nodes.
Power stability techniques of the network are employed by the energy management system. Among the most common are (i) Flexible voltage levels (ii) Network reconfiguration topology [1] (iii) Feeder capacitor bank [2] (iv) Load balancing techniques with an On-load tap changer (OLTC) of the main transformer are used to overcome the losses in network buses rather than on bus nodes. Reactive power injection is also used for power stability, the synchronous motor excitation method at affected nodes was used by Kotenev et al. [3]. A key node reactive power injection for voltage optimization is presented by Meng and Gao [4]. Zechun and Mingming [5] inject reactive power at nodes based on the sensitivity analysis. Whereas, the reactive power margins method to find the affected node was proposed by Chuan-Quan and Yan [6].
Distribution Feeder Reconfiguration (DFR) also reduces power losses in the power distribution system by opening and closing the sectional and tie switches in the network. Due to online capability for controlling remote sectionalizing switches (RSS), Singh and Tiwari [7] address network configuration for reducing the power losses and relieving the overload or balancing the network. Two-stage DFR framework was first proposed by Baran and Wu [8] for active and reactive power management. Zhang and Zeng [9] used ‘OpenDSS’ software to connect a set of five capacitor banks randomly to the network nodes at peak load hours and find the optimal nodes for minimum power losses. Rostami et al. [10] use stochastic reconfiguration methods for PHEV charging cost minimization. For EV charging strategies Cui et al. [11] presented the case of off-peak load charging. The network reconfiguration is a non-deterministic and combinatorial problem. Metaheuristic evolution methods like Genetic Algorithm [12,13] and Binary Particle Swarm Optimization [14] were used to search for global optimal point and doesn’t suit large networks due to convergence time. Minimum Spanning tree (MST) is a graph theory-based approach used for network optimization in communication and transportation problems. It has been efficiently used for solving the DFR problem [15,16,17]. Krushal’s algorithm [18] has non-cyclic graph property for the determination of MST problem, which maintains the radial integrity condition of the network.
Random EV charging load on the network increases power losses, peak-load and violates voltage stability [19,20]. Adverse effects of random or uncoordinated EV charging are removed by scheduled coordinated charging schemes. Such coordinated charging schemes use an aggregator who coordinates with the distribution system operator (DSO). The aggregator addresses both interests of EV owners and DSO to schedule the charging/discharging of EVs. The aggregator is used to provide economic incentives and takes necessary measures to reduce power losses and voltage stabilization [21,22].
Most of the references discussed above study the impact of EV charging on grid stabilization, while others have given solutions with the DFR technique and reactive power injection without the 24 h time frame. In this paper, we have analyzed and compared coordinated, DFR and reactive power injection EV charging optimizations to get the optimal power losses and voltage stabilization for 24 h period. A comparison between reactive power injection with DFR comparison shows an almost 15% reduction in power losses and voltage distortion with increased charging cost.

EV Charging Problem

EV penetration and interaction with IEEE 33 network bus with tie and sectionalizing switches, aggregator, and DSO is shown in Figure 1. Modern inverters DSTATCOM and capacitor banks improve voltage profiles and minimize power with reactive power injection [23]. EV charger available in aggregator resources also has the capability of allowing reactive power flow to the grid by utilizing the DC Link capacitor. The optimal node’s location, reactive power magnitude, and time duration will be made available through aggregator resources and passed to Distribution Grid Control Centre/DSO to take proper action to reduce power losses and voltage stabilization.

2. Simulation Methodology

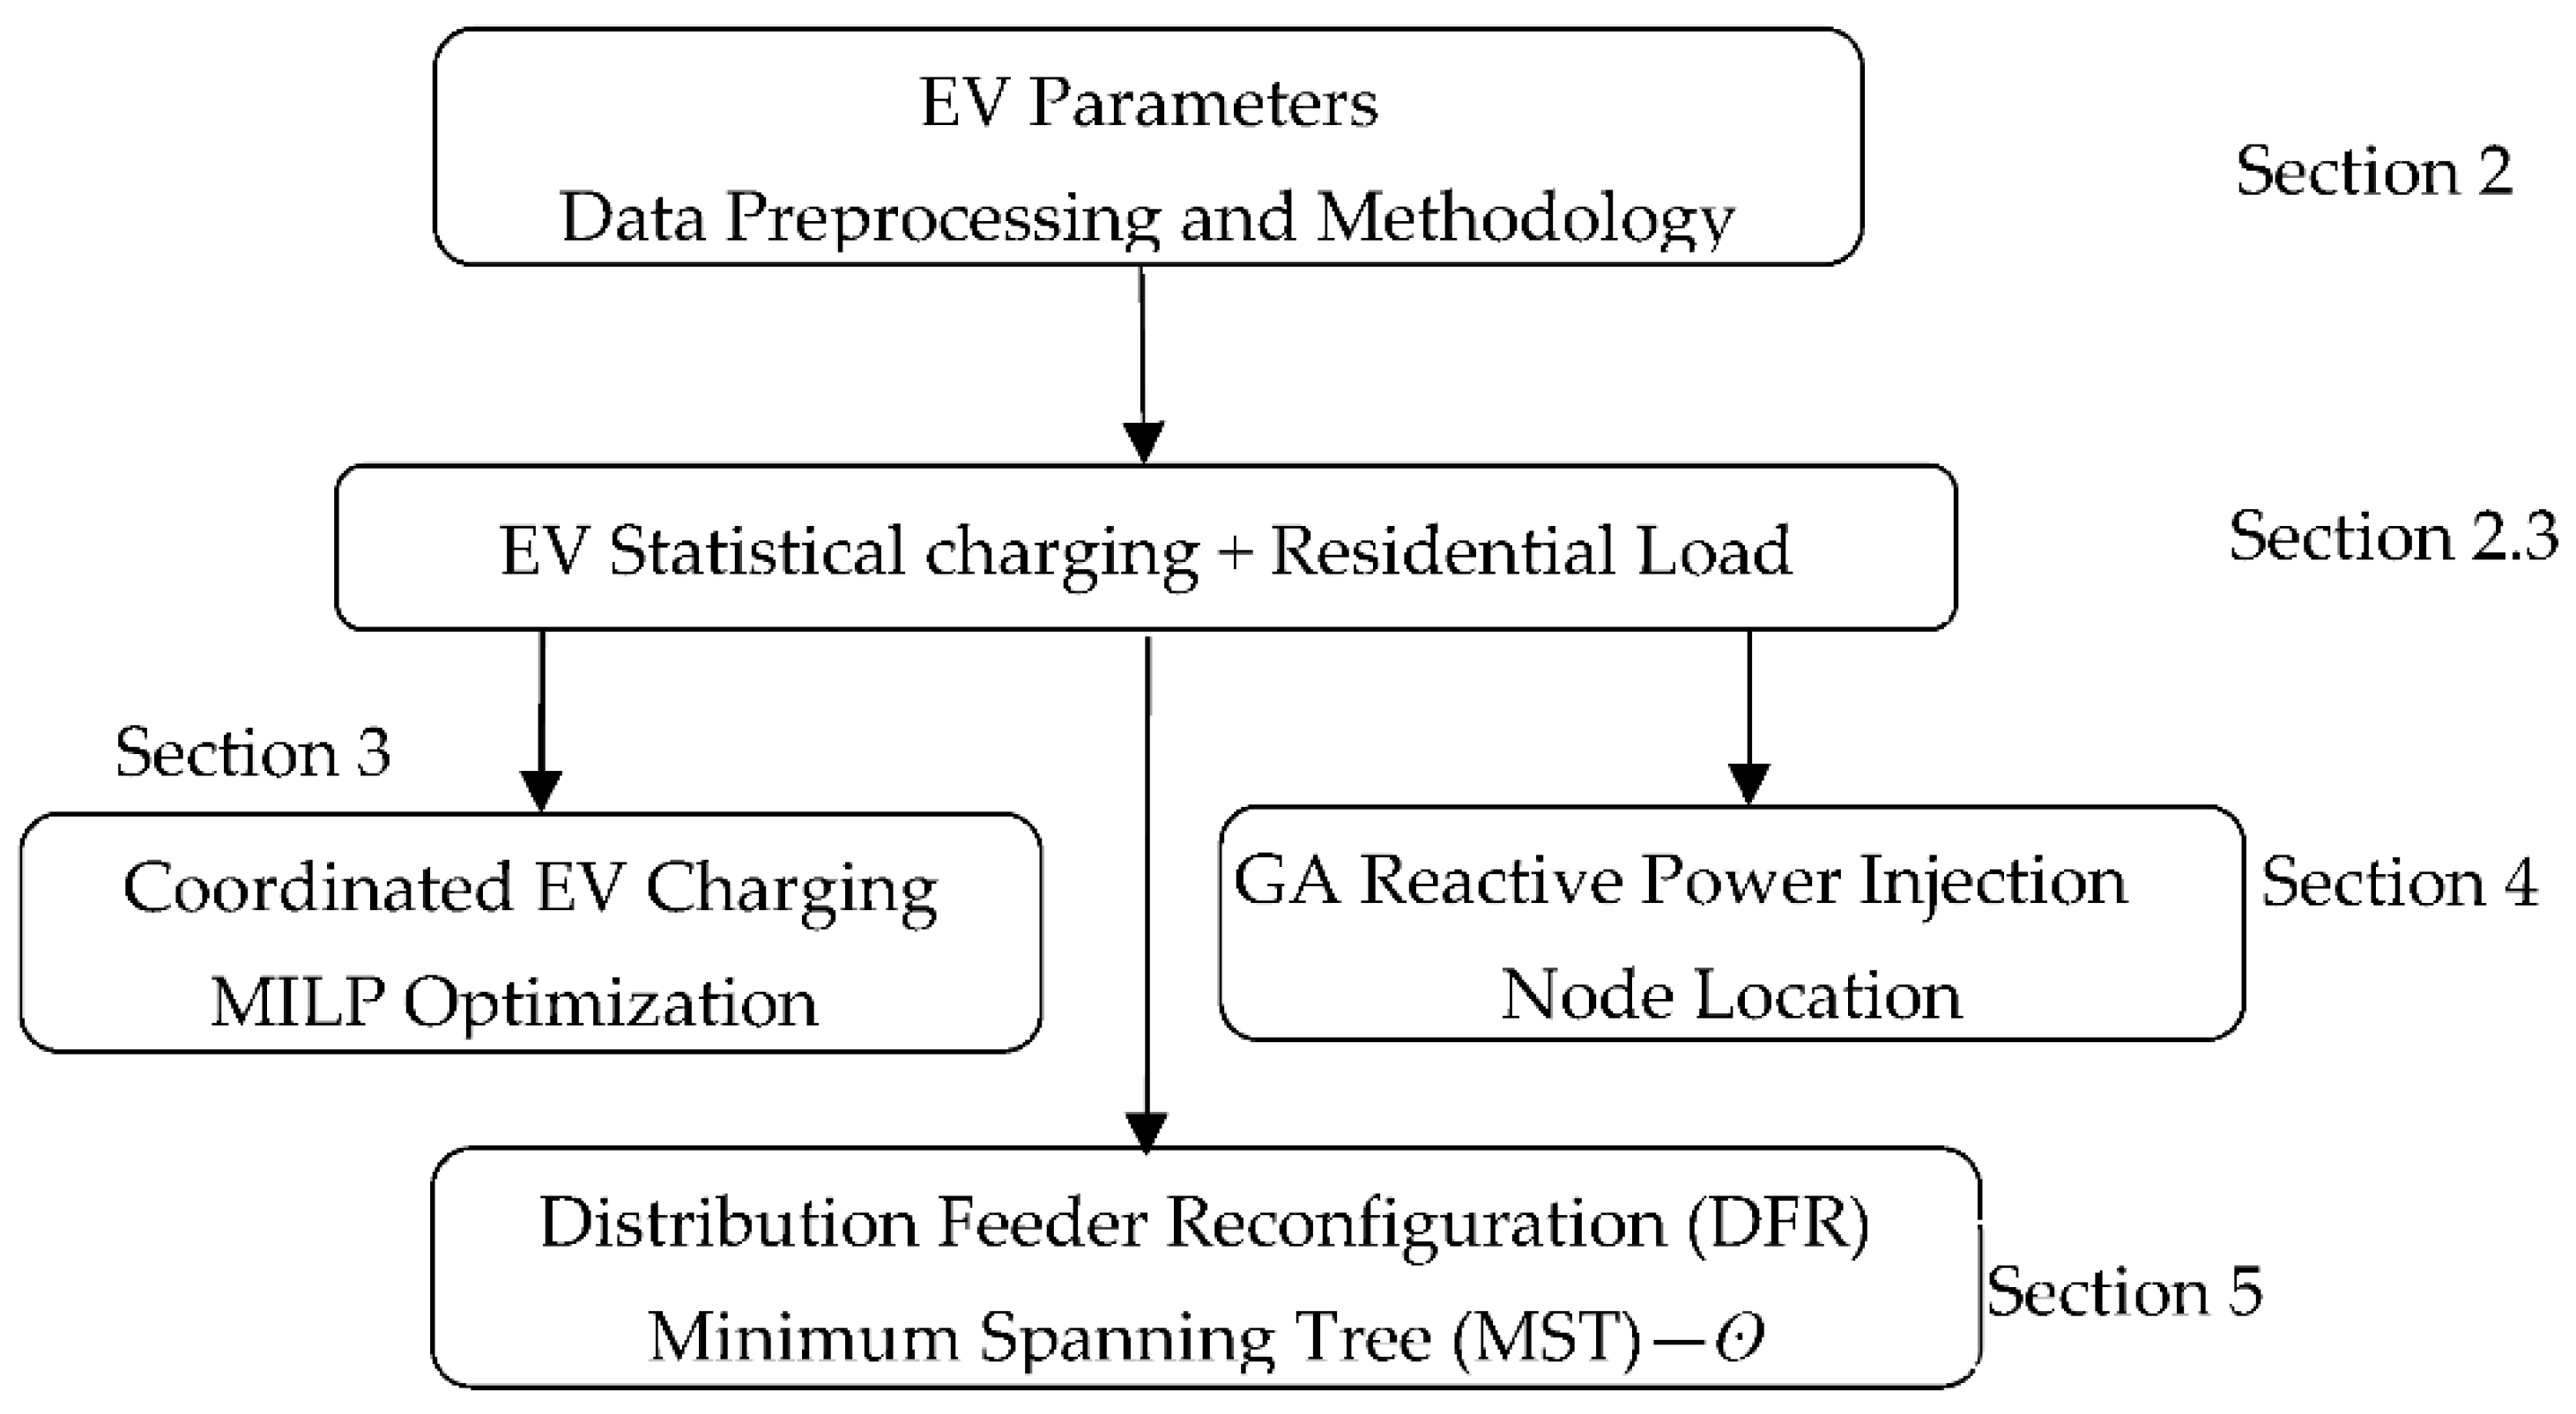
The methodology adopted in this work for EV penetration load is shown in Figure 2. The Aggregator in Figure 1 is responsible for minimization of EV charging and cost; based on EV driving pattern, the number of the network’s charging nodes, charging cost, number of EVs, battery characteristics, charging rates, EV energy balance, and daily load profile parameters are defined in Section 2, Figure 2. The data in Section 2 are preprocessed to obtain the EV statistical charging load which is added to the daily residential load in Section 2.3 for further analysis. In Section 3 Mixed Integer linear programming (MILP) is used for comparing coordinated EV charging with reactive injection and Distribution Feeder Reconfiguration techniques in Section 4 and Section 5, respectively.

2.1. EV Charging Distribution

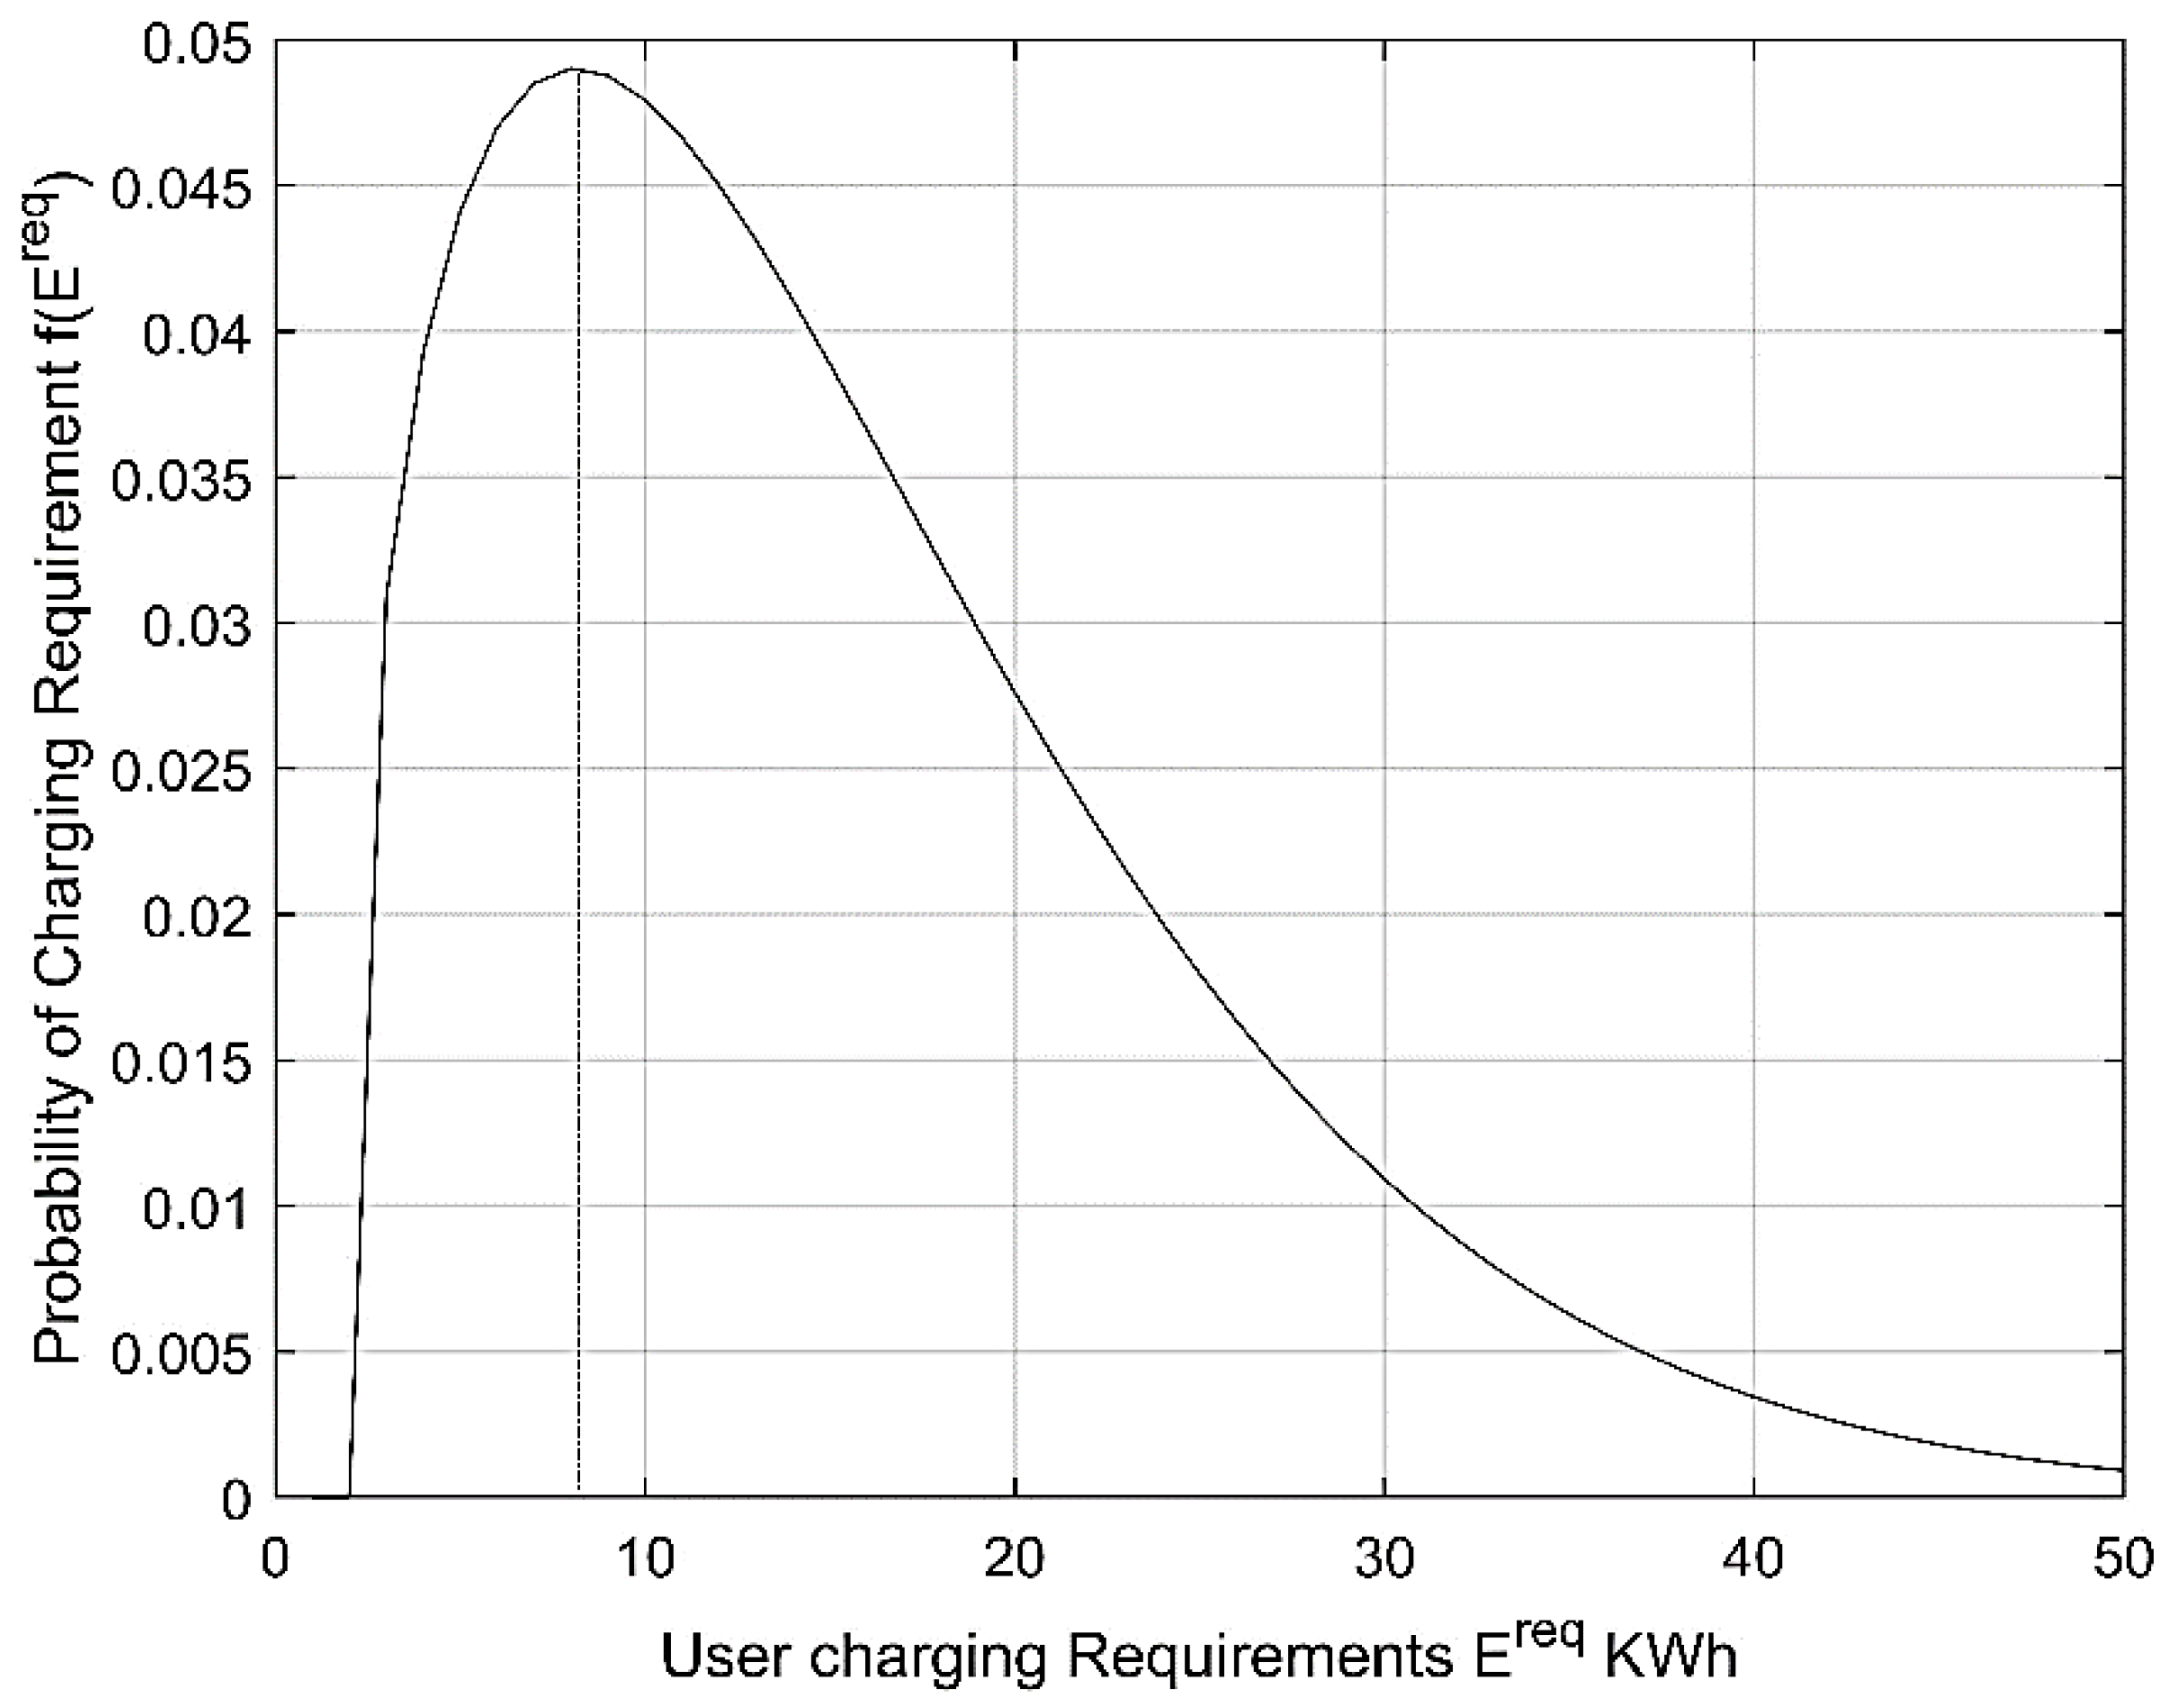
EV cars’ battery energy capacity E m r e q varies within ranges of 4 kWh–50 kWh. The battery charging load depends upon the driving pattern and the energy requirement probability can be represented by the Weibull density [24] curve defined in Equation (1).
f ( E r e q ) = b a · ( E r e q + c a ) b 1 · e ( E r e q + c a ) b
where a = 15, b = 1.4, c = 2, and the probability curve is given in Figure 3. Average EV charging is considered as P a v g = 9.2 KW.
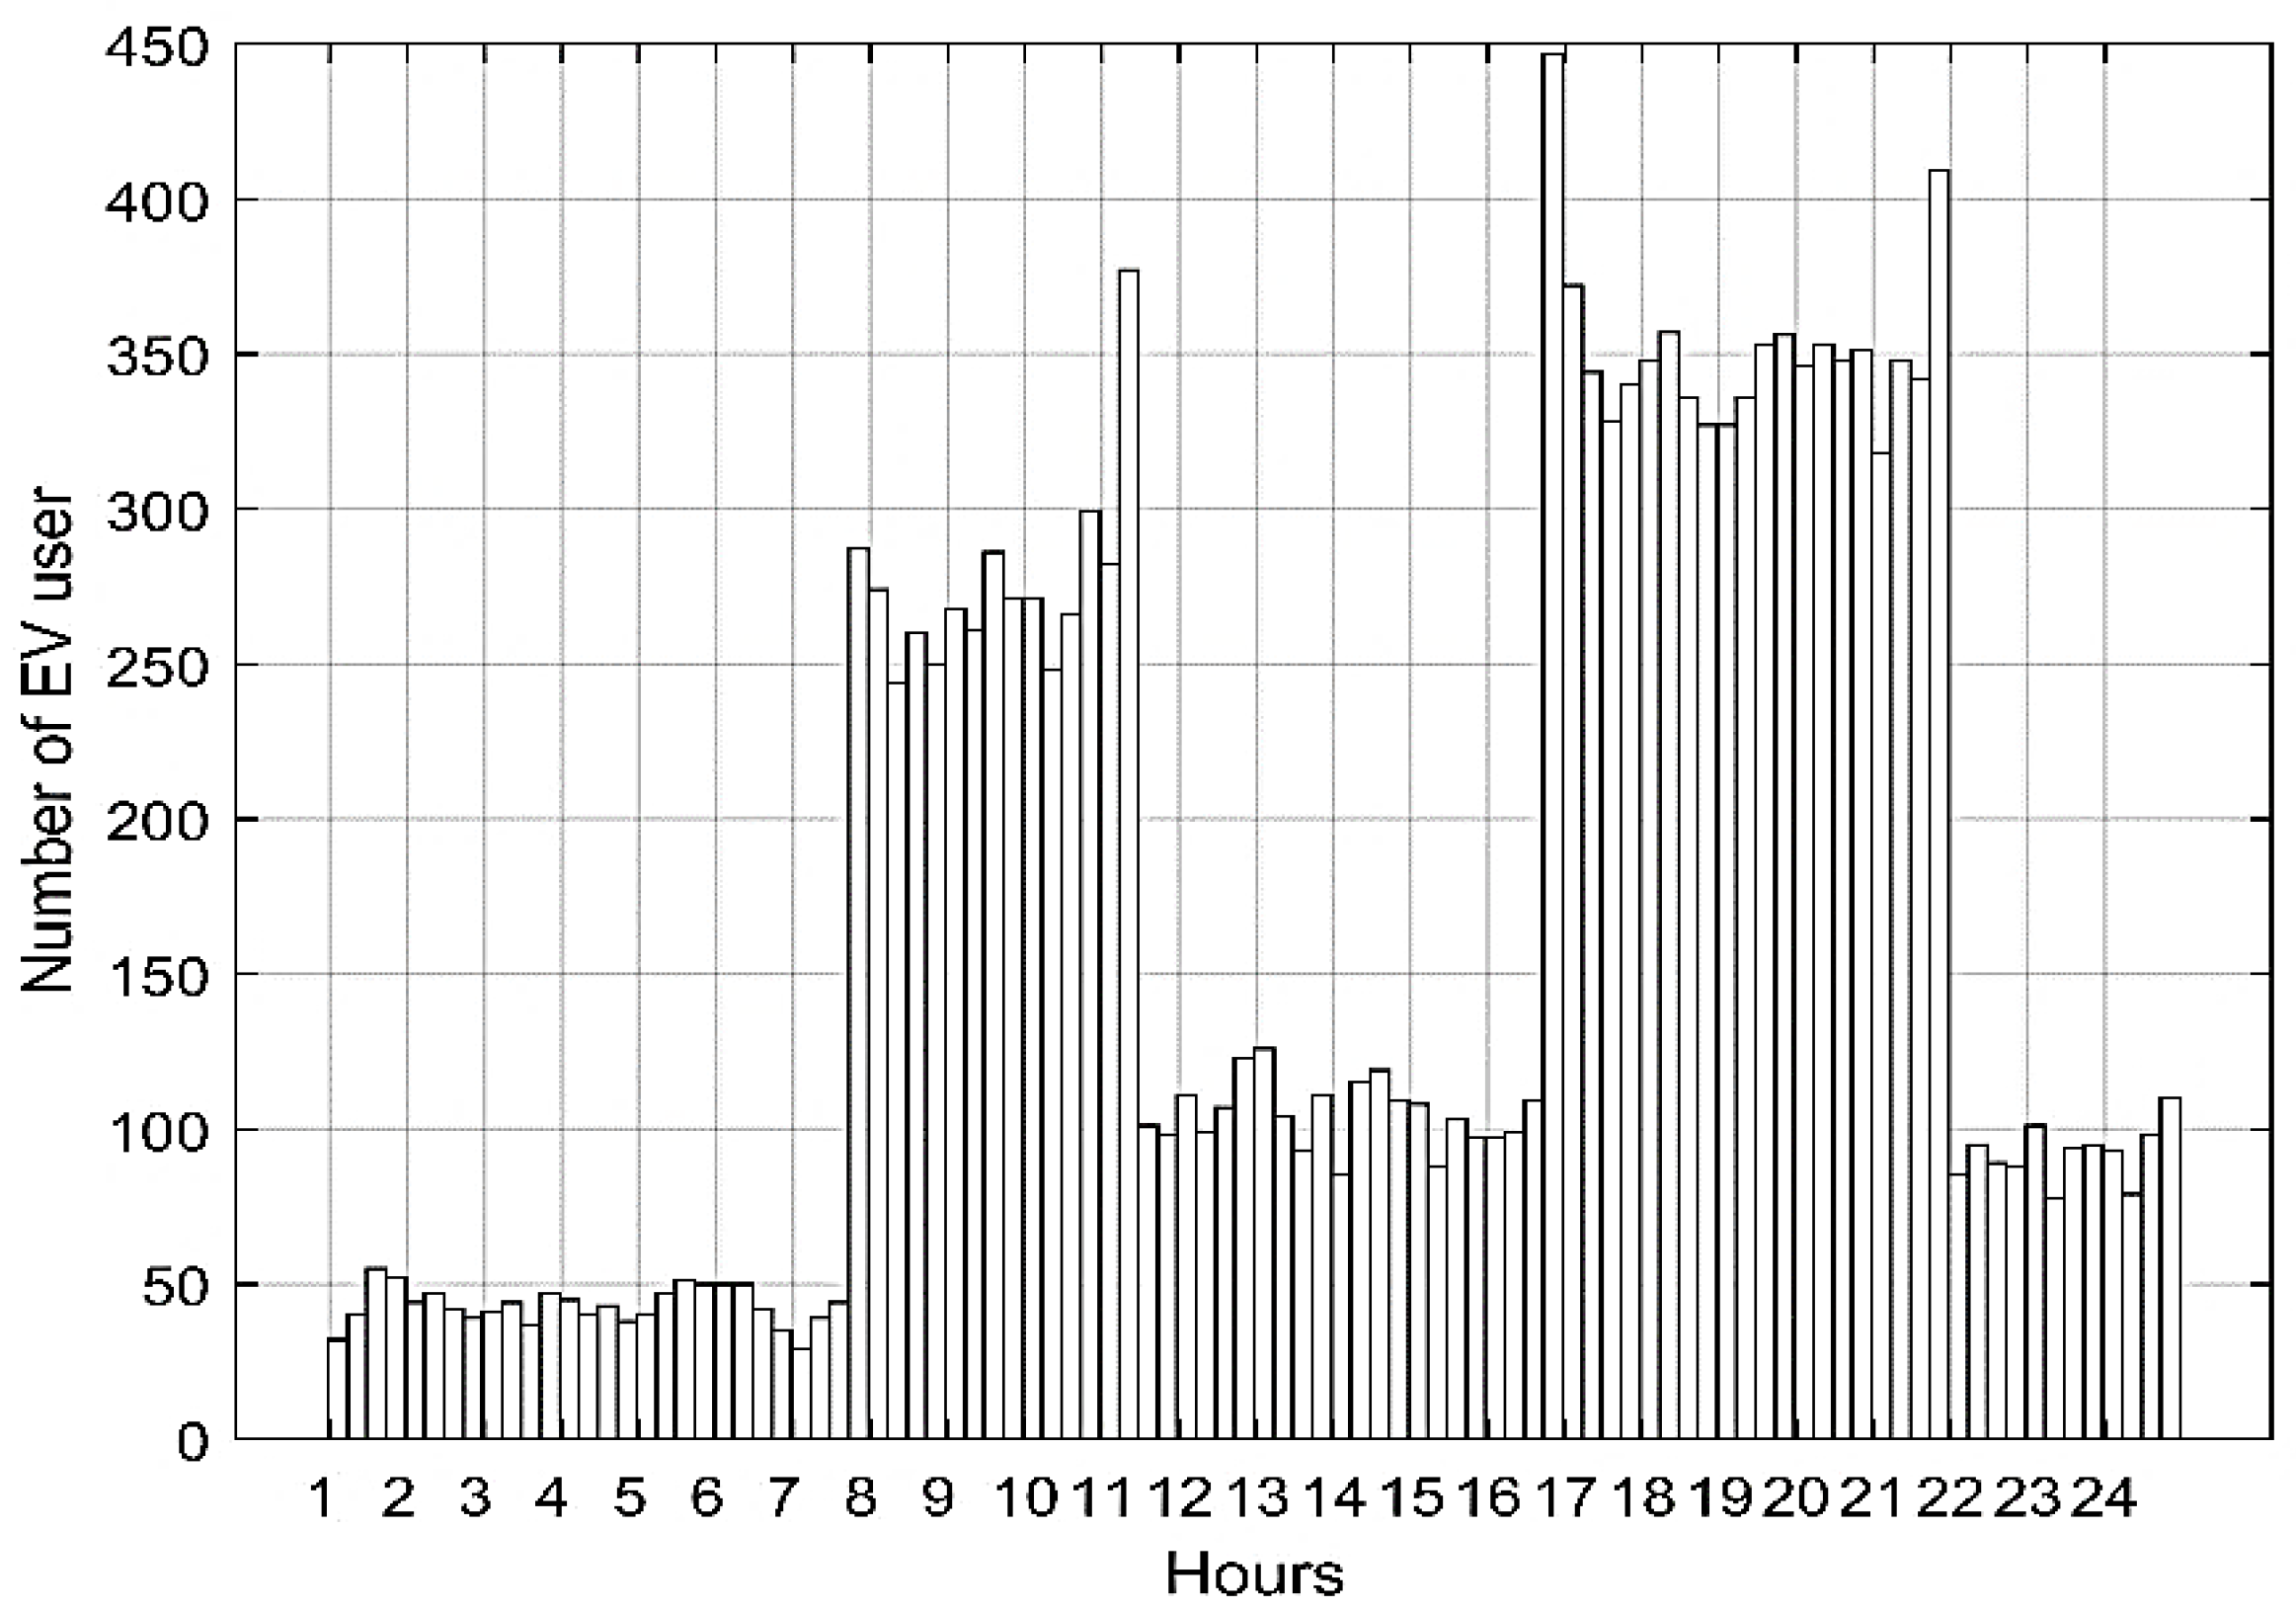
Considering the users’ preferable charging behavior as 20% between 07 h 00 and 10 h 30, 40% 16 h 00 to 21 h 00, and the rest of 40% evenly distributed over the day, the EV start charging times t s t are randomly generated in Figure 4. Charging stop time to determine the time interval U m for m t h EV is evaluated from both start time t s t and probability of energy required E m r e q Equation (1) is defined by Equation (2).
U m = [ t s t ; s t o p t i m e ] U m = [ t s t ; t s t + E m r e q P a v g ]

2.2. IEEE 33 Bus and EV Charging Parameters

EV charging process parameters are given in Table 1. The daily residential load profile P t r e s d and cost tariff λ t data of electricity used for simulation are shown in Figure 5. For node analysis, the data are expanded to two dimensions: time (t) and nodes (n) as P t , n r e s d and λ t , n . For power flow analysis the backward/forward (B/F) sweep method [25] is used for IEEE 33 radial distribution system as shown in Figure 2.

2.3. EV Charging Statistical Load

EV aggregator is responsible to meet the demand for battery charging at optimal cost. Since this work simulates charging over 24 h times the EV power charging parameter is a function of three indexed variables, timestamp variable (t) network node (n), and EV number (m), as E t , n , m r e q (KWh) and is evaluated from the Weibull distribution Equation (1), the charging interval U t , n , m is evaluated from Equation (2). Then, the charging power P n , t e v required for all EVs on 32 (n) nodes for time t (1:96) is given in Equation (3).
P t , n e v = m M = 500 E t , n , m r e q U t , n , m
EV charger has an adverse effect on power factor [18] and is considered here to vary between pf = [0.98: 0.74] and pf = 0.74 corresponding to −42.3° phasor angle between the voltage and current. With the addition of real P t , n e v Equation (3) and Residential load P t , n r e s d , the total EV charging power in Equation (4a–c) is:
P t , n E V = P t , n e v + P t , n r e s d
S t , n E V = [ P t , n E V p f n ]
Q t , n E V = S t , n E V 2 P t , n E V 2

3. Coordinated EV Charging-MILP

Charging cost reduction is the key objective of coordinated EV charging. To achieve coordinated charging, an optimized charging schedule is required to avoid peak load times at high tariffs. If P t , n , m x is an EV charging decision variable and λ t , n is the charging cost then the optimization objective function is defined in Equation (5).
f m i n , t c o o r = 0 n 96 1 t N 1 m M   P t , n , m x   ·   λ t , n ( Objective Function )
Subjected to constraint:
  P t , n , m x     P c h     ( M a x   c h a r g i n g   L i m i t )                  
  P t , n , m x P t , n E V + P t , n , m R e s d         ( E V + B a s e   L o a d   Equation   ( 4 a ) )                
P t , n , m x   ·   U t , n , m = E t , n , m r e q   ( E n e r g   B a l a n c e ,   Equation   ( 1 ) )
P t , n , m x     0
Constraints in Equations (6)–(9) specify that the optimized charging load should be less than or equal to the total inclusive of EV and base loads, and optimized charging energy P t , n , m x · U t , n , m should be equal to the required EV charging energy E t , n , m r e q and positive charging power, respectively.
IBM ILOG CPLEX linear programming function ‘cplexlp’ is used in MATLAB 2020 environment for large-scale optimization. EV charging power P t , n E V in Equation (4a) is further expanded to cater for EV index (m) in P t , n , m E V for analysis. Time span for 24 h analysis is considered here as t + ∆t, where ∆t = 15 min interval. The optimized EV power P t , n , m x after analysis in this section is given in Equation (10).
P t , n c o o r = m M = 500 P t , n , m x *
Then, Q t , n , m c o o r can be found to be similar to (4b,c). The maximum EV charging demand power at each node is defined in Equation (11).
E t , n c o o r = m a x M 500 [ P t , n , m c o o r · U t , n , m ]

3.1. Coordinated Power Flow Analysis

Node Power losses P t , n c o o r , L o s s , Q t , n c o o r , L o s s and voltage p.u. V t , n c o o r are evaluated with B/F sweep power flow, the network branches resistance Rn and reactance Xn is obtained from Appendix A Table A1 and Table A2, then:
S t , n c o o r = P t , n c o o r p f n
Q t , n c o o r = S t , n c o o r 2 P t , n c o o r 2
P t , n c o o r = P t , n + 1 c o o r + R n P t , n + 1 c o o r 2 + Q t , n + 1 c o o r 2 V t , n + 1 2 P t , n + 1 c o o r = P t , n c o o r + P t , n L o a d Q t , n + 1 c o o r = Q t , n c o o r + Q t , n L o a d
Q t , n c o o r = Q t , n + 1 c o o r + X n P t , n + 1 c o o r 2 + Q t , n + 1 c o o r 2 V t , n + 1 2
and
I t , n c o o r = c o n j ( P t , n c o o r + j · Q t , n c o o r ) V t , n c o o r
where
V n = 1 c o o r = 1 p . u .
V t , n + 1 c o o r = V t , n c o o r I t , n c o o r · ( r n + j X n )
P t , n c o o r , L o s s = I t , n c o o r 2 · R n
Q t , n c o o r , L o s s = I t , n c o o r 2 · j X n
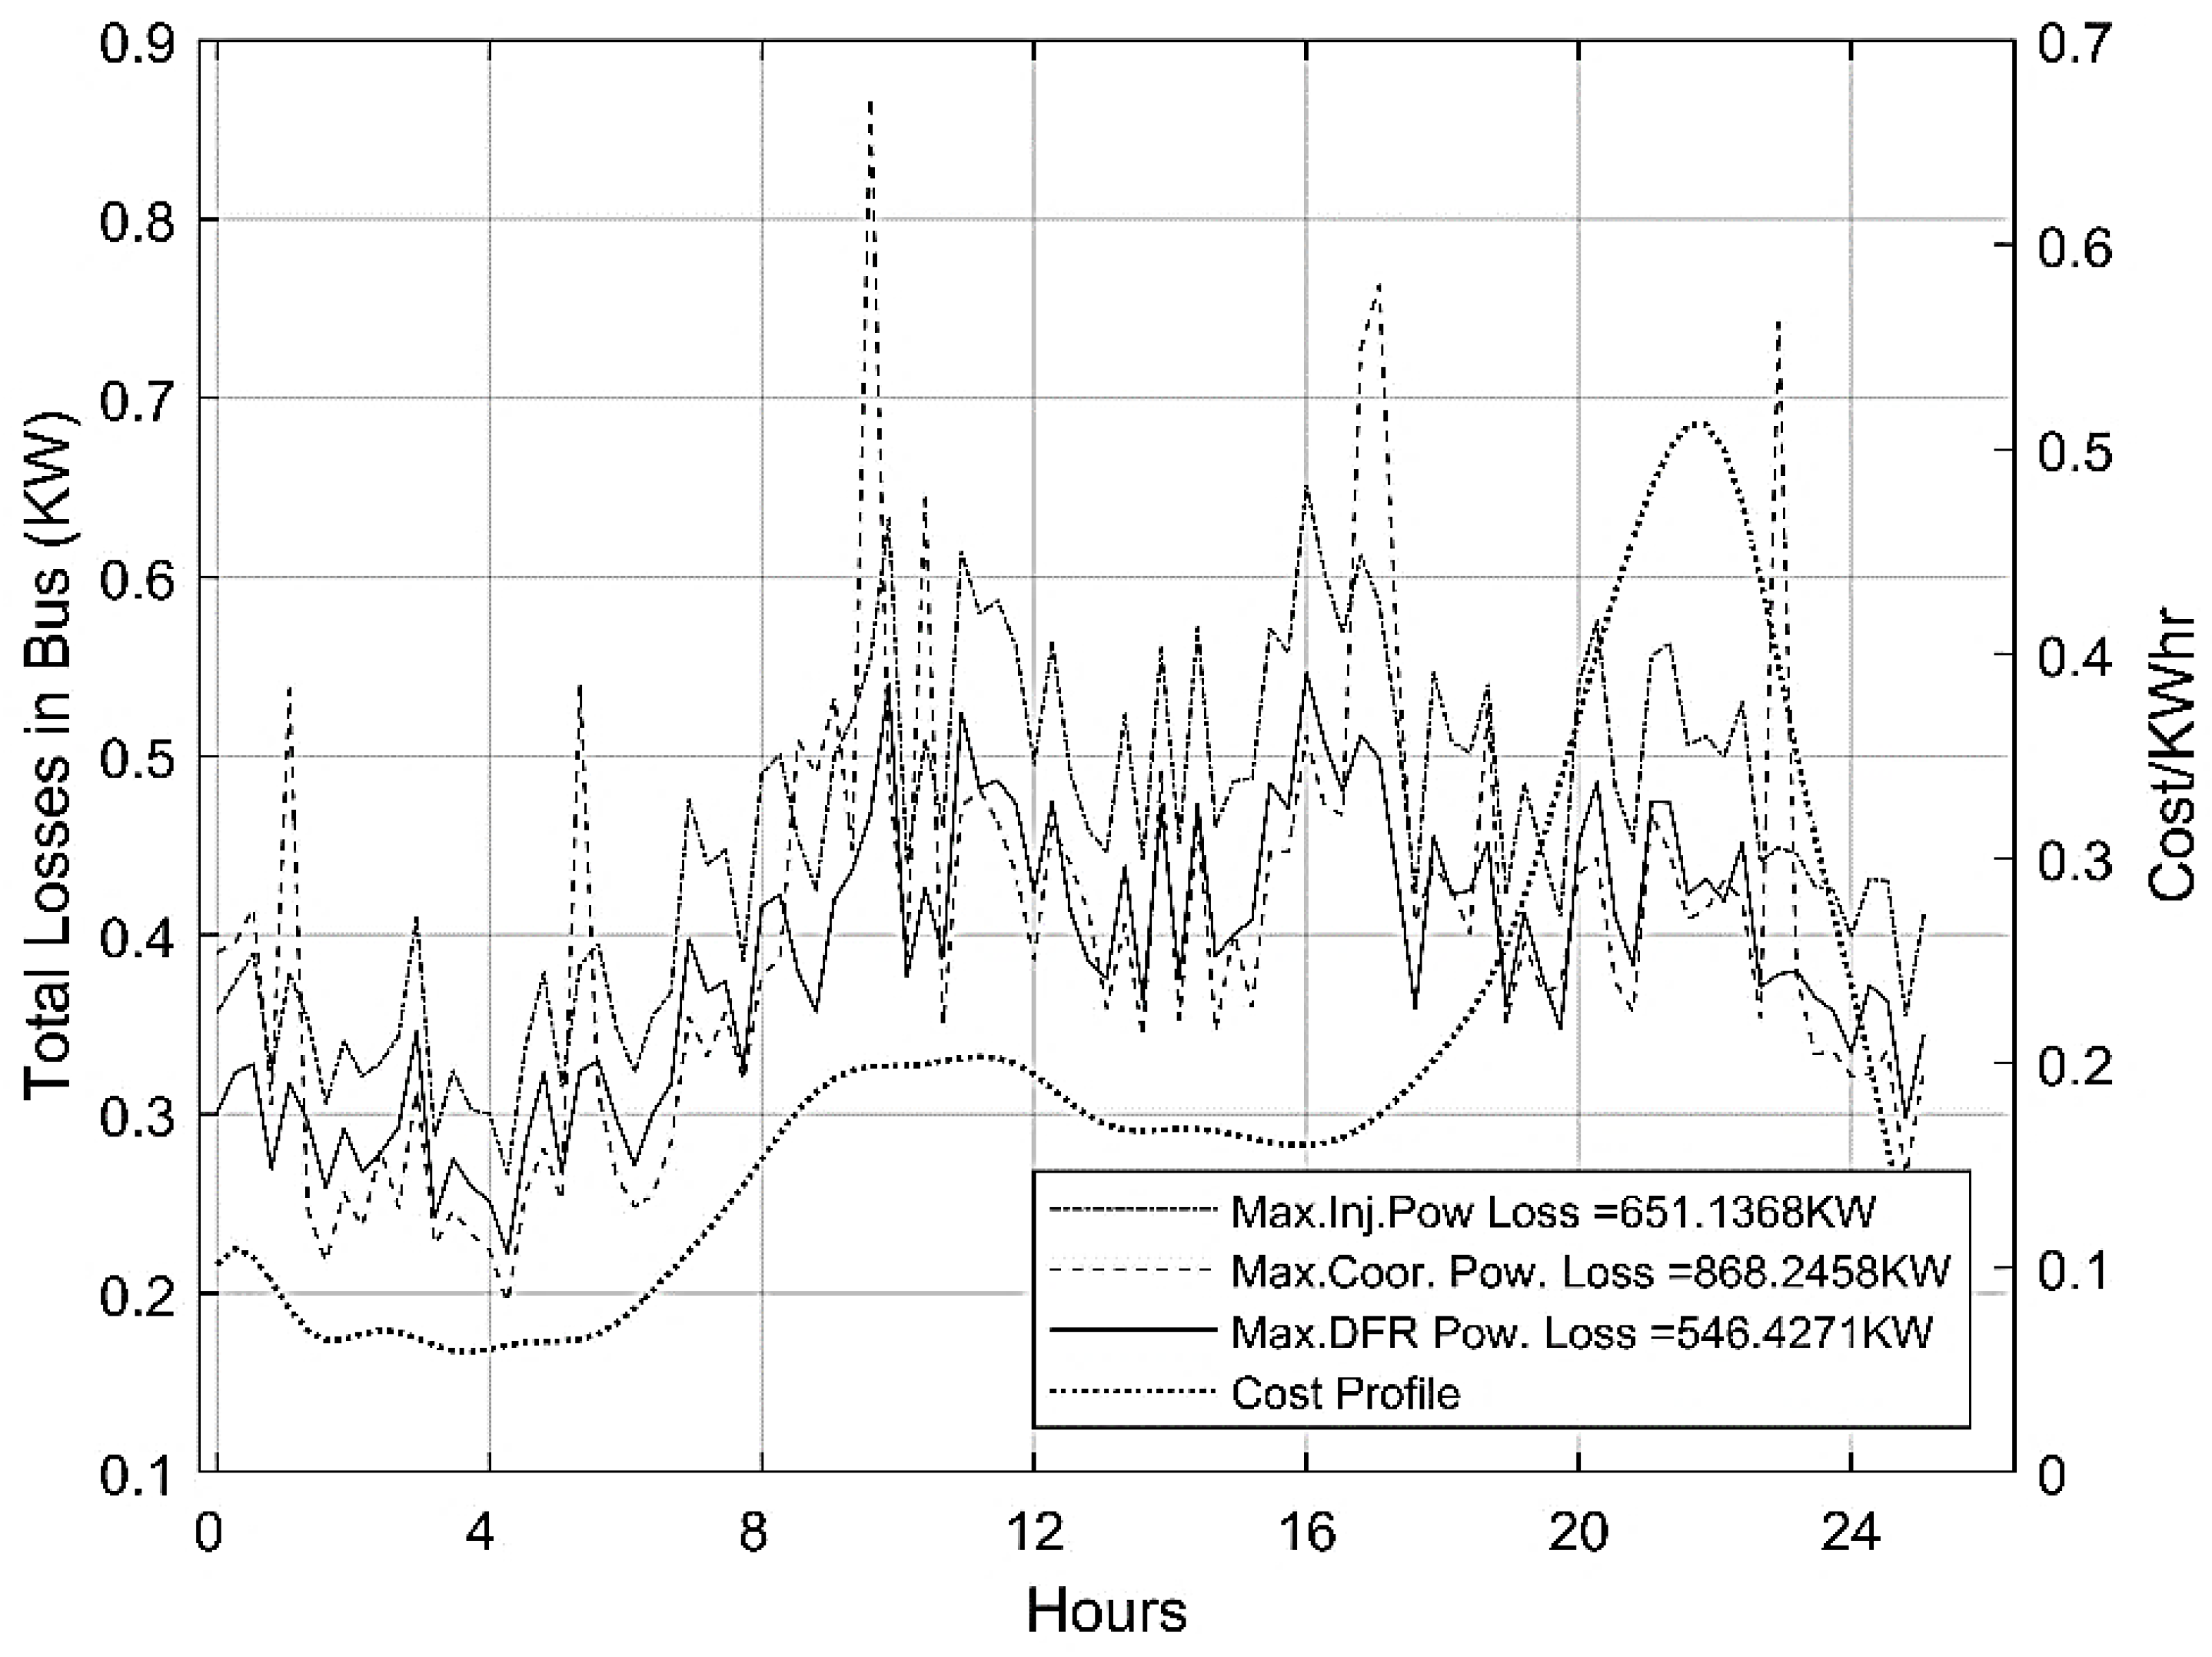
The total power losses P t , n c o o r , L o s s at all nodes over 24 h is shown in Figure 6 and the average voltage (p.u.) V t , n c o o r is shown in Figure 7.

4. Power Injection GA-Optimization with Power Flow Analysis

Reactive Power injection can improve power losses and voltage. Mixed Integer Genetic Algorithm (GA) with parameters in Table 2 is used here to optimize EV power P n , t e v by searching K = 5 nodes to reduce the network power losses and stabilize the voltage. The reactive power can be supplied from a shunt capacitor bank, EV battery DC link, or offload synchronous motor condenser. Reactive power injection variable term Q [ J k n ] is a function of the node location index J k n in (19) for mixed integer GA optimizer. The input powers from P t , n i n j from Equation (4a) are given as:

4.1. Injection Power Flow Analysis

The Analysis is performed similarly to Section 3.1 with an addition of reactive power injection Q t , n ( k ) i n j in Equation (19) and discussed in the later section as:
P t , n i n j = P t , n E V S t , n i n j = P t , n i n j p f n Q t , n i n j = S t , n i n j 2 P t , n i n j 2 P t , n i n j = P t , n + 1 j + R n P t , n + 1 j 2 + Q t , n + 1 j 2 V t , n + 1 2
Q t , n i n j = Q t , n ( k ) i n j + Q t , n + 1 j + X n P t , n + 1 j 2 + Q t , n + 1 j 2 V t , n + 1 2 where P t , n + 1 j = P t , n i n j + P t , n L o a d Q t , n + 1 j = Q t , n i n j + Q t , n L o a d
and
I t , n i n j = C o n j ( P t , n i n j + j · Q t , n i n j ) V t , n i n j where V n = 1 i n j = 1   p . u .
and
V t , n + 1 i n j = V t , n i n j I t , n i n j · ( R n + j X n )
P t , n i n j , L o s s = I t , n i n j 2 · R n
Q t , n i n j , L o s s = I t , n i n j 2 · j X n

4.2. Random Search of Injection Nodes and Magnitude

The reactive power injection magnitude Q t , n ( k ) i n j in Equations (23) and (24) is a reactive power injection magnitude variable, and k is a random searched injection index of the node. Where k = 1 to K for K = 5 nodes e.g., k = [ 12 ; 13 ; 14 ; 26 ; 33 ] K = 5 is a searched result by the optimizer to minimize K highest power in branches at any time interval t = t + ∆t, the remaining (33 − K) nodes are set to zeros as
n ( k ) = r a n d p e r m n [ 0 ,   ,   1 k = 1 n = 12 ,   1 k = 2 n = 13 ,   1 k = 3 n = 14 ,   0 ,   ,   1 k = 4 n = 26 ,   ,   0 ,   ,   1 k = 5 n = 33 ] 1 × 33
MATLAB command ‘randperm’ is a random and combinatorial set of cyclic permutations for GA optimization. Then the injection magnitude is:
Q t , n ( k ) i n j = Q i n j [ 0 ( 1 ) , , 1 k = 1 n = 12 , 1 k = 2 n = 13 , 1 k = 3 n = 14 , 0 ( 7 ) , , 1 k = 4 n = 26 , ,   0 ( 27 ) , , 1 k = 5 n = 33 ]

4.3. Reactive Injection Objective Function

The reactive power injection magnitude Q t , n ( k ) i n j is assigned an injection range of [0 500] KVar to minimize the objective function in (25). The minimum power cost objective function similar to Equation (5) is:
f m i n , t i n j = n N P t , n i n j · m M n N λ t , n , m
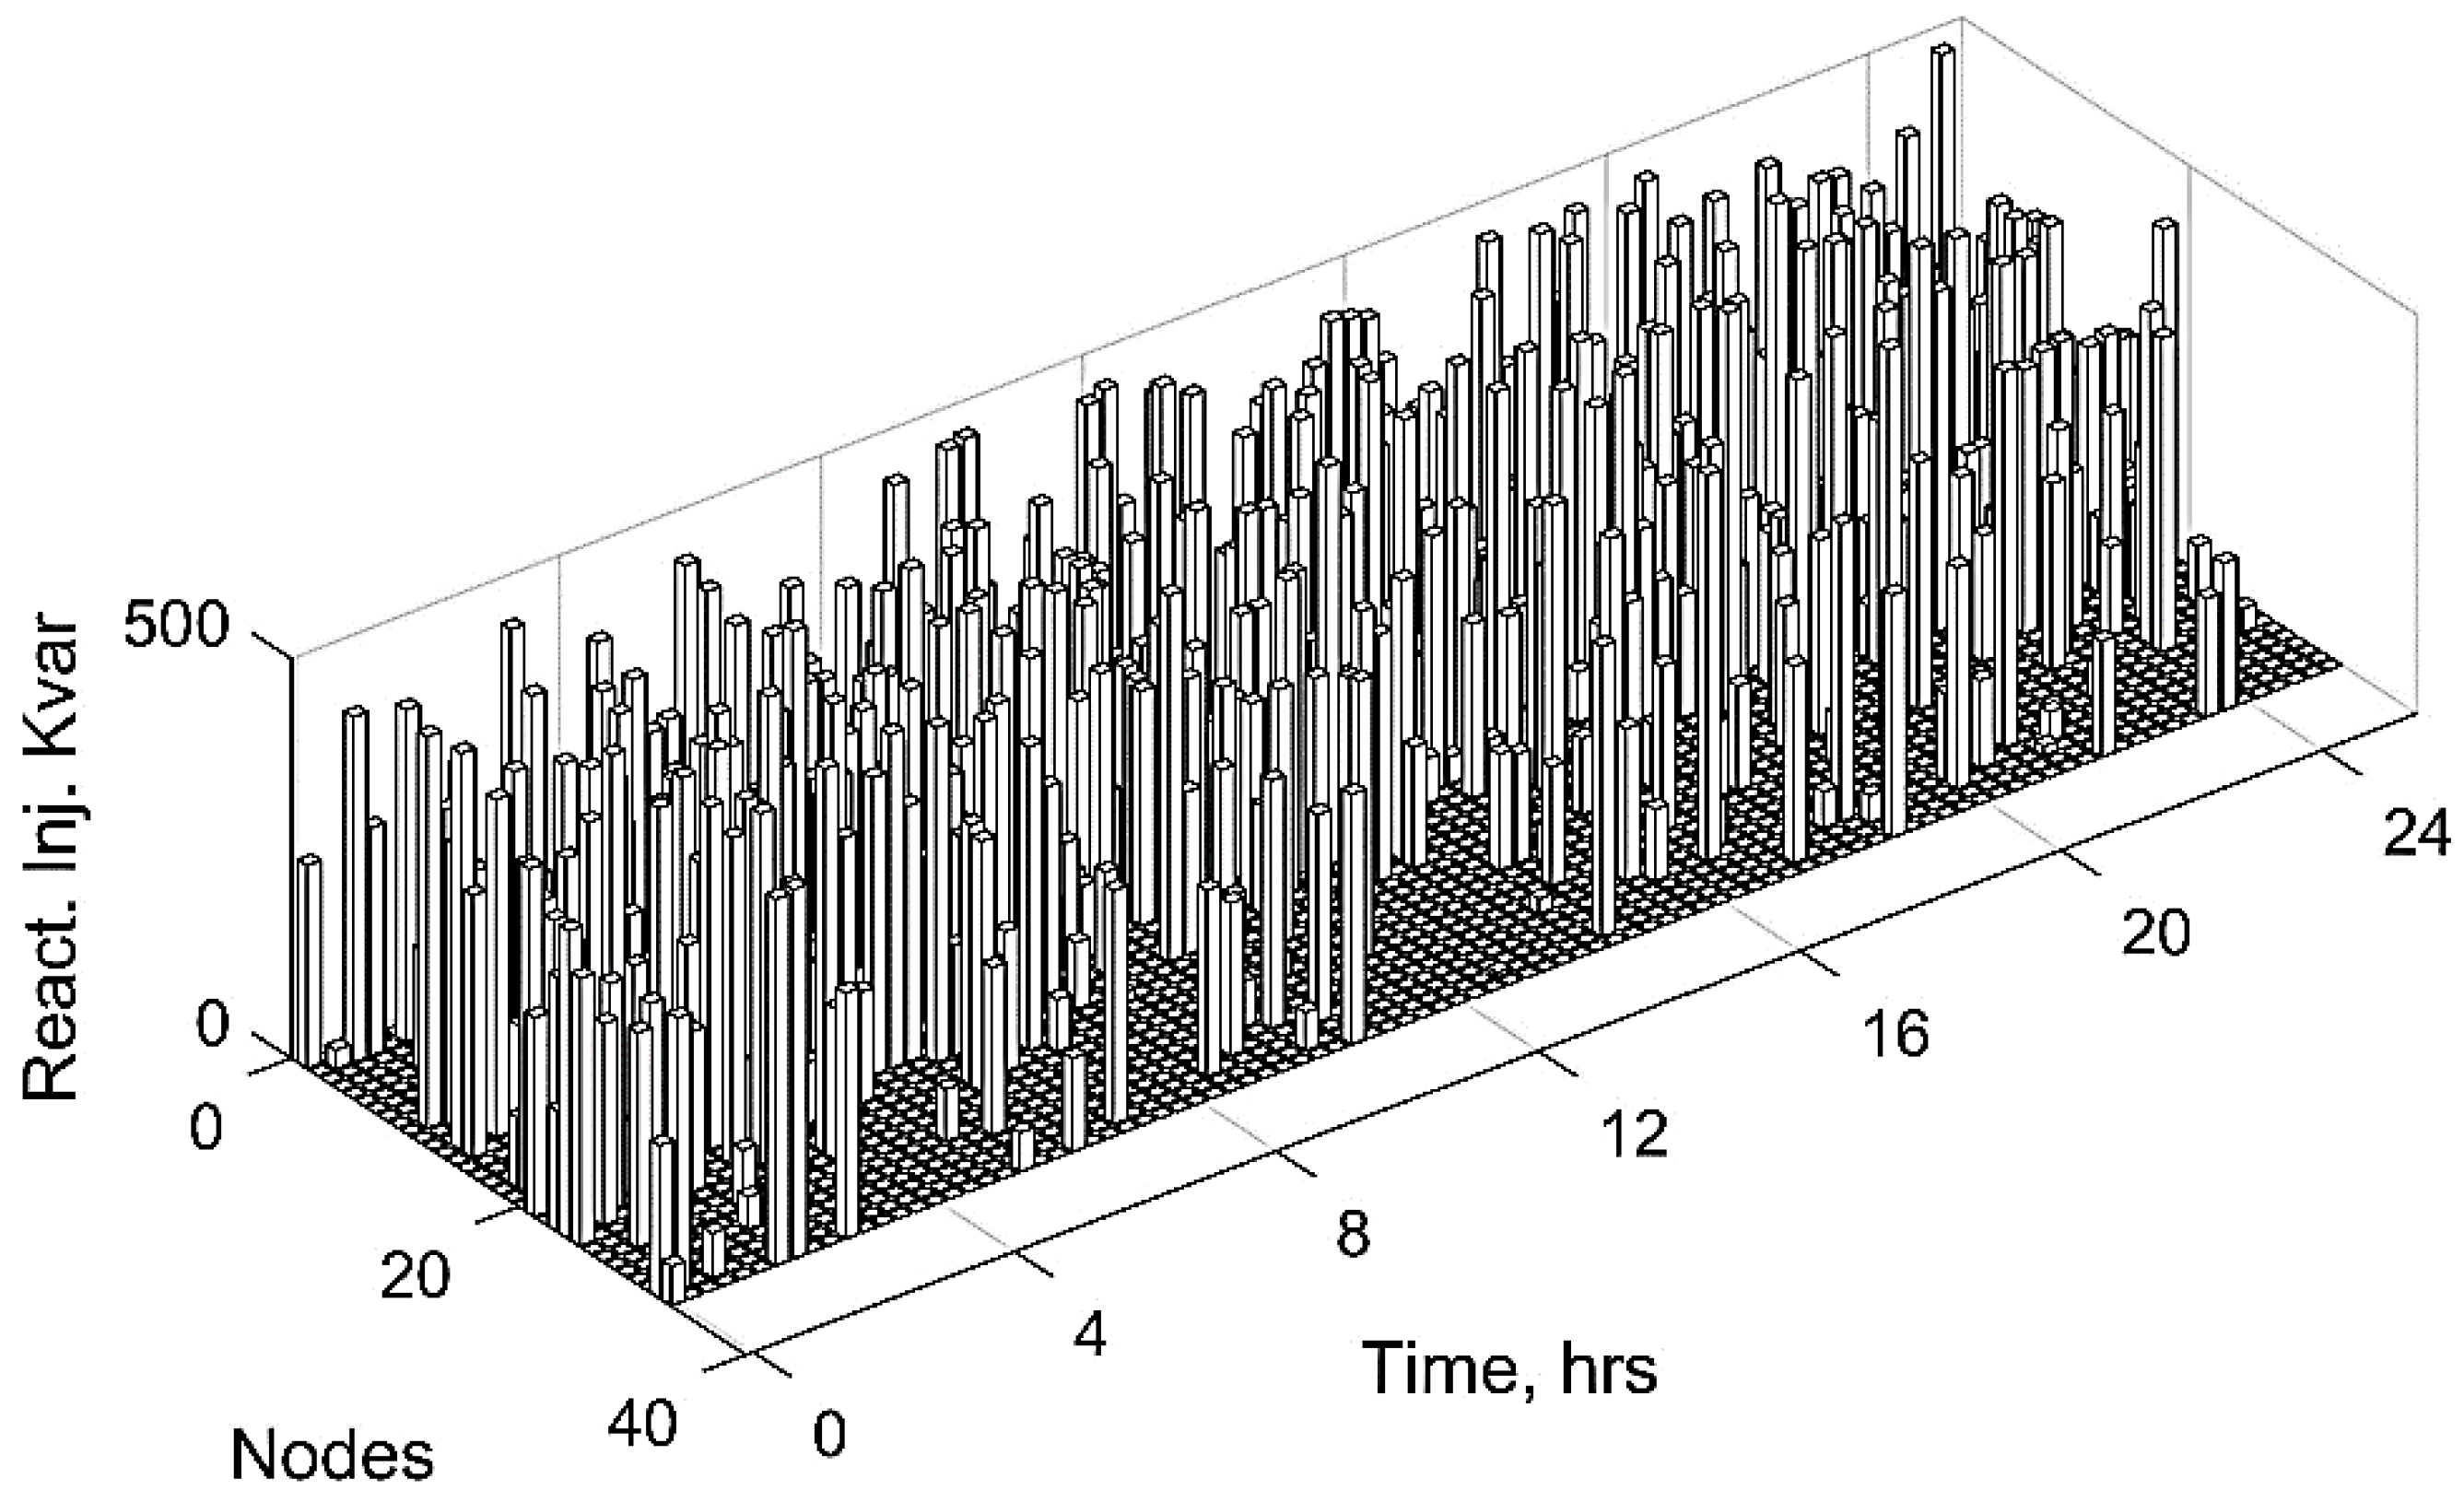
GA optimized nodes injection Q t , n ( k ) i n j nodes locations over 24 h are shown in Figure 8. Higher injection during 16–22 h is due to higher charging demand as shown in Figure 4. The resulting power loss P t i n j , L o s s is shown in Figure 6 and the voltage V t i n j is shown in Figure 7.

5. Minimum Spanning Tree (MST) Analysis

In power network Minimum Spanning Tree analysis, consider here the network used in Figure 1, which shows 32 sectional and five tie switches, totaling 37 switches. Given the branches’ power as Edges (E = 37) weights and vertices (V = 33) as nodes of minimum spanning tree graph G = (V, E), a radial network output ET (33,32) is given as a set of edges by eliminating those branches with the highest weights. The greedy Kruskal’s algorithm in MST eliminates cycles and maintains the radial structure of the network.

5.1. Branch Search for Maximum Flow

The edges weights are power P t , n E V in branches evaluated with B/F sweep analysis. A binary GA algorithm is used for randomly searching the tie ( t 1 : 5 i e ) switches combination together with sectional (s = 1 to 32) switches and MST evaluates minimum branch power. W(t,m = n + 5) is the power in branches with extra five tie branches.
W [ t , m ] = P t , n + 5 E V · r a n d p e r m m [ s 1 , s 2 , s 3 , s 4 , s 5 , s 6 s 32 , t 33 i e , t 35 i e , t 36 i e , t 37 i e ]

5.2. MST Power Flow Analysis

Charging EV power in Equation (4a) P n , t e v is summed over branches and evaluated with the B/F sweep method
P t = n = 2 32 P n , t E V
and optimized over spanning tree method for reconfiguration as
( t , E , V ) ( 32 , 33 ) = M i n S p a n T r e e ( t , W , N ) ( 36 , 33 )
Power flow analysis with a new configuration is carried out similar to Section 3 and Section 4. The total Power P t is evaluated below:
P t , n + 1 = P t , n + 1 + R n P t , n + 1 2 + Q t , n + 1 2 V n + 1 , t 2
Q t , n = Q [ n s e l i n j ] + Q t , n + 1 + X n P t , n + 1 2 + Q t , n + 1 2 V t , n + 1 2
P t = n = 2 32 P t , n and I t , n = c o n j ( P t , n + j · Q t , n ) V t , n where V n = 1 = 1   p . u . V t , n + 1 = V t , n I t , n · ( R n + j X n ) P t , n , L o s s = I t , n 2 · R n Q t , n , L o s s = I t , n 2 · j X n

5.3. MST Objective Function

The GA is used for branch power minimization with the objective function
f m i n , t = n N P t , n · m M n N λ t , n , m
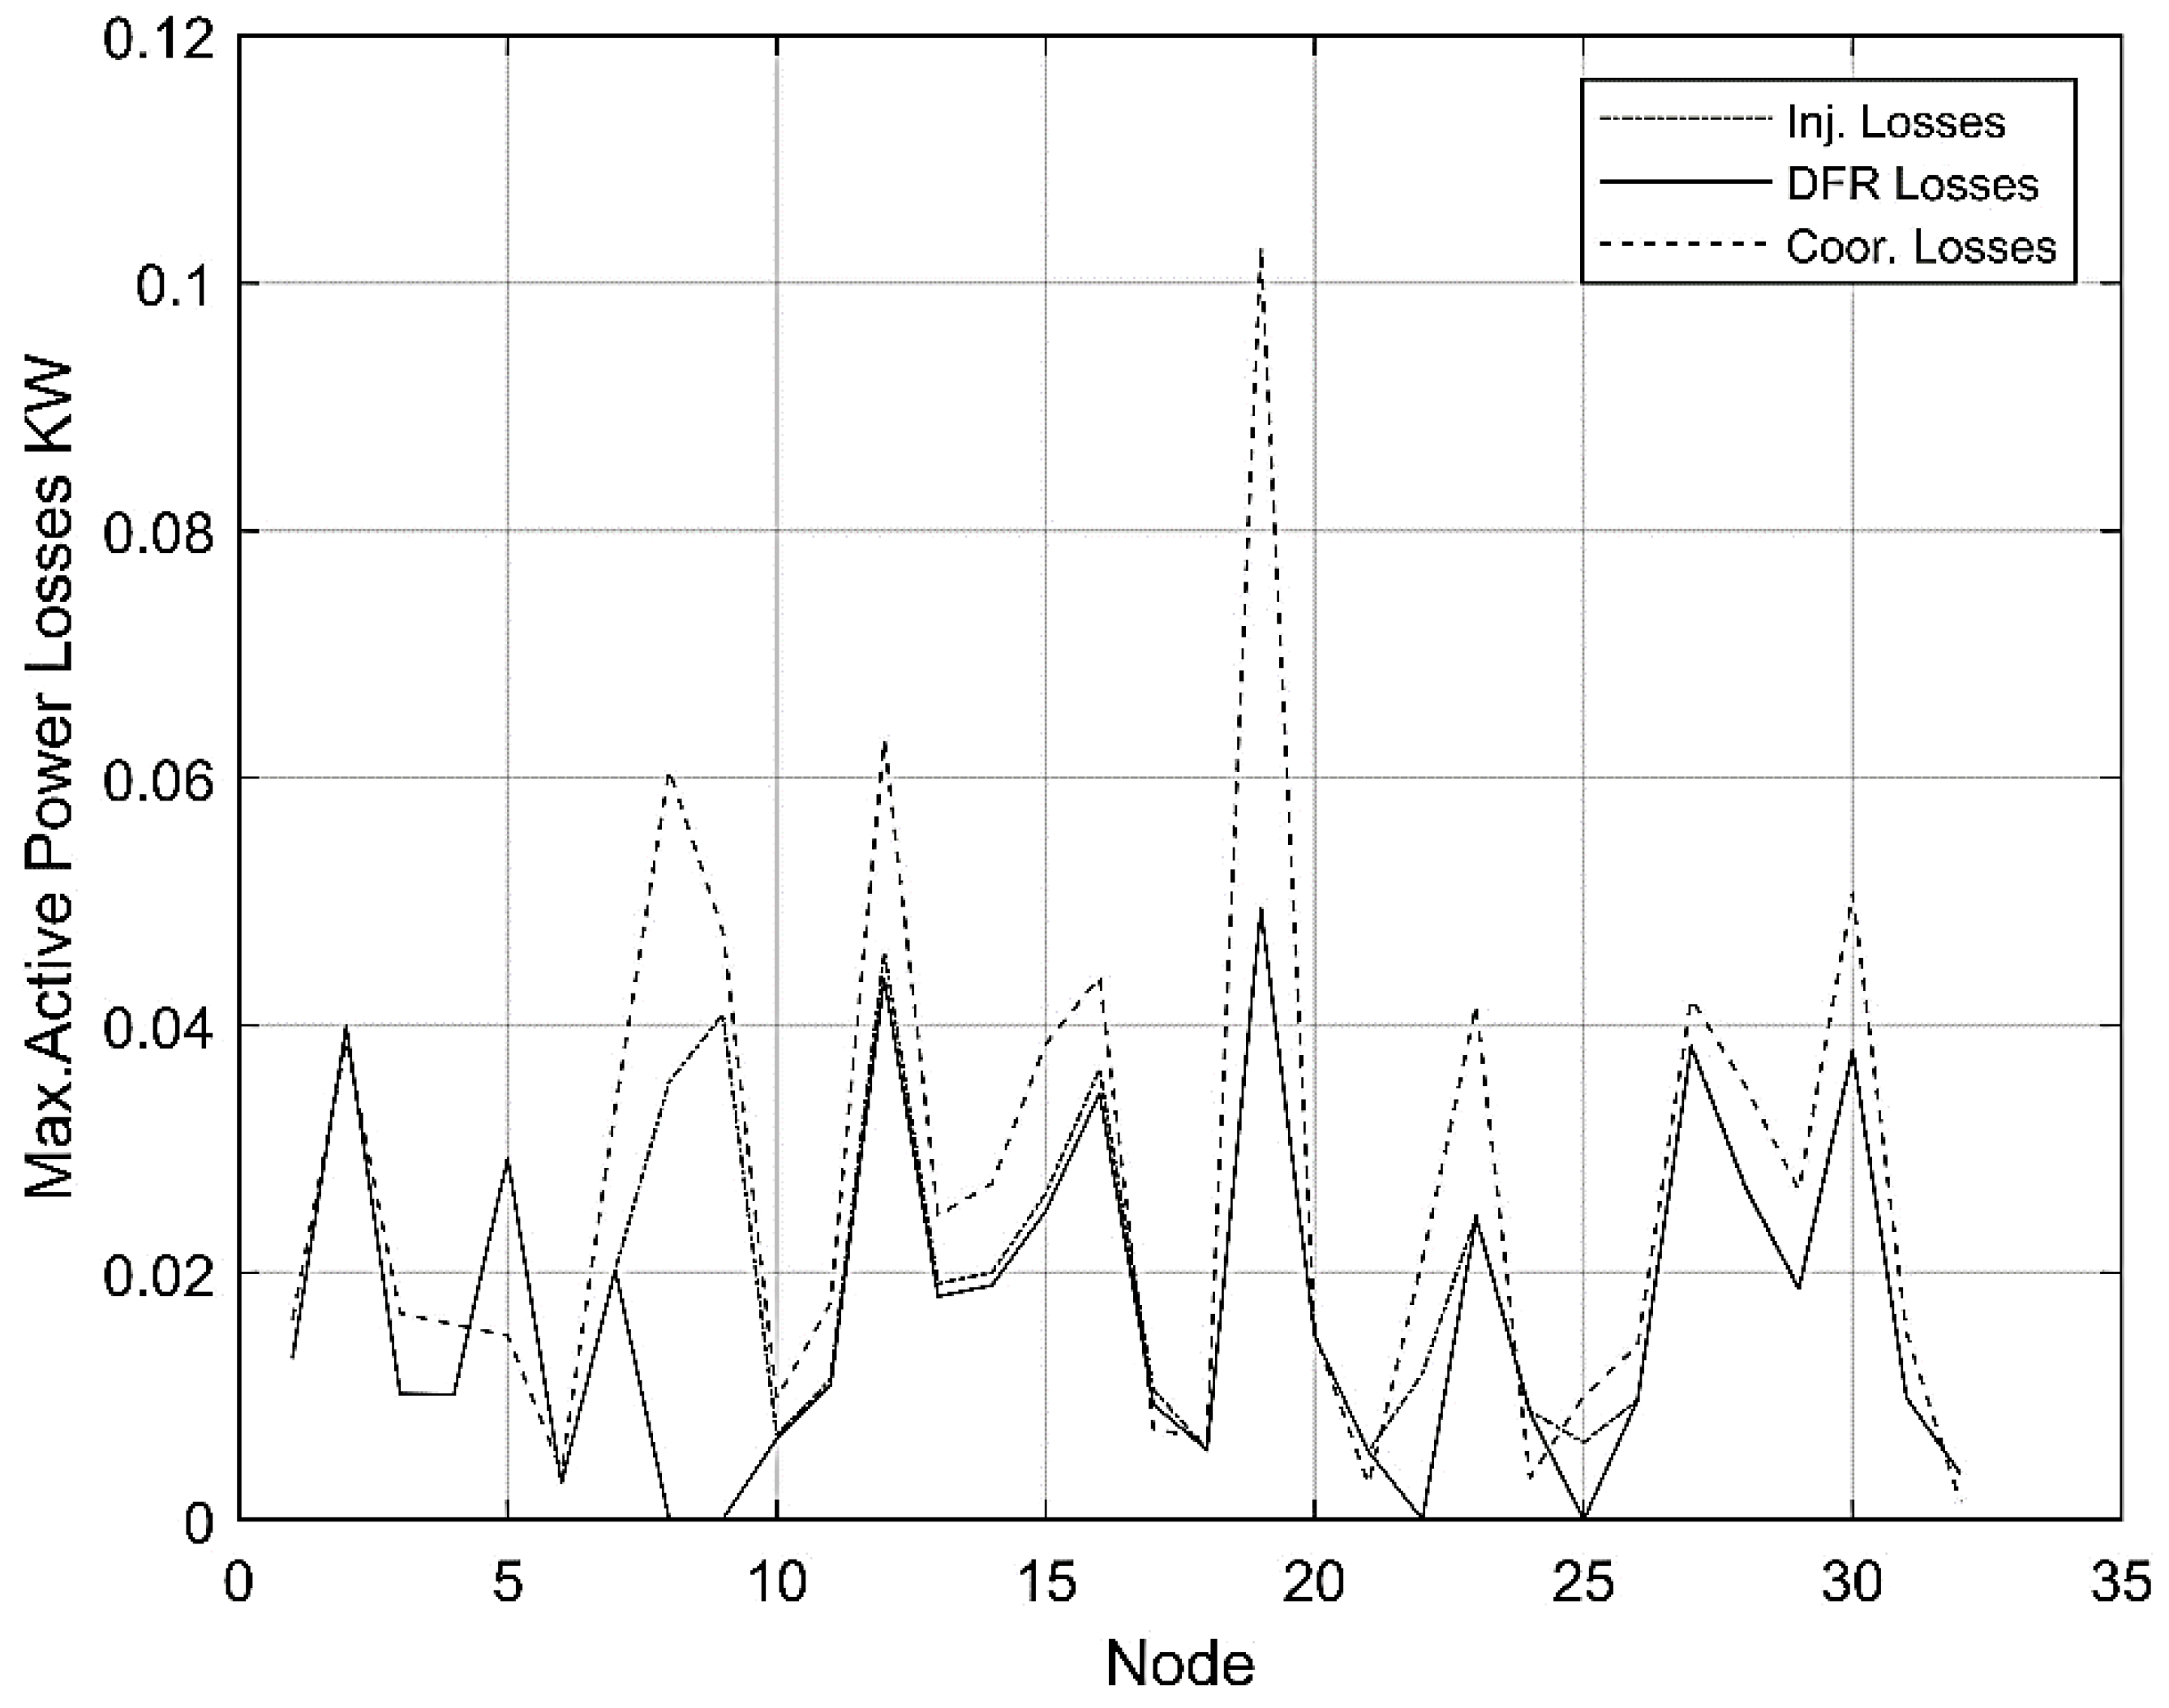
The objective function in Equation (32) is evaluated over 24 h at an interval of ∆t = 15 min. The map of tie and sectional switches status over 24 h period is shown in Figure 9. The Dark boxes are opened and the white boxes represent the closed switches. The most consistent opened (dark) sectional switches 14, 21, 22, and 28 closest to tie switches, are where the highest power losses have occurred, as can be seen in Figure 10. The total power loss P t , n , L o s s and voltage V t , n are shown in Figure 6 and Figure 7, respectively. The resulting total power loss P t , L o s s and average voltage V n are shown in Figure 6 and Figure 7, respectively.

6. Results and Analysis

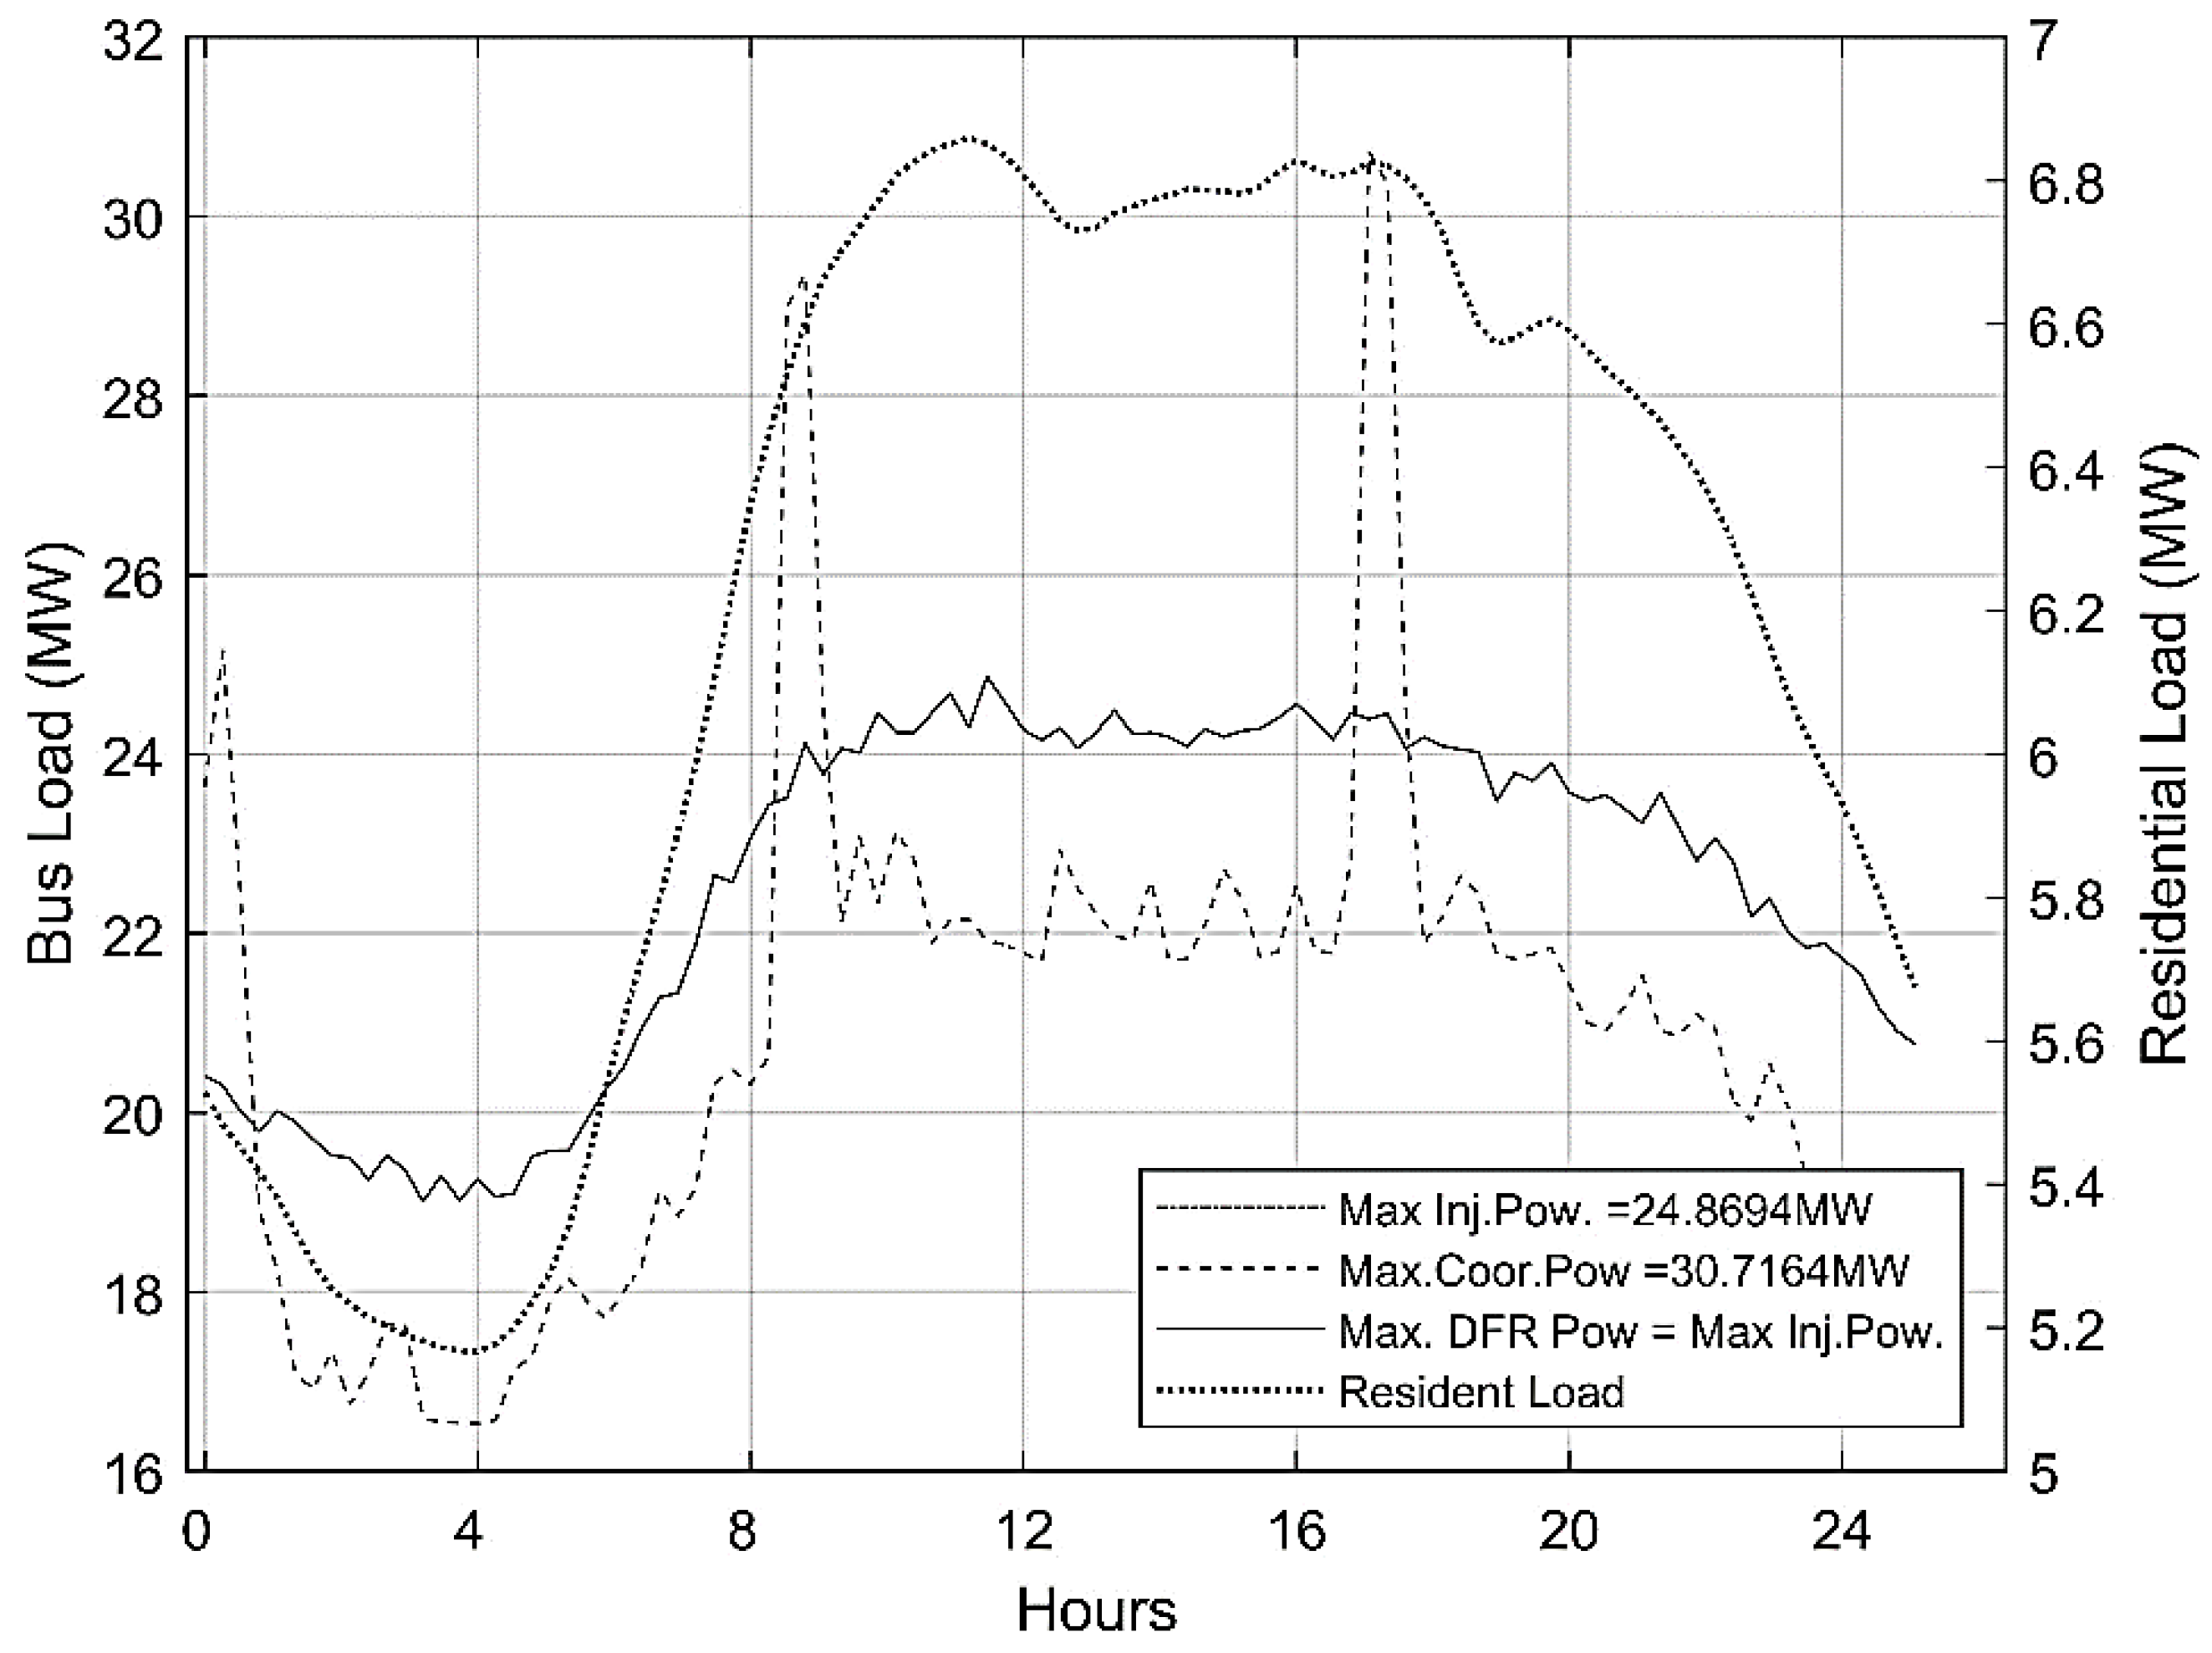
The large-scale simulation of 16 K EVs shows the lowest power losses and stable voltage with DFR analysis. The reactive injection power gives the second-best results. The coordinated analysis shows large peak losses in Figure 6 due to accumulated EV loads which are eliminated in reactive power injection and also in the DFR technique due to the selection of tie switches to avoid maximum power branches. The coordinated technique peak locations are visible in generation requirement and bus load in Figure 11 and Figure 12. However, the generation and cost of generation are lowest for coordinated technique as no additional power is utilized for stabilization. Total Power losses and generation cost comparison is presented in Table 3.

7. Conclusions

In conclusion, every technique has its merits and demerits. Coordinated analysis has the lowest cost but the least voltage stability since no other power compensation is used. Distributed feeder reconfiguration (DFR) gives better results with low power losses and greater voltage stability but at a higher cost than the coordinated technique. Reactive voltage injection has a higher cost due to injection but better voltage stability than the coordinated technique. The drawback of the injection technique is equipping all nodes for reactive injection voltage V2G. The advantage of DFR method is that nowadays smart grids are used with embedded switching control. Changing EV’s user driving pattern distribution in Equation (1), cost (λ), and local load profile in Figure 4, will help to locate the installation of EV charging stations where the EV load is highest in the network for system stability.

Author Contributions

Conceptualization, A.K.R. and M.M.; methodology, A.A. and S.K.A.; software, F.N., N.B. and S.K.A.; validation, A.A., A.K.R. and M.M.; formal analysis, F.N.; investigation, F.N., A.A. and S.K.A.; resources, M.M.; data curation, F.N., N.B. and A.K.R.; writing F.N., N.B. and A.A.; supervision, A.K.R. and M.M.; project administration, M.M.; funding acquisition, M.M. and A.K.R. All authors have read and agreed to the published version of the manuscript.

Funding

This research was funded by UNITEN BOLD, Project Code: J510050002/2021064, and The APC was funded by Universiti Tenaga Nasional (UNITEN) BOLD Publication Fund.

Data Availability Statement

Not applicable.

Conflicts of Interest

The authors declare no conflict of interest. The funders had no role in the design of the study; in the collection, analyses, or interpretation of data; in the writing of the manuscript, or in the decision to publish the results.

Appendix A

Table A1. IEEE 33 Bus Data.
No.SnRcResistanceReactance
1120.09220.0470
2230.49300.2511
3340.36600.1864
3340.36600.1864
4450.38110.1941
4560.81900.7070
6670.18720.6188
7780.71140.2351
8891.03000.7400
99101.04400.7400
1010110.19660.0650
1111120.37440.1238
1212131.46801.1550
1313140.54160.7129
1414150.59100.5260
1515160.74630.545
1616171.2891.721
1717180.7320.574
182190.1640.1565
1919201.50421.3554
2020210.40950.4784
2121220.70890.9373
223230.45120.3083
2323240.8980.7091
2424250.8960.7011
256260.2030.1034
2626270.28420.1447
2727281.0590.9337
2828290.80420.7006
2929300.50750.2585
3030310.97440.963
3131320.31050.3619
3232330.3410.5302
3382122
3491522
35221222
36183322
Table A2. IEEE 33 Bus Voltage Data.
Bus |VL||pu| θ deg|
20.9970.015
30.98290.097
40.97540.163
50.9680.23
60.94950.136
70.946−0.096
80.9323−0.249
90.926−0.324
100.9201−0.388
110.9192−0.38
120.9177−0.368
130.9115−0.462
140.9092−0.542
150.9078−0.58
160.9064−0.604
170.9044−0.683
180.9038−0.693
190.99650.004
200.9929−0.063
210.9922−0.083
220.9916−0.103
230.97930.066
240.9726−0.023
250.9693−0.067
260.94750.175
270.9450.232
280.93350.315
290.92530.393
300.92180.498
310.91760.413
320.91670.39
330.91640.383
34--
35--

References

  1. Shibo, L. Research on Distribution Network Voltage Regulation Strategy Adapting to Distributed Power Supply Access. Master’s Thesis, Shandong University of Technology, Zibo, China, April 2013. [Google Scholar]
  2. Li, Y.W. Smart Grid and its Application. Adv. Mater. Res. 2014, 986–987, 533–536. [Google Scholar] [CrossRef]
  3. Kotenev, V.I.; Kochetkov, V.V.; Elkin, D.A. The Reactive Power Control of the Power System Load Node at the Voltage Instability of the Power Supply. In Proceedings of the 2017 International Siberian Conference on Control and Communications, SIBCON, Astana, Kazakhstan, 29–30 June 2017; pp. 3–6. [Google Scholar]
  4. Meng, Q.; Che, R.; Gao, S. Reactive Power and Voltage Optimization Control Strategy in Active Distribution Network Based on the Determination of the Key Nodes. In Proceedings of the 2017 2nd Asia Conference on Power and Electrical Engineering (ACPEE 2017), Shanghai, China, 24–26 March 2017. [Google Scholar]
  5. Zechun, H.; Mingming, Z. Optimal Reactive Power Compensation for Medium and Low Voltage Distribution Network Considering Multiple Load Levels. Trans. China Electrotech. Soc. 2010, 25, 167–172. [Google Scholar]
  6. Liu, C.; Zhang, Y. Confirmation of Reactive Power Compensation Node and Its Optimal Compensation Capacity. Power Syst. Technol. 2007, 31, 78–81. [Google Scholar]
  7. Singh, J.; Tiwari, R. Electric Vehicles Reactive Power Management and Reconfiguration of Distribution System to Minimize Losses. IET Gener. Transm. Distrib. 2020, 14, 6285–6293. [Google Scholar] [CrossRef]
  8. Baran, M.E.; Wu, F.F. Network Reconfiguration in Distribution Systems for Loss Reduction and Load Balancing. IEEE Power Eng. Rev. 1989, 9, 101–102. [Google Scholar] [CrossRef]
  9. Zhang, C.-X.; Zeng, Y. Voltage and Reactive Power Control Method for Distribution Grid. In Proceedings of the 2013 IEEE PES Asia-Pacific Power and Energy Engineering Conference (APPEEC), Hong Kong, China, 8–11 December 2013. [Google Scholar]
  10. Rostami, M.-A.; Kavousi-Fard, A.; Niknam, T. Expected Cost Minimization of Smart Grids with Plug-In Hybrid Electric Vehicles Using Optimal Distribution Feeder Reconfiguration. IEEE Trans. Ind. Inform. 2015, 11, 388–397. [Google Scholar] [CrossRef]
  11. Cui, H.; Li, F.; Fang, X.; Long, R. Distribution Network Reconfiguration with Aggregated Electric Vehicle Charging Strategy. In Proceedings of the 2015 IEEE Power & Energy Society General Meeting, Denver, CO, USA, 26–30 July 2015; pp. 1–5. [Google Scholar] [CrossRef]
  12. Ravibabu, P.; Venkatesh, K.; Kumar, C.S. Implementation of Genetic Algorithm for Optimal Network Reconfiguration in Distribution Systems for Load Balancing. In Proceedings of the 2008 IEEE Region 8 International Conference on Computational Technologies in Electrical and Electronics Engineering, Novosibirsk, Russia, 21–25 July 2008; pp. 124–128. [Google Scholar]
  13. Melo, D.F.R.; Leguizamon, W.; Massier, T.; Gooi, H.B. Optimal Distribution Feeder Reconfiguration for Integration of Electric Vehicles. In Proceedings of the 2017 IEEE PES Innovative Smart Grid Technologies Conference—Latin America (ISGT Latin America), Quito, Ecuador, 20–22 September 2017; pp. 1–6. [Google Scholar] [CrossRef]
  14. Oliveira, L.W.; Oliveira, E.J.; Silva, I.C.; Gomes, F.V.; Borges, T.T.; Marcato, A.L.M.; Oliveira, Â.R. Optimal Restoration of Power Distribution System through Particle Swarm Optimization. In Proceedings of the 2015 IEEE Eindhoven PowerTech, Eindhoven, The Netherlands, 29 June–2 July 2015. [Google Scholar]
  15. Montoya, D.P.; Ramirez, J.M. A Minimal Spanning Tree Algorithm for Distribution Networks Configuration. In Proceedings of the 2012 IEEE Power and Energy Society General Meeting, San Diego, CA, USA, 22–26 July 2012; pp. 1–7. [Google Scholar]
  16. Mohamad, H.; Zalnidzham, W.I.F.W.; Salim, N.A.; Shahbudin, S.; Yasin, Z.M. Power system restoration in distribution network using minimum spanning tree—Kruskal’s algorithm. Indones. J. Electr. Eng. Comput. Sci. 2019, 16, 1–8. [Google Scholar] [CrossRef]
  17. Sudhakar, T.D.; Srinivas, K.N. Power System Reconfiguration Based on Prim’s Algorithm. In Proceedings of the 1st International Conference on Electrical Energy Systems, Chennai, India, 3–5 January 2011; pp. 12–20. [Google Scholar]
  18. Krushal, J.B., Jr. On the shortest spanning subtree of a graph and traveling salesman problem. Proc. Am. Math. Soc. 1956, 7, 48–50. [Google Scholar] [CrossRef]
  19. Shafiee, S.; Fotuhi-Firuzabad, M.; Rastegar, M. Investigating the Impacts of Plug-In Hybrid Electric Vehicles on Distribution Congestion. In Proceedings of the 22nd International Conference on Electricity Distribution, Stockholm, Sweden, 10–13 June 2013; pp. 1–10. [Google Scholar]
  20. Tomić, J.; Kempton, W. Using fleets of electric-drive vehicles for grid support. J. Power Sources 2007, 168, 459–468. [Google Scholar] [CrossRef]
  21. He, Y.; Venkatesh, B.; Guan, L. Optimal scheduling for charging and discharging of electric vehicles. IEEE Trans. Smart Grid 2012, 3, 1095–1105. [Google Scholar] [CrossRef]
  22. Han, S.; Han, S.; Sezaki, K. Development of an optimal vehicle-to-grid aggregator for frequency regulation. IEEE Trans. Smart Grid 2010, 1, 65–72. [Google Scholar]
  23. Yong, J.Y.; Ramachandaramurthy, V.K.; Tan, K.M.; Mithulananthan, N. Bi-directional electric vehicle fast-charging station with novel reactive power compensation for voltage regulation. Int. J. Electr. Power Energy Syst. 2015, 64, 300–310. [Google Scholar] [CrossRef]
  24. Clairand, J.M.; Rodríguez-García, J.; Álvarez-Bel, C. Smart Charging for Electric Vehicle Aggregators Considering Users’ Preferences. IEEE Access 2018, 6, 54624–54635. [Google Scholar] [CrossRef]
  25. Rupa, J.A.M.; Ganesh, S. Power flow analysis for radial distribution system Using Backward/Forward Sweep Method. Int. J. Electr. Comput. Eng. 2014, 8, 1628–1632. [Google Scholar]
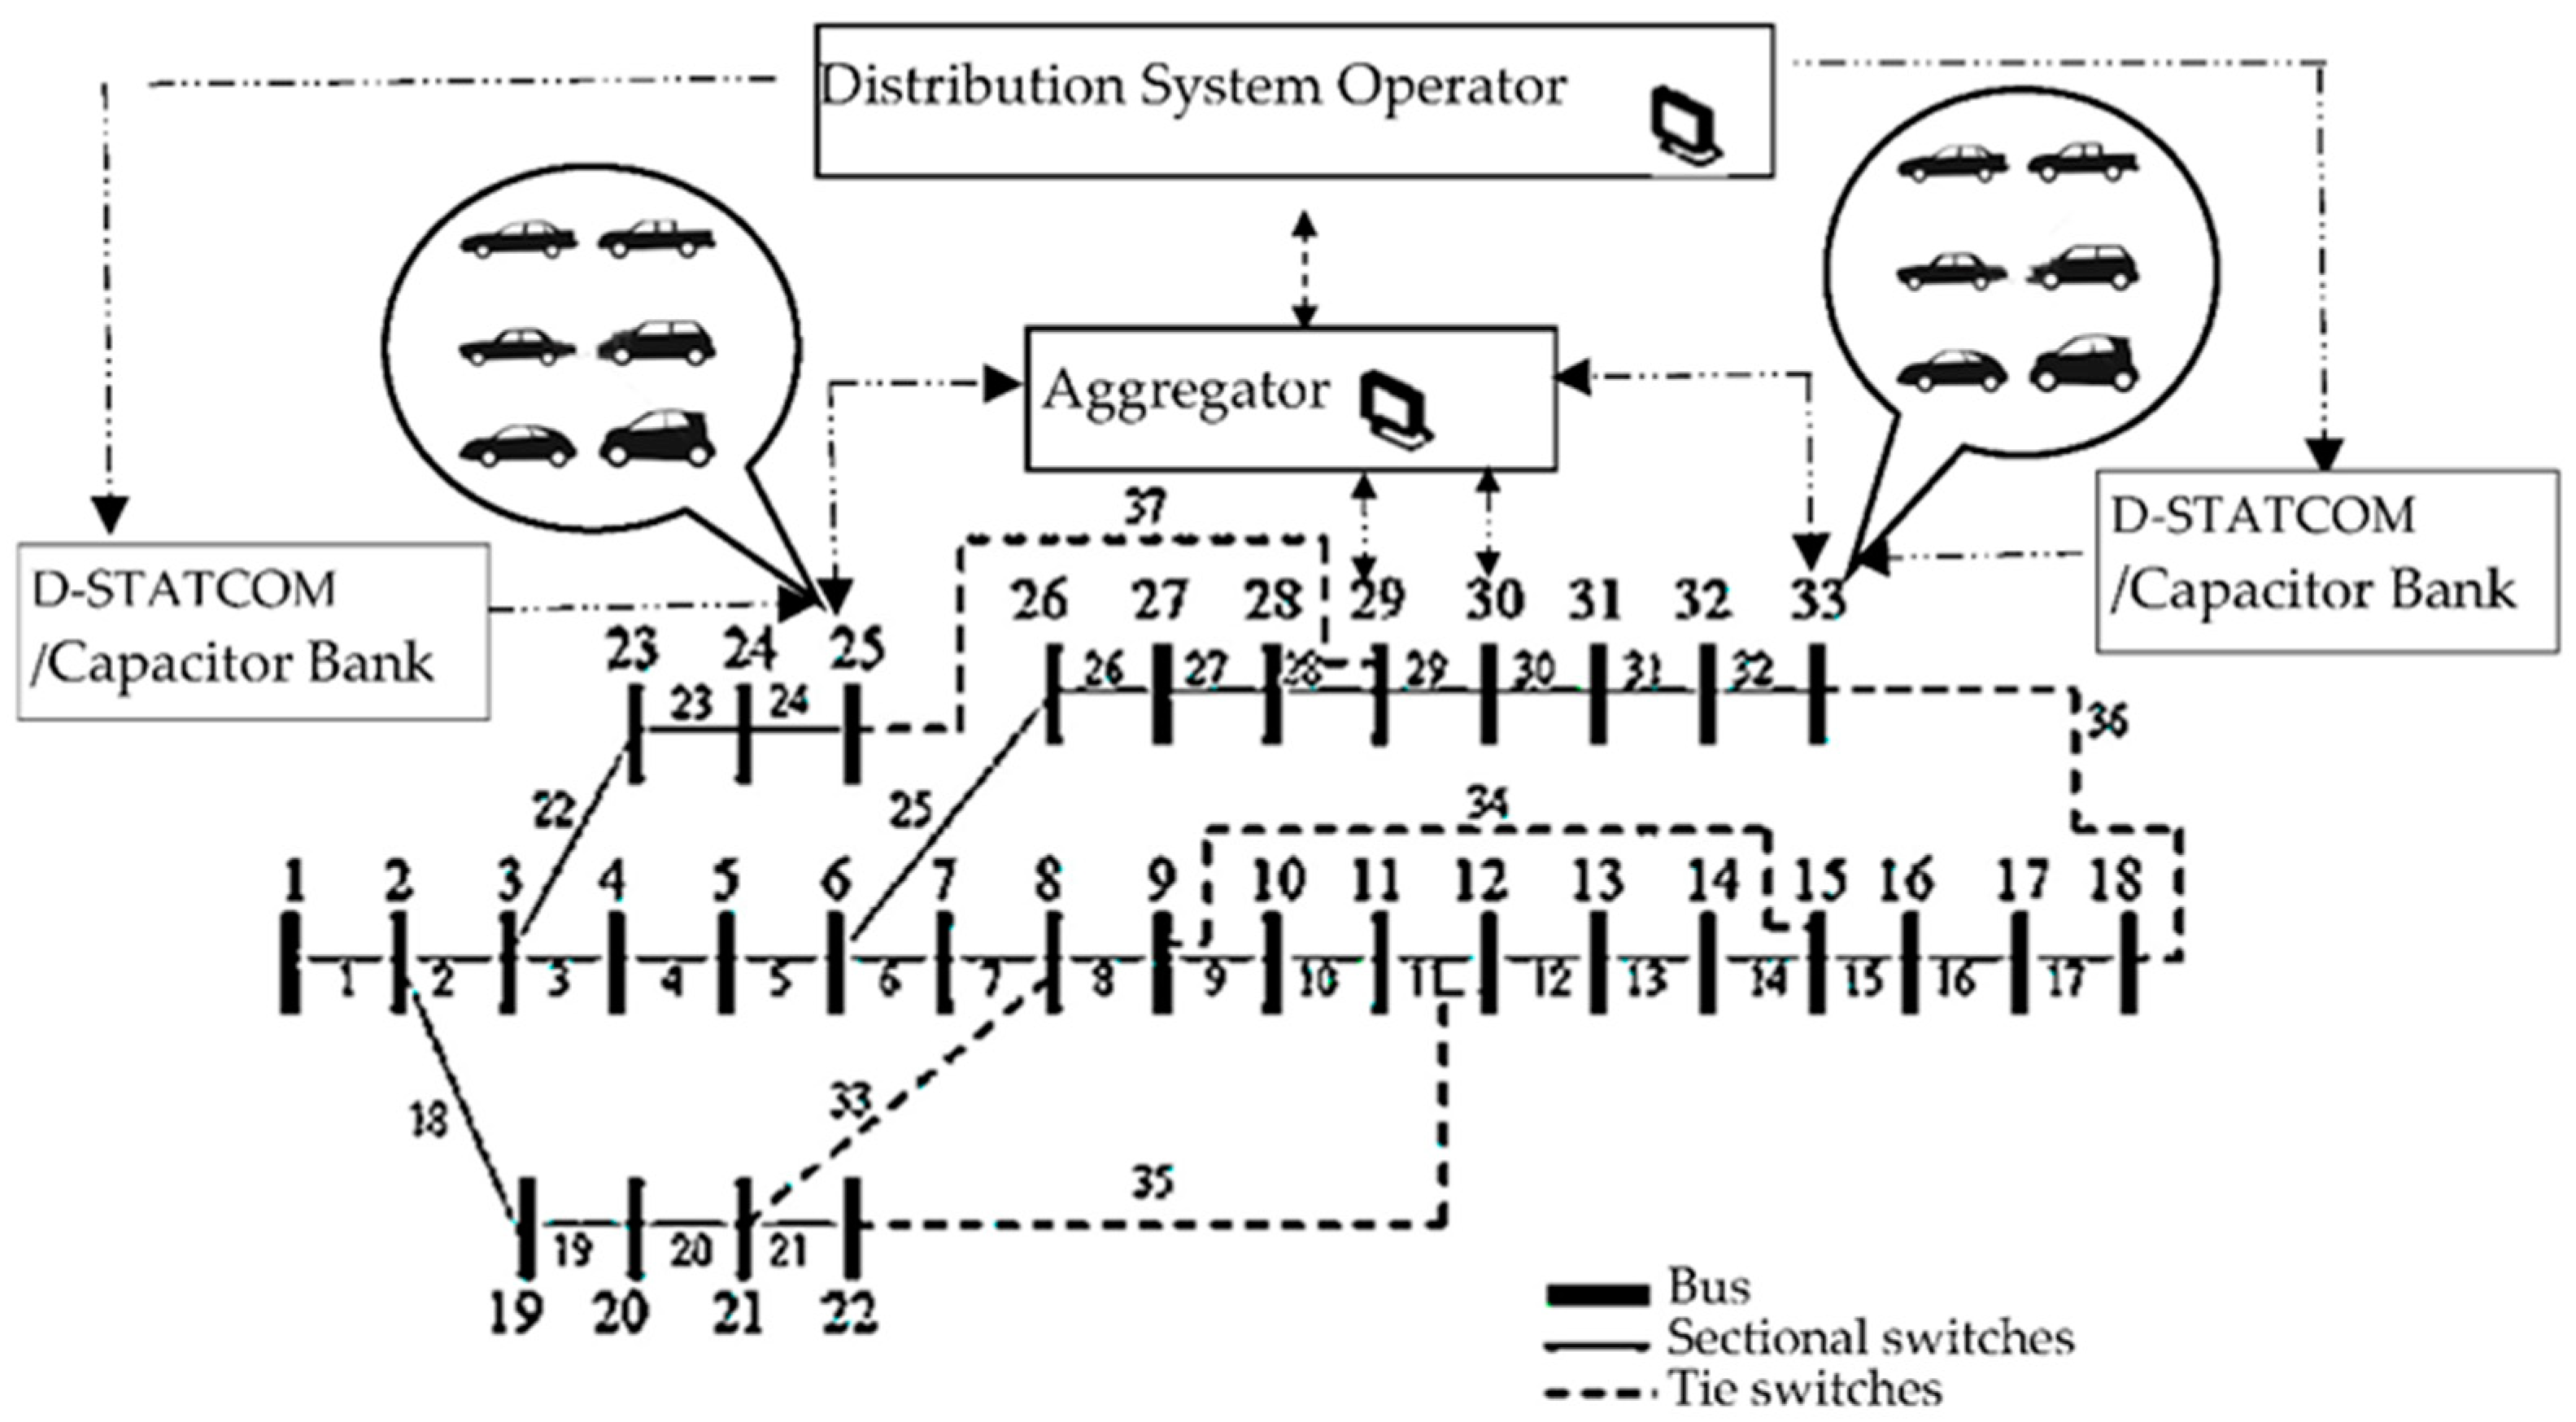
Figure 1. IEEE 33 radial bus network with EV aggregator chargers, Distributed Operator (DSO) and reactive power compensators.
Electronics 11 03221 g001
Figure 2. Numerical Computation Analysis flow chart.
Electronics 11 03221 g002
Figure 3. Weibull density probability for EV charging energy requirement.
Electronics 11 03221 g003
Figure 4. Charging start time histogram for 16 K EVs.
Electronics 11 03221 g004
Figure 5. Daily load profile P t r e s d and cost of electricity λ t .
Electronics 11 03221 g005
Figure 6. Total power losses comparison of three techniques.
Electronics 11 03221 g006
Figure 7. Voltage (p.u.) comparison of three techniques.
Electronics 11 03221 g007
Figure 8. Reactive power injection node locations and magnitude.
Electronics 11 03221 g008
Figure 9. Tie and Sectional switches status. Dark and white boxes represent open and closed switches, respectively.
Electronics 11 03221 g009
Figure 10. Power losses comparison of three techniques at nodes.
Electronics 11 03221 g010
Figure 11. Generation requirements and cost comparison for three techniques.
Electronics 11 03221 g011
Figure 12. Bus loads comparison for three techniques.
Electronics 11 03221 g012
Table 1. Network and EV Parameters.
Load (PQ) nodes, N32
EV per node, M500/node
EV Charging Rate, P c h 14.4 KW
Average EV Charge, P a v g 9.2 KW
Slack node 1 (PV) (Single Feeder)7 MW
EV charger Power Factor, pf0.74–0.98
Timestamp ∆t = 15 min96 min
Total EVs (m.n)16,000
No. of Reactive Power Injection nodes5
Base MVA1000
Table 2. Mixed Integer Genetic Algorithm Parameters.
No. of Integers5
No. of generations20
Population Size32
Population Type“custom”
Create_Permutation fun.Randi ([0 500],32,1)
No. Iteration96
Solution Convergence ‘TolCon’10−8
Table 3. Power Losses and Cost Comparison.
No.EV + Base Load AnalysisOptimizationTotal Power Losses KWGen. Cost $
(1000)
Min. Voltage p.u.
1CoordinatedMILP8684000.8
2InjectionMixed Int. GA6524310.84
3DFRMST *—GA5464290.87
* Minimum Span Tree.
Publisher’s Note: MDPI stays neutral with regard to jurisdictional claims in published maps and institutional affiliations.