Article

Demonstration of the Capability of 1U CubeSat for Measurement of the Energy Spectrum on LEO

1
Faculty of Electrical Engineering, Czech Technical University in Prague, 166 27 Prague, Czech Republic
2
Department of Physics, Oklahoma State University, Stillwater, OK 74078, USA
*
Author to whom correspondence should be addressed.
These authors contributed equally to this work.
Electronics 2022, 11(20), 3390; https://doi.org/10.3390/electronics11203390
Submission received: 30 September 2022 / Revised: 14 October 2022 / Accepted: 17 October 2022 / Published: 20 October 2022

Abstract

:
The goal of this paper is to demonstrate the capability of the 1U CubeSat to study the radiation spectra on LEO. The research was realized by the Lucky-7 mission with the primary goal of testing electronics such as a power supply, piNAV L1 GPS receiver, UHF communication system, and other subsystems in the natural space environment, and the secondary goal of testing the possibility of using 1U CubSat class satellites for scientific tasks. The satellite is equipped with a piNAV GPS receiver and piDOSE radiation detector, silicon diode radiation spectrometer, camera, and other sensors. The on-board computer enables storage of 34 h of measurements of the radiation spectrum. These measurements can be downloaded by the UHF communication system during four satellite passes over the monitoring ground station. We successfully verified all necessary instruments and their cooperation and measurement procedure. The UHF communication was identified as the most critical subsystem because of its low capacity, which slowed down the satellite operation. We needed four zenith passes to upload 34 h of measurement.

1. Introduction

CubeSats [1] are small satellites that enable universities, small companies, and even amateur designers to develop, launch, and operate their own satellites for education or research purposes. A reasonably low price is achieved by the small size and mass of the satellite and by a simplified satellite qualification testing for space flight thanks to a robust deployer [2] that isolates the satellite from the primary payload during launch.
CubeSat scientific applications cover wide areas of physical measurement, remote sensing, and technical experiments including radio navigation [3], radio and optical communication [4,5], air and marine traffic monitoring [6,7], Internet of Things (IoT) [8], and many others.
Another application of CubeSats is the study of satellite propulsion, such as solar sails, cold gas propulsion, electric propulsion, and chemical propulsion [9].
CubeSat research also extends to the area of telecommunications [10], covering, for example, the monitoring of the radio frequency spectra and radiocommunication services performance and quality, and these observations can be used to obtain a comparison between individual covered regions.
Space radiation has been measured since the beginning of space exploration [11]. The first US satellite equipped with a radiation monitor contributed to the exploration of the van Allen radiation belt in 1958. Radiation not only negatively affects the healing of astronauts [12], but it also has a negative impact on the satellite electronics [13,14] and it causes the degradation of some materials. Radiation has been routinely measured by many space missions.
Great effort is devoted to measuring radiation by the CubeSats. Many miniaturized radiation detectors and spectrometers have been developed, and many CubeSat missions have planned such measurements.
CubeSat examples include the Aalto-1 CubeSat equipped with a Radiation Monitor (RADMON) for study of the radiation field in Low Earth Orbit (LEO) [15]. The RADMON registers protons of energies 10–200 MeV and electrons of energies 0.7–10 MeV [16].
A similar device, the open source dosimeter SPACEDOS, provides similar measurements as those used in AIRDOS radiation monitoring devices, but is redesigned for use in small satellites and was developed at the Nuclear Physics Institute of the Czech Academy of Sciences [17]. The device covers an energy range from 0.2 MeV to 9 MeV.
The recording and study of Terrestrial Gamma-ray Flashes (TGF) is an actual scientific problem that is usually solved by a standard satellite because of the requirement on the high detector sensitivity that is reached by a large scintillator. The paper [18] investigates the requirements of such detectors and solves their installation to the space-limited CubeSats.
It is evident from the discussion above that suitable radiation spectrometers and detectors were successfully designed, and the CubeSats missions were planned and realized, but the lack of scientific papers with presented real results implies the high complexity of the problem.
This paper aims to verify the capability of the 1U CubeSat to realize the measurement of the radiation spectra. This is in contrast to our previous paper in which we tested the functionality of the GPS receiver [19] and performed less complex dosimetry measurement with low volume of the used data without deeper evaluation [20,21].
The rest of this paper is organized as follows. In the Section 2, we introduce the Lucky-7 CubeSat and its subsystems. The Section 3 presents and discusses the measured data. The Section 4 presents the conclusions of this work.

2. Materials and Methods

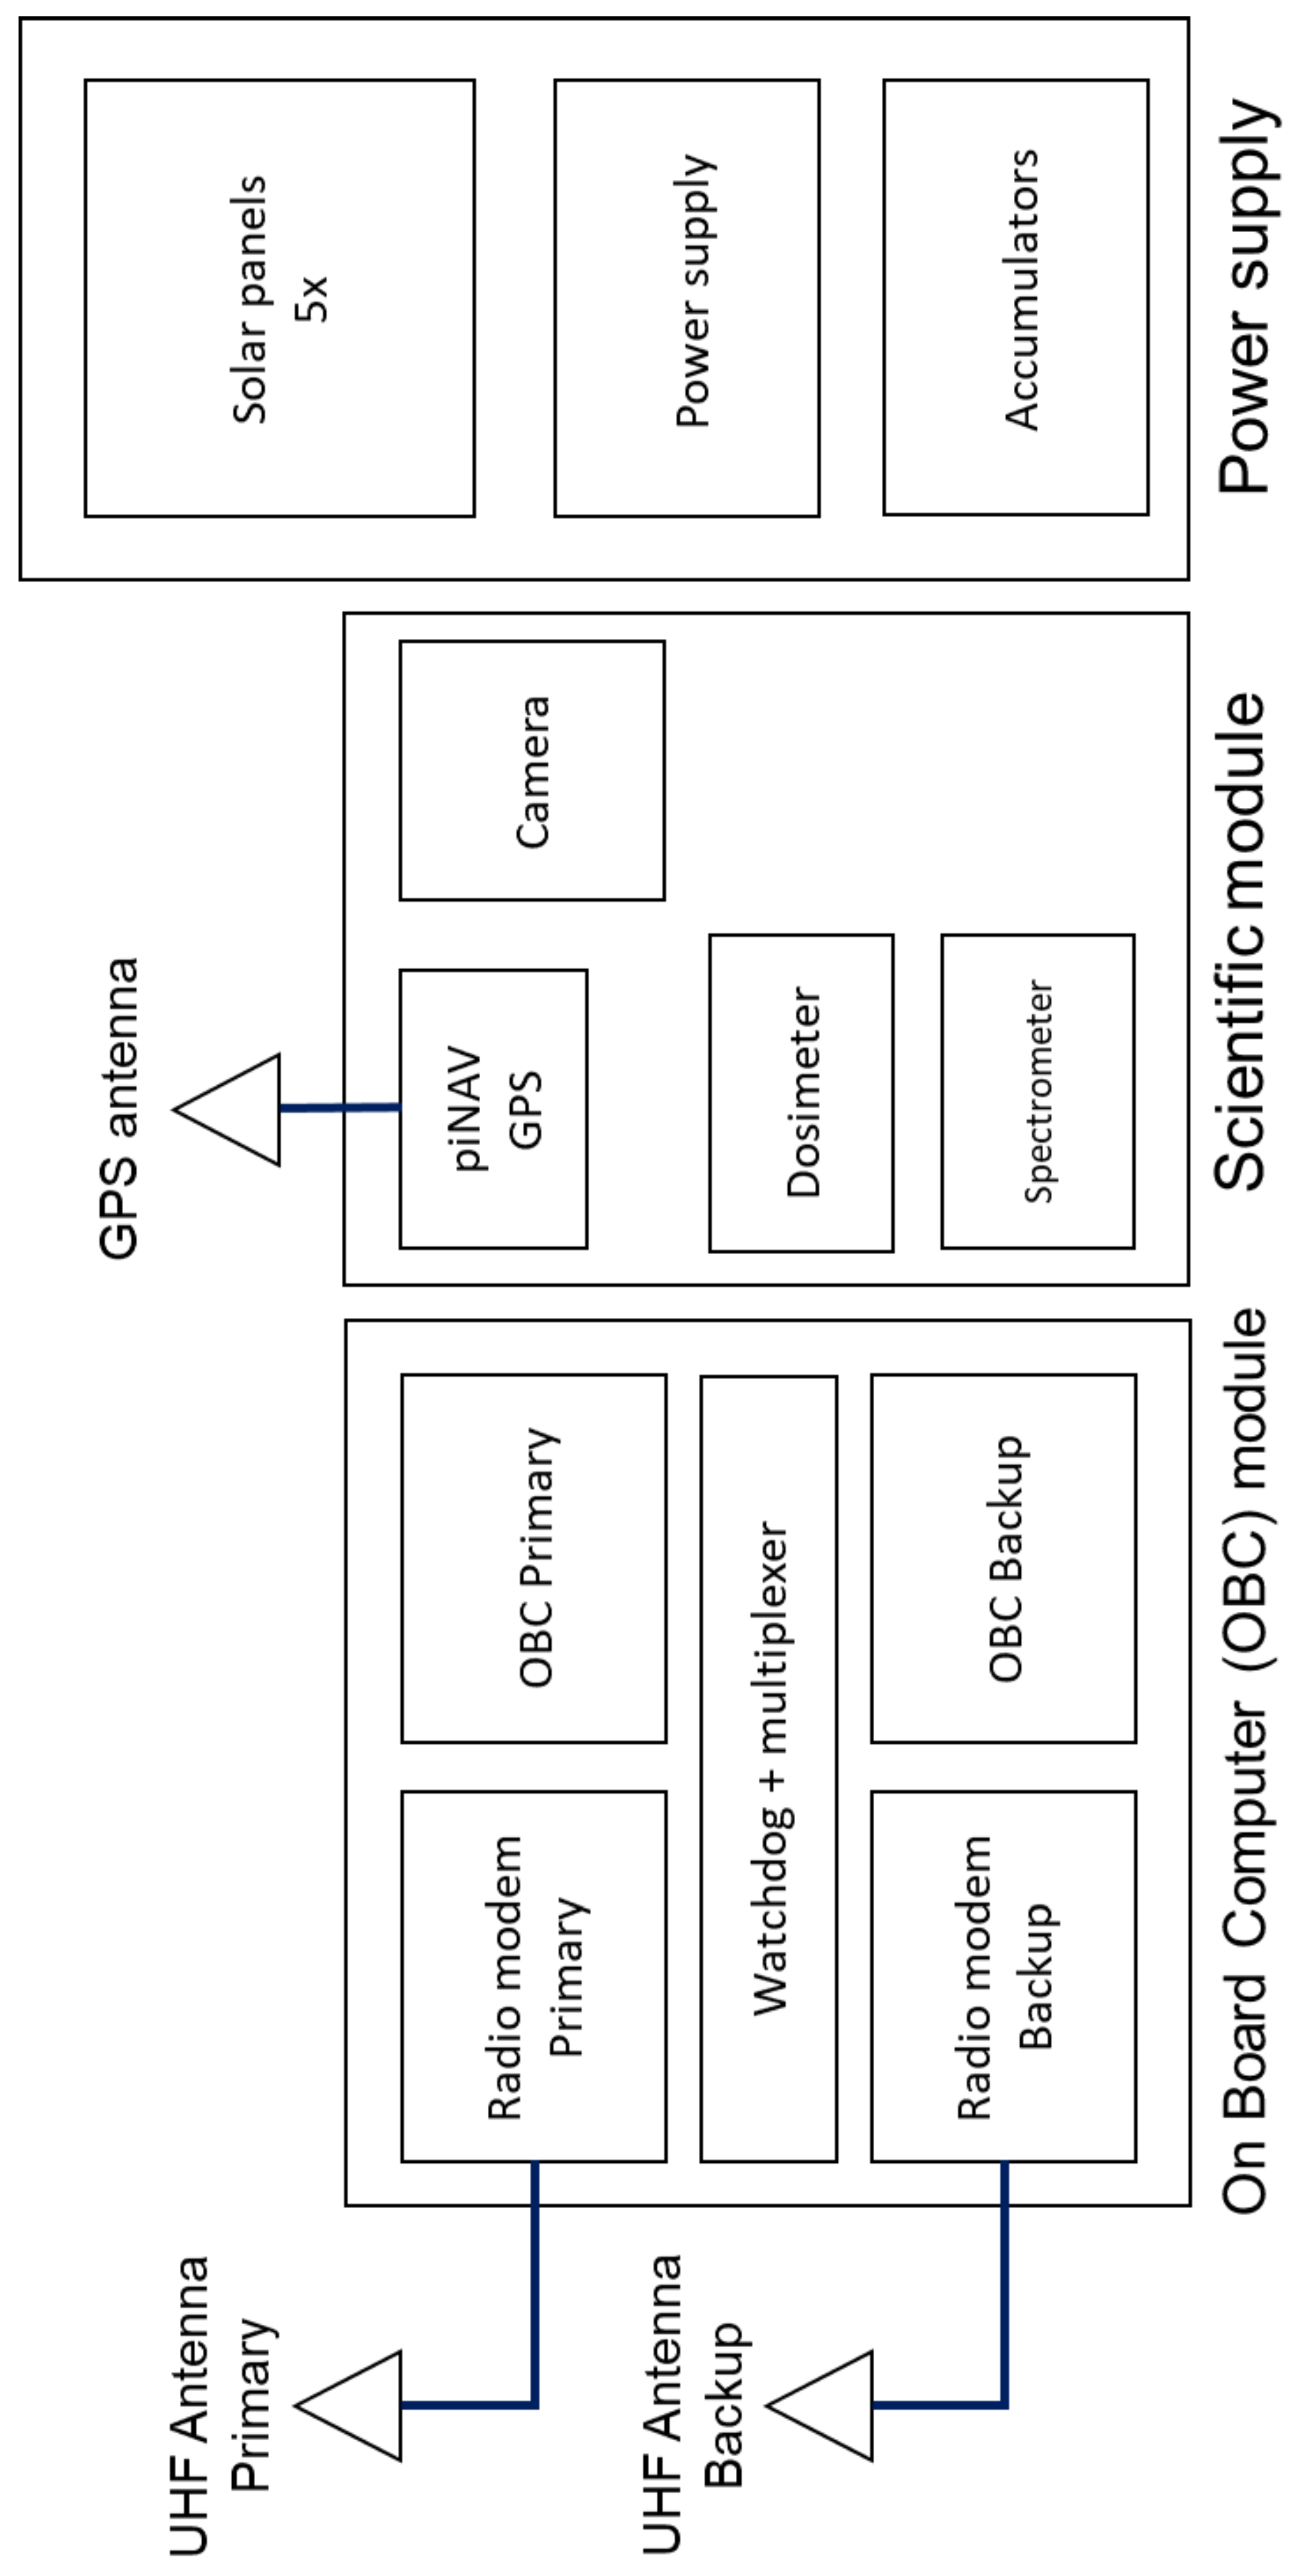
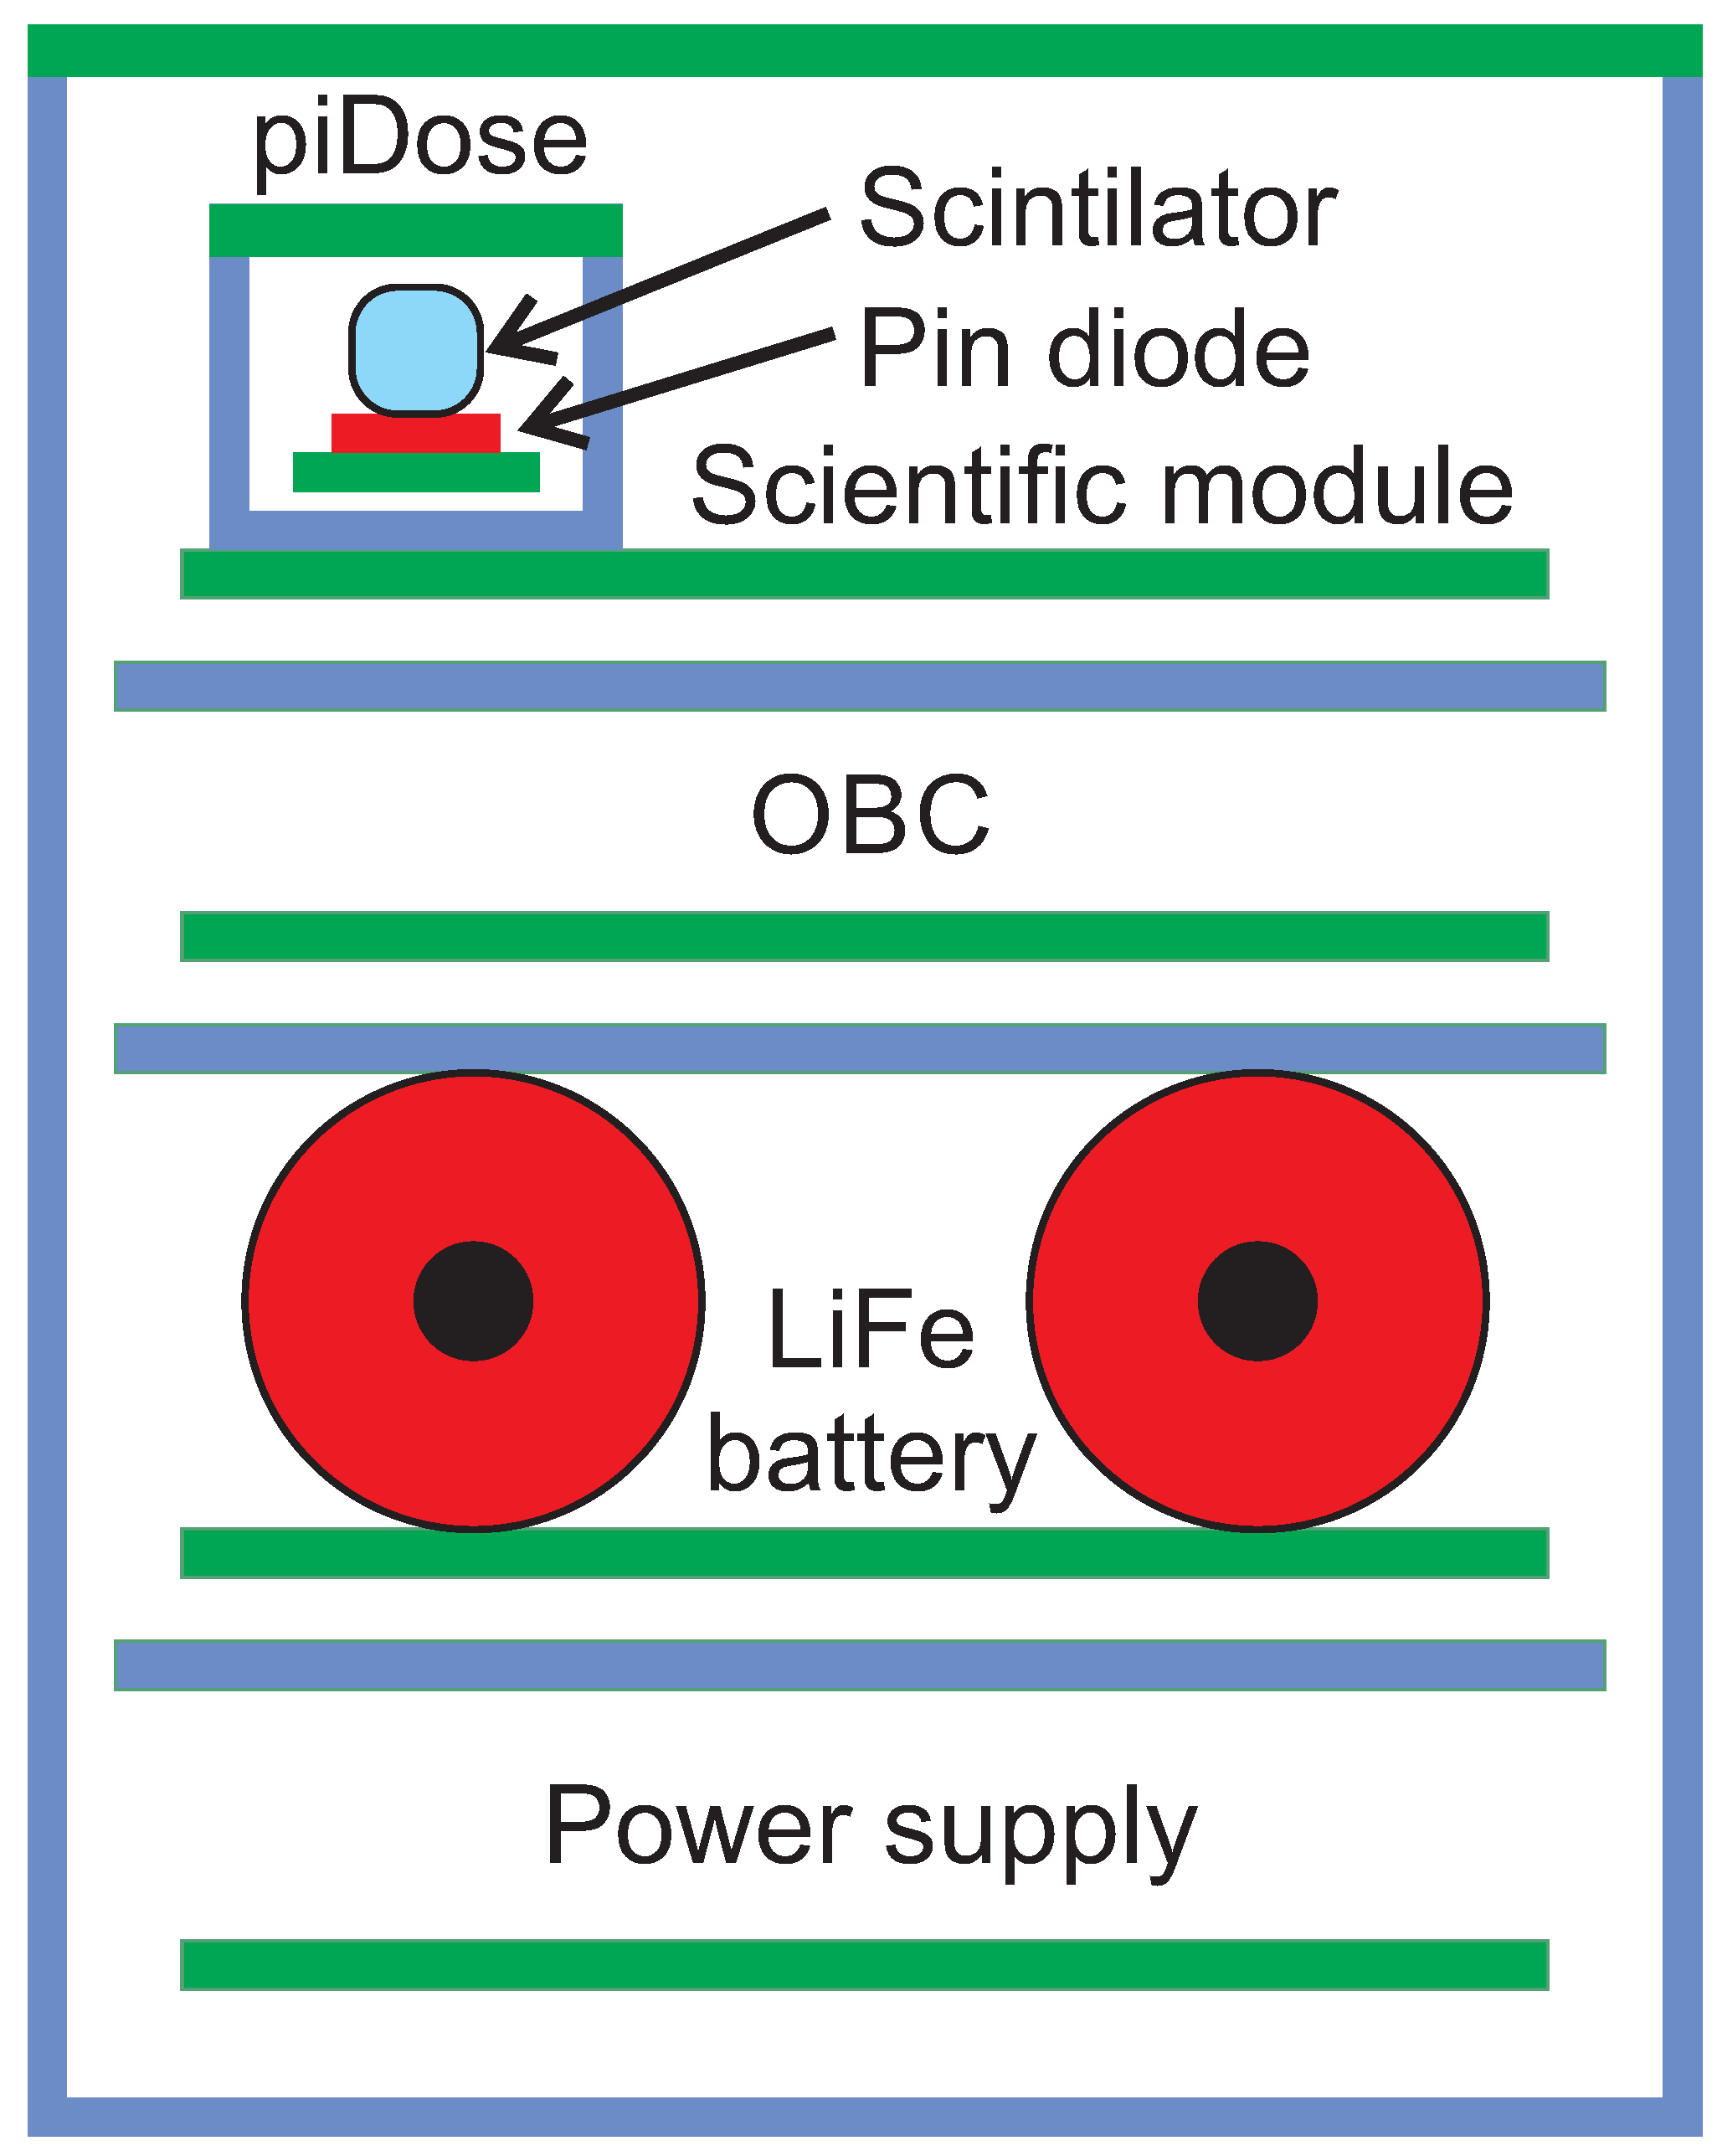
2.1. Lucky-7 Satellite

The Lucky-7 satellite (Figure 1) was designed by two enthusiasts Jaroslav Laifr and Pavel Kovář as a private project. The satellite was launched in summer 2019 into a polar orbit of altitude 520 km and inclination 97.5°. The aim of the mission is to test electronics based on COTS components in the space environment. The primary mission is to test the following: the power supply subsystem designed from bipolar transistors and integrated circuits and silicon carbide field-effect transistors, the piNAV GPS receiver [19] specially developed for CubeSat missions, and the UHF communication system based on the IoT low power consumption integrated transceiver. The secondary mission is to test a scientific payload and perform space radiation measurements.
Lucky-7 is a 1U non-stabilized CubeSat that consists of an on-board computer module with integrated UHF modems, a scientific module, and a power supply subsystem (Figure 2). To increase the satellite electronics reliability, the on-board computer module integrates two identical and independent on-board computers based on ARM Cortex 4 microcontrollers and two independent radio-modems that are connected to the separate antennas. The switching between computers and modems, and the selection of the functional one, is controlled by a special watchdog circuit that is designed from radiation tolerant bipolar transistors.
The scientific module integrates a GPS receiver, VGA resolution camera, solid-state dosimeter [22], and experimental spectrometer. Both devices are based on the same silicon detection diode X100-7 of area 100 mm2. The difference is in the CsI:Tl scintillator and software. The scintillators for the dosimeter and spectrometer have volumes 4 × 8 × 8 and 50 × 10 × 10 mm3, respectively. The software for the dosimeter can count particles only, while the software for the spectrometer can measure registered deposited energy in the range 300 keV to 3 MeV. The energy range is divided into 100 energy bins. Both devices operate in a one-minute measurement cycle, i.e., the particles are counted for 55 s and the remaining 5 s are dedicated for measurement transfer and device reset. The dosimeter generates two Bytes of data per minute while the spectrometer generates 100 Bytes for the same time, and each energy bin is represented by 8 bits. Eight-bit resolution reduces the data volume that has to be stored in the satellite on-board computer. On the other hand, when exposed to increased radiation flux, this variable can easily saturate.
The piNAV L1 GPS receiver [19,23] is specially designed for CubeSat missions in Low Earth Orbit. The receiver is designed as a software-defined radio (Figure 3). The 15 GPS correlators as well as the signal acquisition unit that speeds up the receiver cold start are programmed to the FPGA. The rest of operations are executed by the Cortex M4 microcontroller, which fulfills the tasks of general receiver control and calculations of the position, velocity, and time.
The satellite is designed to be able to operate all instruments in parallel, excluding the camera. For the measurement campaign, the transmission of the radio beacon is suppressed to avoid the affecting the operation of the scientific instruments.
The communication system operates in the UHF radio-amateur frequency band. The radio-modem uses GFSK modulation of bit rate 4800 kbps. The transmitter power is 1 W. The communication protocol is designed as a single layer with a short packet that is 38 Bytes in length. The packet consists of 32 information Bytes, 3 Bytes packet numbers, and 16 bits CRC. The content of the packet data is unequivocally defined by the packet number. Individual packets therefore can be decoded and interpreted independently of one another. This solution enables the communications to operate even if the packet error rate is high. Note that similar protocols are widely used in IoT networks [24].
The communication system of the Lucky-7 satellite operates very well. Communication is possible above an 8° elevation margin and the communication range is more than 2000 km. The packet error rate is at most 5%. For downloading the 2000 minutes of dosimeter measurements including time and position information, only one high elevation satellite pass is needed, while for downloading the complete spectrometer data and position information, approximately four zenith satellite passes are needed.
The satellite electronic is isolated from the space environment by 2 mm thick aluminum panels and the modules are separated by the 2 mm aluminium sheets (Figure 4) that shield the integrated circuits from space radiation.

2.2. Data Processing

Data processing of the Lucky-7 measurement is programmed in SciLab [25] using the Scilib-GEO extension module for geodetic calculations and data visualization. The data processing covers the following steps:
  • Interpolation of the missing position and time data by the algorithm described in [21].
  • Extrapolation of the position and time to the middle of the observation time.
  • Transformation of the position from ECEF to LLH coordinates.
  • Synchronization of the position and time with the radiation sensor measurement.
  • Visualization of the data using GEO toolbox.
The problem with the visualization of the energy spectra varying with geodetic location was solved by the drawing of six maps each for a different energy range. This approach is adequate as the satellite measures mixed radiation fields in which isolated spectral peaks are not expected.

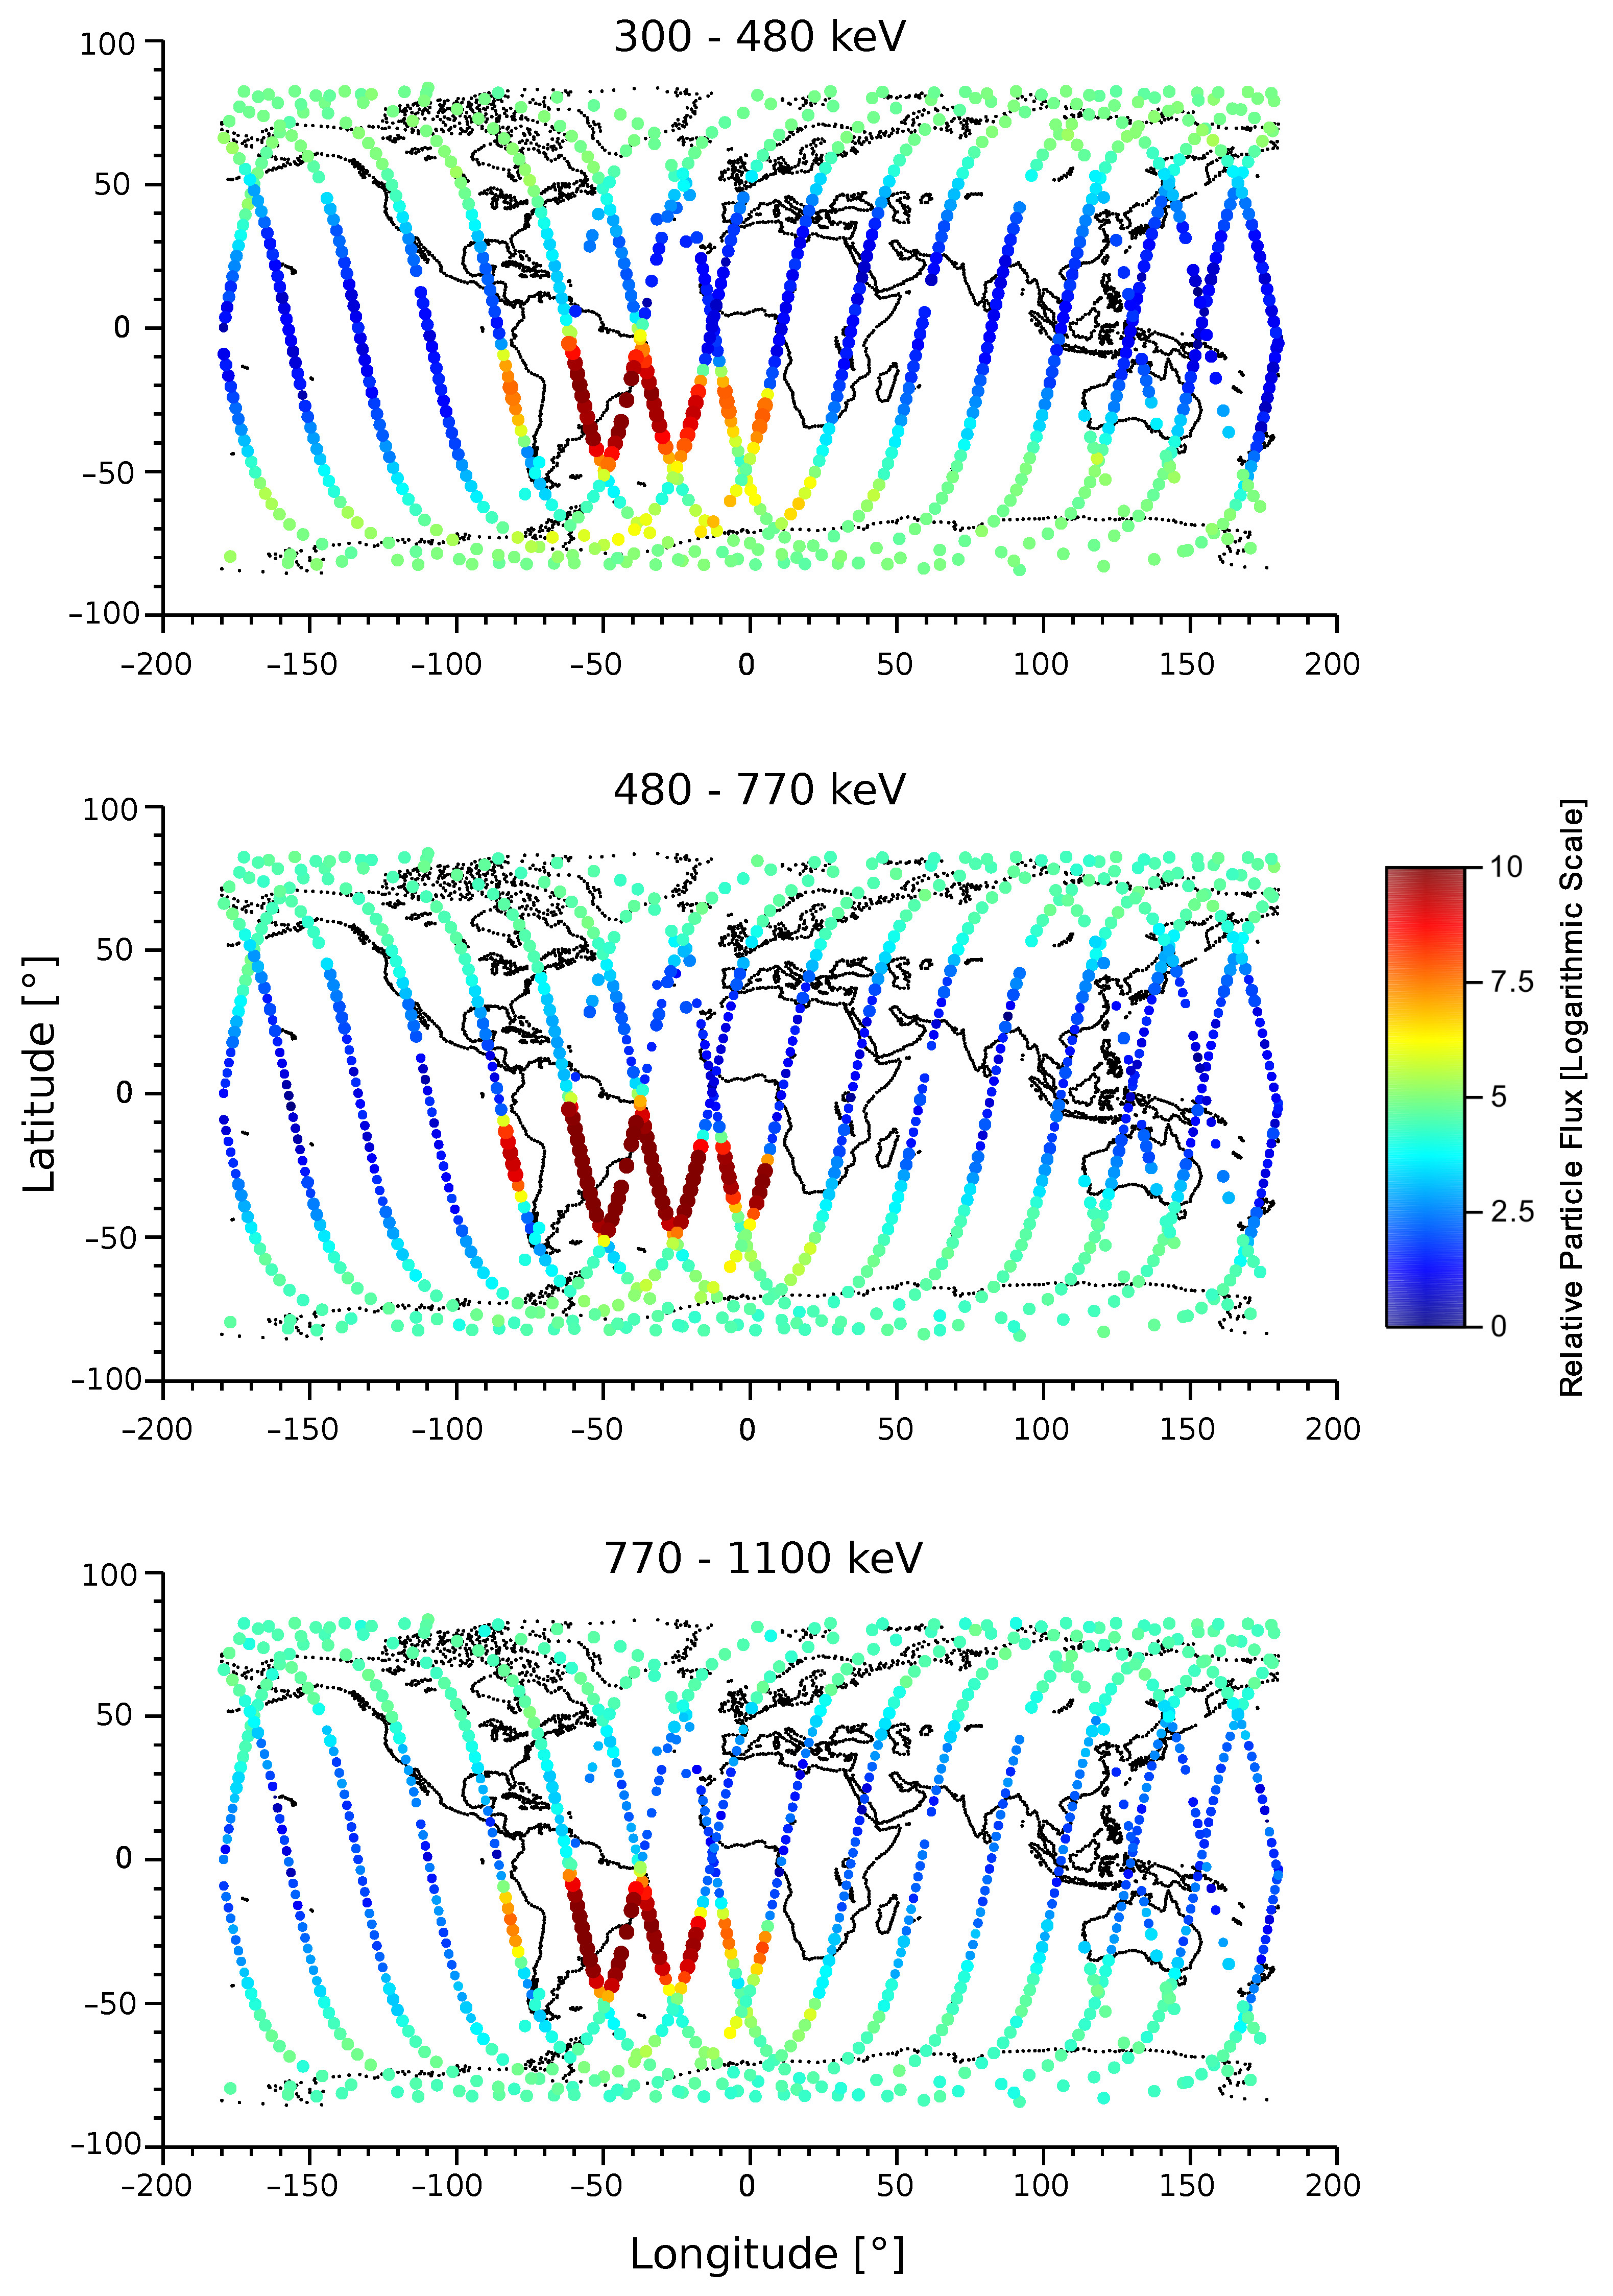
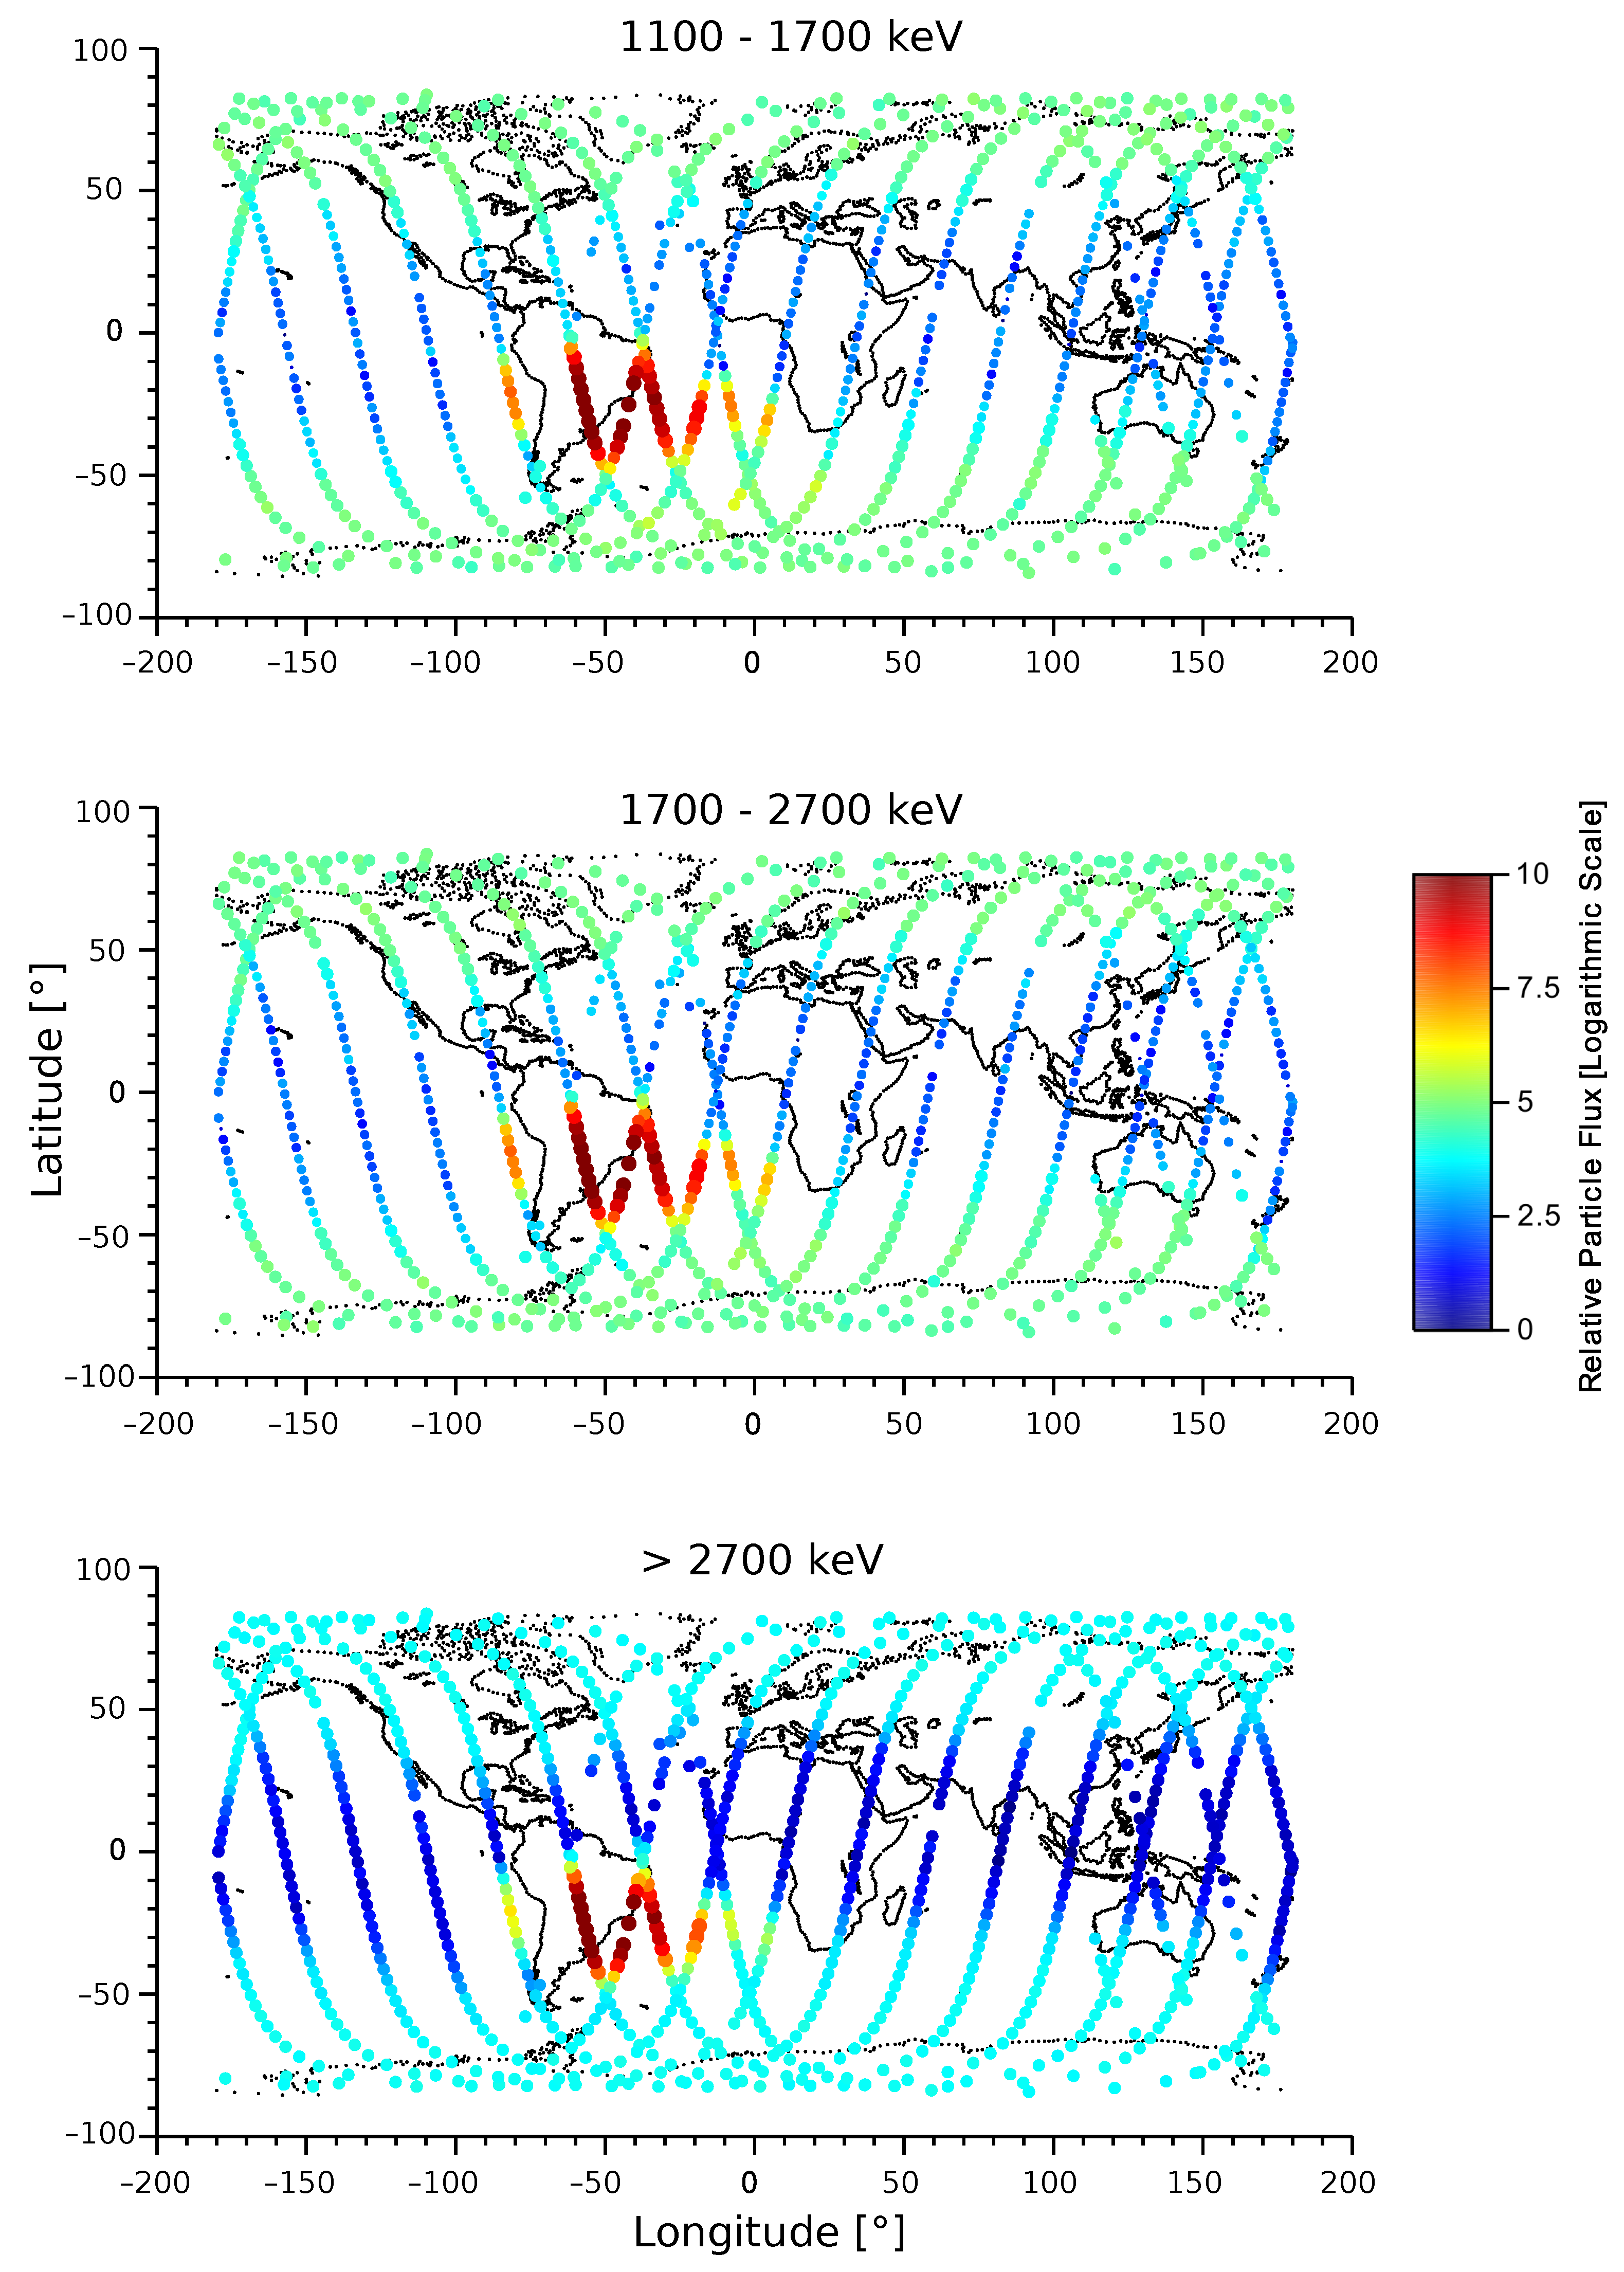
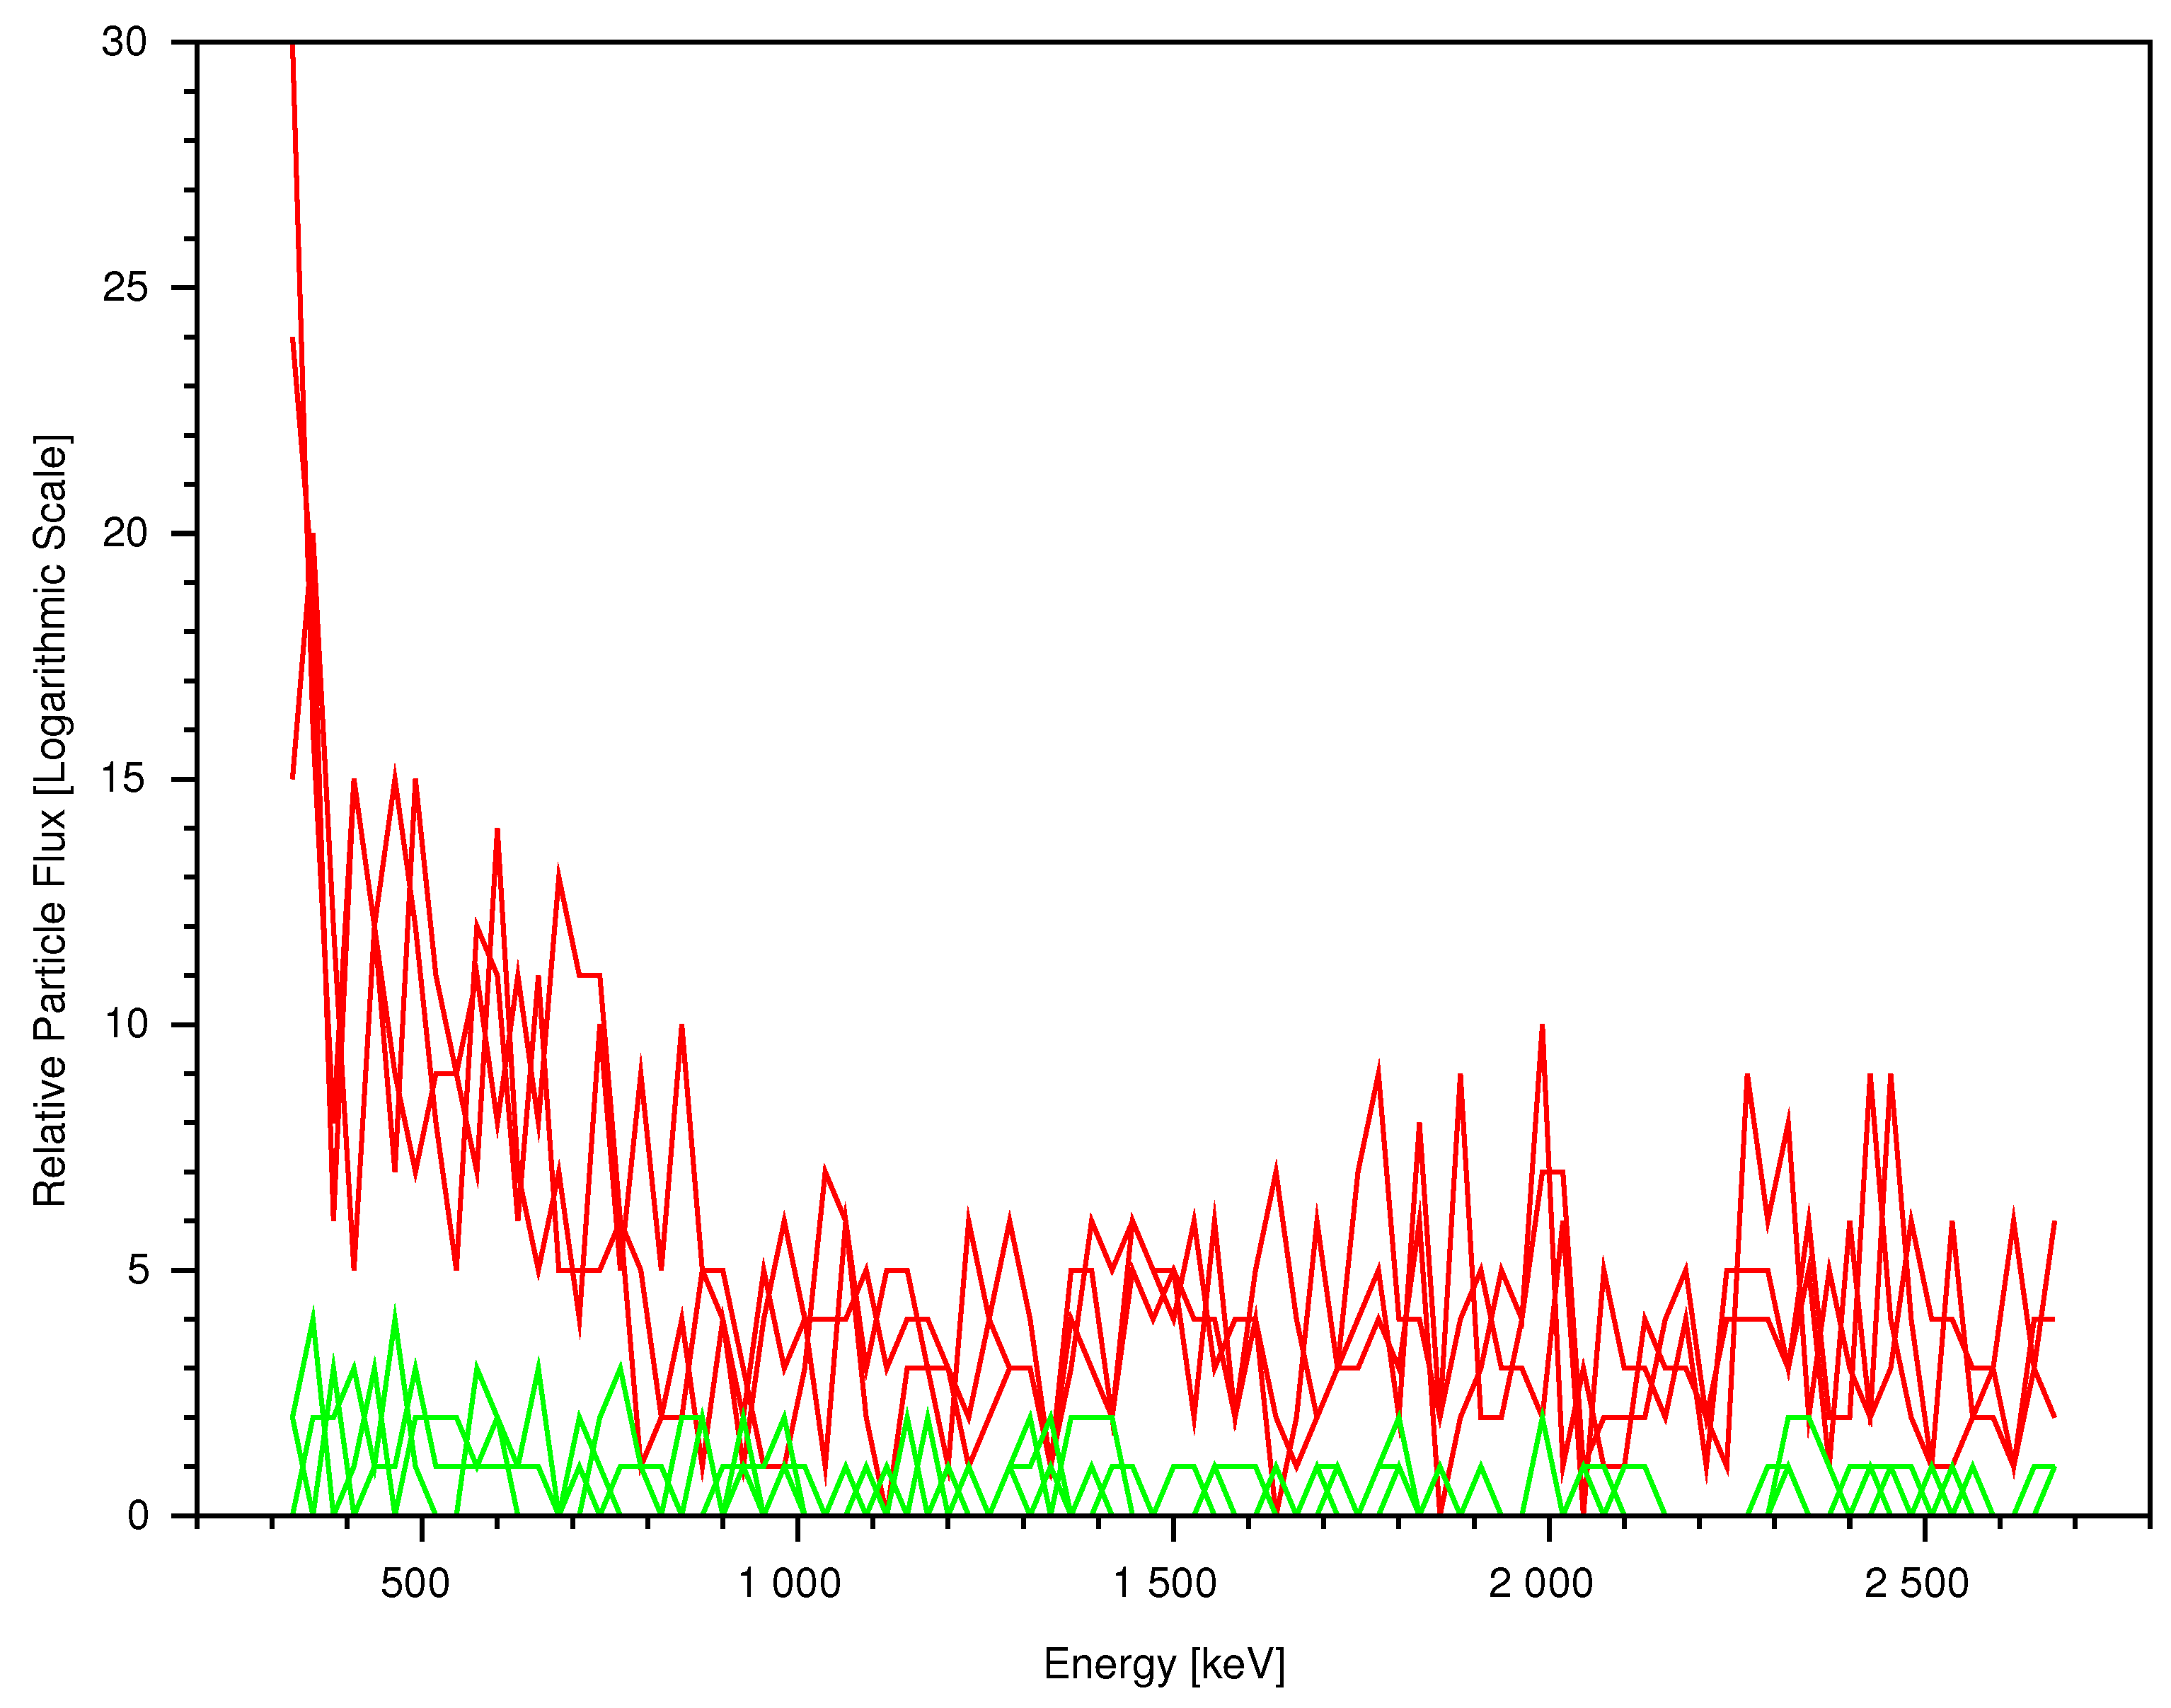
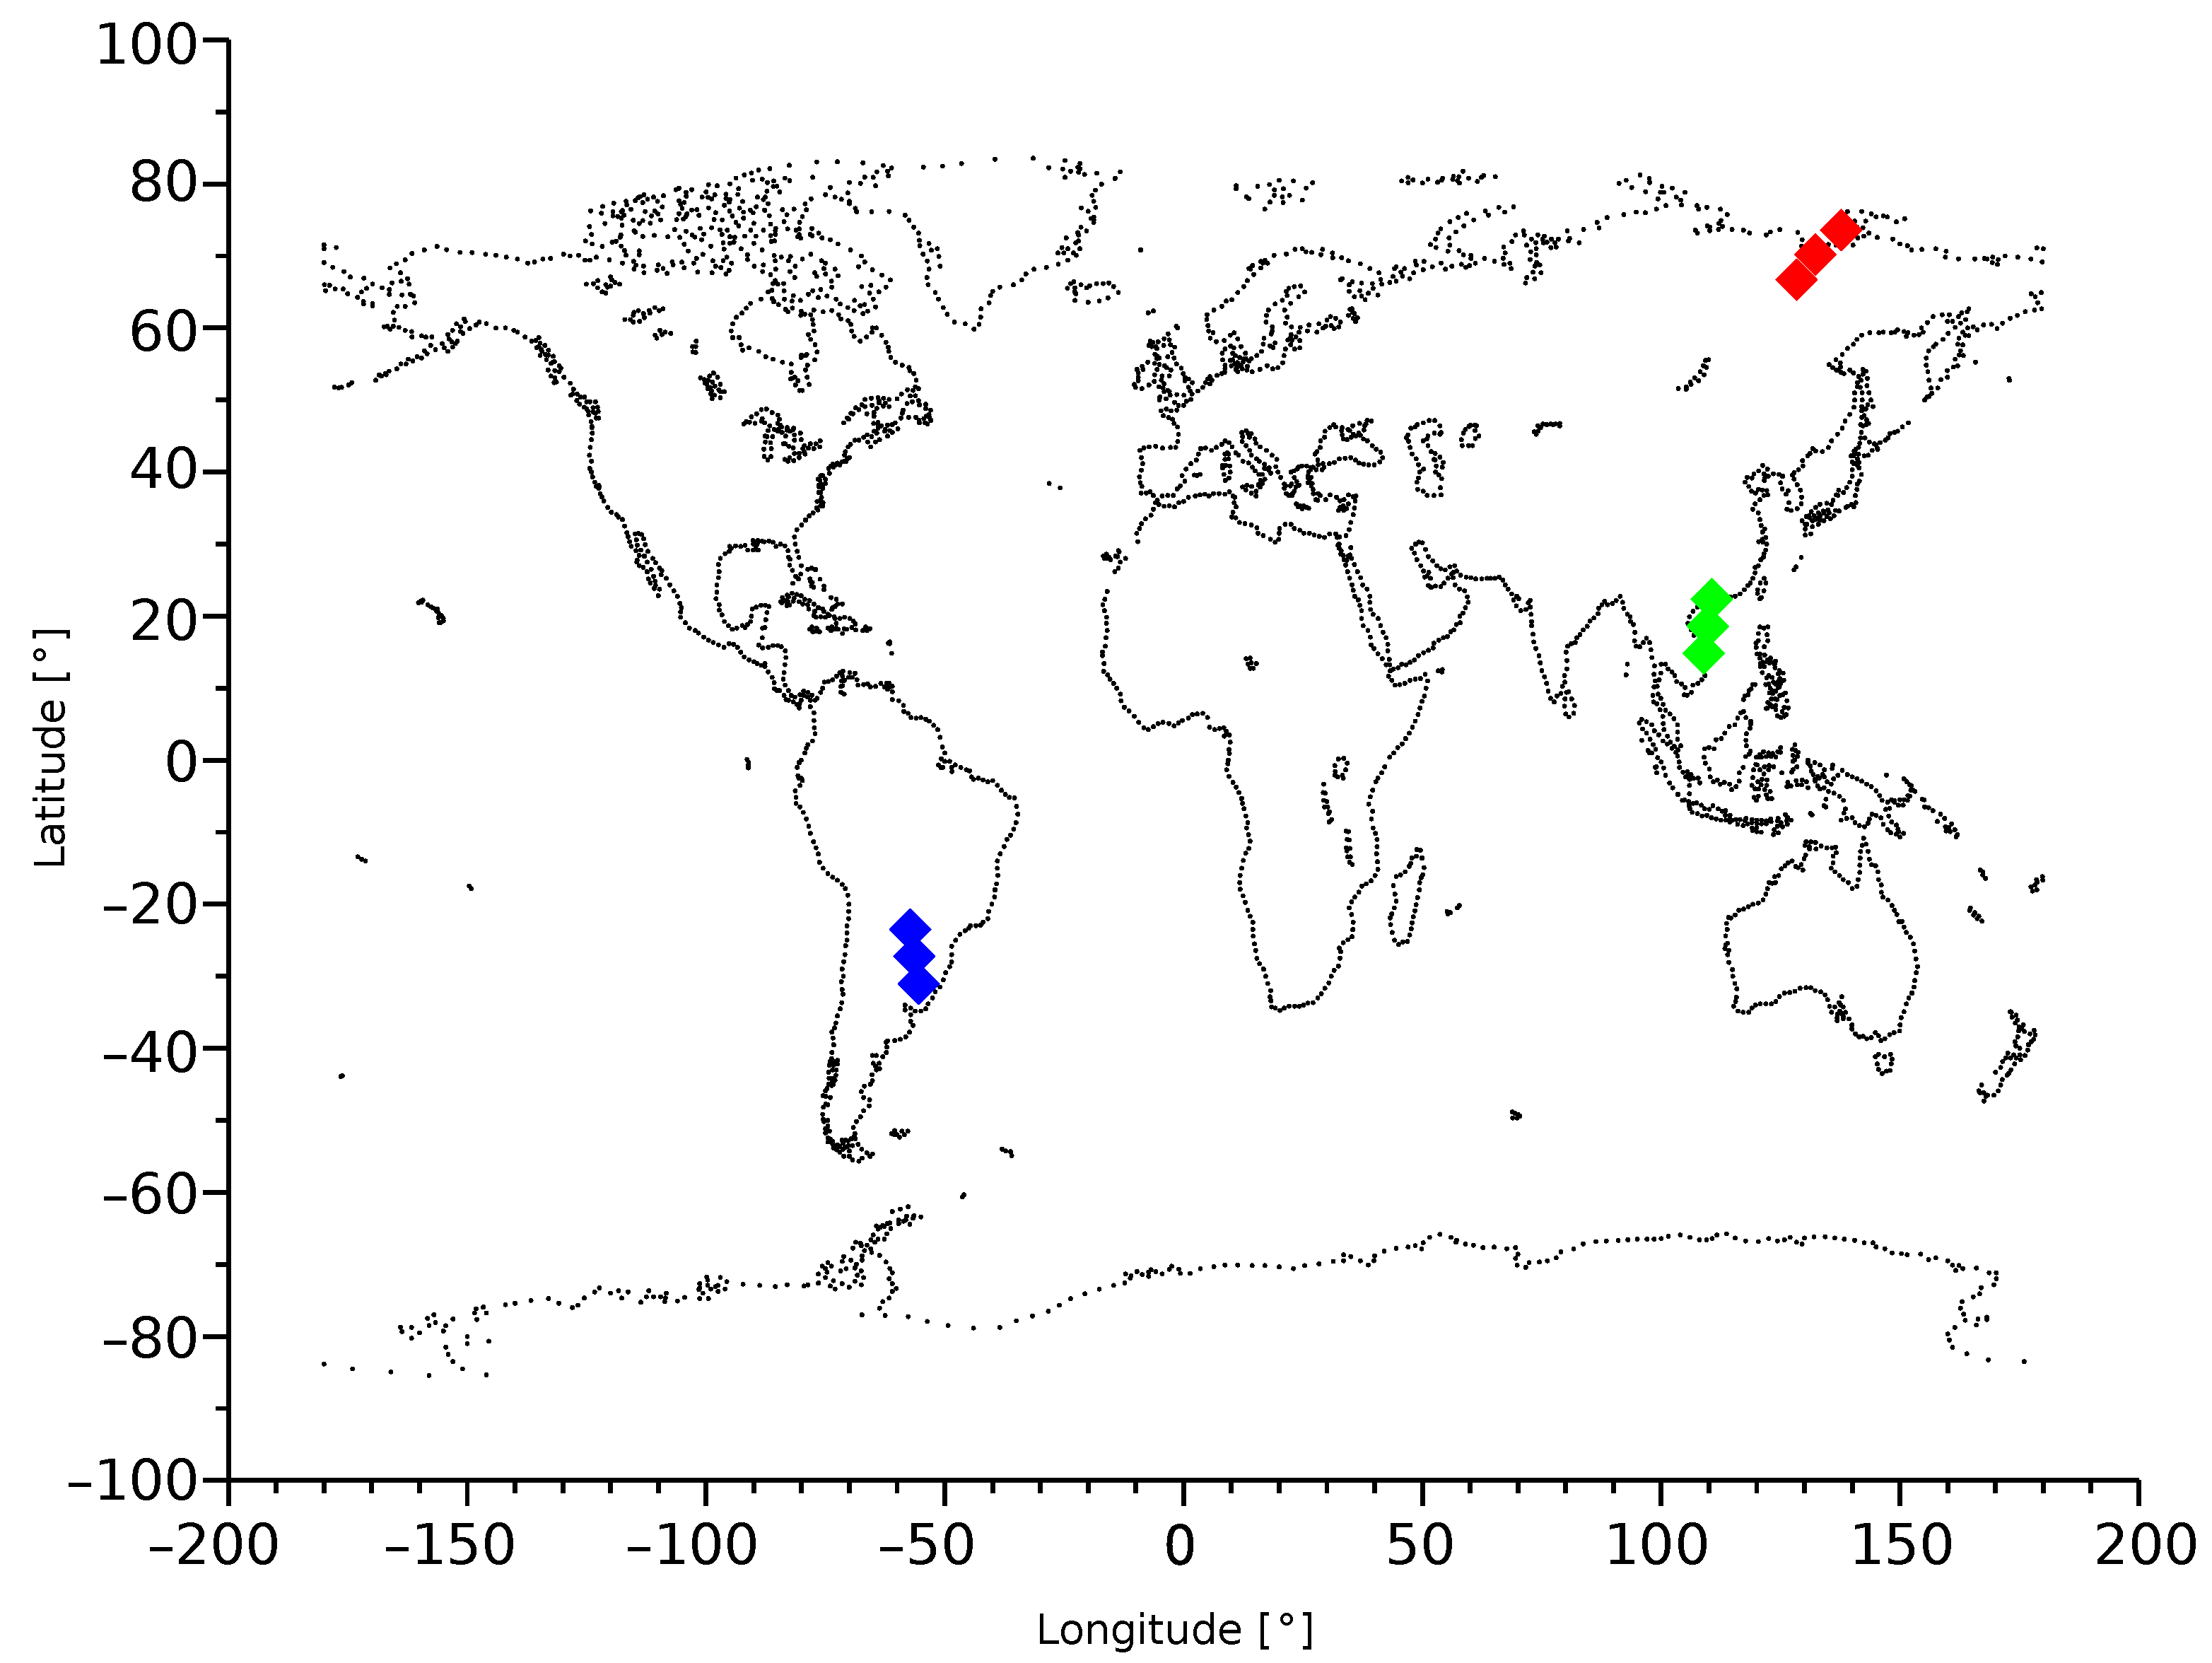
3. Results and Discussion

The Lucky-7 covers an energy range from 300 keV to 3 MeV, which is divided into approximately 100 energy bins. The complete data visualization in the map would require a 4D plot. For easier visualization and interpretation of the data, the energy spectrum was down-sampled into six energy bins. The raw down-sampled data are presented in Figure 5. This down-sampling can be done without significant loss of information thanks to the mixture character of the cosmic rays.
The CsI:Tl scintillation detectors used in the dosimeter and spectrometer were selected for their compact size, low power requirements, and ease of integration into the rest of the payload. Calibration of the spectrometer in terms of energy deposition spectra is based on the manufacturer specification and can at best be considered an estimate. While these detectors performed adequately in illustrating of the different geographic regions of the low Earth orbit radiation environment, in retrospect, more useful measurements might have resulted from a different choice of radiation detector. That being said, the radiation measurements made aboard Lucky-7 demonstrate the efficacy of the IU CubeSat as an orbital platform for ionizing radiation measurement. The relative radiation flux is displayed in a logarithmic scale as its dynamic range is wide.
It is evident from the figure that the radiation (particle) flux decreases with increasing energy. The exception is the last energy curve, which is the highest. The reason is that it displays a much wider energy range than the previous curves. This demonstrates the expectation that the space radiation is mixed.
This data is then connected with the satellite position data and plotted on a world map (Figure 6 and Figure 7). In contrast to the ISS measurement, our maps cover a larger area thanks to the polar orbit. The measurement was done at a higher altitude, approximately 540 km. The proton flux is the highest in the South Atlantic Anomaly (SAA), the location where the geomagnetic field dips closest to the Earth´s surface. Unfortunately, the Earth’s magnetic poles are slowly moving, which causes shifting of the radiation field maximum [21]. The Earth’s radiation field also depends on the Sun’s activity, which will be the scope of further investigation of Lucky-7.
Particle flux also increases near the poles due to the satellite passing through the cusps of the trapped electron belts and due to the greater flux of galactic cosmic rays at these latitudes, which is caused by the minimum geomagnetic cutoff. Over the equator (outside the SAA), the geomagnetic cutoff is greatest, leading to the reduced fluxes seen at these altitudes.
A detailed (full resolution) radiation spectrum for particular areas is shown in Figure 8 and positions of the spectrum measurement are shown in Figure 9. The spectrometer is saturated (blue curve) in the SAA at all energies in which the particle flux is many times higher than in the remaining portions of the orbit. The full resolution spectrum in the equatorial region (green) and polar region (red) does not contain the peaks at individual energies, demonstrating the presence of a mixed space radiation field.

4. Conclusions

We experimentally proved the capability of the still simple 1U CubeSat to realize a complex physical experiment such as the measurement of the radiation spectra. The identified main limiting factor is the low throughput of the UHF communication system using the amateur frequency band available to licensed amateur radio operators.
Due to the necessity of transferred data volume reduction, the individual spectral bins were represented by 8-bit numbers only, which have shown to be insufficient for measurements of the radiation spectra in polar regions and in the South Atlantic Anomaly. Despite this data volume reduction, the ground station requires approximately four high-elevation satellite passes for transmission of the complete measurement cycle to the ground.
The low communication system capacity problem can be solved by a higher-rate communication system operating on the S or C band, but so far these systems are not common for 1U satellites.
The last problem that was solved was with regard to the visualization of the radiation spectrum measurement. As the cosmic rays are a mixture and sharp spectral lines do not occur, we further down-sampled the spectrum to the six energy bins in our case and the individual bins were displayed on an individual map. The full-resolution spectrum was displayed for distinguished points only.

Author Contributions

Conceptualization, P.K. and E.B.; methodology, P.K. and J.M.; software, P.K.; validation, P.P., J.M. and E.B.; formal analysis, P.P. and J.M.; writing—original draft preparation, P.K.; writing—review and editing, P.P. and J.M.; visualization, P.P.; supervision, E.B. All authors have read and agreed to the published version of the manuscript.

Funding

The data processing and preparation of this document was supported from the European Regional Development Fund-Project CRREAT No. CZ.02.1.01/0.0/0.0/15 003/0000481.

Data Availability Statement

Raw data is available at the corresponding author on request.

Conflicts of Interest

The authors declare no conflict of interest.

References

  1. Cubesat Design Specification Rev. 14. 2022. Available online: https://static1.squarespace.com/static/5418c831e4b0fa4ecac1bacd/t/62193b7fc9e72e0053f00910/1645820809779/CDS+REV14_1+2022-02-09.pdf (accessed on 10 October 2022).
  2. Yang, F.; Yue, H.; Wang, G.; Tu, Q.; Wang, W. The Design and Analysis of Picosatellite Deployer with Controllable Release Function; IEEE: Macao, China, 2017; pp. 548–554. [Google Scholar]
  3. Qiao, L.; Glennon, E.; Dempster, A.G.; Chaoui, S. Using cubesats as platforms for remote sensing with satellite navigation signals. In Proceedings of the 2013 IEEE International Geoscience and Remote Sensing Symposium—IGARSS, Melbourne, Australia, 21–26 July 2013. [Google Scholar]
  4. Akyildiz, I.F.; Jornet, J.M.; Nie, S. A new CubeSat design with reconfigurable multi-band radios for dynamic spectrum satellite communication networks. Ad Hoc Netw. 2019, 86, 166–178. [Google Scholar] [CrossRef]
  5. Rose, T.S.; Rowen, D.W.; LaLumondiere, S.; Werner, N.I.; Linares, R.; Faler, A.; Wicker, J.; Coffman, C.M.; Maul, G.A.; Chien, D.H.; et al. Optical communications downlink from a 1.5U Cubesat: OCSD program. In Proceedings of the International Conference on Space Optics—ICSO 2018, Chania, Greece, 9–12 October 2018; Karafolas, N., Sodnik, Z., Cugny, B., Eds.; SPIE: Bellingham, WA, USA, 2019. [Google Scholar]
  6. Zhang, X.; Zhang, J.; Wu, S.; Cheng, Q.; Zhu, R. Aircraft monitoring by the fusion of satellite and ground ADS-B data. Acta Astronaut. 2018, 143, 398–405. [Google Scholar] [CrossRef]
  7. Shao, T.Y.; Kao, S.L.; Su, C.M. Taiwan AIS CubeSat Tracking System for Marine Safety. In Proceedings of the 2019 International Conference on Intelligent Computing and its Emerging Applications (ICEA), Tainan, Taiwan, 30 August–1 September 2019. [Google Scholar]
  8. Akyildiz, I.F.; Kak, A. The Internet of Space Things/CubeSats: A ubiquitous cyber-physical system for the connected world. Comput. Netw. 2019, 150, 134–149. [Google Scholar] [CrossRef]
  9. Lemmer, K. Propulsion for CubeSats. Acta Astronaut. 2017, 134, 231–243. [Google Scholar] [CrossRef]
  10. Gormley, D.J.; Stock, A.A. A Spectrum Sensor for CubeSat Radios. In Proceedings of the 2021 IEEE Cognitive Communications for Aerospace Applications Workshop (CCAAW), San Antonio, TX, USA, 3–7 October 2021. [Google Scholar]
  11. Van Allen, J.A.; Ludwig, G.H.; Ray, E.C.; McIlwain, C.E. Observation of high intensity radiation by satellites 1958 alpha and gamma. Jet Propuls. 1958, 28, 588–592. [Google Scholar] [CrossRef]
  12. Mertens, C.J.; Slaba, T.C.; Hu, S. Active Dosimeter-Based Estimate of Astronaut Acute Radiation Risk for Real-Time Solar Energetic Particle Events. Space Weather 2018, 16, 1291–1316. [Google Scholar] [CrossRef]
  13. Kauppila, J.S.; Kay, W.H.; Haeffner, T.D.; Rauch, D.L.; Assis, T.R.; Mahatme, N.N.; Gaspard, N.J.; Bhuva, B.L.; Alles, M.L.; Holman, W.T.; et al. Single-Event Upset Characterization Across Temperature and Supply Voltage for a 20-nm Bulk Planar CMOS Technology. IEEE Trans. Nucl. Sci. 2015, 62, 2613–2619. [Google Scholar] [CrossRef]
  14. Shaneyfelt, M.R.; Schwank, J.R.; Dodd, P.E.; Hill, T.A.; Dalton, S.M.; Swanson, S.E. Effects of Moisture on Radiation-Induced Degradation in CMOS SOI Transistors. IEEE Trans. Nucl. Sci. 2010, 57, 1777–1780. [Google Scholar] [CrossRef]
  15. Gieseler, J.; Oleynik, P.; Hietala, H.; Vainio, R.; Hedman, H.P.; Peltonen, J.; Punkkinen, A.; Punkkinen, R.; Säntti, T.; Hæggström, E.; et al. Radiation monitor RADMON aboard Aalto-1 CubeSat: First results. Adv. Space Res. 2020, 66, 52–65. [Google Scholar] [CrossRef] [Green Version]
  16. Peltonen, J.; Hedman, H.P.; Ilmanen, A.; Lindroos, M.; Maattanen, M.; Pesonen, J.; Punkkinen, R.; Punkkinen, A.; Vainio, R.; Valtonen, E.; et al. Electronics for the RADMON instrument on the Aalto-1 student satellite. In Proceedings of the 10th European Workshop on Microelectronics Education (EWME), Tallinn, Estonia, 14–16 May 2014. [Google Scholar]
  17. Kákona, M.; Šlegl, J.; Kyselová, D.; Sommer, M.; Kákona, J.; Lužová, M.; Štěpán, V.; Ploc, O.; Kodaira, S.; Chroust, J.; et al. AIRDOS—open-source PIN diode airborne dosimeter. J. Instrum. 2021, 16, T03006. [Google Scholar] [CrossRef]
  18. Arneodo, F.; Giovanni, A.D.; Marpu, P. A Review of Requirements for Gamma Radiation Detection in Space Using CubeSats. Appl. Sci. 2021, 11, 2659. [Google Scholar] [CrossRef]
  19. Kovar, P. Experiences with the GPS in Unstabilized CubeSat. Int. J. Aerosp. Eng. 2020, 2020, 8894984. [Google Scholar] [CrossRef]
  20. Kovar, P.; Sommer, M.; Matthiae, D.; Reitz, G. Measurement of cosmic radiation in LEO by 1U CubeSat. Radiat. Meas. 2020, 139, 106471. [Google Scholar] [CrossRef]
  21. Kovář, P.; Sommer, M. CubeSat Observation of the Radiation Field of the South Atlantic Anomaly. Remote. Sens. 2021, 13, 1274. [Google Scholar] [CrossRef]
  22. Laifr, J.; Kovar, P. High altitude balloon test flight of miniature low power dosimeter for small satellites. Slabop. Obz. 2018, 74, 2018. [Google Scholar]
  23. Kovář, P. Start Acceleration of the Space GPS Receiver. Int. J. Electron. Telecommun. 2020, 55, 4. [Google Scholar]
  24. Sigfox Connected Objects: Radio Specifications. Technical Report, SigFox. 2022. Available online: https://build.sigfox.com/sigfox-device-radio-specifications (accessed on 10 October 2022).
  25. Baudin, M. Programming in Scilab. scilab.org. 2011. Available online: https://forge.scilab.org/index.php/p/docprogscilab/downloads/get/progscilab-v.0.10_en.pdf (accessed on 10 October 2022).
Figure 1. The Lucky-7 CubeSat.
Electronics 11 03390 g001
Figure 2. Lucky-7 block diagram.
Electronics 11 03390 g002
Figure 3. The piNAV L1 receiver.
Electronics 11 03390 g003
Figure 4. The schematic cross section of the Lucky-7 satellite showing the PCBs with electronics (green) and 2 mm aluminum shielding (blue).
Electronics 11 03390 g004
Figure 5. Raw measurement of the energy spectrum.
Electronics 11 03390 g005
Figure 6. World map of the energy spectrum, part I.
Electronics 11 03390 g006
Figure 7. World map of the energy spectrum, part II.
Electronics 11 03390 g007
Figure 8. Full resolution energy spectrum, Red—polar region, Green—Equatorial region, SAA—saturated, not displayed.
Electronics 11 03390 g008
Figure 9. Position of the measurements from Figure 8.
Electronics 11 03390 g009
Publisher’s Note: MDPI stays neutral with regard to jurisdictional claims in published maps and institutional affiliations.

