1. Introduction
Global mobile traffic is set to increase exponentially due to evolving mobile communication technology. As a result, various industrial service sectors, such as the Internet of Things, autonomous vehicles, and artificial intelligence, are expected to converge [
1,
2,
3,
4]. Therefore, research on 5G mobile communications is being actively conducted to meet this challenge. Smart antennas with beamforming technology, millimeter-wave band frequencies, and large-capacity multiple input and output (MIMO) systems have become indispensable for facilitating ultra-high-speed, ultra-low latency, and ultra-wideband services for 5G mobile communication [
4,
5,
6]. Due to the shorter wavelength, the multipath loss of the millimeter-wave band is much larger than other bands [
7,
8,
9,
10]. Compensation for this loss may be provided by implementing the RF front-end circuit and the antenna in a direct module form by using array antenna technology such as the antenna-in-package (AiP) or the antenna-on-chip (AoC) method, wherein the antenna is placed on the radio frequency integrated circuit (RFIC) [
11,
12].
Unlike conventional mobile communication antennas, 5G mobile communication antennas use beamforming technology to secure wide beam coverage; therefore, 5G antennas require two-dimensional (2D) cross-sections and 3D beam pattern measurements of numerous antennas [
10]. The traditional antenna measurement method is impractical because it requires a long time to measure the characteristics of the new antenna with multi-beamforming features [
13]. Thus, there is a need for a much faster measurement method in quantifying antenna characteristics.
A multi-probe measurement system significantly reduces the measurement time by arranging multiple probes, which minimizes the number of moving points for measurement. Moreover, the spherical near-field measurement method enables measurement at any point on the spherical coordinates, thus making it possible to obtain 3D measurements of omnidirectional radiation patterns, which is the most suitable measurement method for 3D beam pattern measurement [
14,
15].
This article describes the overall configuration of a multi-probe array rotation (MPAR) measurement system. The MPAR measurement system can simultaneously measure multiple signals using a multi-channel digitizer and has a shorter measurement time than a conventional antenna measurement system using vector network analyzer (VNA). To validate the accuracy of the MPAR measurement system, the radiation pattern and gain of the horn antenna in the 26.5–40 GHz band, which is the 5G mobile communication frequency band, were measured and compared with the far-field antenna measurement results. Additionally, to shorten the measurement time, the measurement results and time were compared and analyzed according to the optimized sampling interval. The article is organized as follows:
Section 2 introduces the multi-probe array rotation measurement system;
Section 3 describes a comparative analysis of the measurement results between the far-field measurement facility and the proposed measurement system;
Section 4 analyzes the measurement results and measurement time according to the measurement sampling interval, aiming to increase measurement efficiency; and finally,
Section 5 concludes the article.
2. Multi-Probe Array Rotation (MPAR) Measurement System
The MPAR measurement system is a spherical near-field measurement system. It enables measurement at every point in the spherical coordinates and is the best method for 3D pattern measurement of a test antenna [
16].
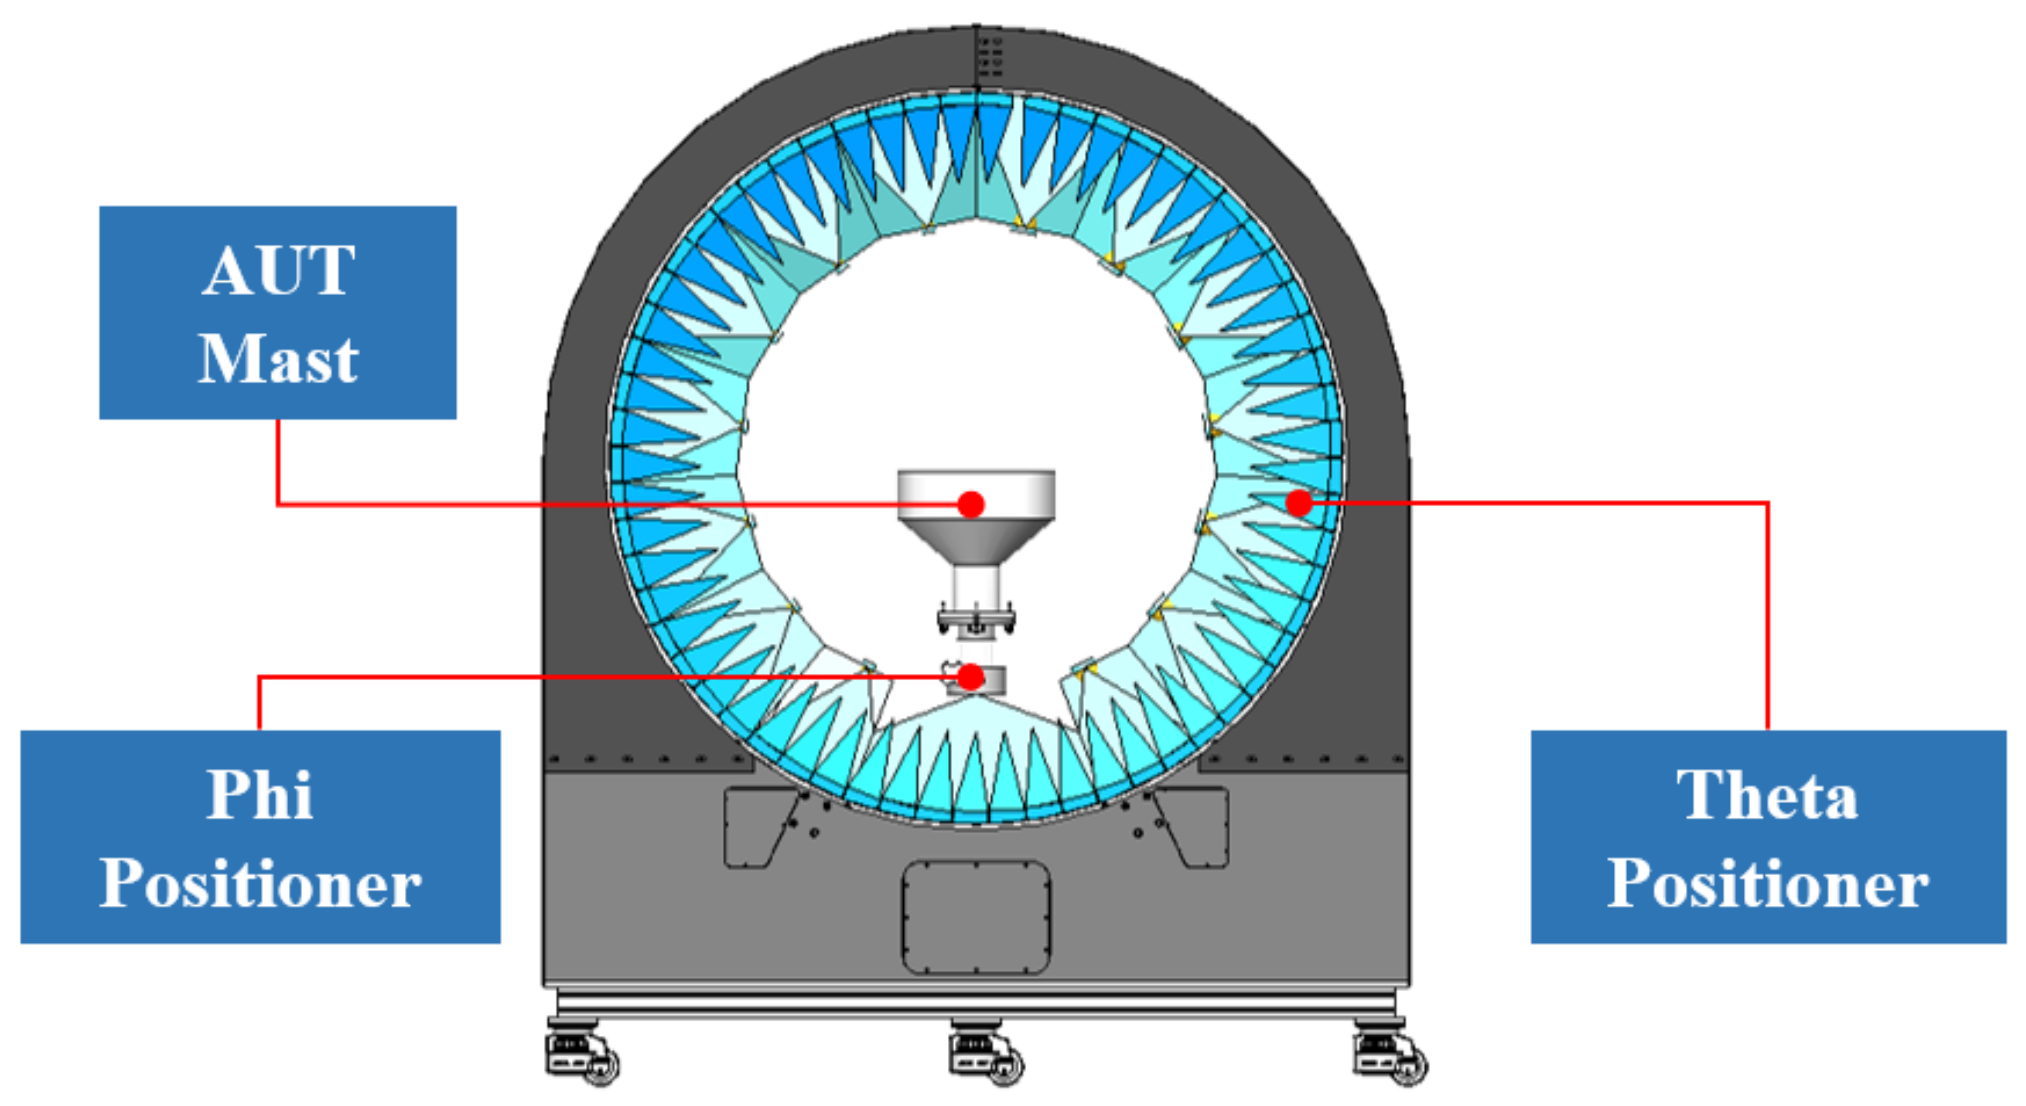
Table 1 presents the design specifications of the MPAR measurement system. To measure the characteristics of the MIMO antenna for 5G mobile communication at high speeds, the multi-probe array rotation method is applied. As shown in
Figure 1, the measurement system consists of a probe array, theta and phi positioners, and a measuring mast.
2.1. Mechanical Structure of MPAR Measurement System
The mechanical structure of the MPAR measurement system is designed to allow high-speed scanning of the 3D beam pattern of the antenna under test (AUT). The probe is arranged in a circle around the AUT mast, equidistant from the origin on the spherical coordinates, in order to measure the spherical near-field of the AUT. Two methods are available for driving multiple probes, as shown in
Figure 2. A goniometer structure in
Figure 2a was employed to perform sampling in the theta and phi directions by installing a driving device at the bottom of the AUT mast. This method has the advantages of a simple structure and easy installation of an RF cable; however, there is a high possibility of measurement uncertainty in the case where the AUT mounting is unstable, as it causes movement when performing measurements.
The second method that we proposed is the multi-probe array rotation method, in which the multi-probe array rotates in the theta direction and the lower mast drive unit rotates in the phi direction while performing measurements, as shown in
Figure 2b. For large and heavy antennas or antennas operating at millimeter-wave frequency, the probe array rotation ensures that the DUT does not experience gravitational deflection during antenna measurement. Compared to the goniometer method, the MPAR method ensures the accuracy and stability of the antenna. Therefore, in this article, a probe array rotation structure was applied to the measurement system. The oversampling was performed by the mechanical rotation of the multi-probe array arch in elevation. This rotation provided high accuracy and enhanced the measurement performance. The scanner structure was designed such that the AUT could easily align the boresight, and an absorber was attached to the frame to reduce the internally reflected electric field.
To selectively use the probe according to the size and frequency of the AUT to be measured, probes of different frequency bands were placed on the left (low-frequency band) and right (high-frequency band). The spacing between each probe was designed to be 23.5°, considering the theta axis motion angle, without any mechanical interference. Seven probes were arranged for each frequency band. The range of the measuring system was 329°, and the probe layout is as shown in
Figure 3.
2.2. RF System
As shown in
Figure 4, an RF system consists of a signal generator, switch matrix, down converter, amplifier, attenuator, and digitizer. The MPAR measurement system comprises of 28 channels, including vertical/horizontal polarization, for a total of 14 probe antennas. The transmission channel generates RF signals, applies the signal to the AUT, and delivers a reference signal for comparison with the signal received in the reception channel. The receiving channel transfers the RF signal received by the probe to the down-converter, according to the measurement frequency. The down-converter modulates the received signal into an IF signal and delivers it to an amplifier/attenuator. After passing through the amplification and attenuation processes, the signal is received by a digitizer, and the result of comparing the received signal with the reference signal is transmitted to the measuring computer.
The MPAR measurement system utilizes a multichannel digitizer to form 28 independent channels. By using two independent channels for each probe, the polarization (vertical/horizontal) can be measured simultaneously; thus, the measurement time can be shortened compared to the measurement method using the conventional VNA and switch matrix.
As shown in
Figure 5, the RF switch matrix amplifies the transmit signal and transmits the received signal from the low- and high-frequency band probes to the down converter.
2.3. Spherical Near-Field Measurement
The spherical near-field measurement is a method for measuring the near-field of the AUT along the spherical coordinate system. The electric field radiating from the AUT along the spherical coordinate system can be expressed as a weighted sum of spherical vector functions in the form of spherical wave expansion (SWE), as expressed in the following equation [
17]:
where
k is the wave number,
η is the impedance of the radiation medium,
Qsmn is the complex expansion coefficient, and
Fsmn is the power-normalized spherical wave.
Qsmn is related to the Fourier-transformed electric field radiated from the AUT and can be obtained by measuring the near-field of the AUT, as shown in the following equation [
17]:
where
ν is the complex amplitude radiated from the radiation antenna,
Tsmn is the propagation coefficient,
Rsn is the radiation function, and
ωθ ϕ is the complex amplitude received from the receiving antenna.
The spherical wave function
Fsmn(r,
θ,
ϕ) is a function related to the Fourier transform and distance approximation of the near-field for each location, and is determined according to the measurement location of the AUT. The function can be expressed by the following equations, and it is possible to convert the AUT’s near-field to a far-field electric field.
Using Equations (2) and (3), the total power radiated from the AUT can be expressed as
The sampling grid of an MPAR measurement system is generally equiangular, as shown in
Figure 6, and scans are performed along the theta and phi axes. In the case of the theta scan, the multi-probe structure can scan very quickly, but in the case of the phi scan, the speed is limited by the mechanical performance of the positioner.
The field of the antenna can be expressed as a weighted sum of the spherical modes, as shown in Equation (1). With a sufficient number of modal coefficients, it is possible to accurately compute the field in all directions and at any distance greater than the mode-dependent minimum distance. The number of modes depends on the field change in the theta and phi axes. The field variation of the phi axis is limited by order
M, and that of the theta axis is limited by order
N, where
N and
M are the truncation numbers of the spherical wave expansion. The value of
N can be estimated using the following empirical rule [
18]:
where
k is the wavenumber and
r is the radius of the minimum sphere. In a spherical near-field, the sampling intervals of the
θ and
ϕ axes should be less than half the wavelength of the measurement frequency to satisfy the Nyquist condition, which can be expressed as follows:
As the electrical size of the antenna increases, the angular sampling rate must be increased accordingly, which increases the measurement time.
2.4. Measurement Procedure
To obtain a far-field pattern through the spherical near-field of the antenna, a spherical near-field measurement and Fourier transformation (FT) process that converts the near-field into a far-field electric field are required. The spherical near-field measurement can be used to obtain an accurate near-field of the AUT through calibration and AUT measurements.
Figure 7 illustrates a general scheme of the measurement process. The measurement process is as follows:
(1) Calibration step—System calibration is required to compensate for the deviation due to signal loss caused by the RF cables and the different characteristics of each probe. The calibration antenna performs measurements while considering each of the seven probes. The measured data are later used to determine the exact value of the AUT near-field using the AUT-measured data and calculations. Additionally, gain calibration was performed to measure the gain of the far-field of the antenna. In this measurement system, the gain of the antenna can be measured using a gain comparison method. The gain comparison method calculates the gain by comparing the measurement results of the antenna and AUT, by measuring the antenna with an accurate gain. After mounting the calibration antenna, measurements are performed on the theta and phi axes. The gain of the antenna is obtained through far-field analysis of the calibration antenna using the measurement data. Calibration is implemented by comparing the calibration antenna gain, obtained through measurement with the reference gain of the calibration antenna and compensating for the difference in the AUT gain.
(2) Measurement Steps—After the AUT is accurately mounted on the measuring mast, measurements are performed according to the user’s set values for the theta and phi axes of the AUT. When the measurement starts, each drive shaft positioner reaches its initial position, and the phi-axis positioner starts to drive continuously. When the phi-axis positioner completes the 360° scan, it performs theta-axis drive and the same phi-axis scan on the next theta axis as before. The measurement is completed when the driving along the theta axis is completed.
(3) Post-processing steps—This is the process of converting the AUT short-range measurement results into a far-field. It compensates for cable loss and probe deviation using the AUT measurement data and system calibration data. The compensated result is transformed into a far-field using an FT. Probe compensation is then performed to compensate for errors that occur because the probe used for measurement is not an ideal antenna. A compensation operation is performed using the previously measured probe antenna pattern data. When far-field conversion is completed, the AUT’s far-field pattern is accurately calculated by compensating for the AUT’s far-field gain using the gain calibration data and the reference gain compared to the measured gain of the calibrated antenna.
Figure 7.
General scheme of the measurement process.
Figure 7.
General scheme of the measurement process.
3. Validation of MPAR Measurement System
To ensure the reliability of the multi-probe spherical near-field antenna measurement system, it is necessary to measure the exact characteristics of the calibration antenna and verify the validity of the multi-probe spherical near-field antenna measurement system through an inter-comparison of the measurement results (gain, pattern, etc.). Methods for measuring the characteristics of an antenna include the gain comparison method with respect to a reference antenna with a fixed gain and a three-antenna-based extrapolation method. Because such antenna measurement systems cannot calibrate the system itself, their validity can be verified by calibrating a reference antenna with a fixed gain and then measuring and comparing the gains with each other.
For validation, mutual comparisons of the antenna characteristics and measurement capabilities are performed for the far-field measurement system and the proposed measurement system. A standard horn antenna is used for comparison; its specifications are listed in
Table 2. The standard horn antenna and the measurement environment are shown in
Figure 8.
The fixed-frequency power gain values are listed in
Table 3.
Figure 9 shows a comparison of the maximum gain according to frequency. This indicates that the two gain measurements agree within approximately ±1 dB.
Figure 10 and
Figure 11 compare the values of the E- and H-plane radiation patterns at 28/40 GHz. The main lobe characteristics indicate very similar values, but the MPAR measurement system for the side lobe appears to be somewhat unstable. This is due to the antenna fixture, positioner, reflection coefficient, etc.
Additionally, a 28 GHz planar patch antenna with low gain also measured the radiation pattern and compared the results. Planar antenna specifications are listed in
Table 4.
Figure 12 compares the values of the E- and H-plane radiation patterns at 28 GHz. In the case of near field measurement, if the gain is low, the directivity is weakened and the accuracy is lowered due to the influence of the measurement environment. However, the measurement accuracy can be improved by using a measuring jig.
4. Sampling Technique to Improve Measurement Time
The major drawback of the spherical near-field measurement method is that it requires a large number of samples to perform conversion from near to far fields. The field of the antenna can be expressed as a weighted sum of the spherical modes, as shown in Equation (1). According to Equation (6), as the electrical size of the antenna increases, the angular sampling rate must be increased accordingly, which increases the measurement time [
19,
20,
21,
22].
An alternative method to reduce this shortcoming of measurement time is to reduce the measurement sampling rate. Several studies have been conducted to reduce the number of measurement samples [
23,
24,
25,
26,
27,
28,
29]. One method is to reduce the standard near-field measurement sample by means of a spiral scan [
28]. Similarly, compression-sensing (CS) [
26] can be used to significantly reduce the number of measurements required.
Therefore, we propose a method to shorten the measurement time using the CS method. Most of the power of the antenna is concentrated at the low azimuth. For example, in the case of a horn antenna and reflector antenna, there is a very small change in azimuth. By using this property, undersampling of the phi field is possible, which reduces the movement of the position and shortens the measurement time. To estimate the undersampling, an appropriate sampling interval can be estimated by comparing the values while gradually increasing the phi sample interval using a simulation model. This method applies the generalized minimum residual solver (GMRES) [
30] and stops when the relative error reaches the desired value. This method requires less time than direct sampling of changes and measurements. The error of the near-field measurement method is determined using Equation (8).
where
EFF is the far-field radiation pattern and
ENF is the transformed far-field using theta undersamples. The error decreases as the sample length increases. Therefore, it can be adjusted to measure far-field patterns with the desired accuracy. After measuring the length of the Phi sample, the obtained coefficient is compared with the previous iteration and the measurement is stopped with the guarantee that the transformed field has less than the desired accuracy, which is usually <10
−3.
Measurements were performed to verify the proposed phi axis using a sampling algorithm. The verification was performed using a previously used horn antenna. The AUT was an enclosed minimum sphere, with radius of 17 cm, at a frequency of 28 GHz. By using Equation (7), N = 110 and M = 220 modes are required to fully characterize the AUT. Thus, the total number of samples equals 24,174 points for the conventional method. The measurements of the electrical dimensions of the antenna were very time consuming because of the number of samples required.
According to the empirical rule, it is possible to measure accurately at a high speed with 9800 (
N = 70) sampling points. The application of the proposed sampling rates helps drastically reduce the number of phi samples to save time. Assuming that the sampling interval θ was fixed at 2.5°, the sampling interval phi was changed (from
N = 30 to 110). The comparison results of the transformed far fields in the E- and H-planes for the horn antenna are shown in
Figure 13.
Deviations appeared in some bands, but the accuracy of the radiation pattern did not decrease, even when the sampling interval was increased.
Table 5 compares the gain and beam width of the horn antenna for verification based on the sampling interval. This is the measurement result for the minimum frequency (26.5 GHz), geometric mean frequency (32.6 GHz), and maximum frequency (40 GHz) bands in which the verification horn antenna operates. It may be confirmed that even when the sampling interval was increased in the entire frequency band, the measured values of the gain and radiation pattern coincided within approximately 0.5 dB. The method proposed by this algorithm reduced the existing near-field measurement samples by 40.49 %, and the measurement time was reduced by more than half.
5. Conclusions
In this article, a spherical near-field high-speed measurement system with multiple probe rotations is proposed. The measurement system consisted of a multi-probe array, switch matrix, downconverter, amplifier, attenuator, and digitizer. The measurement speed was improved by using a multi-channel digitizer to simultaneously perform measurements on 14 probes with 28 independent channels with vertical and horizontal polarizations. The applied spherical near-field measurement method measured the size and phase of the antenna, the results of which were used to derive a far-field radiation pattern through the Fourier transform to confirm the gain, beam width, and 3D radiation pattern of the antenna.
To analyze the accuracy of the proposed measurement system, an inter-comparison test with the far-field measurement system was performed, which confirmed that the gains were within ±1 dB of each other. Similar results were confirmed in the case of the radiation pattern.
Finally, a fast scan method was proposed to improve the measurement speed. The analyses of the measurement results and measurement time confirmed that there is no problem in obtaining accurate measurements even if the number of measurements on the phi axis is reduced for an antenna that has a focused beam and is a power concenter, such as a 5G pencil beam antenna or horn antenna. The measurement time was reduced by > 50%.
The proposed MPAR measurement system has wide applicability in measuring quickly and accurately the characteristics of next-generation antennas such as 5G beamforming antennas that require 3D radiation pattern measurement.
Author Contributions
Conceptualization, S.-H.P., G.-H.J. and H.-S.K.; methodology, S.-H.P. and H.-S.K.; validation, S.-H.P., G.-H.J., Y.-H.S. and H.-S.K.; formal analysis, S.-H.P., G.-H.J., H.-S.K. and S.-I.B.; investigation, S.-H.P., G.-H.J. and Y.-H.S.; resources, S.-H.P.; data curation, S.-H.P., H.-S.K. and S.-I.B.; writing—original draft preparation, S.-H.P., G.-H.J., H.-S.K. and S.-I.B.; writing—review and editing, H.-S.K. and S.-I.B.; visualization, S.-H.P., supervision, H.-S.K. and S.-I.B.; project administration, H.-S.K. and S.-I.B.; funding acquisition, H.-S.K. All authors have read and agreed to the published version of the manuscript.
Funding
This work was supported by Institute for Information & Communications Technology Promotion (IITP) grant funded by the Korean government (MSIT) (No. 1711065110, The Infrastructure Establishment of 3D Beam Measurement Facilities for 5G antenna using the Millimeter Wave Band).
Institutional Review Board Statement
Not applicable.
Informed Consent Statement
Not applicable.
Data Availability Statement
Not applicable.
Conflicts of Interest
The authors declare no conflict of interest.
References
- Babar Abbasi, M.A.; Tataria, V.; Fusco, V.F.; Matthaiou, M. On the Impact of Spillover Losses in 28 GHz Rotman Lens Arrays for 5G Application. In Proceedings of the IEEE MTT-S International Microwave Workshop Series on 5G Hardware and System Technologies (IMWS-5G), Dublin, Ireland, 30–31 August 2018; pp. 1–3. [Google Scholar]
- Osseiran, A.; Boccardi, F.; Braun, V.; Kusume, K.; Marsch, P.; Maternia, M.; Queseth, O.; Schellmann, M.; Schotten, H.; Taoka, H.; et al. Scenarios for 5G mobile and wireless communications: The vision of the METIS project. IEEE Commun. Mag. 2014, 52, 26–35. [Google Scholar] [CrossRef]
- Boccardi, F.; Heath, R.W.; Lozano, A.; Marzetta, T.L.; Popovski, P. Five disruptive technology directions for 5G. IEEE Commun. Mag. 2014, 52, 74–80. [Google Scholar] [CrossRef] [Green Version]
- Lin, Z.; An, K.; Niu, H.; Hu, Y.; Chatzinotas, S.; Zheng, G.; Wang, J. SLNR-based Secure Energy Efficient Beamforming in Multibeam Satellite Systems. IEEE Trans. Aerosp. Electron. Syst. 2022, 1–4. [Google Scholar] [CrossRef]
- Hu, Y.; Zhan, J.; Jiang, Z.H.; Yu, C.; Hong, W. An orthogonal hybrid analog–digital multibeam antenna array for millimeter-wave massive MIMO systems. IEEE Trans. Antennas Propag. 2021, 69, 1393–1403. [Google Scholar] [CrossRef]
- Lin, Z.; Lin, M.; de Cola, T.; Wang, J.-B.; Zhu, W.-P.; Cheng, J. Supporting IoT with Rate-Splitting Multiple Access in Satellite and Aerial-Integrated Networks. IEEE Internet Things J. 2021, 8, 11123–11134. [Google Scholar] [CrossRef]
- Kong, W.; Hu, Y.; Li, J.; Zhang, L.; Hong, W. 2-D Orthogonal Multibeam Antenna Arrays for 5G Millimeter-Wave Applications. IEEE Trans. Microw. Theory Tech. 2022, 70, 2815–2824. [Google Scholar] [CrossRef]
- Lin, Z.; Lin, M.; Wang, J.-B.; de Cola, T.; Wang, J. Joint Beamforming and Power Allocation for Satellite-Terrestrial Integrated Networks with Non-Orthogonal Multiple Access. IEEE J. Sel. Top. Signal Process. 2019, 13, 657–670. [Google Scholar] [CrossRef] [Green Version]
- Yoon, N.; Seo, C. A 28-GHz Wideband 2 × 2 U-Slot Patch Array Antenna. J. Electromagn. Eng. Sci. 2014, 17, 133–137. [Google Scholar] [CrossRef] [Green Version]
- Hong, W.; Jiang, Z.H.; Yu, C.; Zhou, J.; Chen, P.; Yu, Z.; Zhang, H.; Yang, B.; Pang, X.; Jiang, M.; et al. Multibeam Antenna Technologies for 5G Wireless Communications. IEEE Trans. Antennas Propag. 2017, 65, 6231–6249. [Google Scholar] [CrossRef]
- Hong, W. Solving the 5G Mobile Antenna Puzzle: Assessing Future Directions for the 5G Mobile Antenna Paradigm Shift. IEEE Microw. Mag. 2017, 18, 86–102. [Google Scholar] [CrossRef]
- Xia, H.; Zhang, T.; Li, L.; Zheng, F. A low-cost dual-polarized 28 GHz phased array antenna for 5G communications. In Proceedings of the International Workshop on Antenna Technology, Nanjing, China, 5–7 March 2018; pp. 1–4. [Google Scholar]
- ETSI. TS 138 151 V17.2.0. 5G; NR; User Equipment (UE) Multiple Input Multiple Output (MIMO) Over-the-Air (OTA) Performance Requirements; Technical Report; ETSI: Valbonne, France, 2022. [Google Scholar]
- Francis, M.H. IEEE Recommended Practice for Near-Field Antenna Measurements. IEEE Stand. 2012, 1720, 1–102. [Google Scholar]
- Foged, L.J.; Barone, G.; Saccardi, F. Antenna measurement systems using multi-probe technology. In Proceedings of the IEEE Conference on Antenna Measurements & Applications (CAMA), Chiang Mai, Thailand, 30 November–2 December 2015; pp. 1–3. [Google Scholar]
- Slater, D. Near-Field Antenna Measurements; Artech House: Norwood, MA, USA, 1991. [Google Scholar]
- Hansen, J.E. Spherical Near-Field Antenna Measurements; Peter Peregrinus: London, UK, 1988. [Google Scholar]
- Jensen, F.; Frandsen, A. On the number of modes in spherical wave expansions. Antenna Meas. Tech. Assoc. Annu. Symp. Proc. 2004, 2, 489–494. [Google Scholar]
- Li, P.; Jiang, L.J. An iterative source reconstruction method exploiting phaseless electric field data. Prog. Electromagn. Res. 2013, 134, 419–435. [Google Scholar] [CrossRef] [Green Version]
- Li, P.; Li, Y.; Jiang, L.J.; Hu, J. A wide-band equivalent source reconstruction method exploiting the Stoer-Bulirsch algorithm with the adaptive frequency sampling. IEEE Trans. Antennas Propag. 2013, 61, 5338–5343. [Google Scholar] [CrossRef] [Green Version]
- Schnattinger, G.; Lopez, C.; Kılıç, E.; Eibert, T.F. Fast near-field far-field transformation for phaseless and irregular antenna measurement data. Adv. Radio Sci. 2014, 12, 171–177. [Google Scholar] [CrossRef] [Green Version]
- Saccardi, F.; Foged, L.J.; Mioc, F.; Iversen, P.O. Application of the translated-SWE algorithm to echo reduction of spherical near-field measurements with undersampling. In Proceedings of the 2017 11th European Conference on Antennas and Propagation (EUCAP), Paris, France, 19–24 March 2017; pp. 2856–2860. [Google Scholar]
- Gillespie, E.S. Special Issue on near-field scanning techniques. IEEE Trans. Antennas Propag. 1988, 36, 727–901. [Google Scholar]
- Gennarelli, C.; Capozzoli, A.; Foged, L.J.; Fordham, J.; Rensburg, V.; Janse, D. Recent Advances in Near-Field to Far-Field Transformation Techniques. Int. J. Antennas Propag. 2012, 2012, 243203. [Google Scholar] [CrossRef] [PubMed]
- Bucci, O.M.; Gennarelli, C.; Savarese, C. Representation of Electromagnetic Fields over Arbitrary Surfaces by a Finite and Nonredundant Number of Samples. IEEE Trans. Antennas Propag. 1998, 46, 351–359. [Google Scholar] [CrossRef]
- Culotta-López, C.; Heberling, D.; Bangun, A.; Behboodi, A.; Mathar, R. A Compressed Sampling for Spherical Near-Field Measurements. In Proceedings of the 2018 AMTA Proceedings, Williamsburg, VA, USA, 4–9 November 2018; pp. 1–6. [Google Scholar]
- Cornelius, R.; Heberling, D.; Koep, N.; Behboodi, A.; Mathar, R. Compressed sensing applied to spherical near-field to far-field transformation. In Proceedings of the Tenth European Conf. Antennas and Propagation (EuCAP), Davos, Switzerland, 10–15 April 2016. [Google Scholar]
- Loschenbrand, D.; Mecklenbrauker, C. Fast antenna characterization via a sparse spherical multipole expansion. In Proceedings of the Fourth Int. Workshop on Compressed Sensing Theory and its Applications to Radar, Sonar and Remote Sensing (CoSeRa), Aachen, Germany, 19–22 September 2016. [Google Scholar]
- Cornelius, R.; Heberling, D. Analysis of Sampling Grids for Spherical Near-Field Antenna Measurements. 2015. Available online: https://www.researchgate.net/publication/281279094_Analysis_of_Sampling_Grids_for_Spherical_Near-field_Antenna_Measurements (accessed on 1 September 2022).
- Saad, Y.; Schultz, M.H. GMRES: A Generalized Minimal Residual Algorithm for Solving Nonsymmetric Linear Systems. SIAM J. Sci. Stat. Comput. 1986, 7, 856–869. [Google Scholar] [CrossRef]
| Publisher’s Note: MDPI stays neutral with regard to jurisdictional claims in published maps and institutional affiliations. |
© 2022 by the authors. Licensee MDPI, Basel, Switzerland. This article is an open access article distributed under the terms and conditions of the Creative Commons Attribution (CC BY) license (https://creativecommons.org/licenses/by/4.0/).


