Article

Research on UAV Safety Distance Warning Technology Based on Electric Field Ring Rate of Change

1
Electric Power Research Institute, Yunnan Power Grid Co., Ltd., Kunming 650217, China
2
State Key Laboratory of Power Transmission Equipment and System Security and New Technology, Chongqing University, Chongqing 400044, China
3
College of Mechanical and Electrical Engineering, Kunming University of Science and Technology, Kunming 650504, China
4
College of Science, Kunming University of Science and Technology, Kunming 650504, China
*
Author to whom correspondence should be addressed.
Electronics 2022, 11(21), 3439; https://doi.org/10.3390/electronics11213439
Submission received: 25 September 2022 / Revised: 14 October 2022 / Accepted: 17 October 2022 / Published: 24 October 2022

Abstract

:
With the increasing scale of transmission lines, drone inspection has become a major method of transmission line inspection. In the process of UAV inspection, the safety distance warning of UAV and transmission lines is crucial, and the existing UAV safety distance warning methods have difficulties, such as high cost, low environmental adaptability, and data processing. In this paper, we propose a safety distance warning method based on the rate of change of electric field ring ratio, which can be applied to the inspection process of transmission lines of different voltage levels. In order to accurately measure the electric field strength around the transmission lines, a three-dimensional electric field measurement system for measuring the electric field in space is designed in this paper. Finally, a 10 kV three-phase transmission line experimental platform was built to verify the feasibility of the method proposed in this paper.

1. Introduction

With the continuous development of the electric power system, the scale of high-voltage overhead power lines has grown unprecedentedly, and in recent years, drone inspection is a method that is widely used for overhead transmission line inspection [1]. When the staff manages the UAV to inspect the transmission lines, once there is an operational error, the UAV deviates from the flight path, resulting in “blowing up” or “hitting the tower”. Therefore, it is important to study the safety distance warning technology for UAV inspection of transmission lines.
In terms of safe distance warning for UAVs, the range sensors used mainly contain ultrasonic, infrared, and laser methods. Based on columnar space and the support vector machine algorithm, Zhang Jian of Nanjing University of Aeronautics and Astronautics gave a method of obstacle avoidance during UAV patrol to guarantee safe UAV patrol [2]. Reference [3] proposed a safety warning method for overhead transmission lines based on binocular vision, but the use of machine vision to achieve safe distance warning is also affected by weather and other factors, and the environmental adaptability is not high. Reference [4] proposed a safety distance diagnosis scheme for UAV based on LiDAR data, and the problem of this method is the large amount of LiDAR point cloud data and low detection efficiency. In reference [5], a method of using airborne laser scanning data to diagnose the safety distance of transmission lines was proposed. The problem of using lasers to detect transmission lines is that they are affected by the size of transmission line wire diameter and the characteristic data of transmission lines are easily affected by the surrounding environmental factors. In reference [6], Xiangyang Peng’s team at Wuhan University proposed a safety inspection system based on multi-sensor information fusion to achieve safety distance detection and equipment for abnormal condition detection for transmission lines by combining UV, IR, visible light, and laser sensor data.
Considering that the electric field information around the transmission line is not easily affected by environmental factors, related scholars start from the electric field information around the transmission line, reflect the distance between the UAV and the transmission line through the electric field information, and issue an alarm signal when the measured electric field strength reaches the safety threshold to play the role of safety distance warning [7,8,9]. References [10,11] establish a fitting relationship between electric field strength and distance through the electric field data obtained from the electric field sensor measurements and calculate the distance between the UAV and the transmission line in real time based on the fitting relationship. References [12,13] proposed a safe distance diagnosis method for UAVs based on multi-sensor data fusion, which includes the electric field data around transmission lines. Reference [14] proposed an electric field gradient calculation method for vector electric field to achieve safe distance warning by calculating the electric field gradient.
Reference [15] developed a wireless communication-based IFE measurement warning system to achieve safety distance warning through the electric field strength collected by the IFE sensor. However, due to the different safety distances of different voltage levels, the safety field strength thresholds at the safety distance are also different, which leads to the existing equipment not achieving an accurate safety distance warning. In order to avoid the early warning error caused by different voltage levels, related scholars have studied the support vector machine-based transmission line voltage level identification algorithm, which can identify the voltage level of transmission lines in the process of approaching transmission lines and then use different thresholds for alarm according to the identified voltage level [16].
In summary, this paper proposes a safety distance warning method based on the electric field ring rate of change, which reflects the trend of electric field change, is not affected by the voltage level of transmission lines, and can be used in the scenario of UAV inspection of transmission lines with different voltage levels.
Moreover, the electric field intensity of transmission lines with different voltage levels is quite different, and the loop ratio change rate of electric field proposed in this paper is the same for transmission lines with different levels. The traditional early warning method uses fixed electric field strength as the early warning threshold, which has poor adaptability and low early warning accuracy. The method of electric field ring ratio change rate proposed in this paper can make up for the shortcomings of the traditional early warning method.

2. Drone Safety Distance Analysis

According to reference [17], the electric field strength that the UAV can withstand is 10 kV/m. In order to determine the safe flight area of the UAV around the transmission line, this paper simulates the electric field distribution law under three different arrangements of horizontal arrangement, positive triangle arrangement, and inverted triangle arrangement at different voltage levels by means of COMSOL finite element simulation.

2.1. Simplified Model Analysis of Transmission Lines

To facilitate the computational analysis, the simulation model needs to be simplified when using COMSOL for simulation.
  • The industrial frequency electromagnetic fields generated by high-voltage transmission lines should be considered as quasi-static fields;
  • The earth is treated as an infinite plane and set as a good conductor, and the potential of the ground is taken to be 0;
  • Split conductors of transmission lines are replaced using columns of equivalent radius;
  • A complex voltage vector is used to represent the potential to ground of each phase of the transmission line;
  • Using the vector form to represent the changes in voltage and current of high-voltage transmission lines and setting the ground as the potential reference point, the representation of the voltage and line current of each phase of the transmission line can be expressed as:
U ˙ A = U A R + j U A I U ˙ B = U B R + j U B I U ˙ C = U C R + j U C I I ˙ A = I A R + j I A I I ˙ B = I B R + j I B I I ˙ C = I C R + j I C I
Figure 1 shows the calculation diagram of real part and imaginary part of voltage of single-phase transmission line. According to Figure 1, the calculation method of the real part and imaginary part of each phase voltage is Equation (1), where θ is the initial phase angle.
The potential of the transmission line to the ground is expressed as:
U ˙ A R = U A cos θ U ˙ A I = U A sin θ U ˙ B R = U A cos θ 120 ° U ˙ B I = U A sin θ 120 ° U ˙ C R = U A cos θ + 120 ° U ˙ C I = U A sin θ + 120 °
Although the voltage effective value of three-phase high-voltage transmission lines is the same, 1.05 times of the rated voltage is usually taken as the calculation value in the actual engineering calculation, and the calculation formula is shown in formula (3), where v is the line voltage of the transmission line.
U A = U B = U C = ν × 1.05 3

2.2. Establishment of Simulation Model of Electric Field Distribution around the Three-Phase Transmission Line

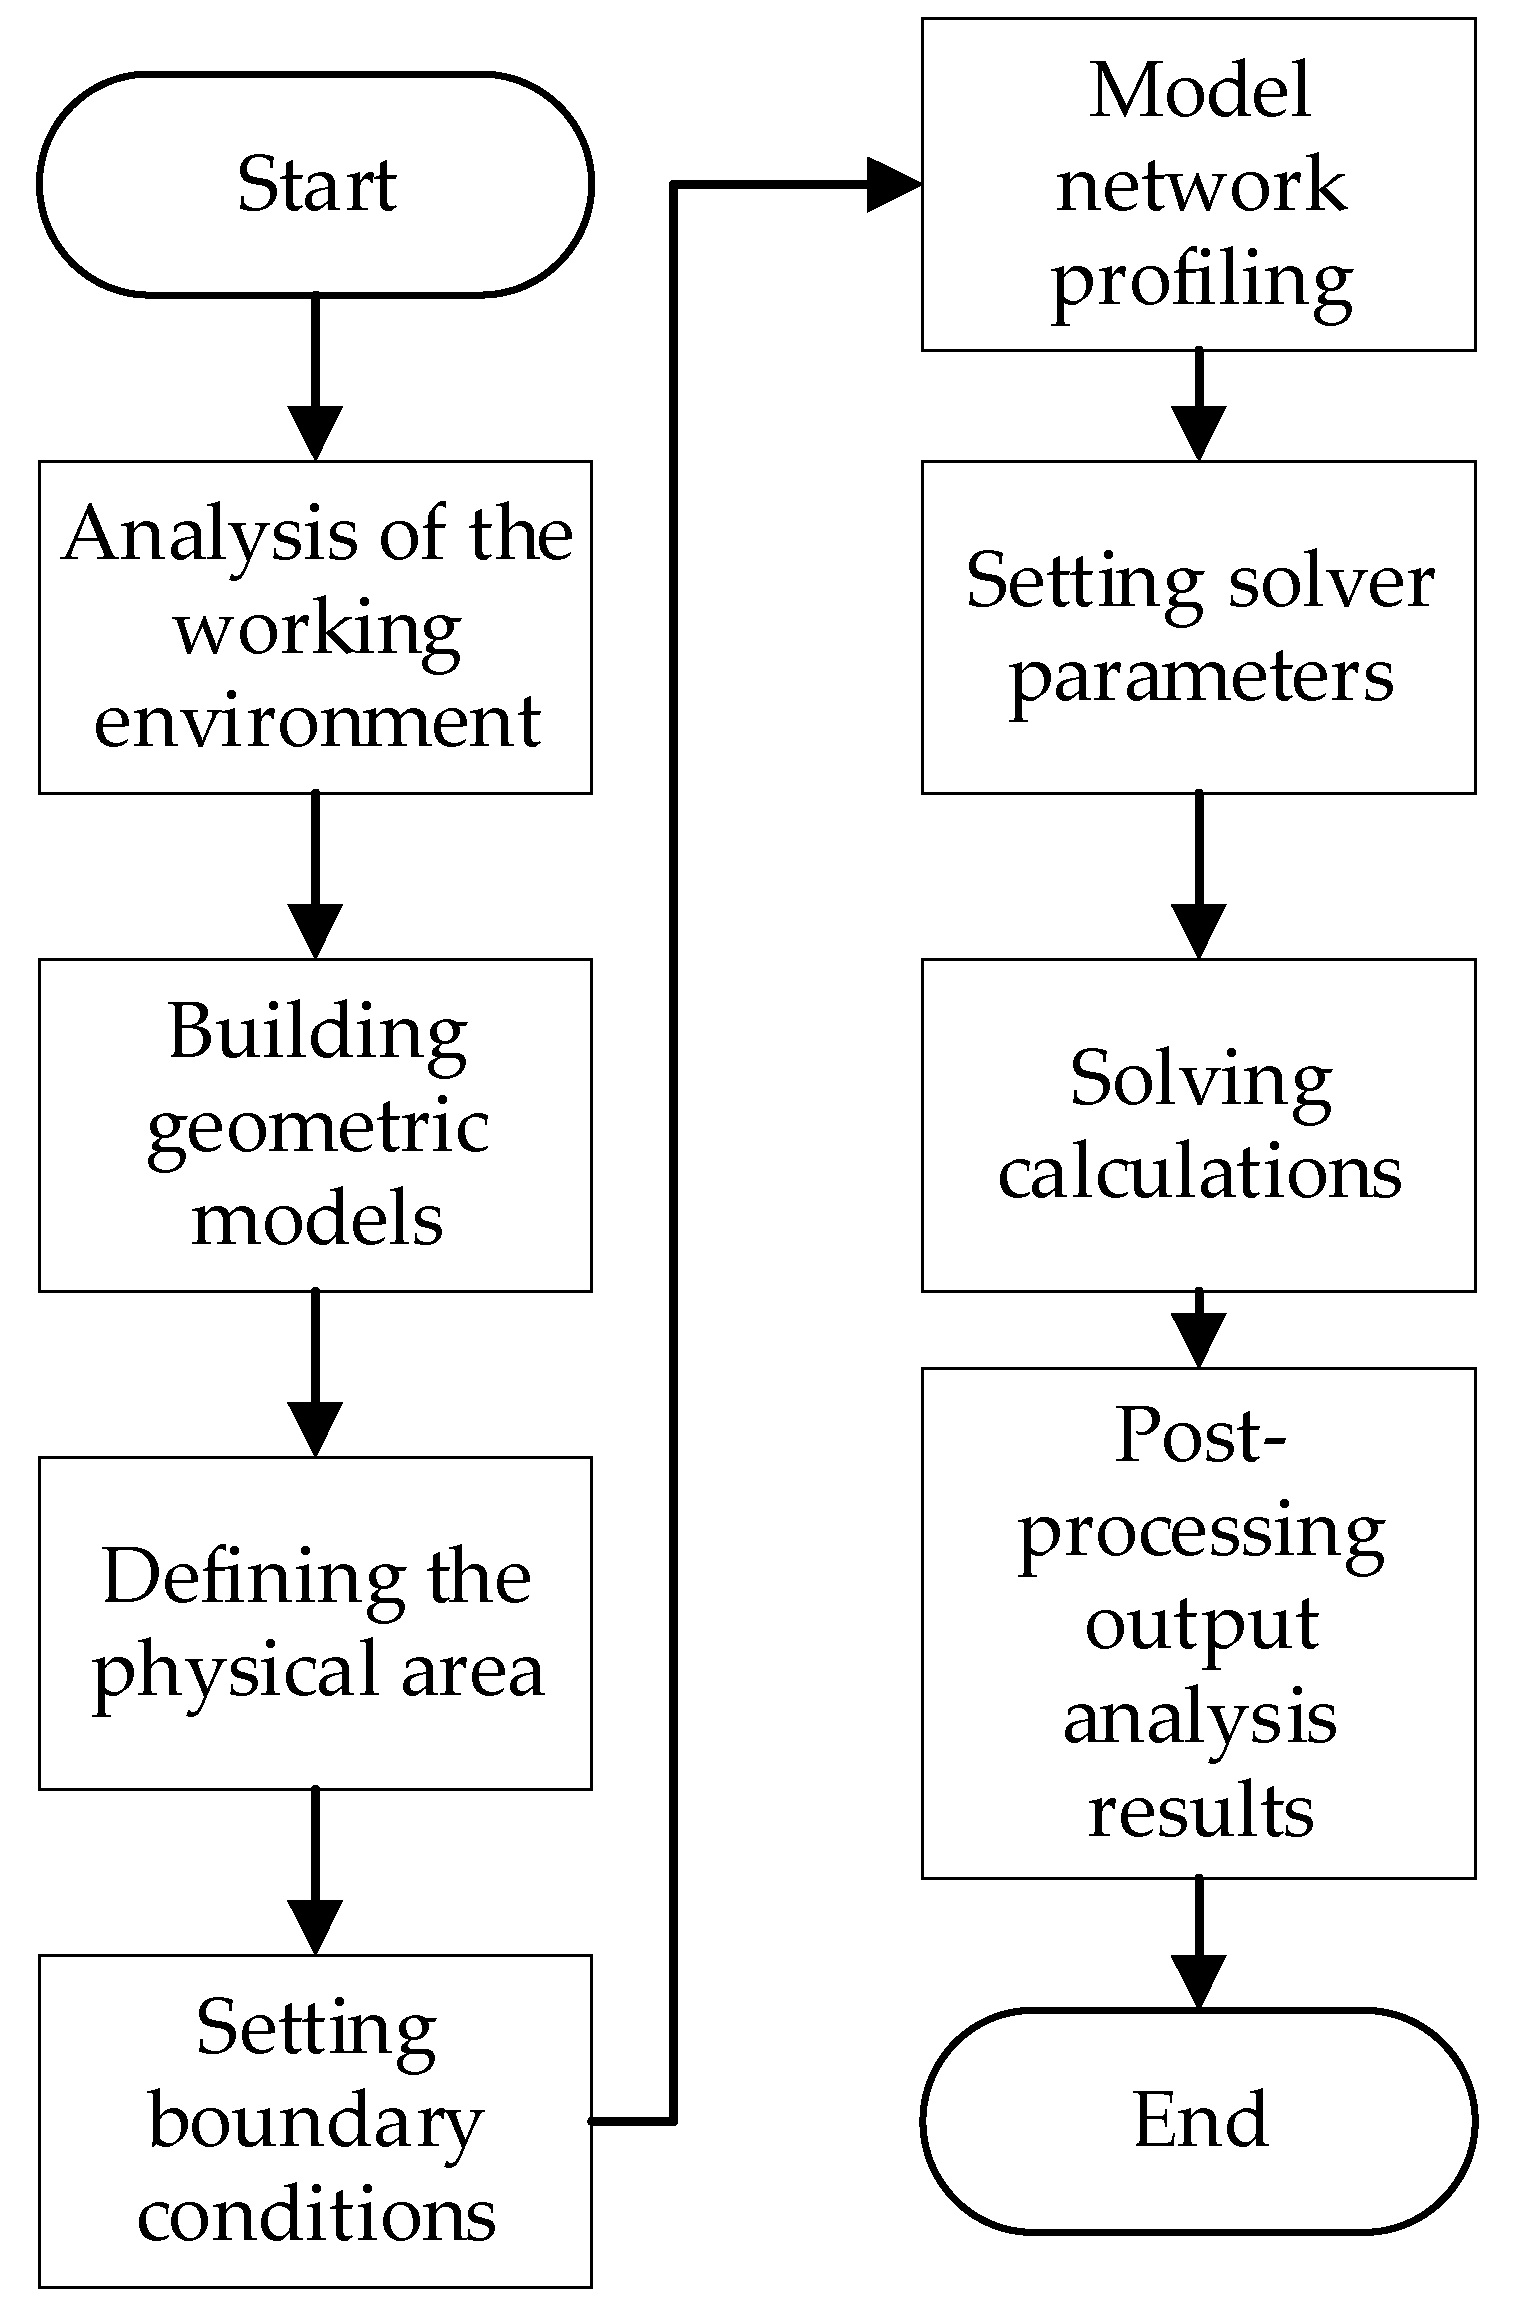
The simulation flow chart of COMSOL is shown in Figure 2.
In this paper, the electric field around the transmission line is analyzed as a quasi-static field, and its calculation is based on the electrostatic field equation in Equation (3). Therefore, the electrostatic field in the ac/dc module in COMSOL is selected as the calculation equation in this paper. The specific steps of simulation are:
  • Step 1: According to the size and spacing of transmission lines under different voltage levels, a simulation model is directly established in COMSOL multi-physics to simulate the distribution of transmission lines under real conditions;
  • Step 2: According to the actual situation, the physical parameters under each part of the model are set, the relative dielectric constant of the air is set to 1, and the material of the transmission line is set to aluminum;
  • Step 3: Set the boundary conditions, set the lower surface of the air domain as grounding, and set the rest as zero charge, i.e; set the corresponding voltage on the ABC three-phase transmission line according to Equation (2) and set the initial phase angle to 0. Equation (5) is the obtained three-phase voltage value.
D = ρ E = 0
V A = U 3 + j 0 V B = U cos ( 2 π / 3 ) 3 + j U sin ( 2 π / 3 ) 3 V C = U cos ( 2 π / 3 ) 3 + j U sin ( 2 π / 3 ) 3
  • Step 4: In order to divide the grid more accurately, the transmission line model and the air domain model are divided into grids in the simulation process. The transmission line is set as super fine and the air is set as fine;
  • Step 5: In order to make the simulation more accurate, select the iterative solver for research and calculation.

2.3. Determination of Safety Distance at Different Voltage Levels

In order to analyze the safety distance under different voltage levels, three different voltage levels of 10 kV, 110 kV, and 220 kV are selected for research in this paper. Referring to relevant data [18,19], the relevant parameters of 110 kV and 220 kV transmission lines are determined as follows (Table 1):
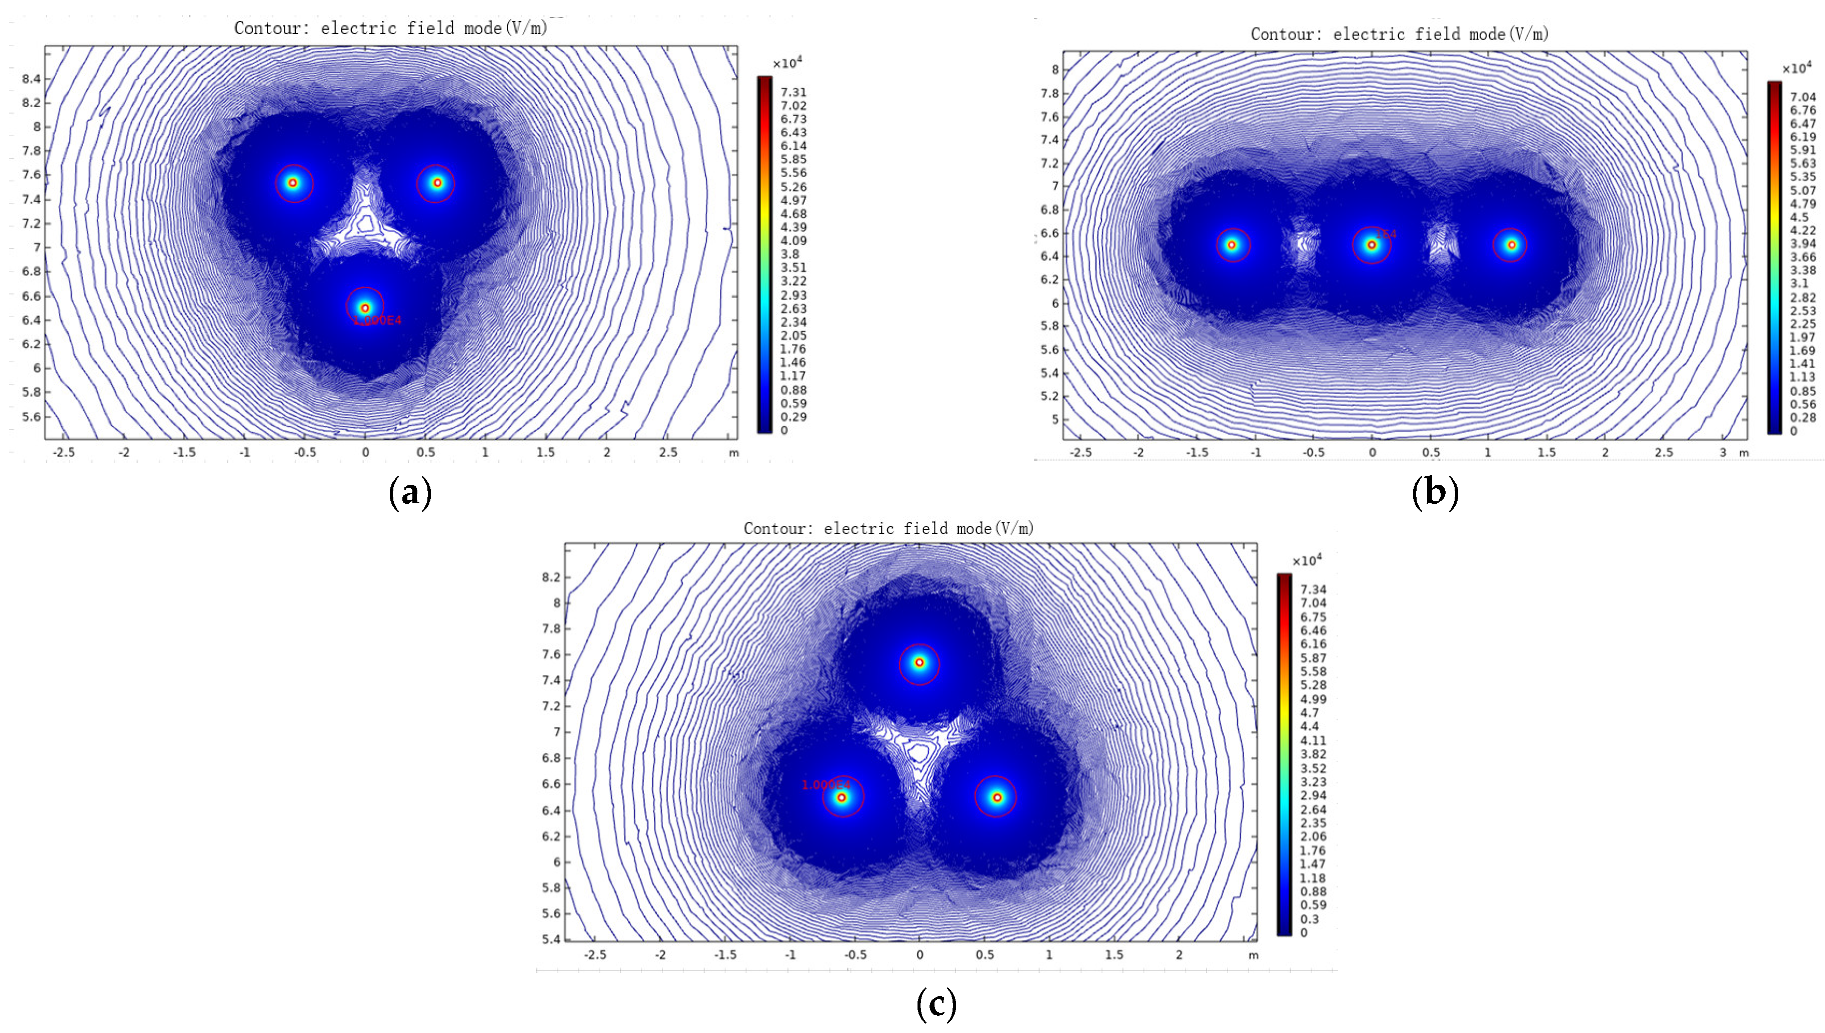
Firstly, the 10 kV Transmission line is analyzed. According to the parameters of the transmission line in the above table, a 10 kV simulation model is built in COMSOL. Figure 3 shows the simulation results of different arrangement modes of transmission lines under 10 kV voltage level.
It can be seen from the above that the maximum electric field threshold that the UAV can withstand is 10 kv/m. For the 10 kV three-phase transmission line, the 10 kv/m equipotential line is very close to the transmission line. Therefore, in order to highlight the 10 kv/m equipotential line, the red line is used here. The area beyond the red line is the area where the UAV can fly. Extract the data in Figure 3 to visually display the safe distance between the UAV and the transmission line in the form of data. The extracted data are shown in Table 2:
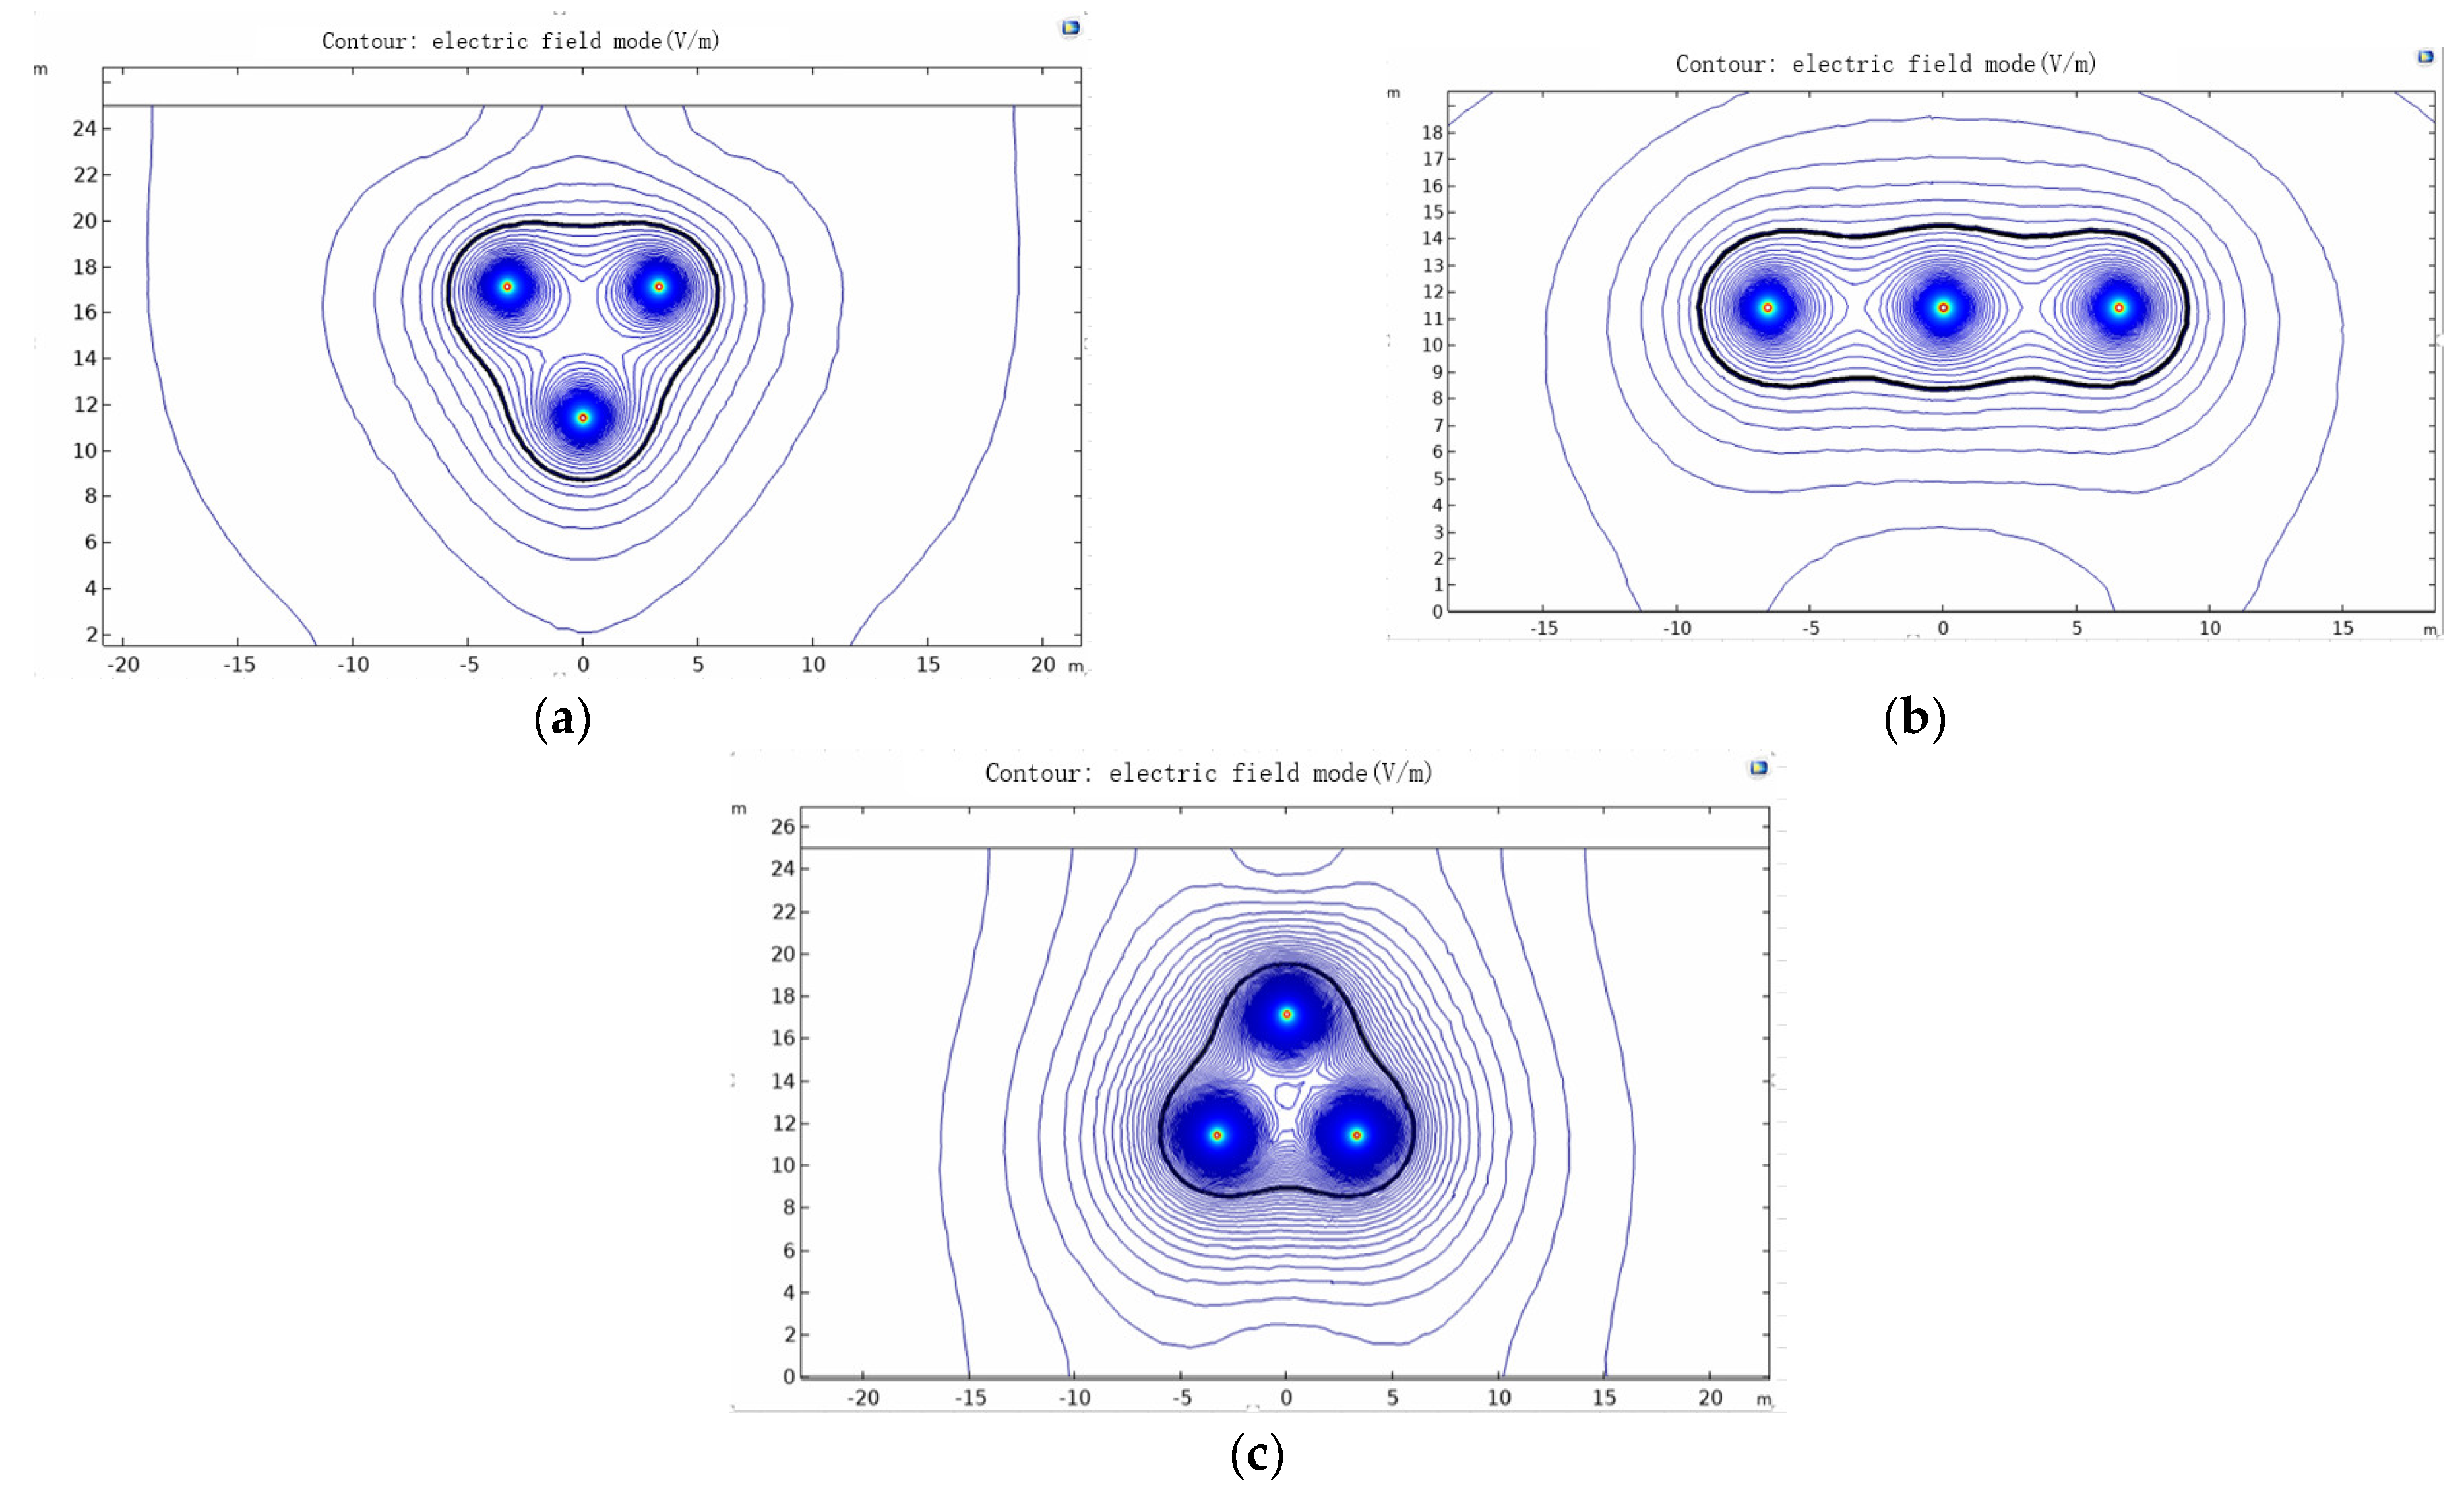
According to the parameters of 110 kV voltage grade transmission lines, a simulation model is built in COMSOL. Figure 4 shows the simulation results obtained from different arrangement modes of transmission lines in the 110 kV voltage grade.
As shown in Figure 4, the thick black line in the figure represents the 10 kv/m isoelectric field line. The area within the isoelectric field line is the area with an electric field strength greater than 10 kv/m, and the area outside the isoelectric field line is the area with an electric field strength less than 10 kv/m, that is, the area where the UAV can fly.
We extracted the data in the simulation diagram to visually show the safe distance between the UAV and the transmission line in the form of data. The extracted data are shown in Table 3:
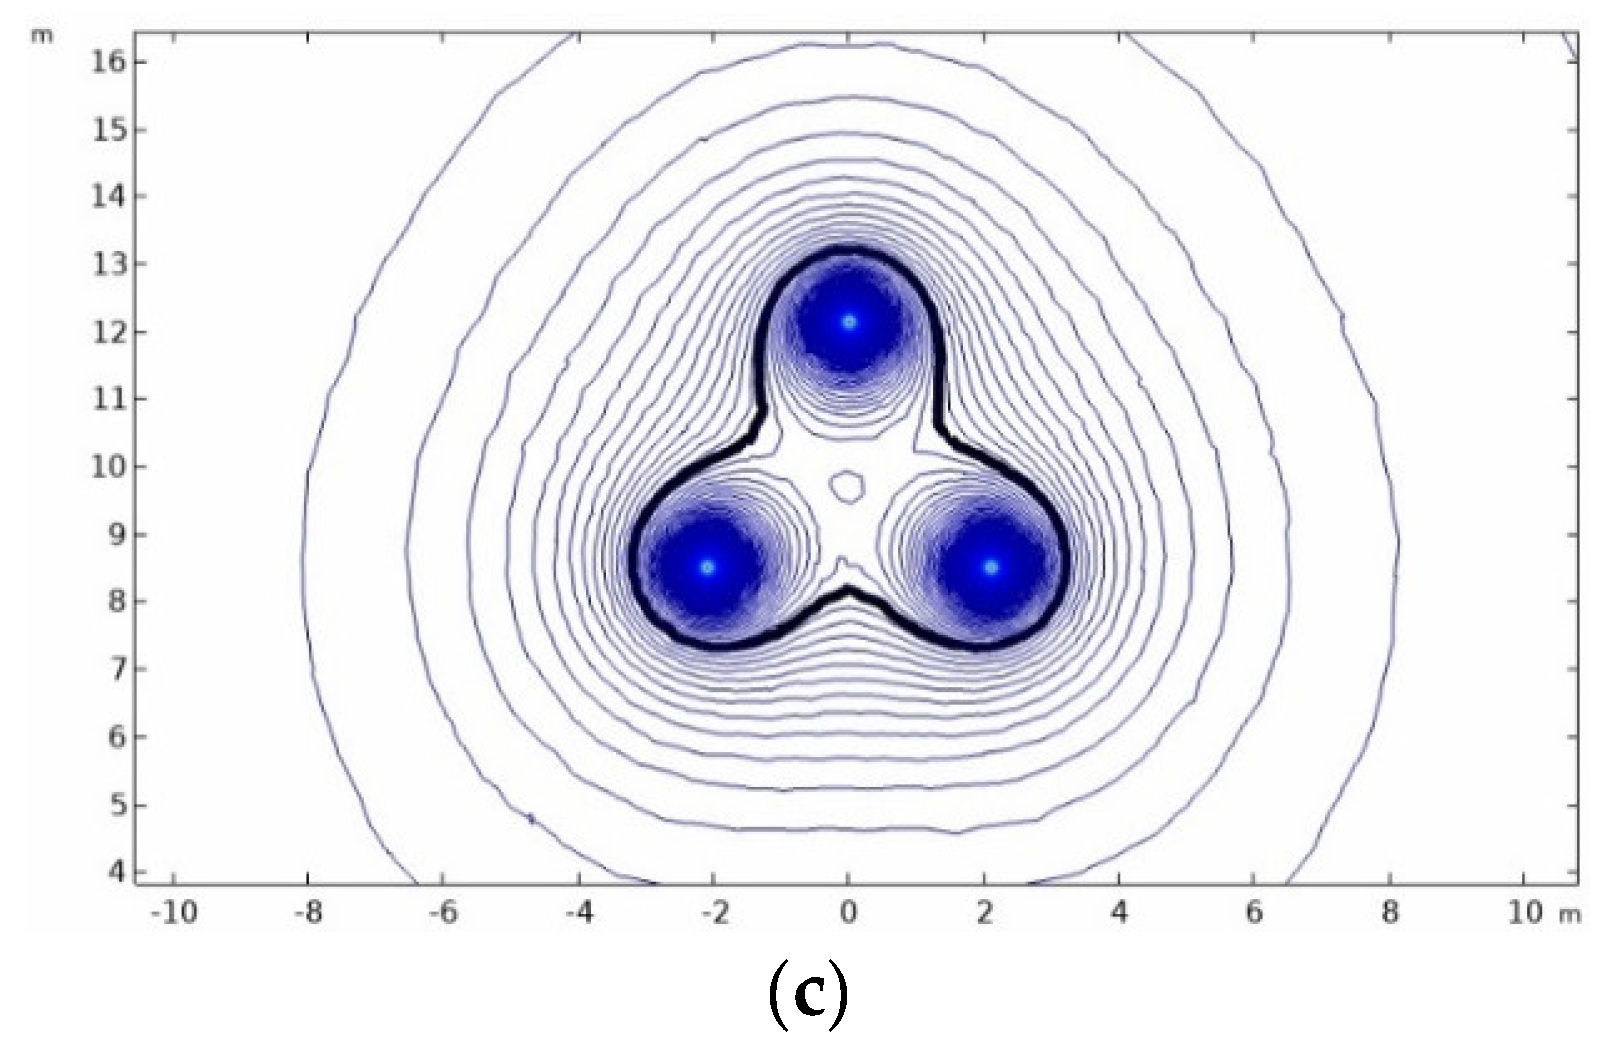
According to the parameters of 220 kV transmission line, a model with the same boundary conditions and material properties as those around 110 kV was established in COMSOL, and the simulation results are shown in Figure 5.
Similarly, the thick black line in the simulation diagram is the electric field threshold line of 10 kV/m. The data in the simulation diagram is extracted and summarized as the safety distance data in Table 4, as follows.
From the above analysis, we can see that the safety distance of the transmission line drones under different voltage levels is different, so it is also impossible to use the safety distance determined by the electric field strength that the drones can withstand as the basis for the safety warning of the drones.

3. Research on Safe Distance Early Warning Method Based on Electric Field Cycle Change Rate

The electric field sensor detects the electric field strength in the space. If the electric field strength value is used to judge whether the UAV has reached the safe distance threshold, the electric field strength at the same distance from the transmission line will be different with different voltage levels, and the electric field strength will be distorted due to the influence of the pole and tower, resulting in the increase or decrease of the electric field strength. In other words, the electric field intensity can reflect the voltage level of the transmission line, but it cannot reflect the distance between the UAV and the transmission line under different voltage levels. In consideration of the above problems, this paper defines a parameter that can represent the variation law of electric field—the loop change rate of electric field K, which reflects the distance relationship between the UAV and transmission line through the change of K, and the calculation method of K is as follows:
K i = ( E i + 1 E i ) / max { E i , E i + 1 } × 100
In the above formula, E i , is the electric field at position I, i = 1,2,3……
It can be seen from the above formula that the value of K analyzes the change rate of the electric field. For E i and E i + 1 , because the value measured by the same sensor in the same environment is used, the value of K can eliminate the influence of errors between sensors on the results. On the other hand, at the same distance from the transmission line, the relationship between voltage level and electric field intensity is approximately linear, so K value is not affected by voltage level and directly reflects the position relationship between UAV and transmission line.
In order to study the change law of the ring specific change rate k of the electric field around the transmission line, the horizontal arrangement, positive triangle arrangement, and inverted triangle arrangement of the three-phase transmission line are analyzed, respectively. As shown in Figure 6, we calculated the electric field intensity value and electric field ring ratio change value at the flight path of the UAV close to the transmission line at three angles of 0°, 45°, and 90°.
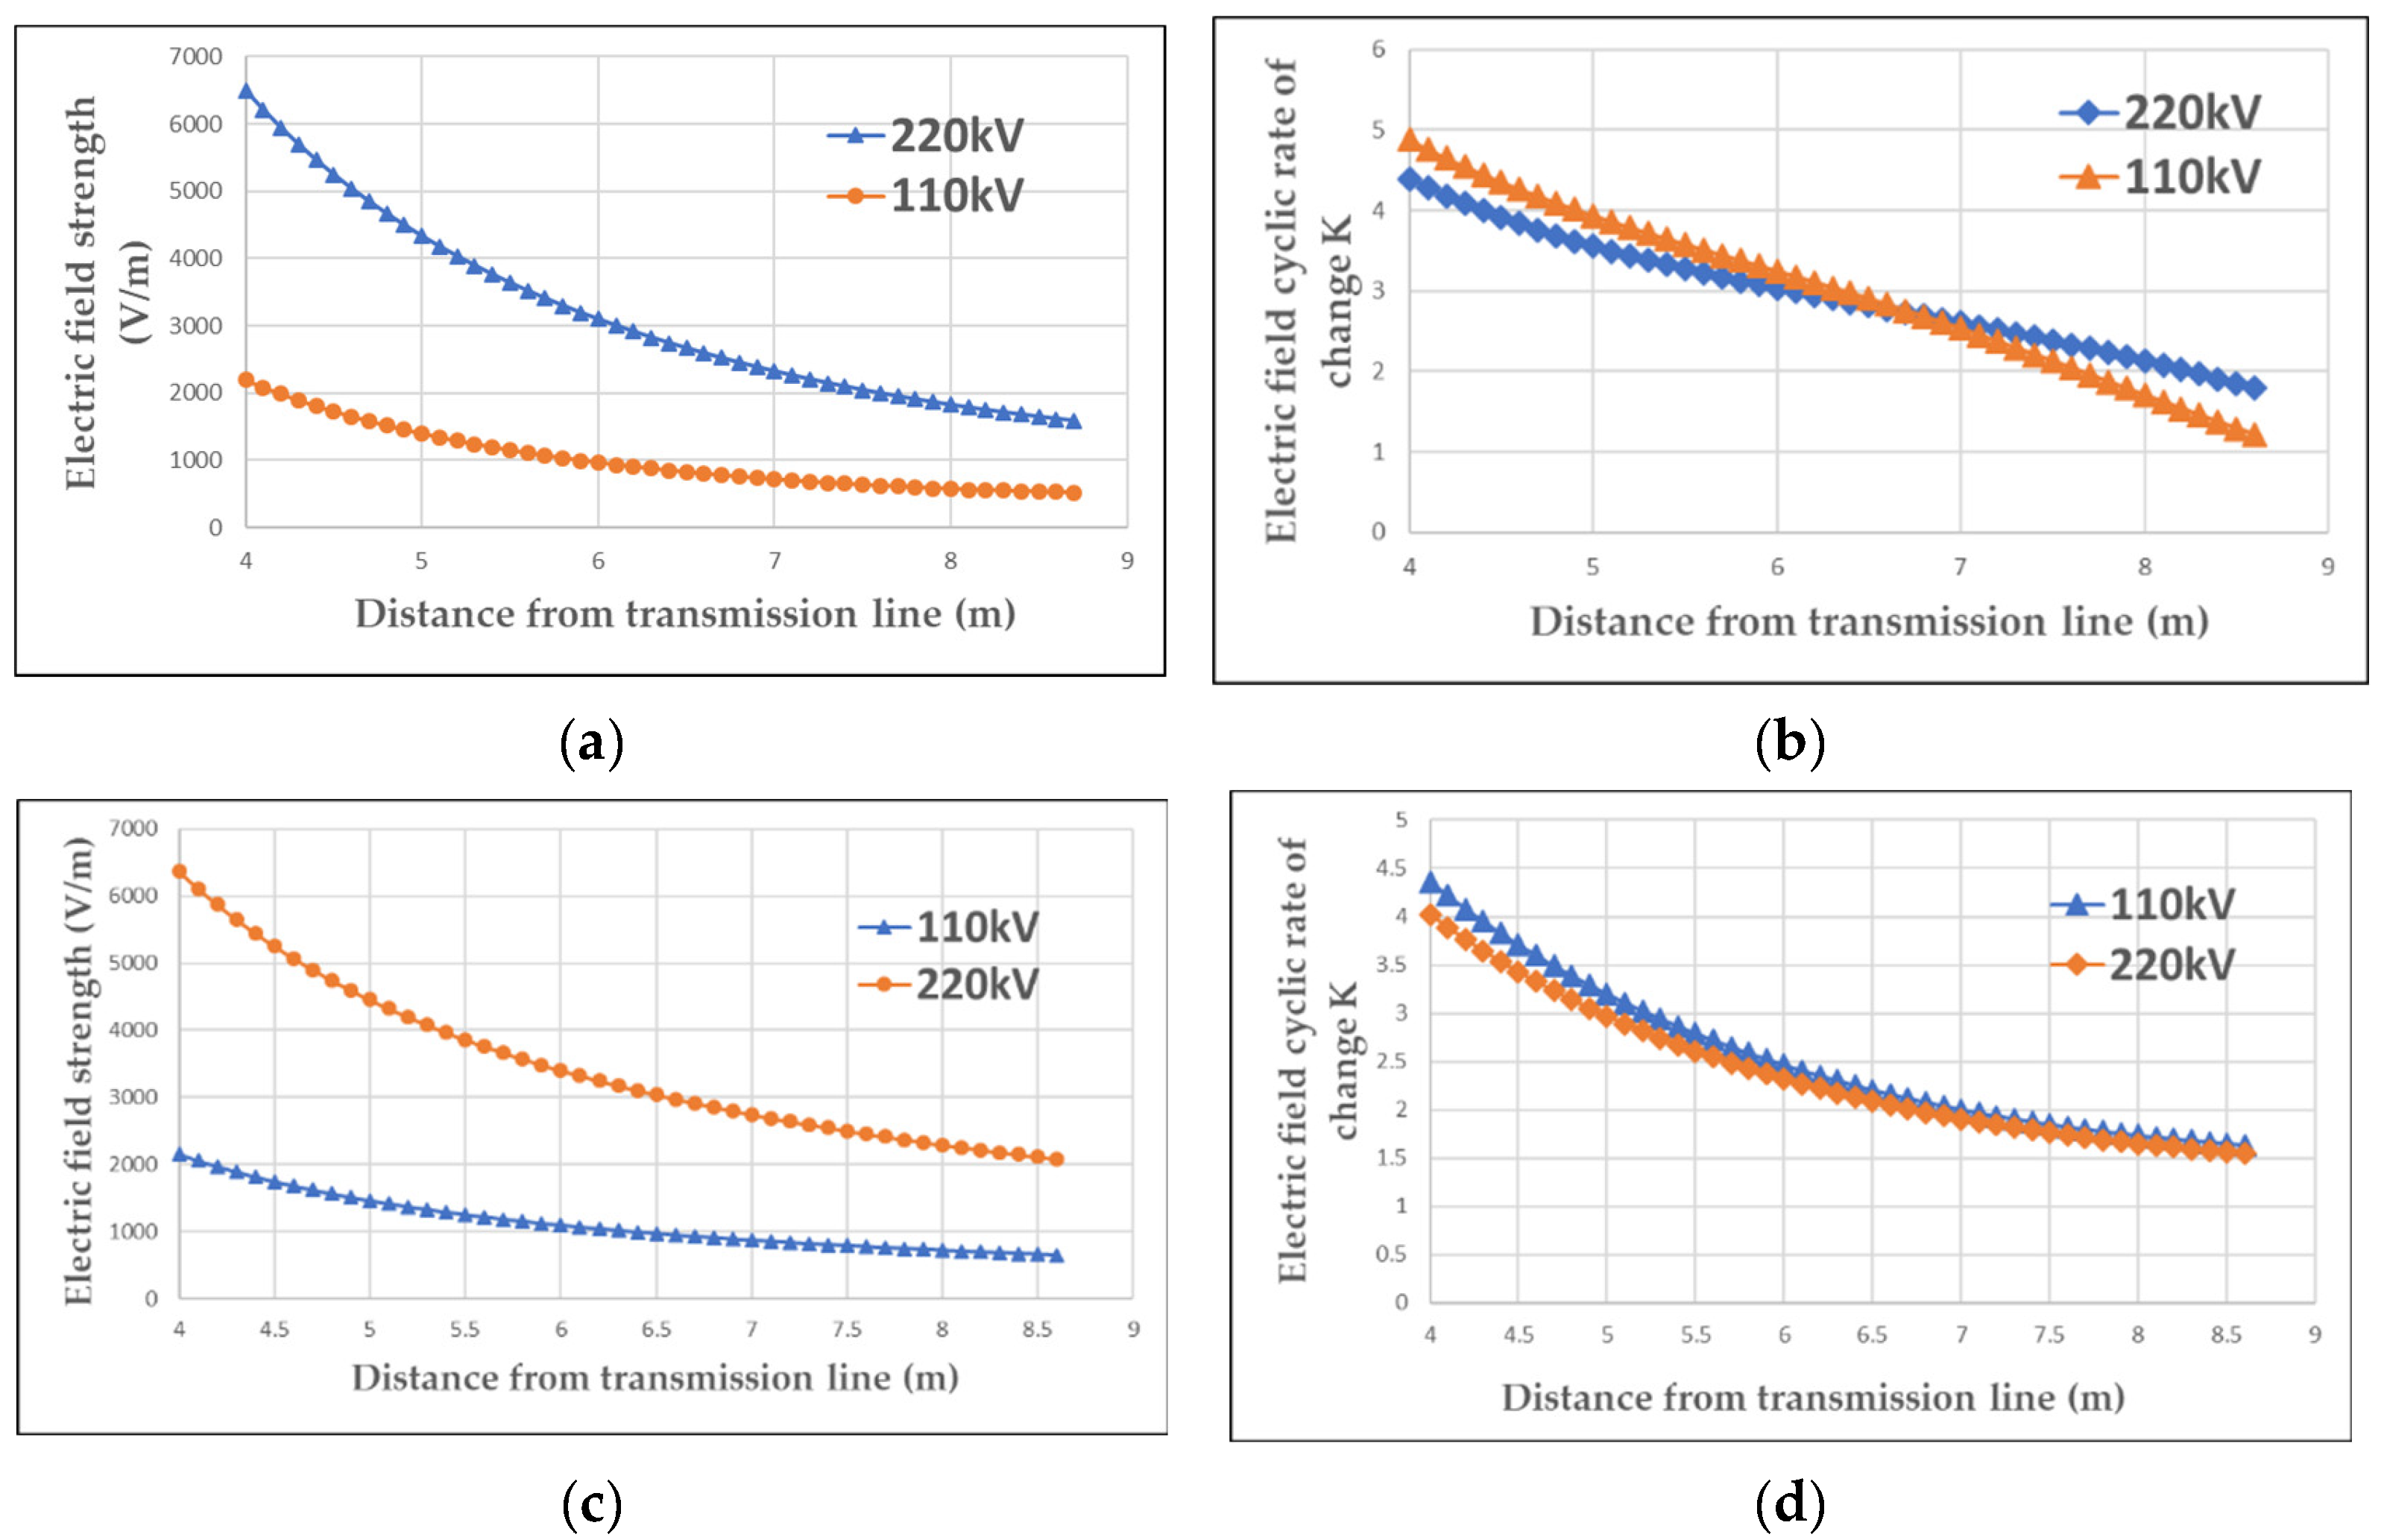
In order to analyze the variation law of K value on the flight path of UAV with different voltage levels, this paper selects 110 kV and 220 kV transmission lines with different voltage levels for analysis. Firstly, the flight path of 45° in the horizontal arrangement mode is analyzed. In addition, since the safety distance of 110 kV three-phase transmission line is 2.64 M and that of 220 kV three-phase transmission line is 3.93 M, in order to take into account both voltage levels when analyzing the safety distance, the safety distance is set to 4 m, that is, the electric field strength and the ring ratio change of the electric field are calculated from the position 4 m away from the transmission line. Figure 7a is the electric field intensity curve of 110 kV and 220 kV three-phase transmission lines on the 45° flight path, and Figure 7b is the electric field cycle change rate curve of 110 kV and 220 kV three-phase transmission lines on the 45° flight path.
It can be seen from Figure 7a that, for the electric field strength, when the voltage levels are different, even if the distance from the transmission line and the angle of flying to the transmission line are the same, there is a large difference in the electric field strength. Although the voltage levels are different, the electric field ring change rate k is almost the same. Therefore, it can be explained that the electric field ring change rate k can be used to reflect the distance between the UAV and the transmission line.
Since the above arrangement is the horizontal arrangement of three-phase transmission lines, it is necessary to analyze the three-phase transmission lines of the other two arrangements. Figure 8 shows the results of two cases of triangular arrangement and inverted triangular arrangement on the 45 degree flight path:
It can be concluded from the above simulation results of the positive triangle arrangement and the inverted triangle arrangement that the change law of the loop specific change rate k of the electric field on the flight path at the same angle under the same arrangement is the same.
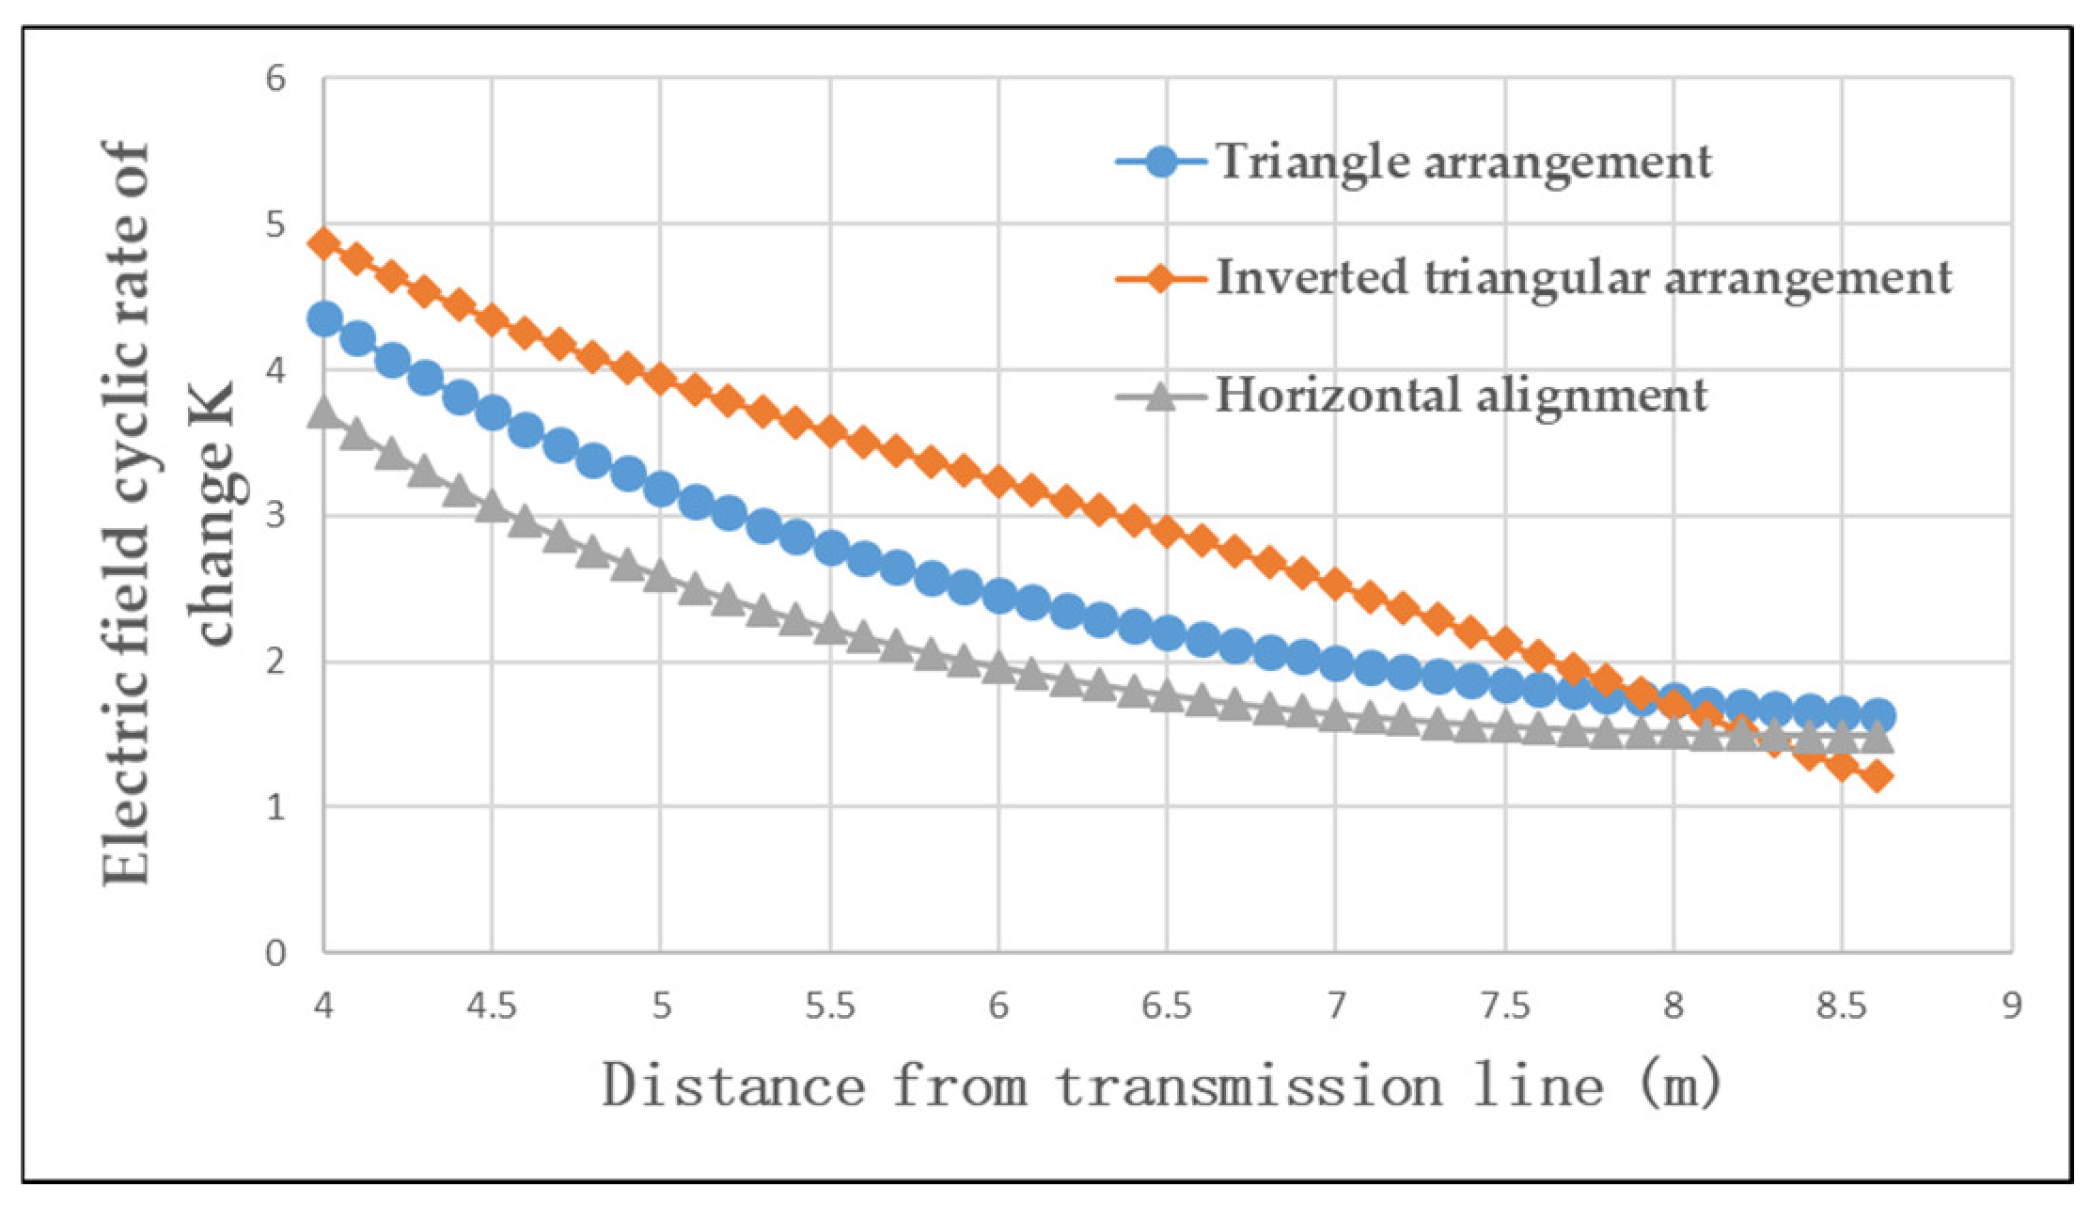
In order to analyze the change law of the loop specific change rate k value of the electric field at the same angle under different arrangement modes, this paper gives the K value curve on the 45 degree flight path of 110 kV under three different arrangement modes, as shown in Figure 9. It can be seen that there are differences in K values for different arrangements. That is to say, the arrangement of three-phase transmission lines affects the variation law of electric field strength.
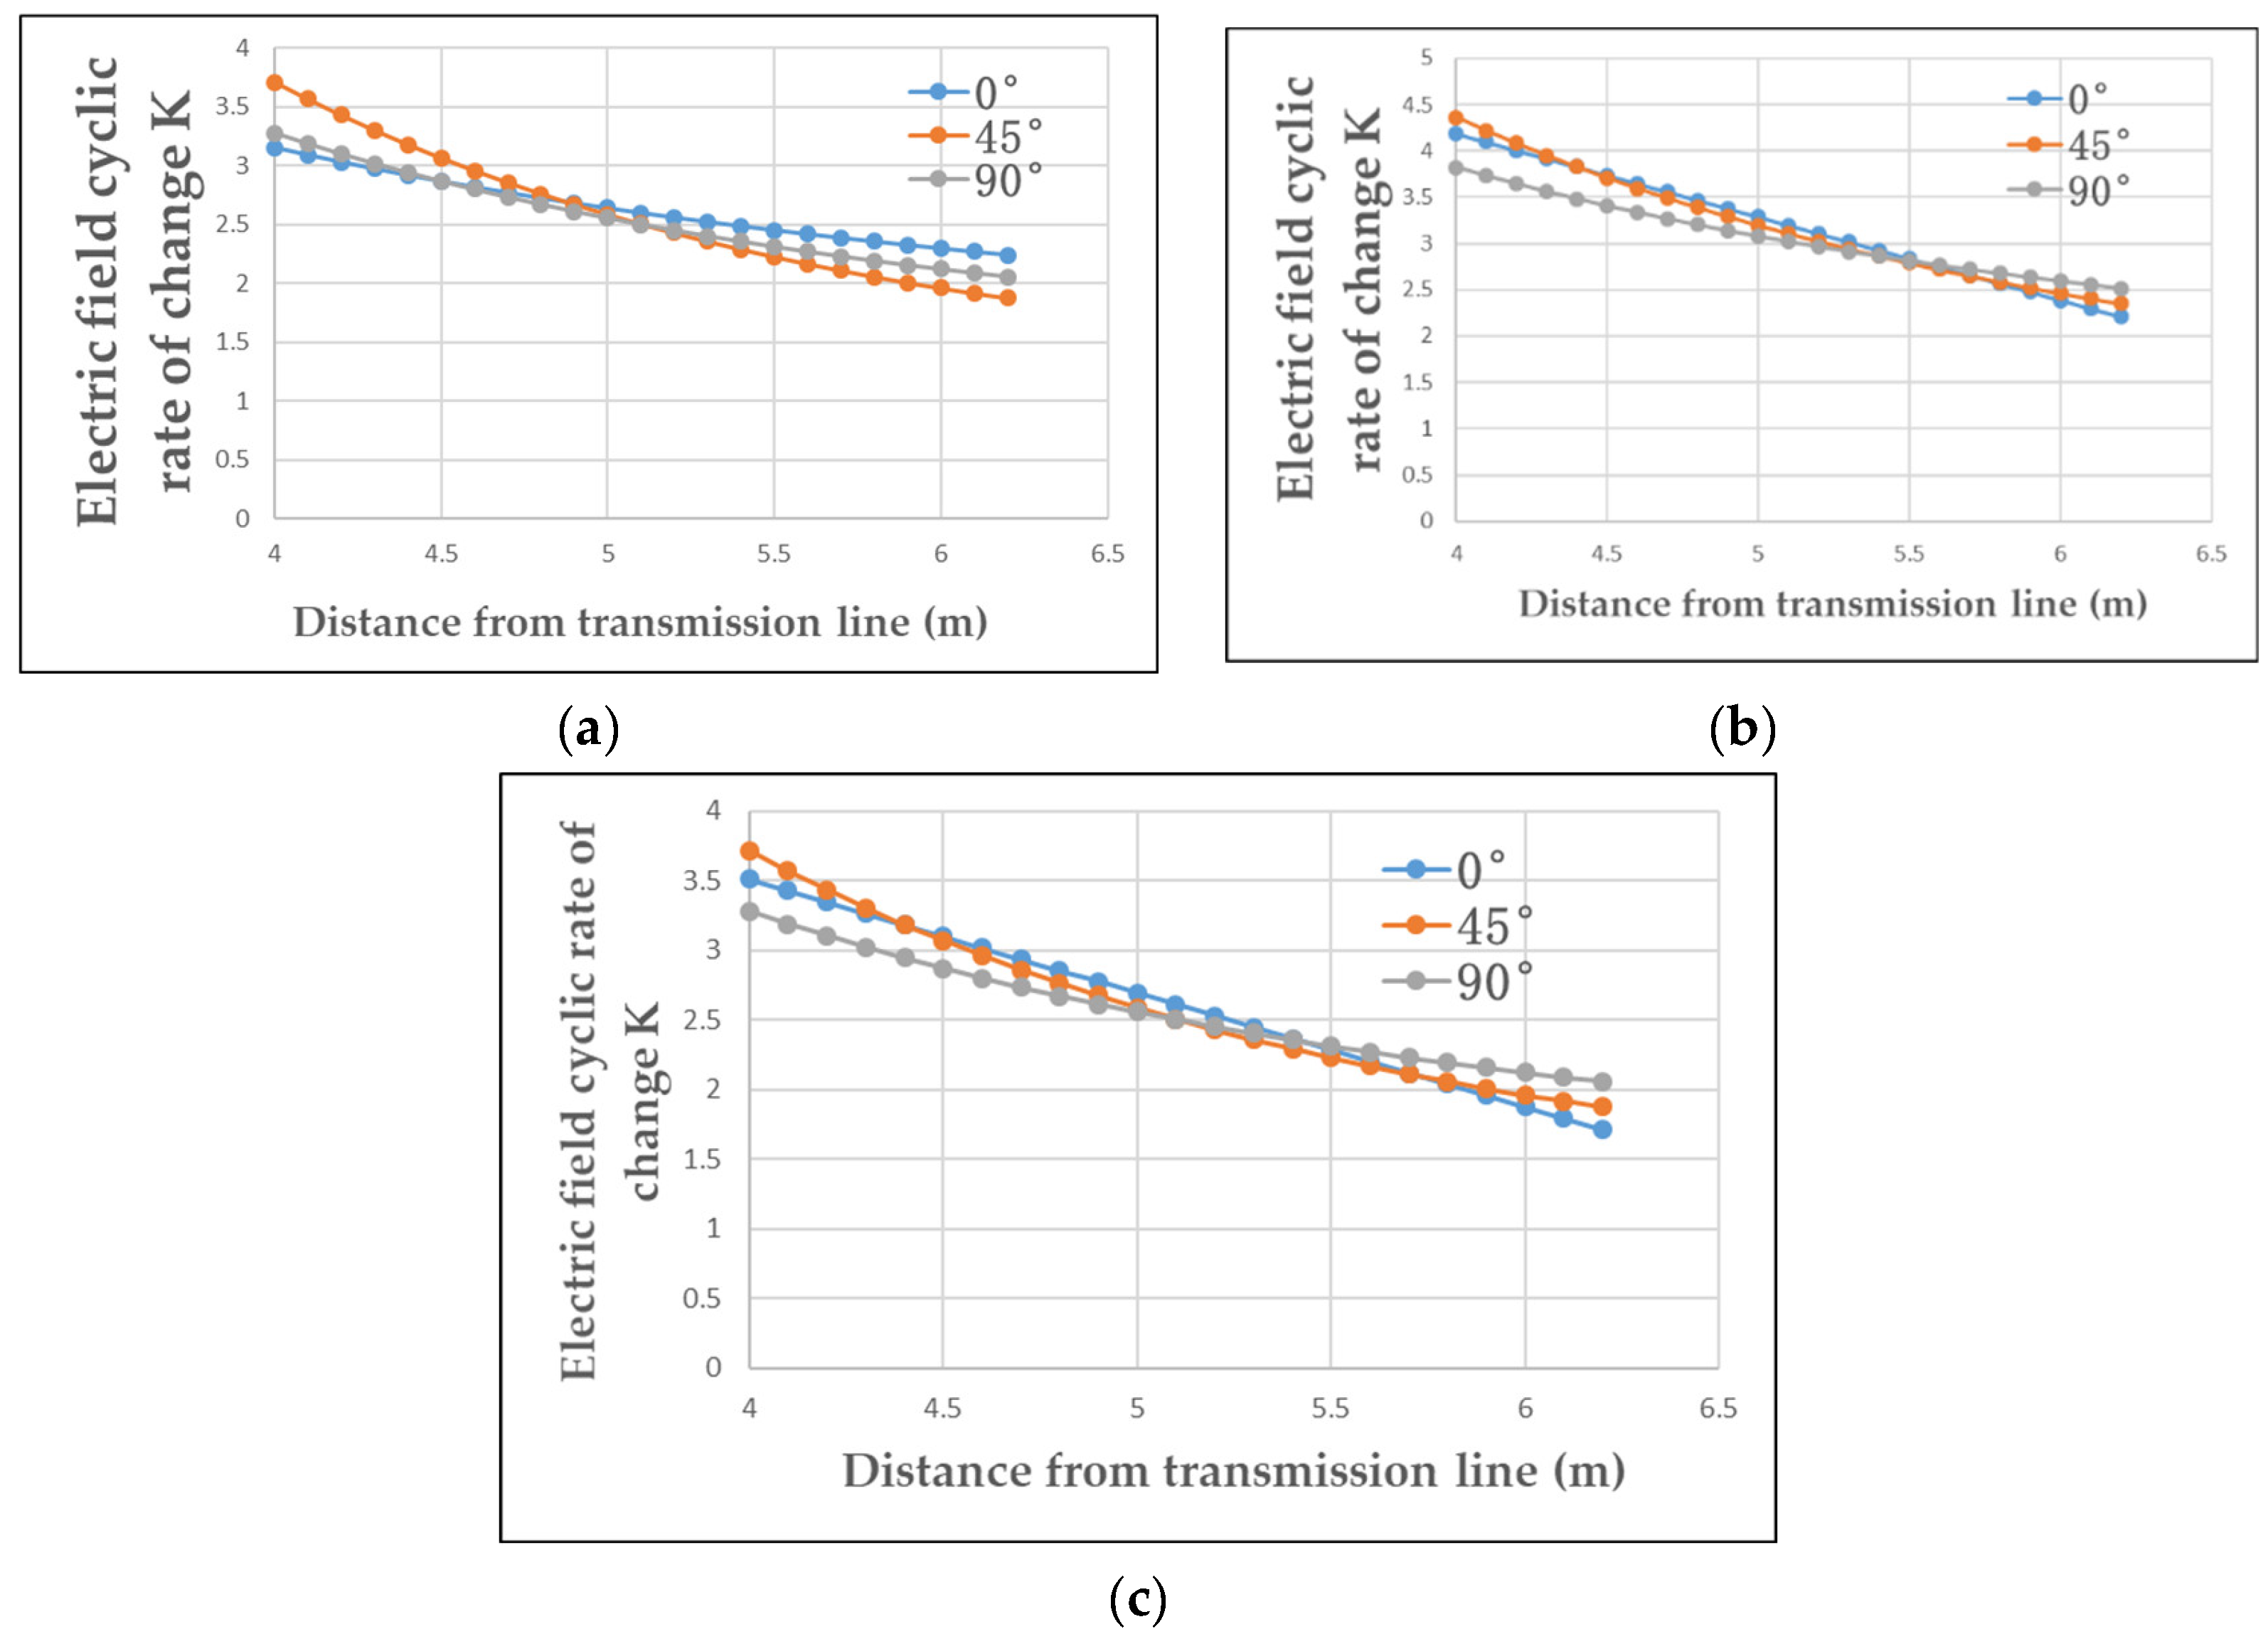
Further, in order to explore the change law of K value on the flight path of different angles, this paper divides the flight paths of 0°, 45°, and 90° and calculates the change law of K value at the three flight paths, and the curve results are shown in Figure 10.
It can be seen from the above curve that although the flight path of UAV near the transmission line is different, the change law of K value is almost the same.
To sum up, for three-phase transmission lines with different voltage levels under the same arrangement, the distance between the UAV and the transmission line can be reflected by the ring ratio change rate k of the electric field so as to realize the safe distance early warning of the UAV.

4. UAV and Transmission Line Safety Early Warning Strategy

According to the analysis in the previous section, for three-phase transmission lines with different voltage levels under the same arrangement, K value can be used to reflect the distance relationship between the UAV and transmission line. Based on this law, this paper designs the UAV safety distance strategy, as shown in Figure 11.
As shown in the flow chart, the early warning strategy proposed in this paper first judges whether the UAV is close to the transmission line according to the measured electric field intensity E. When the value of E is greater than the set electric field intensity threshold, it indicates that the current UAV is near the transmission line and further judges the distance between the UAV and the transmission line through the value of K. The early warning strategy based on the K value is a hierarchical early warning, which is divided into two levels. K1 and K2 are the safety thresholds of the two-level safety distance early warning, respectively. When 0 < k < k1, it indicates that the UAV is approaching the transmission line and there is no risk of collision. At this time, the UAV system sends a prompt that “the UAV is approaching the transmission line”. When k1 < k < k2, it means that the UAV has approached the threshold of safe distance from the transmission line, and the UAV system will send a prompt of “UAV abnormal warning”. When k > k2, it means that the UAV has crossed the threshold of safe distance from the transmission line and may hit the transmission line. At this time, the UAV system gives a warning tone of “danger”.

5. Signal Acquisition System Design

This paper realizes the safe distance warning of UAV based on the electric field information, so it needs to design the electric field signal acquisition system to realize the acquisition of electric field information around the transmission line by UAV. Based on the principle of parallel plate capacitor, this paper designs a one-dimensional electric field electric field sensor, and based on the one-dimensional electric field sensor, a three-dimensional electric field measurement system is designed to realize the UAV’s measurement of the electric field in space.

5.1. One-Dimensional Electric Field Sensor Design

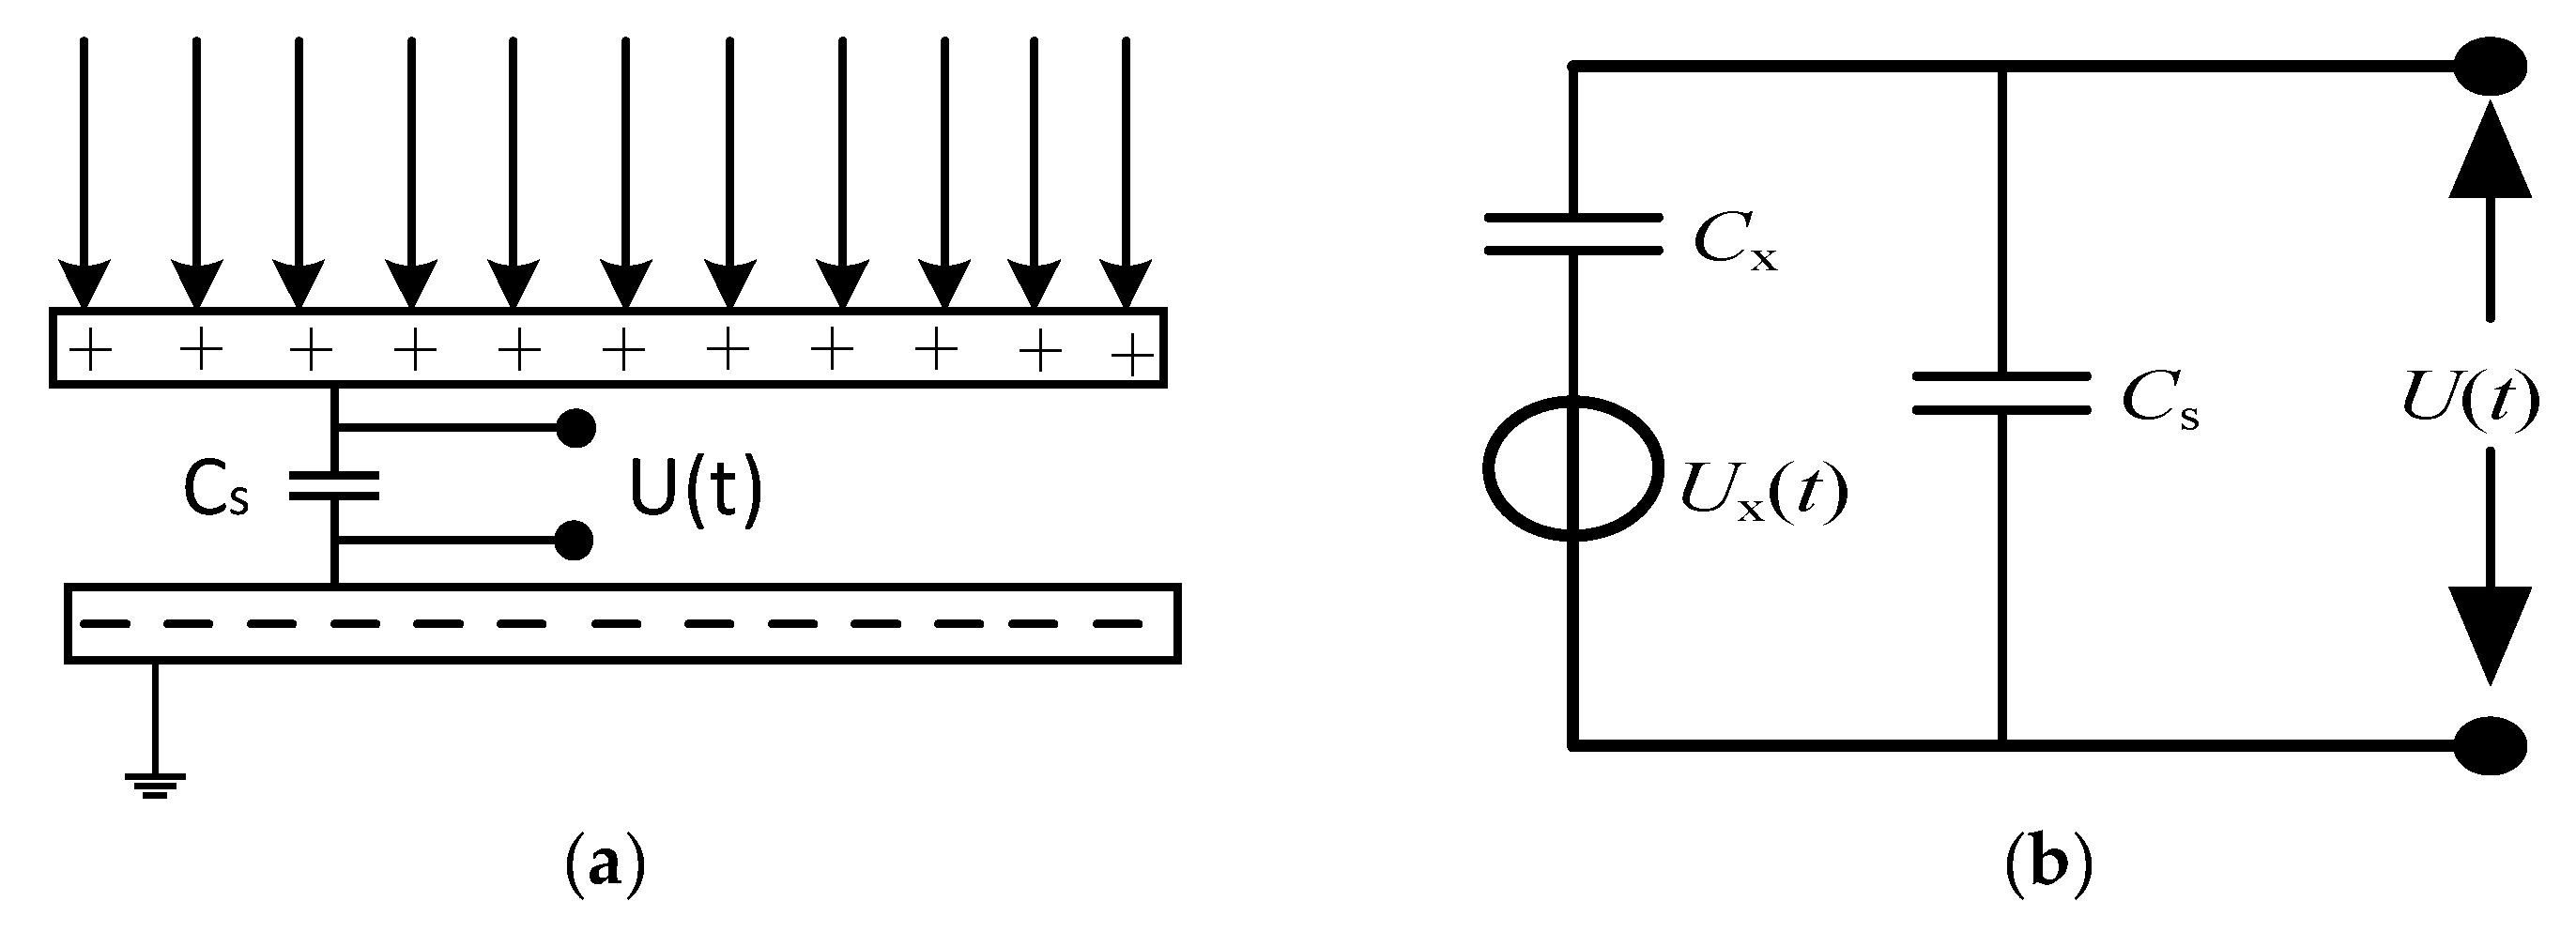
Figure 12a shows a schematic diagram of the structure of the electric field sensor, and Figure 12b shows the equivalent circuit diagram of the electric field sensor.
According to Gauss’s theorem, the metal upper and lower pole plates in the electric field E(t) generate induced charges. The surface density of the induced charges is σ(t), and ε is the dielectric constant of the medium in the middle of the pole plate [20]. When the measured electric field changes, the number of induced charges changes accordingly, which can be expressed by the following relation.
Q ( t ) = σ ( t ) d S = ε E ( t ) S
In Equation (7), Q(t) is the charge induced by the metal pole plate, E(t) represents the measured electric field strength, and S is the effective induction area of the induction pole plate.
In Figure 12, Cs is the sampling capacitance of the parallel pole plate, and the induced charge obtained by the sensor produces a voltage U(t) at the sampling capacitance Cs as the final output signal of the sensor. The expression of U(t) is shown below:
U ( t ) = k U x ( t ) C x C x + C s
In the above equation, Cx denotes the intrinsic capacitance of the electric field sensor, k denotes the correction factor, and the value of the correction factor is related to the structure of the electric field sensor, where Ux can be calculated by the following relation.
U x ( t ) = k Q ( t ) C x
Substituting Equation (9) into Equation (8), we get:
U ( t ) = k U x ( t ) C x C x + C s = k Q ( t ) C x + C s
The capacitance calculation of a capacitor can be expressed as:
C x = ε S d
Substituting Equations (7) and (11) into Equation (10) yields the following relationship:
U ( t ) = k ε E ( t ) S ε S d + C s
In Equation (12), only E(t) and U(t) are unknown; therefore, only the voltage U(t) across the sampling capacitor needs to be measured to calculate the measured electric field strength. After completing the design of the signal conditioning circuit, the sensitivity coefficient of the sensor can be obtained by placing the sensor in a standard frequency electric field for calibration, and then the value of k can be disregarded.
According to the tip discharge theory, a conductor placed under a strong electric field that contains a tip, or an irregular sharp part, is bound to have distortions in its edge electric field, which can even lead to the generation of partial discharges [21], thus affecting the measurement of the electric field at the industrial frequency. Therefore, in this paper, the shape of the parallel plate probe is set to be circular.
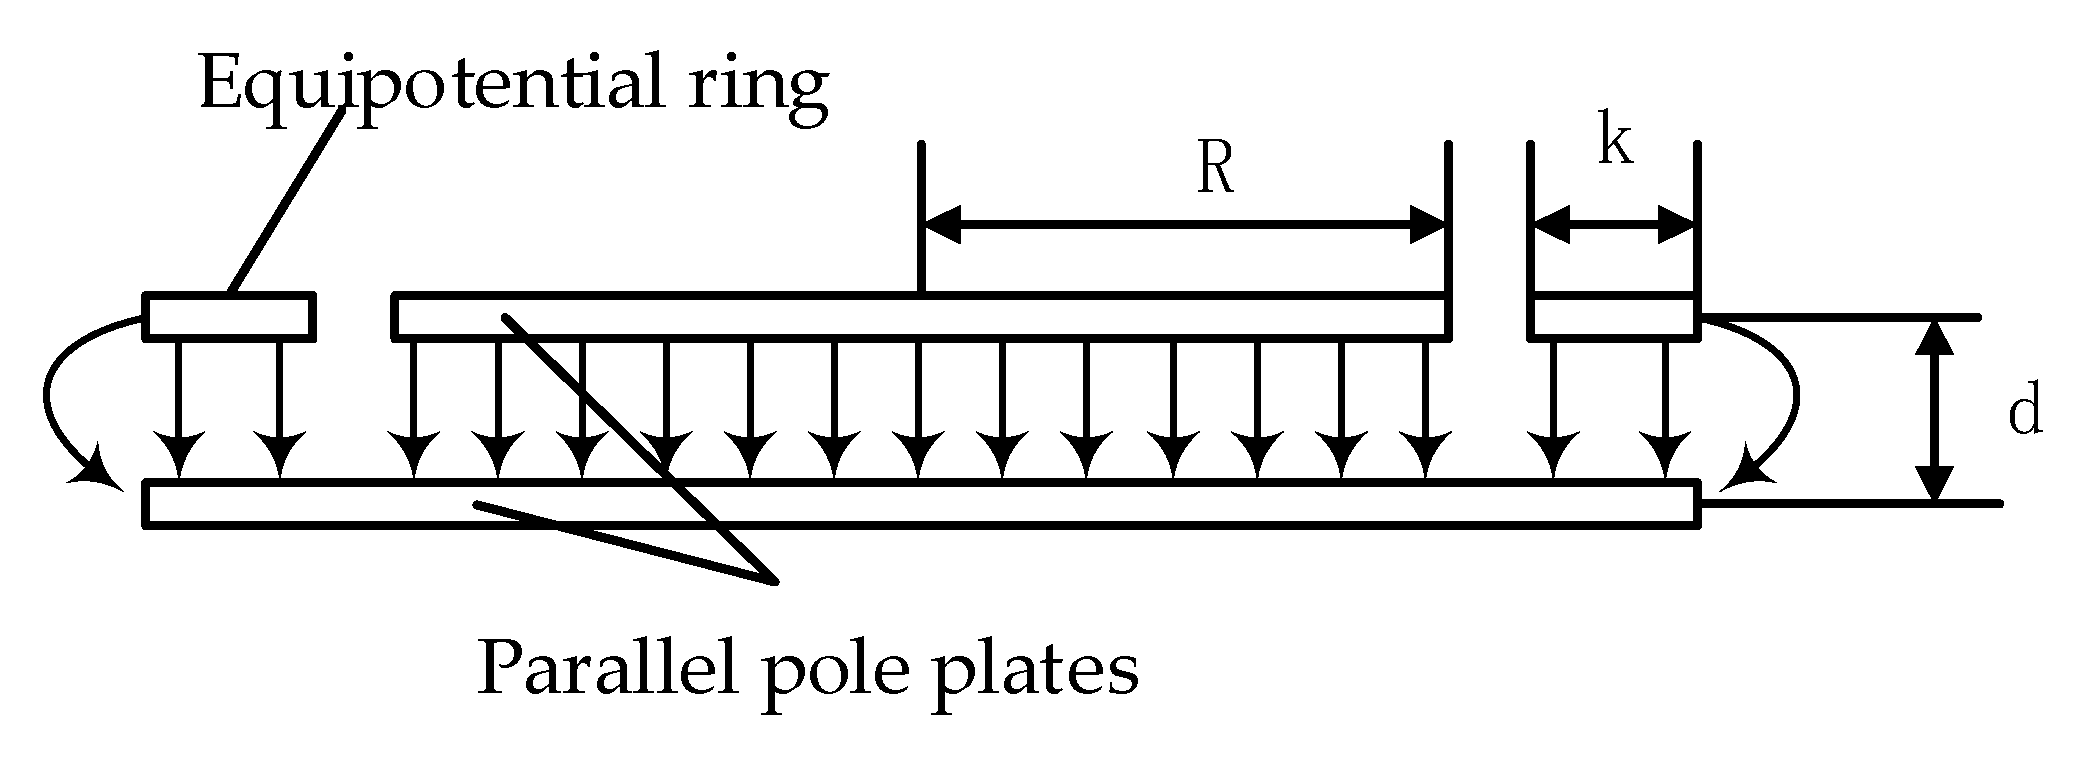
There is an edge capacitance between the parallel plate capacitors, and under the influence of the electric field, the energy converging in the edge capacitance is difficult to maintain stability, thus forming an edge effect. The edge capacitance is a part of the total capacitance, and if the edge capacitance cannot maintain stability, then it will cause inaccurate measurement results of the sensor, resulting in unstable output voltage and decreased sensitivity of the sensor [22]. Therefore, to reduce the effect of edge effect on the measurement results of the sensor, the structure of the equilibrium ring [23] is used to mitigate this interference.
The electric field sensor with the addition of the equilibrium ring structure is shown in Figure 13 and consists of the upper and lower pole plates and the equilibrium ring. The position of the equilibrium ring is in the same horizontal plane as the upper pole plate, but there is no electrical connection between the equilibrium ring and the upper pole plate. Therefore, the equilibrium ring, upper, and lower pole plates are insulated from each other. Based on such a structure, it causes the electric field lines at the edge of the upper pole plate to be vertical, and the electric field between the upper and lower pole plates becomes uniform. Because the presence of the equilibrium ring causes the irregular edge electric field to be generated at the periphery of the equilibrium ring, it will not affect the electric field between the two pole plates of the sensor, which can greatly improve the accuracy of the sensor detection.
Parallel plate probes are made using printed circuit boards (PCBs) and use round copper discs as the upper and lower pole plates, with epoxy resin selected as the insulating material in the middle of the pole plates. Such a production method is very simple, relatively low cost, and can better improve the consistency and stability between individual sensors. Moreover, such a structure can make the size smaller, easy to integrate, and has good portability.
From reference [24], it is known that when the distance between the two pole plates is constant, the change of the pole plate area does not cause great electric field distortion to the measured electric field. When the area of the pole plates is kept certain, the larger the spacing d between the induced pole plates, then the greater the electric field distortion of the sensor. The radius of the pole plate of the electric field sensor and the width of the equilibrium ring outside the pole plate can be designed according to the following empirical Equation (13).
k = 8.35 r 0.3584
Reference [23] shows that when the spacing d of the sensing pole plate is certain, the highest sensor sensitivity is achieved at a radius of 16 mm for a parallel pole plate with a radius between 8 and 20 mm. Therefore, in this paper, r = 16 mm is selected as the radius of the parallel pole plate and the width of the equilibrium ring is calculated by Equation (13) as k = 3.09 mm. Because the parallel pole plate uses the PCB process, the factory production process level determines the pole plate spacing d = 1.6 mm for the sensor. When the sampling capacitance Cs is 3.3nF, the loss factor of the sensor is smaller; therefore, this paper takes Cs as 3.3nF.
After designing the probe for the electric field sensor, since the signal induced by the parallel pole plate is weak, it is necessary to design a conditioning circuit to amplify and filter the signal, as shown in Figure 14 below.

5.2. Three-Dimensional Electric Field Measurement System Design

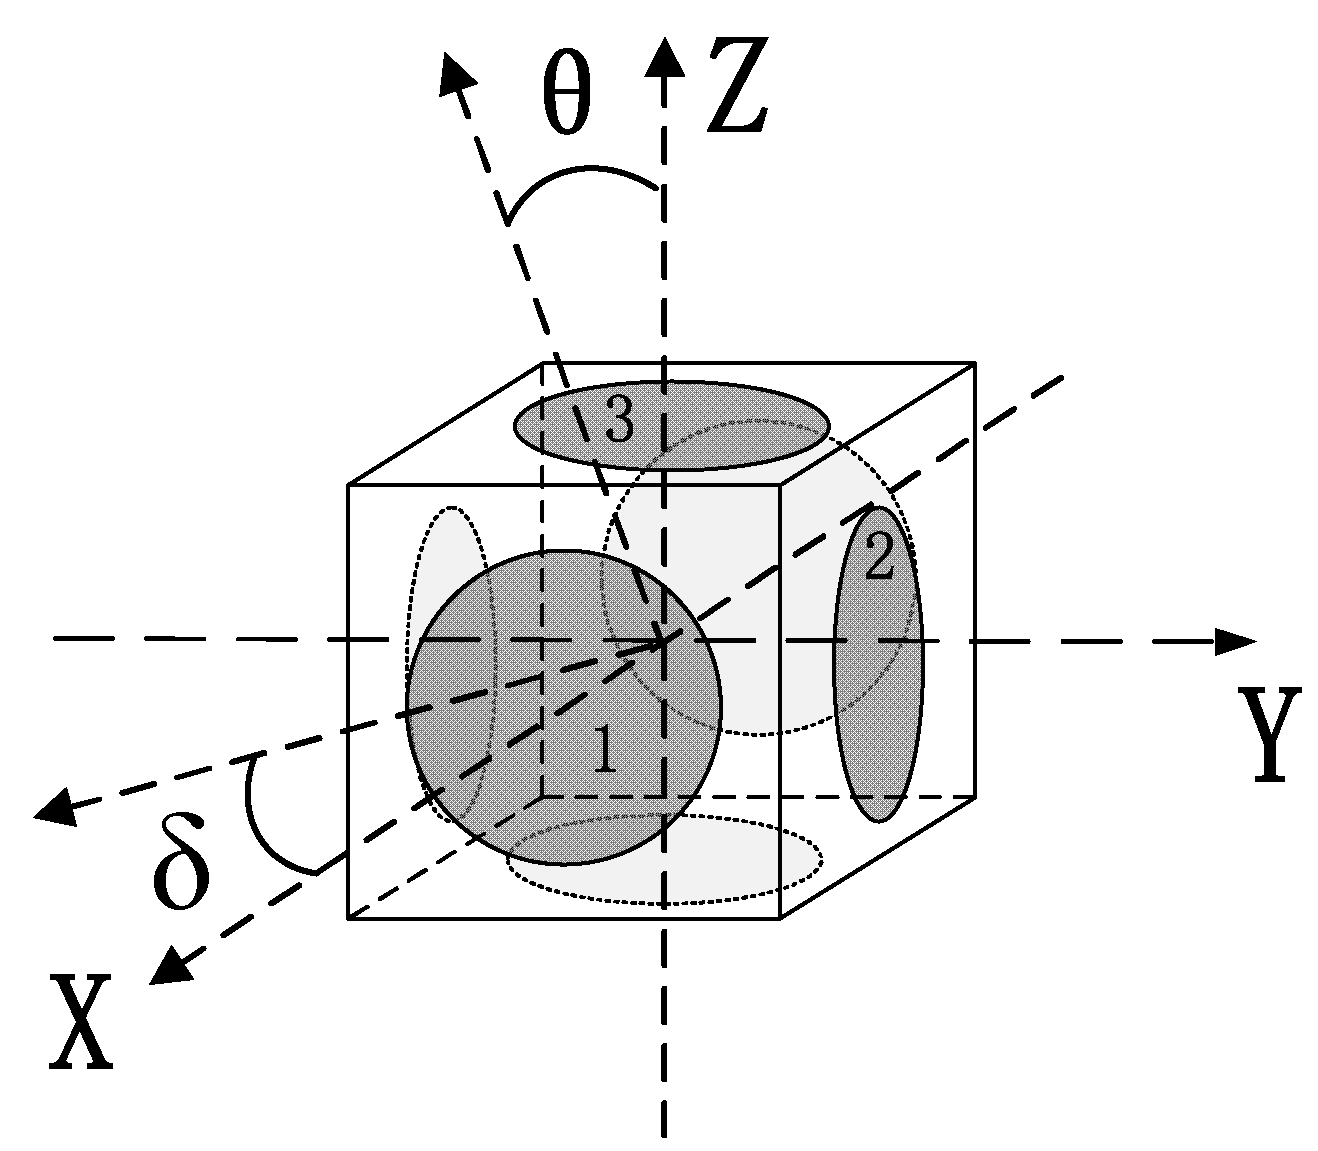
In this paper, the following scheme is designed: the same three parallel plate electric field sensors are placed on three orthogonal faces in the square hexahedron, based on such a structure, to achieve the measurement of the electric field in space. The structure of the three-dimensional electric field measurement system is shown in Figure 15 below, and the serial numbers in the figure indicate the positions of the parallel plate electric field sensors.
Assuming that the three-dimensional electric field sensor is located in a spatial electric field, we decomposed the electric field in spherical coordinates and set the angle of rotation up and down as θ and the angle of rotation left and right as δ. Therefore, the relationship between the synthetic electric field E and the electric fields E1, E4, E5 of probe 1, probe 2, and probe 3.
E X = E 1 = E sin θ cos δ
E Y = E 2 = E cos θ cos δ
E Z = E 3 = E sin δ
According to Equations (14)–(16), we can obtain:
E = E x 2 + E Y 2 + E Z 2
From Equation (17), it can be known that the synthetic electric field E is not affected by the rotation angle θ and δ. The magnitude of the synthetic field can be calculated as long as the electric field intensity values in X, Y, and Z directions are obtained. Based on this, a three-dimensional electric field measurement system is produced in this paper, and its physical diagram is shown in Figure 16.
After designing the three-dimensional electric field measurement system further, we built the signal acquisition system, which is shown as follows (Figure 17).
As shown in the figure above, the whole device contained three 3D electric field measurement systems, a wireless communication module, and a microcontroller. The wireless communication module was used to send the collected sensor data to the PC for processing. The schematic diagram of the whole electric field measurement system is shown in Figure 18.
Three three-dimensional electric field measurement systems were used to carry on the UAV to realize the electric field measurement. The three sensors calculated the electric field ring rate of change, respectively, and then took the maximum of the three values as the basis of the UAV safety distance warning.

6. Experimental Platform Construction

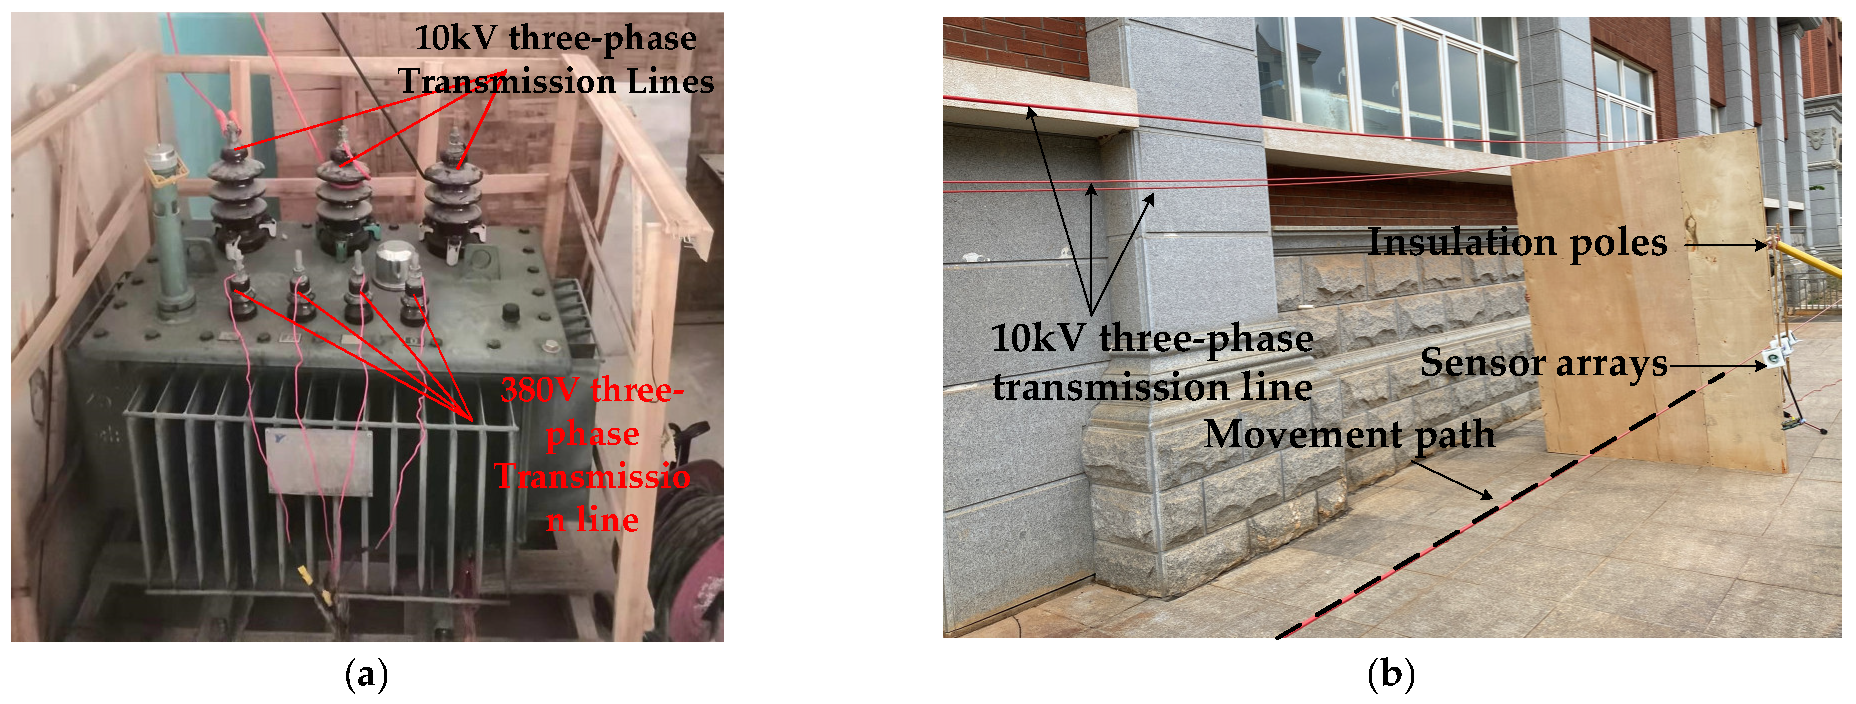
Considering the experimental safety and the limitations of the laboratory conditions, a 10 kV three-phase transmission line experimental platform was built, and the schematic diagram of the experimental platform is shown in Figure 19.
As shown in the experimental schematic, the single-phase to three-phase power supply was used to convert the single-phase utility power to 380 V three-phase AC power, and the transformer was used to generate 10 kV three-phase AC power. The red dashed line shows the moving path of the sensor array, the sensors moved in the direction close to the transmission line, and the sensor array was at 45° from the lower right corner of the transmission line, approaching from a place 2.5 m away from the transmission line in 0.1 m steps. The sensor array was located at 45° to the lower right of the transmission line and approached the transmission line in 0.1 m steps from a distance of 2.5 m to a distance of 0.7 m. Figure 20 shows the physical diagram of the experimental platform.
The data obtained from the Sensor0 sensor throughout the experiment and the calculated rate of change of the electric field ring ratio were recorded, as shown in Table 5 below.
Plotting the above data within the same axis, the resulting curve is shown in Figure 21 below.
The blue curve in the figure shows that the electric field strength measured by the electric field measurement system was negatively correlated with the distance of the system from the transmission line, which is consistent with the theoretical analysis.
The orange curve in the figure indicates the change curve of the electric field annular rate of change, and it can be seen that there were fluctuations in the curve, which is different from the results obtained from the simulation in Chapter 3. By adding the trend line of the orange curve, which is the orange dashed line in the figure, it can be seen that the Y value corresponding to the orange dashed line was negatively correlated with the X value, which indicates that the K value of the measured data can reflect the relationship between the distance of the measured point and the transmission line. From this, it can be concluded that the UAV safety warning method based on the electric field ring rate of change is feasible.
The electric field annular rate of change curve of the measured data was not smooth compared with the curve obtained from simulation, and there was a certain error. The analysis of the reasons for the error includes the following: (1) the location was not precise enough when building the experimental platform; (2) the environment around the experimental site had an impact on the electric field; (3) the accuracy of the electric field measurement system was limited; (4) there was a certain error in the voltage generated by the 10 kV transformer.

7. Conclusions

(1) A three-phase transmission line electric field distribution model was established, and the safety distance corresponding to the electric field strength that UAVs can withstand at three different voltage levels of 10 kV, 110 kV, and 220 kV was analyzed by COMSOL.
(2) A safety distance warning method for UAV based on the electric field ring rate of change was proposed, and the distribution law of electric field strength and electric field ring rate of change curves under two different voltage levels of 110 kV and 220 kV were analyzed by simulation, further illustrating that it is reasonable to use the value of electric field ring rate of change to reflect the distance between UAV and transmission lines.
(3) A one-dimensional electric field sensor was designed based on the principle of parallel plate capacitor, and then a three-dimensional electric field measurement system was designed based on the one-dimensional electric field sensor for the measurement of electric field around the transmission line by the UAV.
(4) A 10 kV three-phase transmission line experimental platform was built, and the feasibility of the transmission line tracking method proposed in this paper and the safety warning algorithm based on the electric field ring rate of change was verified through experiments.

Author Contributions

Conceptualization, N.Z., J.L., W.Z. and J.Z. (Jiawen Zhao); data curation, N.Z.; formal analysis, J.L.; investigation, W.Z., J.Z. (Jiawen Zhao) and J.Z. (Jingjing Zhao); writing—original draft, J.Z. (Jiawen Zhao); writing—review and editing, J.Z. (Jiawen Zhao). All authors have read and agreed to the published version of the manuscript.

Funding

This research was supported by the “Internet of Things Intelligent Sensing Terminal Platform System and Application Verification Project” (2018YFB2100100), “Research and development of new smart sensor technology to promote the development of green energy” (202104BN050011), and “Research and development of key technologies for conformal implantation of new intelligent power sensing for power grid main equipment” (YNKJXM20210075) funding.

Conflicts of Interest

The authors declare no conflict of interest.

References

  1. Li, X.; Li, Z.; Wang, H.; Li, W. Unmanned aerial vehicle for transmission line inspection: Status, standardization, and perspectives. Front. Energy Res. 2021, 9, 336–349. [Google Scholar] [CrossRef]
  2. Jian, Z.; Shiyong, W.; Xi, C.; Huadong, X.; Dengke, Y.; Zhong, Y. The obstacle avoidance method of UAV patrol based on columnar space and support vector machine. China Electr. Power 2015, 48, 56–60. [Google Scholar]
  3. Sai, W.; Zhengyi, L.; Xing, G.; Jianguo, W. Early warning system for overhead lines based on computer vision. J. East China Univ. Technol. (Nat. Sci. Ed.) 2013, 39, 482–487. [Google Scholar]
  4. Song, C.P.; Qian, W.; Ke, W.; Jinju, Q.; Bisheng, Y. Safety distance diagnosis method of LiDAR point cloud for power inspection of large UAVs. Power Grid Technol. 2017, 41, 2746–2753. [Google Scholar]
  5. Xiangyang, P.; Chi, C.; Xiaogang, X.; Wenxue, X.; Ke, W.; Bisheng, Y.; Xiaoming, M. Safety distance diagnosis technology of transmission channel based on UAV laser scanning. Power Grid Technol. 2014, 11, 3254–3259. [Google Scholar]
  6. Peng, X.; Chi, C.; Zhangquan, R.; Yang, B.; Mai, X.; Ke, W. Power line safety inspection and intelligent diagnosis based on UAV multi-sensor data acquisition. High Volt. Technol. 2015, 41, 8. [Google Scholar]
  7. Du, Y.; Peng, Y.; Liu, T.; Liu, T.; Liu, K.; Xu, T.; Tu, M. Experimental Study on Safety Gap Distance of Helicopter Live Work with UHV AC Transmission Line Platform Method. High Volt. Technol. 2015, 41, 1292–1298. [Google Scholar]
  8. Zheng, Z.; Dong, S.; Deng, X.; Jin, X. Safety distance of UHV double-circuit AC transmission lines on the same tower adjacent to buildings. High Volt. Technol. 2013, 39, 2943–2950. [Google Scholar]
  9. Xiao, D.; Ma, Q.; Xie, Y.; Zheng, Q.; Zhang, Z. A Power-Frequency Electric Field Sensor for Portable Measurement. Sensor 2018, 18, 1053. [Google Scholar] [CrossRef] [PubMed] [Green Version]
  10. Linghao, Z.; Sheng, W.; Chao, T.; Jie, Z.; Wei, G. High voltage transmission line electric field detection and distance estimation method design. Sens. Micro Syst. 2020, 39, 75–77,81. [Google Scholar]
  11. Shaoxiang, C.; Jie, L.; Tengfei, K. Unmanned aerial vehicle power line patrol system based on electric field ranging. Single Chip Microcomput. Embed. Syst. Appl. 2018, 18, 83–87. [Google Scholar]
  12. Zhang, W.; Ning, Y.; Suo, C. A Method Based on Multi-Sensor Data Fusion for UAV Safety Distance Diagnosis. Electronics 2019, 8, 1467. [Google Scholar] [CrossRef] [Green Version]
  13. Youhuan, N. Development of UAV Positioning and Early Warning System Based on Field Strength. Master’s Thesis, Kunming University of Technology, Kunming, China, 2020. [Google Scholar]
  14. Jianjun, L.; He, W.; Guoyu, C.; Qian, Z.; Zheng, W.; Guohua, L.; Chengbo, H. A multi-electrode electric field gradient calculation optimization method based on vector electric field. Power Syst. Prot. Control. 2018, 46, 7. [Google Scholar]
  15. Songyang, Z.; Degui, Y.; Qing, L. Wireless power frequency electric field measurement and warning instrument and application. Electr. Meas. Instrum. 2011, 48, 21–25. [Google Scholar]
  16. Wenbin, Z.; Chunping, Y.; Nianrong, Z.; Tang, L.; Gui, J.; Suo, C. Automatic identification method of voltage level of high voltage transmission line based on SVM. Ferroelectrics 2017, 521, 86–93. [Google Scholar]
  17. Jun, W.; Zhuang, L.; Xiangdong, W.; Yong, D.; Xiaopo, M. Electric field simulation analysis of UAV inspection safety distance in DC transmission lines. Hubei Electr. Power 2017, 41, 14–19. [Google Scholar]
  18. The National Development and Reform Commission of the People’s Republic of China issued. DL/T 5220-2005 Technical Specifications for the Design of Overhead Distribution Lines under 10 kV; China Electric Power Press: Beijing, China, 2012. [Google Scholar]
  19. Ministry of Housing and Urban-Rural Development of the People’s Republic of China Organized Compilation. Design Code for 110 kV-750 kV Overhead Transmission Lines; China Plan Press: Beijing, China, 2014. [Google Scholar]
  20. Rong, A.; Zhengyun, F.; Lijun, T.; Liangjin, F.; Wenbin, Z. Design and Analysis of Power Frequency Electric Field Sensor Units for High Voltage and Near Electric Early Warning. Sens. Microsyst. 2019, 38, 89–91,95. [Google Scholar]
  21. Hua, L. Research on Discharge Characteristics of Metal Tip Corona. Master’s Thesis, Nanjing University of Information Engineering, Nanjing, China, 2021. [Google Scholar]
  22. Huiling, W.; Baosheng, L. Electric field simulation analysis of circular capacitive sensor based on edge effect. Sens. Microsyst. 2014, 4, 31–34. [Google Scholar]
  23. Suo, C.; Wei, R.; Zhang, W.; Li, Y. Research on the Three-Dimensional Power Frequency Electric Field Measurement System. J. Sens. 2021, 2021, 8859022. [Google Scholar] [CrossRef]
  24. Liangjin, F. The Design and Detection of Power Frequency Electric Field Sensors for Safety Warning of Power Transmission and Transformation Operations. Master’s Thesis, Kunming University of Technology, Kunming, China, 2019. [Google Scholar]
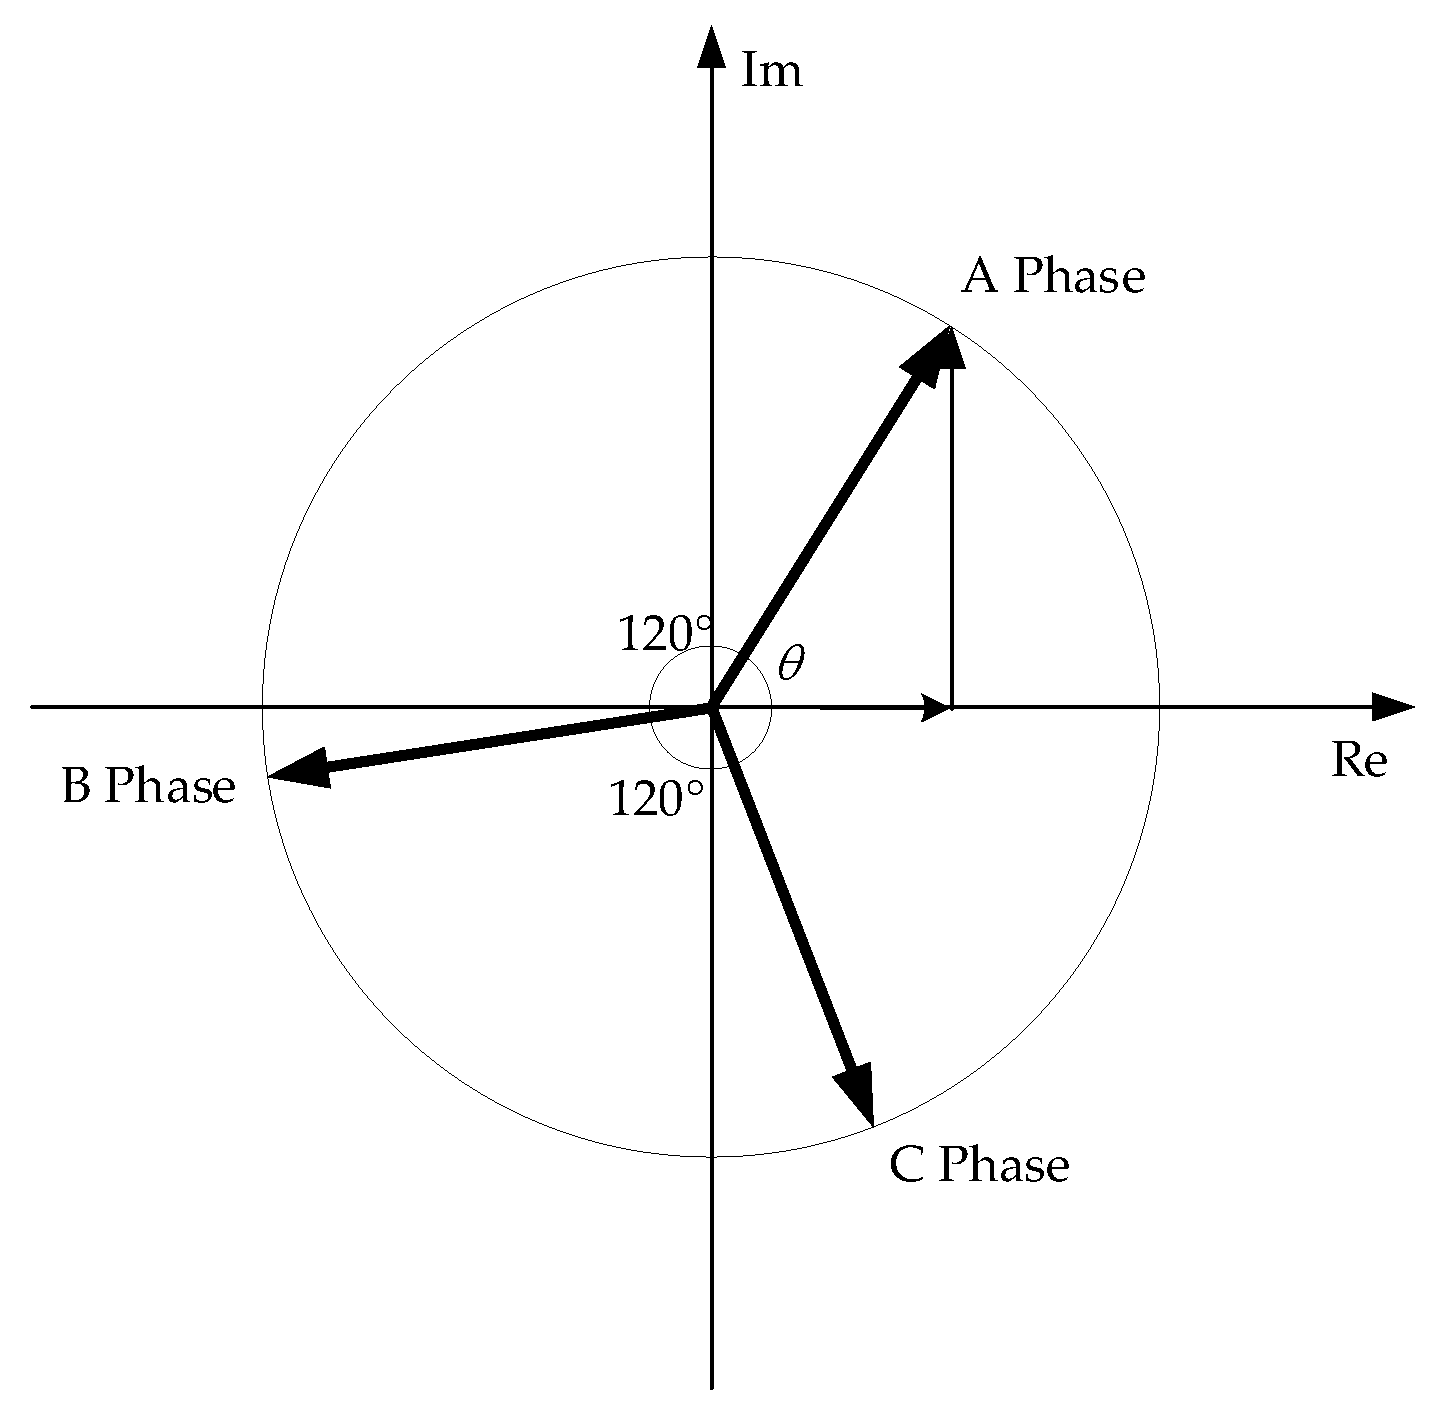
Figure 1. Calculation diagram of the real part and imaginary part of the transmission line voltage.
Electronics 11 03439 g001
Figure 2. Simulation flow chart.
Electronics 11 03439 g002
Figure 3. Electric field distribution around transmission lines with different arrangements of 10 KV voltage levels. (a) Field strength distribution under 10 kV inverted triangle arrangement; (b) field strength distribution under 10 kV horizontal arrangement; (c) field strength distribution of 10 kV regular triangle.
Electronics 11 03439 g003
Figure 4. Electric field distribution around transmission lines with different arrangement of 110 kV voltage levels. (a) Field strength distribution under 110 kV inverted triangle arrangement; (b) field strength distribution under 110 kV horizontal arrangement; (c) field strength distribution of the 110 kV regular triangle.
Electronics 11 03439 g004aElectronics 11 03439 g004b
Figure 5. Electric field distribution around transmission lines with different arrangement of 220 kV voltage levels. (a) Field strength distribution under 220 kV inverted triangle arrangement; (b) field strength distribution under 220 kV horizontal arrangement; (c) field strength distribution of 220 kV regular triangle.
Electronics 11 03439 g005
Figure 6. Schematic diagram of K value calculation path.
Electronics 11 03439 g006
Figure 7. Electric field intensity and K value curve of 110 kV and 220 kV horizontal arrangement. (a) 110 kV and 220 kV electric field strength curve; (b) curve diagram of ring specific change rate of 110 kV and 220 kV electric fields.
Electronics 11 03439 g007
Figure 8. 110 kV and 220 kV positive triangle arrangement and inverted triangle arrangement electric field strength and K value curve. (a) Electric field strength of 110 kV and 220 kV inverted triangle arrangement diagram; (b) K value curve of 110 kV and 220 kV inverted triangle array electric field ring specific change rate; (c) electric field strength of 110 kV and 220 kV positive triangle arrangement diagram; (d) K value curve of 110 kV and 220 kV positive triangle arrangement electric field ring specific change rate.
Electronics 11 03439 g008
Figure 9. K value curve of the 45 degree flight path in different arrangement modes of 110 kV.
Electronics 11 03439 g009
Figure 10. K value curve of 110 kV in different angles and different arrangement modes. (a) Horizontal arrangement K value curve; (b) triangle arrangement K value curve; (c) inverted triangle arrangement K value curve.
Electronics 11 03439 g010
Figure 11. Flow chart of security early warning strategy.
Electronics 11 03439 g011
Figure 12. Schematic diagram of the electric field sensor. (a) Electric field sensor structure schematic; (b) equivalent circuit diagram of the electric field sensor.
Electronics 11 03439 g012
Figure 13. Structural diagram of the electric field sensor with an equipotential ring.
Electronics 11 03439 g013
Figure 14. Schematic diagram of electric field sensor conditioning circuit.
Electronics 11 03439 g014
Figure 15. Structure diagram of the three-dimensional electric field measurement system.
Electronics 11 03439 g015
Figure 16. Three-dimensional electric field measurement system.
Electronics 11 03439 g016
Figure 17. Physical view of the sensor array.
Electronics 11 03439 g017
Figure 18. Schematic diagram of the electric field measurement system.
Electronics 11 03439 g018
Figure 19. Schematic diagram of the experimental platform.
Electronics 11 03439 g019
Figure 20. Physical diagram of the experimental platform. (a) 10 kV transformer; (b) physical view of transmission lines and sensors.
Electronics 11 03439 g020
Figure 21. K curve of electric field strength and ring ratio change rate of the electric field.
Electronics 11 03439 g021
Table 1. Transmission line parameters of different voltage levels.
Voltage ClassPhase Spacing (m)Transmission Line Diameter (m)Height above the Ground (m)
10 kV1.20.00506.5
110 kV4.20.01087.5
220 kV6.60.05208.5
Table 2. Safety distance under different arrangement modes of 10 kV.
ArrangementHorizontal ArrangementRegular Triangle ArrangementInverted Triangle ArrangementMaximum
Safety distance (m)0.150.160.150.16
Table 3. Safety distance under different arrangement modes of 110 kV.
ArrangementHorizontal ArrangementRegular Triangle ArrangementInverted Triangle ArrangementMaximum
Safety distance (m)1.832.002.302.30
Table 4. Safety distance under different arrangement modes of 220 kV.
ArrangementHorizontal ArrangementRegular Triangle ArrangementInverted Triangle ArrangementMaximum
Safety distance (m)3.73.93.63.9
Table 5. Safety distance under different arrangement modes of 110 kV.
Distance from Transmission Line(m)Electric Field Strength (V/m)Electric Field Ring Rate of Change
0.7156117.93722
0.8128112.41218
0.9112214.082
1.096411.30705
1.185511.57895
1.275612.83069
1.36597.435508
1.46108.852459
1.55568.453237
1.65097.858546
1.74698.315565
1.84309.767442
1.93884.639175
2.03705.945946
2.13486.321839
2.23267.055215
2.33035.940594
2.42856.315789
2.52675.617978
Publisher’s Note: MDPI stays neutral with regard to jurisdictional claims in published maps and institutional affiliations.