Article

Fog Computing: Strategies for Optimal Performance and Cost Effectiveness

1
Department of Computer Science and Information Technology, School of Computing, Engineering and Mathematical Sciences, La Trobe University, Bundoora, VIC 3086, Australia
2
Department of Information Technology, College of Computers and Information Technology Taif University, Taif 21944, Saudi Arabia
3
La Trobe Business School, La Trobe University, Bundoora, VIC 3086, Australia
*
Author to whom correspondence should be addressed.
Electronics 2022, 11(21), 3597; https://doi.org/10.3390/electronics11213597
Submission received: 12 October 2022 / Revised: 27 October 2022 / Accepted: 30 October 2022 / Published: 3 November 2022
(This article belongs to the Section Computer Science & Engineering)

Abstract

:
The proliferation of IoT devices has amplified the challenges for cloud computing, causing bottleneck congestion which affects the delivery of the required quality of service. For some services that are delay sensitive, response time is extremely critical to avoid fatalities. Therefore, Cisco presented fog computing in 2012 to overcome such limitations. In fog computing, data processing happens geographically close to the data origin to reduce response time and decrease network and energy consumption. In this paper, a new fog computing model is presented, in which a management layer is placed between the fog nodes and the cloud data centre to manage and control resources and communication. This layer addresses the heterogeneity nature of fog computing and complex connectivity that are considered challenges for fog computing. Sensitivity analysis using simulation is conducted to determine the efficiency of the proposed model. Different cluster configurations are implemented and evaluated in order to reach the optimal clustering method. The results show that the management layer improves QoS, with less bandwidth consumption and execution time.

1. Introduction

Cloud computing, as a novel technology, facilitates life for people in several ways. However, this computing paradigm faces challenges in responding to a high number of requests placed simultaneously. Increasing the number of cloud data centres is not the optimal solution, since these centres are expensive to build and maintain and would not solve the issue of bottleneck network congestion caused by the high volume of needs associated with proliferating IoT devices. From this perspective, fog computing was introduced and defined as, “an extremely virtualized environment that delivers networking, storage, and compute resources between outdated CC information centres, usually, but not entirely situated at the network edge”, in [1]. The reference architecture was released in 2017 in OpenFog Consortium [2], consisting of three layers: Cloud layer, fog nodes layer, and end user layer.
The main idea was to bring data processing geographically closer to the data source to reduce bandwidth consumption and response time. It is important to highlight that fog computing extends cloud computing and does not replace it. The need for this computing paradigm comes from the massive increase in IoT devices in different sectors regardless of data forms, as discussed in [3]. Some sectors are immensely non-delay tolerant, like health care, driverless automobiles, and intelligent traffic control. Other sectors can tolerate delays to a certain extent, yet there is always a cost; examples of these sectors are e-commerce and telecommunication companies. Delays in such systems do not result in fatalities, as can happen in non-delay tolerant sectors, although degraded quality of service and financial loss can be the results of delays in such sectors. Hence, regardless of the level of delay tolerance, delay outcomes are not desired.
In this paper, we present a fog computing model with management features to address the heterogeneity, redundancy, and complex connectivity issues. The novelty of the proposed model is the addition of a management layer and clustering strategies in the generally existing fog architecture. The rest of this paper is organized as follows. Section 2 reviews some of the work done to address the challenges in question. Section 3 describes the proposed model, focusing on the management layer and clustering styles. Section 4 discusses the simulation results. Lastly, Section 5 presents an efficiency analysis of the proposed model.

2. Literature Review

Given the fact that fog computing is a new computing paradigm, there are several challenges that need to be addressed before it is ready for commercial use. The heterogeneity nature of fog computing must be taken into consideration during the design phase because fog nodes can have diverse computing capabilities and fog applications have different connectivity styles and constraints, whether computational or power related. In addition, because fog computing is a distributed paradigm, it faces the challenge of redundancy. The same code can be repeated on different nodes at the edge of the network [3,4]. Therefore, ensuring that resources are utilized and not exploited is indispensable. Another issue to be addressed in fog computing is networking within the environment to reach the potential of fog computing. Connectivity complexity increases with increase in the number of devices in the fog environment. Designing and outlining the intra-connections in a fog environment is a critical issue to consider.
Since fog computing is a relatively new computing paradigm, scholars have been focusing on several aspects of the new computing paradigm, i.e., mobility awareness, context awareness, resource management, architecture, and fault tolerance techniques. In this section, we focus on three aspects that are related to what this paper is addressing, which are fog architecture, resource management, and redundancy as a fault tolerance technique.

2.1. Fog Computing Architecture

The general fog architecture was founded by the open fog consortium in 2017 [5]. The proposed architecture consists of three layers: cloud layer, fog layer, and end user layer. Some researchers added more layers to make six layers, as in [6]. Several studies have focused on fog computing architecture, and fall into two types: hierarchical and flat structures. In an hierarchical structure, computing nodes, which are called fog nodes, reside in a layer between the cloud and end users [7]. On the other hand, a flat structure lacks layering and the computing nodes have the ability to communicate with each other [8]. Karagiannis and Schulte, in [9], compared the performance of hierarchical and flat fog computing architectures. They found that fog applications that do not depend on the cloud consume less bandwidth compared to the flat structure. However, the experiments showed that connection latency decreased in flat structure. Moreover, working in a community-based fog environment, the authors in [10] proposed a multi-layer tree structure fog model, in which each group of fog nodes is called a community and connects to a higher community via an access point. The main contribution of this study was their reputation mechanism. This mechanism calculates an honesty factor for each fog node and uses this factor to allocate tasks. They studied the effect of deception rate on resource allocation and discovered that if this rate reached 40%, the resource allocation process became more challenging. Moreover, the authors in [11] studied CO2 emissions in fog computing and how nodes placement affected these emissions. They concluded that there is a trade-off between CO2 emission and nodes connectivity which means that the less distance a packet needs to travel the less CO2 emission is produced. Therefore, taking into consideration how fog components are connected can make computing greener.

2.2. Resource Management

Given the heterogeneous and distributed nature of fog computing, resource management studies have become essential. Resource management in fog computing includes computation, communication, storage, and energy. Researchers have tackled the resource management issue in fog computing mainly by using three concepts: load balancing, as in [12], placement policies, as in [13,14], and a scheduling algorithm, as in [15]. First, in [12], Kadhim and Naser propose a load balancing mechanism that involves utilizing parked vehicles to reduce offloading to clouds with the aim of achieving lower execution time and bandwidth consumption. Second, focusing on placement policies, the authors in [13] present a placement policy for fog computing with the focus of increasing availability and quality of service. The main idea of their policy is to place a fog application to a fog community and, then, the services of the application to fog nodes within the community. The policy showed higher quality of service and service availability compared to a linear programming approach. Additionally, Godinho et al., in [14], presented a reconfigurable resource management framework for fog computing aiming to maximize the fairness of energy and bandwidth consumption. They investigated fog computing performance in mixed integer linear programming and heuristic placements. Third, in [15], aiming to maximize resource utilization, Benchakh and Louail proposed a task scheduling algorithm called RTFIFO (Resource Then First Time In First Out), which is a First In First Out algorithm with an extra step to check if the resources a new job requires can be provided, or not, by the fog node upon arrival time. RTFIFO rejected 17% more tasks than FIFO which enhanced the overall performance, because if a fog node does not have enough resources, the job is sent to another fog node instead of waiting in a queue of fog nodes, which does not meet job requirements.

2.3. Redundancy

Redundancy is a fault tolerance technique that includes extra software and/or hardware components. These components are added to enhance the reliability of any system. Improving the reliability leads to better quality of service. Based on the success achieved by fault tolerance techniques in cloud computing, researchers have explored possibilities of incorporating some of these techniques into fog computing. Considering that the fog nodes layer is the middle layer between the cloud layer and that of end users, the authors in [16] investigated the middleware role in improving smart cities IoT applications when applied through fog computing. They proposed a service-oriented fog architecture that has the ability to tolerate hardware failure, along with middleware, yet evaluation for this study was not presented. In addition, Xu et al., in [17], proposed a service redundancy strategy for fog computing. The strategy involves assigning one job to different fog nodes to increase reliability, and, in order to find the best path that reduces latency and power consumption, the authors used the ant colony algorithm. The strategy of combining both assigning the same job to multiple fog nodes and the ant colony algorithm showed lower latency and energy consumption than not using the ant colony algorithm. Supplementary to this, the authors in [18] presented a fault tolerant task scheduler for fog computing. In the proposed model, end user requests are first received by a fog broker then assigned to a fog node. Even though the proposed model had better performance compared to three different methods, having all requests handled first by a broker can lead to traffic bottleneck with an increase in requests.
After reviewing related published work on enhancing the performance of fog computing, we came up with the proposed model idea. The idea mainly focuses on addressing the heterogeneity issue through resource management principles, and reducing costs, which include bandwidth and energy consumption, by deeply studying how changing the architecture can impact carbon footprint, and, lastly, enhancing the robustness of fog computing using operational redundancy, as illustrated in the next section.

3. Validation of the Proposed Model

Fog computing is a computing paradigm that is composed of different computing units, including IoT devices, fog nodes, and cloud data centres, and these components substantially vary in more than one aspect. Hence, controlling and utilizing such resources is essential to reach the potential of fog computing. In this section, we propose a fog computing model that includes a management layer which plays a major role in managing the resources and communication between them. The proposed model can cover a large or small geographical area. It can be deployed to cover a central district in a big city, a campus, a residential complex, or a hospital.

3.1. System Overview

The proposed model is spread out into a multilayer tree structure and depicted in Figure 1. With the intention to alleviate complex connectivity, devices are grouped into clusters, and each cluster only has intra-connection, and each device in the cluster has one connection to its parent, which is specified during the design phase. The hierarchy of the proposed model consists of four layers as follows:
  • Cloud layer: this layer is the highest layer and is where the data centers reside. Computing resources for this layer are very powerful in terms of CPU, storage, and connectivity.
  • Management layer: this layer consists of fog nodes, called fog managers, responsible of governing communication between the lower layers and clouds. Devices in this layer have computing resources that are less powerful than clouds and similar to the next lower layer.
  • Fog nodes layer: devices in this layer can be router, switches, or access points. This layer is the first hub for end users’ requests, and it connects end user devices to upper layers if necessary, which is explained in the next section. In this layer, each fog node has a parent in the management layer.
  • End user layer: this layer is the lowest layer in the hierarchy and is the data origin layer. Devices is this layer can be sensors, actuators, mobiles, and IoT devices. Computing capabilities can be very limited in these devices, and they can be in motion. The end users layer has n devices, U = {u1, u2,..., un}. Each user ui U requests a task T.

3.2. Management Layer

The management layer in the proposed model resides between the cloud layer and the fog nodes layer, as illustrated in Figure 1. It consists of fog nodes with management features called managers. A manager has three main modules and communication units, which are a tracking module, allocating module, processing module, receiving and sending units. The tracking module keeps track of fog nodes’ available resources to be used by the allocating module. The allocating module is responsible for assigning requests to fog nodes through an edge ward placement policy. Lastly, the processing module is designed to process requests if needed.
The components of the fog manager are depicted in Figure 2. Communication units are responsible for receiving jobs to be allocated and the status of the fog nodes, and for sending processing results and allocated jobs. The receiving unit filters the data received and sends job requests to the allocating module, as well as resource updates to the tracking module. The allocating module is the heart of the fog manager. It has connections to all modules. First, it has a two-way connection to the tracking module. The allocating module uses information from the tracking module to achieve its task. Second, it has a single connection to the processing module; if a job can be processed locally, the job information is sent to the processing module. Lastly, it has a connection to the sending channel in order to send allocated job information to an assigned fog node. On the other hand, the tracking module receives the updates of fog node resources and provides that information to the allocating module when needed. The processing module can connect only when forwarding the processed job to a device.
The allocation process illustrated in Figure 3 starts at a requesting fog node. When a fog node receives a request that requires more resources than what is available, it sends the requirements and request to the fog manager. The fog manager receives the request through the receiving unit and sends it to the allocating module. After that, the allocating module sends the requirement to the tracking module to nominate a parent fog node that meets the requirements. The used placement policy is an edge ward one, in which a child–parent attribute is used to determine the parent of the requesting fog node. Once the decision is made, the new fog ID is sent to the allocating module. The allocating module sends the request to the new fog node along with the requesting fog node ID. When the request is processed, the result is sent to back to the managing fog node to be sent to the original requesting fog node.

3.3. Implementation Details

To study the proposed model, a modified version of the Intelligent surveillance fog application, designed by Gupta [19], was tested. This application is designed to track objects. It consists of four modules: motion detector, object detector, object tracker, and user interface. Generally, each module is placed on a separate node.
  • The motion detector is deployed on smart cameras at the lowest layer of the hierarchy. These smart cameras sense motion in their surrounding environment and send video streams of the detected motion to the next module.
  • The object detector is placed on the second lowest layer of the hierarchy in fog nodes. This module detects an object from the received video stream and sends a picture of the detected object to the next module, which is the object tracker.
  • The object tracker module is placed in the management layer. It calculates the PTZ parameters that are required to track the detected object and sends these parameters to the actuators back in the smart cameras.
  • The user interface module is placed on the cloud. It is used only to display the detected object.
The data flow of the application is illustrated as a Directed Acyclic Graph (DAG) in Figure 4.
Six different configurations were deployed with and without a management layer to evaluate the role of the management layer in the proposed model. The configurations included three types: single clustering, multi clustering, and flat structure. Each type was examined with and without the management layer. Single clustering means that each group of end users is clustered and can connect to only one fog node. On the other hand, in multi-layer clustering, each cluster of end users can connect to any fog node. Lastly, the flat structure of fog computing means that any end user can connect to any fog nodes and clustering does not exist in this structure.
Configuration A in Figure 5 represents the proposed fog model. In this configuration, the management layer is included, and a single layer of clustering is deployed. Configuration B (Figure 6) has the same configuration as A without the management layer, representing the general architecture of fog computing. The third configuration in Figure 7 illustrates a fog computing environment with multi-layers of clustering, including a management layer. In this configuration, fog nodes and end users exist in the same layer and have restricted connectivity. Figure 8 depicts the same configuration as Figure 7 without the management layer. The last two configurations in Figure 9 and Figure 10 demonstrate the flat structure of fog computing with management and without, respectively. In fog flat structure, connectivity is unconstricted, which allows any end user to connect to any fog node. Table 1 summarizes the characteristics of each configuration.

4. Results and Analysis
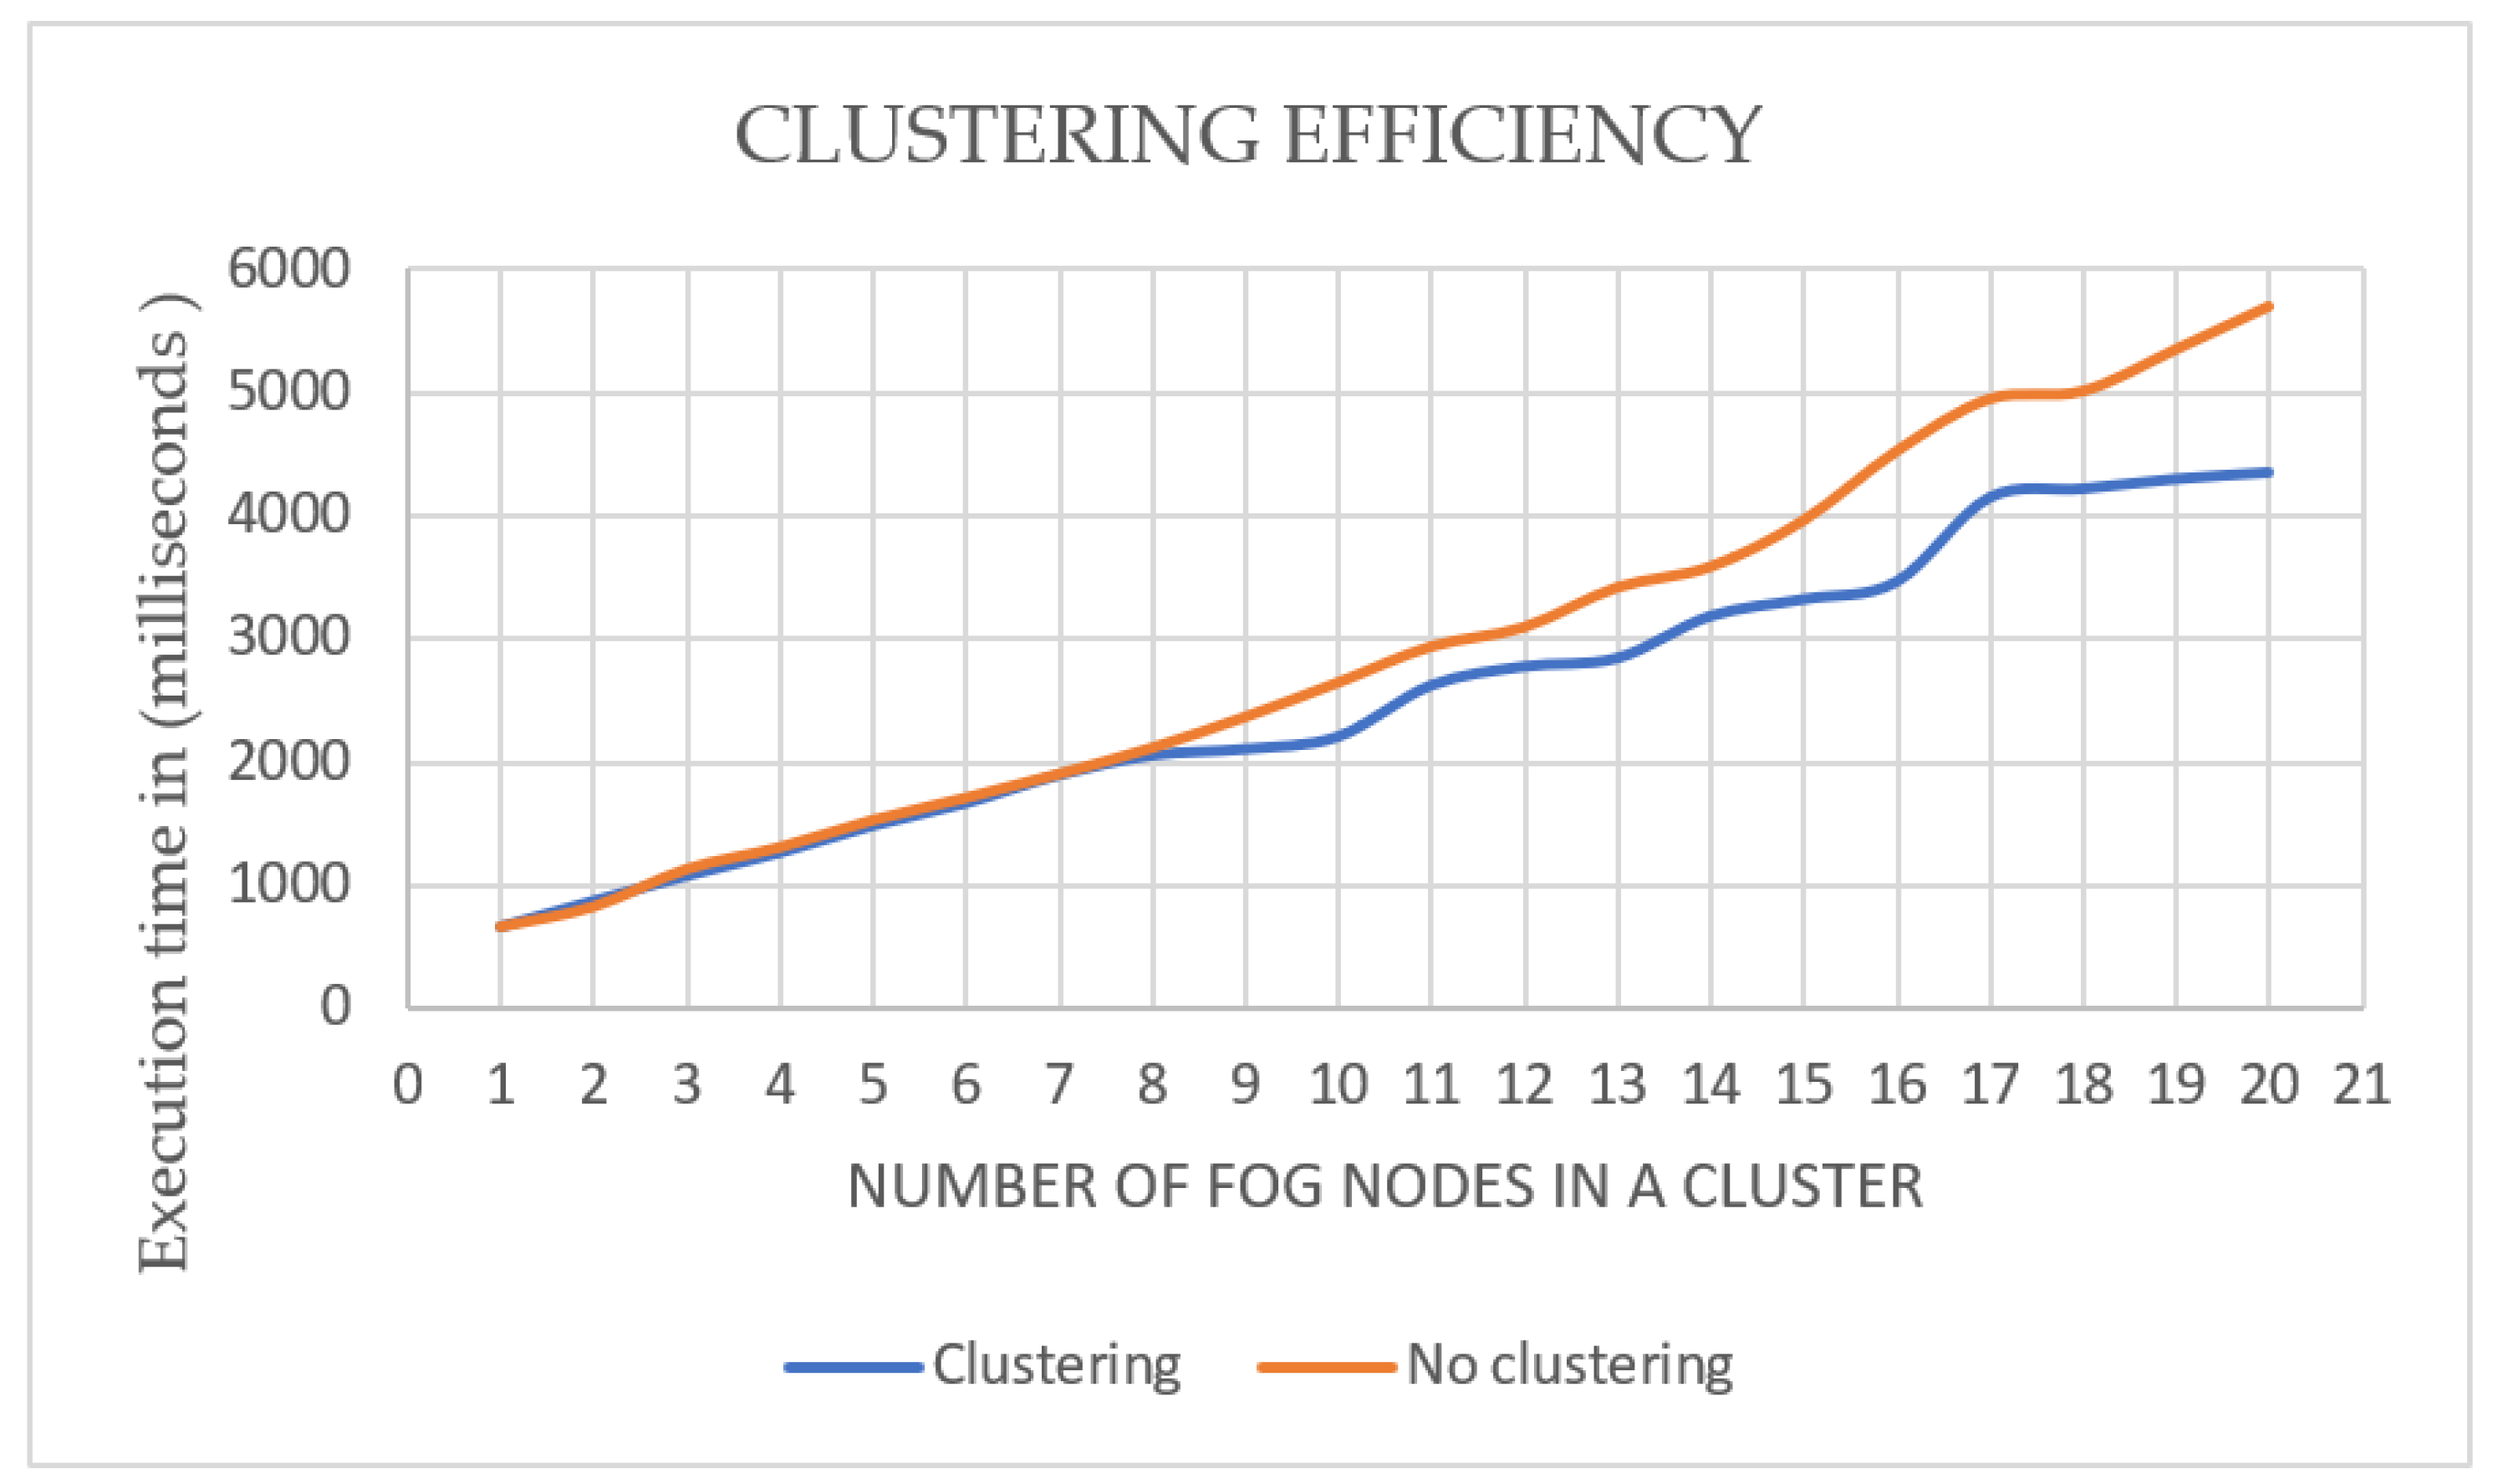
This section presents and analyzes the performance of the proposed model in comparison with the rest of the configurations B–F. The simulation was done through iFogSim, which is a toolkit extended from CloudSim and is used to design and manage resources for edge/fog computing [19]. Data input in this fog application is randomly generated. Therefore, each experiment was conducted ten times and the average of each single metric was calculated. The main goal of the experiments was to weigh the cost this extra layer might cause, and to decide if the extra cost caused by using the extra layer had better performance as a trade-off. Table 2 summarizes the following metrics results:
Execution time: representing the effect of the proposed architecture, including clustering style, if any, and the management layer.
Bandwidth consumption: affecting energy consumption and CO2 emission.
Packet delay: playing a role in providing quality of service.

4.1. Execution Time

Execution time is the total run time for the fog application, and it is measured in milliseconds. Figure 11 illustrates the execution times of the fog application in different configurations with/without management layer. Since all structures had more than one layer and application modules were interactive, the transmission time between different layers played a major role in delivering the required QoS. Hence, execution time here included processing time (PT), which was CPU time for all fog nodes, transmitting time (TT), which was the time tuples spent on their journey from source to destination, and fog nodes latency (L). First, we calculated CPU time for each fog node, F = {f1, f2, …, fm}, through Equation (1) as follows:
  f   F ,   PT = i = 0 m CPUTime   i    
Second, each request consisted of a set of tuples that needed to be processed through different modules. To calculate transmitting time, we defined tuples T = {t1, t2, …, tk}. Each tuple that was being sent to a new destination had an attribute of emit time and arrival time. So, transmission time TT could be calculated as follows:
  t   T ,     T T = i = 0 k SrcModule   emit   time   i DesModule   arrival   time i
Lastly, during the designing phase, we configured each device in the simulation environment with a latency attribute. The summation of this attribute for all devices was calculated as follows:
  f   F ,     L = i = 0 m latency  
As the figure shows, the proposed model (single layer clustering fog environment with a management layer) scored the lowest execution time among all six structures with 1.5 s. On the other hand, models B, D, and F structures, that did not have a management layer had the highest execution time. This was due to the deployed intra-clustering and connectivity styles. The configuration of single clustering with a management layer ensured that end user cluster members could only connect to the assigned fog node, which consequently contributed to less network congestion and lower execution time.

4.2. Bandwidth Consumption

Calculating bandwidth usage is essential to estimate the cost of a system, and it shows the efficiency of resources management and communications between all devices. Figure 12 depicts bandwidth consumption in all 6 configurations. The values on the y axis correspond to consumed bandwidth in kilobytes. Examining the figure, we can see that the proposed model consumed the least amount of network bandwidth, which made this combination of clustering style and a management layer the best configuration of them all in this metric. Structure C, with multi-level clustering and a management layer, recorded the highest bandwidth usage with a percentage of 18% compared to the proposed model. Overall, observing the figure, we can see that including the management layer in multi-layer and flat structures consumed higher bandwidth. This was attributed to how the nodes are connected alongside the management features. Generally, we could say that less bandwidth consumption means less used energy. According to [20], to calculate the energy required to send a bit of data, we need to know the energy spent by the power amplifier, and the electronic circuits, we need to add them up.

4.3. Packet Delay

This metric measures the time needed for one data packet to complete a pre-defined packets route. Looking at Figure 13, we can see that structures with a management layer had higher packet delay compared to structures without the management layer. This was assigned to the extra layer added to the structures, which can be referenced as an overhead cost. However, even though packet delay in configurations with a management layer was higher, execution time was still lower, as shown in Figure 11. The packet delay was 3.5 milliseconds, which is not a concerning delay when taking into account other metrics, such as execution time, in Figure 11, and bandwidth consumption, in Figure 12.

4.4. Cost Effectiveness of the Proposed Model

When considering cost effectiveness, we need to consider trade-offs. Depending on the nature of deployment, it is advisable to add extra hardware/software components for non-delay tolerant systems to maintain real-time processing and high availability. This extra cost can include devices, network bandwidth, CPU time, and/or extra lines of coding to lower the response time. This trade-off is essential to avoid fatalities. On the other hand, delay tolerant systems have the luxury of choosing what metrics to trade-off, based on needs. There are no advantages or disadvantages. There are different needs to be fulfilled and available resources to do so. Based on these, systems are designed.
Nevertheless, aiming to find the optimal number of fog nodes serving a fixed area, we conducted an experiment in which we fixed the total number of end users and changed the number of fog nodes and fog managers serving these devices. The method used in this study was independent replication, so we studied 6 system configurations, and each configuration was run 50 times (a total of 300 simulation experiments). The results of these simulations were averaged and are depicted in Figure 14 and Figure 15. In this study, we recorded execution time and bandwidth consumption for running the program for 6 end users with 1–6 fog nodes. Inspecting Figure 14, it is clearly shown that the average execution time for the proposed model with one fog node was the highest, by 15.6%, compared to the execution time of the same application with 6 fog nodes, which was expected. The relationship between the number of fog nodes and execution time was inverse. However, the curve started to stabilize at the usage of 3 fog nodes. Increasing fog nodes over 3 did not lower execution time, which made it a diminishing return. At this point, we could say that three fog nodes were the optimal number of nodes to achieve a satisfying execution time.
Furthermore, from Figure 15, we can observe a similar trend happening in bandwidth consumption, when compared to execution time. Using one fog node consumed the highest amount of bandwidth, while six fog nodes consumed the least, even though the difference between using one fog node and six fog nodes was only 4%. We believe that this difference would vary depending on fog application. In this experiment, the total number of end user devices was fixed at six. Therefore, the generated amount of data did not change drastically, resulting in similar bandwidth consumption. However, the chart demonstrates that the consumed bandwidth levelled off at the point of three fog nodes, which made three fog nodes serving six devices the optimal option in terms of execution time and bandwidth consumption.
Additionally, to explore the effectiveness of using the clusters in the proposed model, we compared average execution time using 1–20 fog nodes with clustering and without. Each setting was run 5 times and the average was calculated (the application was run 200 times). As illustrated in Figure 16, the performance of the proposed model with clustering and without did not change when using up to 8 fog nodes. The clustering caused a difference in execution time starting from the use of 9 nodes. The difference started from 21% in favour of clustering using 9 nodes and reached 43% in clustering using 20 fog nodes. Therefore, using clustering in the proposed model is advisable for a fog environment that needs 9 or more fog nodes.

5. Conclusions and Future Work

In an effort to overcome cloud computing limitations, especially with the massive increase in connected devices, fog computing was introduced. It is a decentralised computing paradigm, does not require infrastructure work, and utilizes existing computing resources. With these characteristics come challenges, such as heterogeneity and complex connectivity. After reviewing current studies on fog computing in this paper, we proposed, in this paper, a novel fog model that includes a management layer. This layer is designed to assuage these challenges. Through diagnostic simulation and sensitivity analysis, we were able to assess the performance of our model using a fog application. Different structures and clustering strategies were examined and compared. The proposed model showed promising results in decreasing execution time and bandwidth consumption. For further studies, evaluating a different fog application could give more insight into the dynamics of the proposed model. Furthermore, we are studying ways to make the proposed model fault tolerant since the management layer is the backbone of the model.

Author Contributions

Conceptualization, S.A. and B.S.; formal analysis, S.A.; methodology, S.A. and B.S.; Funding acquisition, S.A., B.S. and M.A.A.; investigation, S.A.; resources, S.A.; software, S.A.; visualization, S.A.; supervision, B.S., M.A.A. and A.S.L.; writing–original draft, S.A.; writing–review and editing, B.S., M.A.A. and A.S.L. All authors have read and agreed to the published version of the manuscript.

Funding

This research received no external funding.

Data Availability Statement

Available upon request.

Conflicts of Interest

The authors declare no conflict of interest.

References

  1. Bonomi, F.; Milito, R.; Zhu, J.; Addepalli, S. Fog computing and its role in the internet of things. In The First Edition of the MCC Workshop on Mobile Cloud Computing; Association for Computing Machinery: New York, NY, USA, 2012; pp. 13–16. [Google Scholar]
  2. OpenFog Architecture Workgroup. OpenFog Reference Architecture for Fog Computing. February 2017. Available online: https://site.ieee.org/denver-com/files/2017/06/OpenFog_Reference_Architecture_2_09_17-FINAL-1.pdf (accessed on 8 June 2022).
  3. Tang, B.; Chen, Z.; Hefferman, G.; Wei, T.; He, H.; Yang, Q. A hierarchical distributed fog computing architecture for big data analysis in smart cities. In Proceedings of the ASE BigData & SocialInformatics; Association for Computing Machinery: New York, NY, USA, 2015; pp. 1–6. [Google Scholar]
  4. Chiang, M.; Ha, S.; Risso, F.; Zhang, T.; Chih-Lin, I. Clarifying Fog Computing and Networking: 10 Questions and Answers. IEEE Commun. Mag. 2017, 55, 18–20. [Google Scholar] [CrossRef] [Green Version]
  5. Aazam, M.; Huh, E.-N. Fog Computing Micro Datacenter Based Dynamic Resource Estimation and Pricing Model for IoT. In Proceedings of the 2015 IEEE 29th International Conference on Advanced Information Networking and Applications, Gwangju, Korea, 24–27 March 2015. [Google Scholar]
  6. Zhang, T.; Jin, J.; Zheng, X.; Yang, Y. Rate adaptive fog service platform for heterogeneous iot applications. IEEE Internet Things J. 2020, 7, 176–188. [Google Scholar] [CrossRef]
  7. Zamani, A.R.; Zou, M.; Diaz-Montes, J.; Petri, I.; Rana, O.; Parashar, M. A computational model to support in-network data analysis in federated ecosystems. Future Gener. Comput. Syst. 2018, 80, 342–354. [Google Scholar] [CrossRef]
  8. Karagiannis, V.; Schulte, S. Comparison of Alternative Architectures in Fog Computing. In Proceedings of the 2020 IEEE 4th International Conference on Fog and Edge Computing (ICFEC), Melbourne, VIC, Australia, 11–14 May 2020. [Google Scholar]
  9. Gu, K.; Tang, L.; Jiang, J.; Jia, W. Resource Allocation Scheme for Community-Based Fog Computing Based on Reputation Mechanism. IEEE Trans. Comput. Soc. Syst. 2020, 7, 1246–1263. [Google Scholar] [CrossRef]
  10. Aldossary, M.; Alharbi, H.A. Towards a Green Approach for Minimizing Carbon Emissions in Fog-Cloud Architecture. IEEE Access 2021, 9, 131720–131732. [Google Scholar] [CrossRef]
  11. Kadhim, A.J.; Naser, J.I. Proactive load balancing mechanism for fog computing supported by parked vehicles in IoV-SDN. China Commun. 2021, 18, 271–289. [Google Scholar] [CrossRef]
  12. Lera, I.; Guerrero, C.; Juiz, C. Availability-Aware Service Placement Policy in Fog Computing Based on Graph Partitions. IEEE Internet Things J. 2018, 6, 3641–3651. [Google Scholar] [CrossRef]
  13. Godinho, N.; Silva, H.; Curado, M.; Paquete, L. A reconfigurable resource management framework for fog environments. Future Gener. Comput. Syst. 2022, 133, 124–140. [Google Scholar] [CrossRef]
  14. Benchikh, L.; Louail, L. Task scheduling approaches for fog computing. In Proceedings of the 2021 30th Wireless and Optical Communications Conference (WOCC), Taipei, Taiwan, 7–8 October 2021. [Google Scholar]
  15. Mohamed, N.; Al-Jaroodi, J.; Jawhar, I. Towards Fault Tolerant Fog Computing for IoT-Based Smart City Applications. In Proceedings of the 2019 IEEE 9th Annual Computing and Communication Workshop and Conference (CCWC), Las Vegas, NV, USA, 7–9 January 2019. [Google Scholar]
  16. Xu, F.; Yin, Z.; Gu, A.; Zhang, F.; Li, Y. A Service Redundancy Strategy and Ant Colony Optimization Algorithm for Multi- service Fog Nodes. In Proceedings of the IEEE 6th International Conference on Computer and Communications, Chengdu, China, 11–14 December 2020. [Google Scholar]
  17. Ghanavati, S.; Abawajy, J.; Izadi, D. Automata-Based Dynamic Fault Tolerant Task Scheduling Approach in Fog Computing. IEEE Trans. Emerg. Top. Comput. 2022, 10, 488–499. [Google Scholar] [CrossRef]
  18. Gupta, H.; Vahid Dastjerdi, A.; Ghosh, S.K.; Buyya, R. IFogSim: A Toolkit for Modeling and Simulation of Resource Management Techniques in the Internet of Things, Edge and Fog Computing Environments. Software: Practice and Experience 2017, 47, 1275–1296. [Google Scholar] [CrossRef]
  19. Hoque, M.A.; Siekkinen, M.; Nurminen, J.K. Energy Efficient Multimedia Streaming to Mobile Devices—A Survey. IEEE Commun. Surv. Tutor. 2014, 16, 579–597. [Google Scholar] [CrossRef]
  20. Zhou, S.; Sun, Y.; Jiang, Z.; Niu, Z. Exploiting Moving Intelligence: Delay-Optimized Computation Offloading in Vehicular Fog Networks. IEEE Commun. Mag. 2019, 57, 49–55. [Google Scholar] [CrossRef]
Figure 1. Proposed fog model with management layer and single layer of clustering.
Electronics 11 03597 g001
Figure 2. Fog manager components.
Electronics 11 03597 g002
Figure 3. Allocating module sequential diagram.
Electronics 11 03597 g003
Figure 4. Fog application module.
Electronics 11 03597 g004
Figure 5. Fog computing environment with single layer of clustering with management layer (Structure A).
Electronics 11 03597 g005
Figure 6. Fog computing environment with single layer of clustering without management layer (Structure B).
Electronics 11 03597 g006
Figure 7. Fog computing environment with multi-layer clustering with management layer (Structure C).
Electronics 11 03597 g007
Figure 8. Fog computing environment with multi-layer clustering without management layer (Structure D).
Electronics 11 03597 g008
Figure 9. Fog computing environment in flat structure with management layer (Structure E).
Electronics 11 03597 g009
Figure 10. Fog computing environment in flat structure without management layer (Structure F).
Electronics 11 03597 g010
Figure 11. Execution time in milliseconds for all structures.
Electronics 11 03597 g011
Figure 12. Bandwidth usage in kilobytes for all structures.
Electronics 11 03597 g012
Figure 13. Packet delay in milliseconds for all structures.
Electronics 11 03597 g013
Figure 14. Optimal number of fog nodes–execution time perspective.
Electronics 11 03597 g014
Figure 15. Optimal no of fog nodes–Bandwidth consumption perspective.
Electronics 11 03597 g015
Figure 16. Clustering efficiency in fog computing.
Electronics 11 03597 g016
Table 1. Structure characteristics.
StructureFigureNumber of LayersClusteringManagement Layer
A54SingleYes
B63SingleNon
C73MultiYes
D82MultiNon
E93NonYes
F102NonNon
Table 2. Metrics results.
StructureFigureExecution TimeBandwidth ConsumptionPacket Delay
A5155312,560.923.54940738
B62027.312,675.30.5
C71600.612,814.363.54962706
D82013.11267.6920.5
E91626.112,779.343.549627055
F101969.812,655.930.5
Publisher’s Note: MDPI stays neutral with regard to jurisdictional claims in published maps and institutional affiliations.

