Article

Vision-Based Quadruped Pose Estimation and Gait Parameter Extraction Method

Faculty of Information Engineering and Automation, Kunming University of Science and Technology, Kunming 650500, China
*
Author to whom correspondence should be addressed.
Electronics 2022, 11(22), 3702; https://doi.org/10.3390/electronics11223702
Submission received: 26 September 2022 / Revised: 20 October 2022 / Accepted: 10 November 2022 / Published: 11 November 2022

Abstract

:
In the study of animal behavior, the prevention of sickness, and the gait planning of legged robots, pose estimation, and gait parameter extraction of quadrupeds are of tremendous importance. However, there are several varieties of quadrupeds, and distinct species frequently have radically diverse body types, limb configurations, and gaits. Currently, it is challenging to forecast animal pose estimation with any degree of accuracy. This research developed a quadruped animal pose estimation and gait parameter extraction method to address this problem. A computational framework including three components of target screening, animal pose estimation model, and animal gaits parameter extraction, which can totally and efficiently solve the problem of quadruped animal pose estimation and gait parameter extraction, makes up its core. On the basis of the HRNet network, an improved quadruped animal keypoint extraction network, RFB-HRNet, was proposed to enhance the extraction effect of quadruped pose estimation. The basic concept was to use a DyConv (dynamic convolution) module and an RFB (receptive field block) module to propose a special receptive field module DyC-RFB to optimize the feature extraction capability of the HRNet network at stage 1 and to enhance the feature extraction capability of the entire network model. The public dataset AP10K was then used to validate the model’s performance, and it was discovered that the proposed method was superior to alternative methods. Second, a two-stage cascade network was created by adding an object detection network to the front end of the pose estimation network to filter the animal object in input images, which enhanced the pose estimation effect of small targets and multitargets. The acquired keypoints data of animals were then utilized to extract the gait parameters of the experimental objects. Experiment findings showed that the gait parameter extraction model proposed in this research could effectively extract the gait frequency, gait sequence, gait duty cycle, and gait trajectory parameters of quadruped animals, and obtain real-time and accurate gait trajectory.

1. Introduction

Animal pose estimation (APE) and behavior research have received increasing attention along with the ongoing advancements in computer vision. Pose estimation and behavior research go hand in hand. Pose estimation can obtain keypoints from animal pose and offer information and practical assistance for behavioral research. An essential problem that needs to be solved in behavior research is the further automatic recognition and acquisition of animal gait parameters based on pose estimation. As a result, the two taken together can help us quantitatively analyze, comprehend, and grasp the behavioral laws of quadruped animals. This has important scientific significance and practical application value for monitoring animal behavior, predicting livestock diseases, and designing and developing quadruped robots.
Currently, deep-learning-based systems and conventional artificial labeling are the two main methods used in research on the animal pose and behavior. The former requires the installation of sensor gear on the quadruped animal to gather data; this is a simple process that does not call for any learning or research-based thinking, but it does require the cooperation of the quadruped animal. This method is simple to use and efficient when the research subject is a person, but for a variety of animals, it is easy to lose sensors. It may even harm the experimental subjects due to the randomness of their movement patterns, so it cannot obtain the desired impact. There are fewer scene restrictions in the deep-learning-based scheme because data are mostly captured through the recording of video images, which does not require moving close to the research object. Methods based on deep learning have been applied quickly in recent years with the emergence of diverse neural network models, and they have been used in a few real-world situations. In order to directly forecast position coordinates for tasks involving human pose estimation, Toshev et al. [1] offered a DNN regression approach that combines multistage regression to predict keypoint coordinates directly for human pose estimation applications. The algorithm has two benefits: (1) DNN captures all the context information about key body parts, and each of those keypoints is regressed using a full human image. (2) Theoretically, it is feasible to extract keypoint information from any CNN network, irrespective of the topological relationship between keypoints; however, the error is significant due to the “concentration” of the distribution region of coordinate points. Fan et al. [2] used a dual-source deep convolution neural network (DSCNN) to expand a single RCNN to a dual-source model (DSCNN) to predict coordinate information of human keypoints. The inputs of Fan et al. are image block and entire image, while the outputs are joint detection results of sliding windows and joint placement of coordinate points. Pfisher et al. [3] proposed a keypoint detection method by fusing optical flow with a deep convolutional network. The keypoints were improved as a heatmap, and by integrating the image data from the front and back frames, the keypoint prediction of the human pose had a higher accuracy. Chen Li et al. [4] proposed an unsupervised adaptive approach to animal pose estimation, utilizing a multiscale domain adaptive module (MDAM) to design a pseudo label update strategy based on the memory effects of deep networks that enable networks to learn from clean samples early and noisy samples later to reduce the domain gap between synthetic and real data. Newell et al. [5] developed an hourglass network following a multistage design pattern, which had a detection effect of 94.1% on the MPII dataset. Mu et al. [6] trained their models using synthetic animal data generated from CAD models, which they subsequently utilized to create pseudo labels for unlabeled real animal images. The generated pseudo labels are gradually included into the model training process using three consistency check criteria. Yuhui Yuan et al. [7] proposed a method that combines vision transformer (ViT), traditional deep convolution networks, HRFormer, and improved transformer encoder. This method outperformed pure convolution networks and significantly improved performance for the COCO dataset human keypoint detection task. Cao et al. [8] presented a cross-domain adaptation scheme to learn a common shared feature space between human and animal images. An object detection algorithm, CenterNet, based on Anchor-free, was proposed by Xingyi Zhou et al. [9], and its operations of deleting ineffective and complicated anchors further improved the detection algorithm’s performance. As a result, with a few simple adjustments, it may be applied to tasks involving human keypoint identification, as well as 3D object detection and 2D keypoint activities. In contrast to the usual method of returning keypoints through a heatmap or directly returning keypoints, Microsoft Asia Research Institute proposed a new algorithm called DEKR (disentangled keypoint regression) [10]. It adopted a method of decoupling multibranch regression keypoint positions and used an adaptive convolution module to perform an affine transformation on each branch to obtain the pixel offset of each keypoint. Feng Zhang et al. [11] proposed the Distribution-Aware coordinate Representation of Keypoint (DARK). It includes two parts: (1) a more principled distribution-aware decoding method; (2) a coordinate encoding process (transforming truth coordinates to heatmaps) by generating unbiased heatmaps. In extensive experiments, it was shown that DARK is the best on two common benchmarks, MPII and the COCO keypoint detection dataset. Izonin et al. [12] proposed an RBF-based input doubling method for small medical data processing based on the classical iterative RBF neural network. This method solves the problem of data processing in the medical field when the amount of data is not large enough, and they are difficult to collect. The proposed method achieves the highest accuracy compared to some existing improved RBF networks.
Daou et al. [13] employed piezoelectric sensors to obtain the gait parameters of turtles and created a motion simulation model with regard to the gait parameter extraction in animal behavior research. To extract temporal and spatial information, including the movement behavior and present condition of pigs with various body shapes, Yang et al. [14] used the optical flow frame method. An underactuated quadruped robot named BabyBot with a flexible spine and elastic joints was created by Zhang XL et al. [15] after being inspired by the systematic swing of infants’ arms when they hit the ground with their knees during the crawling process. In bionic robots, Xue Bin Peng et al. [16] captured 3D motion data by placing position sensors in the limbs and joints of dogs and then applying reinforcement learning (RL) to enable the robots to mimic and learn the movements of real animals. In addition, they applied a dog gait to the Unitree Laikago robot, allowing it to mimic dog behavior such as walking, trotting, and rotating. However, this strategy still has several technical obstacles, including high artificial expenses and expertise. Kim et al. [17] proposed a spatially based joint gait and used it with lizard kinematics models after collecting data on lizard movement using infrared cameras. However, this strategy is currently only relevant to a single species, and trials for other animals must be developed to collect data. Chapinal et al. [18] demonstrated that evaluating cow walking speed with five 3D accelerometers is simple and straightforward, but does not capture more complex gait parameters such as gait frequency and gait sequence.
To sum up, the problem of pose estimation has been the estimation of numerous theoretical studies and theories, and human pose estimation is more advanced than animal pose estimation. Due to the significant differences in anatomy and behavior between humans and quadruped animals, human pose estimation and quadruped animal pose estimation are very different. Animal pose estimation has the following issues more so than human pose estimation.
  • Because there are many distinct kinds of quadrupeds and because their body kinds, limbs, and behavior modes frequently change substantially, the results of applying a model originally applied using data from one animal to others are very subpar.
  • Animal fur comes in various hues, and if the color is close to the backdrop color, it is easy for the background to distort the image, making it difficult to extract an accurate animal pose information from complicated surroundings.
  • Because quadruped animals often have their limbs below the body, it is easy for the limbs to become mutually occluded during exercise, which makes it more challenging to extract the keypoints.
Because of these issues, it is challenging to apply human pose estimation methods to animal pose estimation directly. Additionally, the present method for extracting quadruped animal gait parameters mainly involves placing sensors in strategic locations on the limbs to track pertinent motion parameters. The problem of how to obtain precise motion gait parameters through noncontact computer vision perception and automatically assess and identify the motion features of quadrupeds based on pose estimation remains unresolved.
This research proposes a quadruped animal pose estimation model and gait parameter extraction method to address these problems, using target screening, an animal pose estimation model, and animal gait parameter extraction, which can completely and effectively solve the problem of animal pose estimation and obtain animal gait parameters. Among them, an improved animal pose estimation network based on the HRNet network is proposed to improve the performance of animal pose estimation, aiming for the extraction efficiency of animal keypoint information. The basic idea behind it is to use a special receptive field block called DyC-RFB to improve the first branch’s feature extraction capability in stage 1 of the HRNet network and to improve the network model’s overall feature extraction capability. This will result in a better keypoint extraction effect for the animal pose keypoint. Despite being a simple enhancement to the HRNet network model, it has improved the performance of keypoint extraction of animal pose estimation without appreciably increasing network parameters and computation. Additionally, an object detection network may also considerably improve the animal pose estimation effect of some small targets, multitargets, and increase the stability and reliability of pose estimation by being added to the front end of the pose estimation task for target screening. The calculation models of keypoint gait parameters, including gait frequency, gait sequence, and duty cycle, were established with the goal of realizing the automatic extraction of gait parameters and obtaining real-time and accurate foot gait trajectory. This method was based on pose estimation and by analyzing the relationship between the temporal and spatial changes in keypoints of animal pose and gait parameters.
The chapters of this study are organized as follows. In Section 2, we mainly introduce the animal pose estimation model and animal gait parameter extraction methods. Section 3 describes the experiments and results in this paper. Finally, we provide a conclusion and discussion of this paper in Section 4.

2. Models and Methods

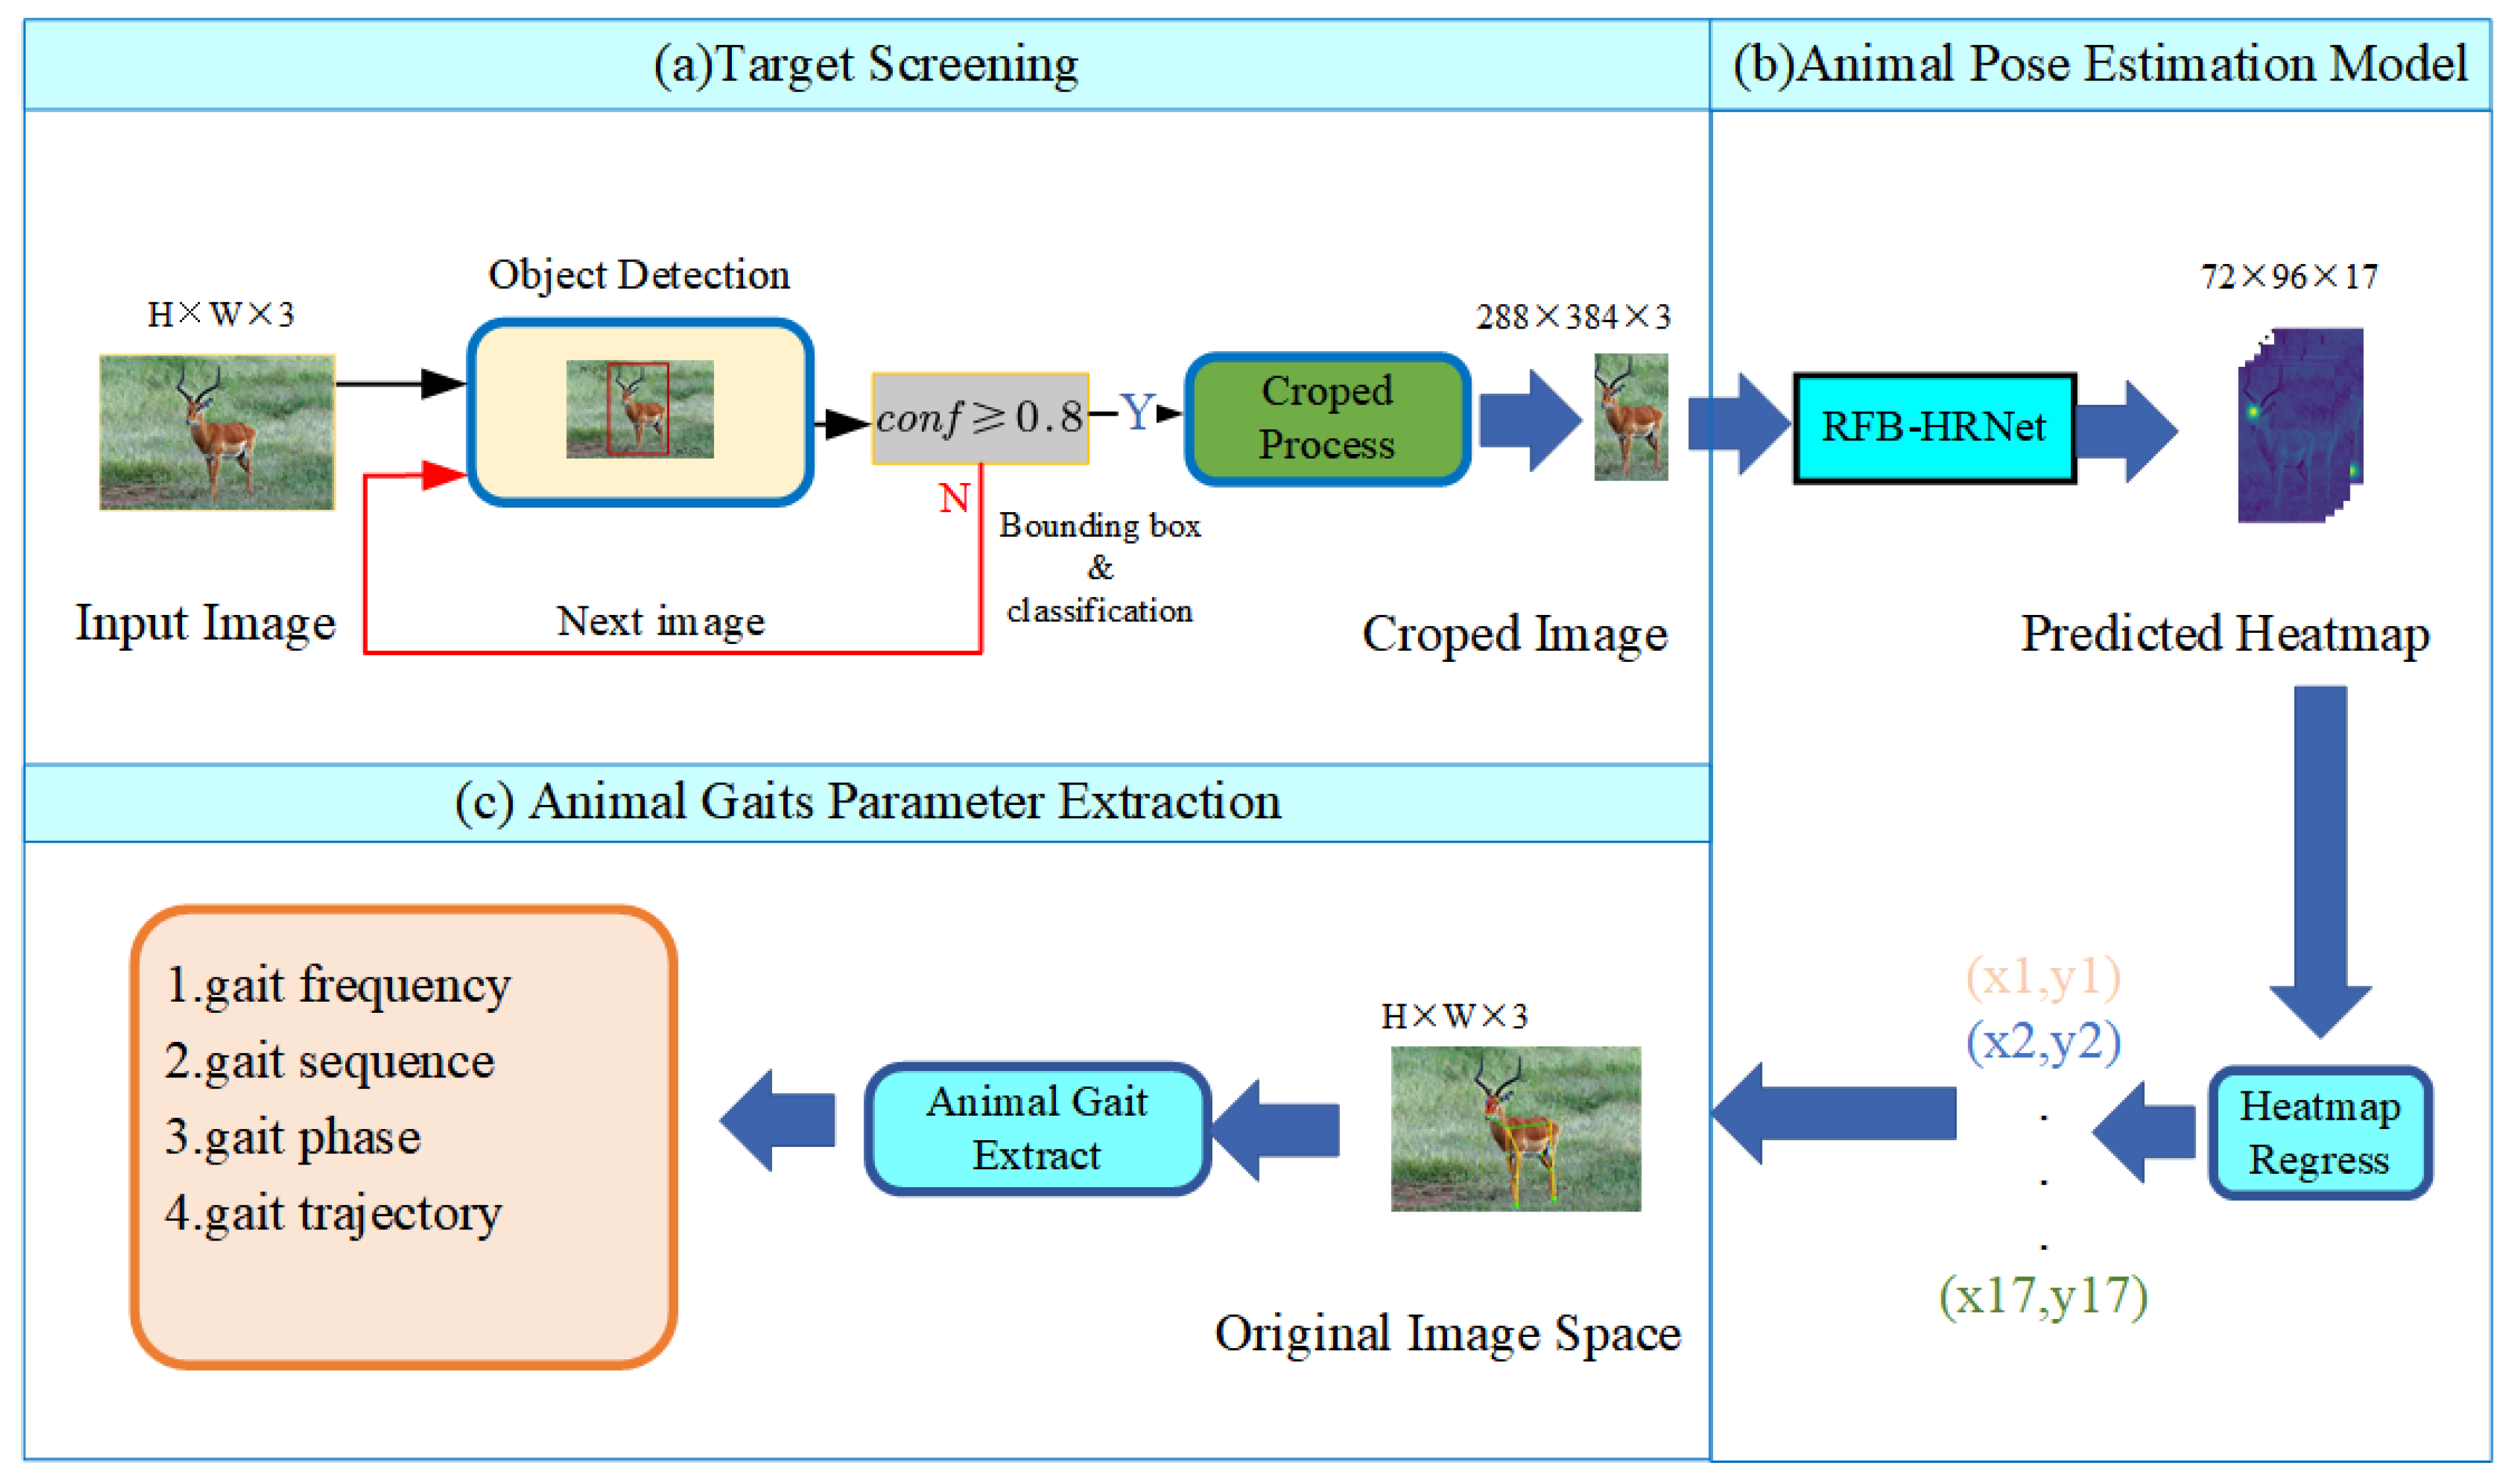
2.1. Computational Framework

To comprehensively and effectively handle the problem of animal pose estimation and gait parameter extraction, this research proposes a computational framework based on computer vision that consists of three sections, as depicted in Figure 1.
(1)
Target screening: The individual animal in the input image was targeted after the raw resolution video image data were passed through an object detection network, and the upper left and lower right corner coordinates of the selected box, the confidence of the box, and the animal species were output. In the experiment, if the confidence score >0.9, confidence was correctly selected, but the gait parameters collected were not continuous, possibly. Even though the parameters that were extracted were correct, some valid information was lost at the same time. If the confidence score <0.7 was correctly selected for the animal, more mutant noise was added to the final gait parameters, and the processing was difficult. We set this confidence threshold at 0.8 to balance accuracy and data integrity. The animal was correctly identified when the frame had a confidence score greater than 0.8. Following a cropping process based on the coordinates of the frame, the resolution was adjusted to 288 × 384 without changing the aspect ratio of the raw picture. If the detection confidence was less than 0.80, we skipped the current image, detected the next image, and entered the results into the subsequent RFB-HRNet network.
(2)
Animal pose estimation model: The image sliced by the pre-object detection network was resized to a fixed size, 288 × 384 × 3 resolution, and input into the keypoint extraction network RFB-HRNet to acquire the heatmap of the animal’s keypoints in the image, and the heatmap measured 72 × 96 × 17. The coordinate information of the keypoints in the feature map was calculated based on the predicted heatmap, and the resulting coordinate information was restored to the ground truth coordinates in the original image space and connected sequentially.
(3)
Animal gaits parameter extraction: After obtaining the coordinates of the keypoints of the animal under the original resolution, a set of time series of the coordinates of the animal keypoint was obtained to process the obtained data, and the gait information of the quadruped animal was acquired. This information included gait frequency, gait sequence, gait duty cycle, and gait trajectory. Section 2.3 contains information regarding the particular technique of implementation.

2.2. Animal Pose Estimation Model

2.2.1. Improved Animal Pose Estimation Network (RFB-HRNet)

The animal pose estimation task is position-sensitive. Common low-resolution representation model methods, such ResNet [19], VGG [20], and the MobileNet [21] series, perform badly for this kind of task. These multilayer models compress feature map resolution to accomplish semantic aggregation, but do so at the expense of details, making them better suited for image classification tasks. Regarding tasks involving pose estimation, the current main research hypothesis is to fuse the low-resolution feature map with the high-resolution retention network in order to increase the independence of the semantic information between the resolutions while retaining the large-scale feature map data extracted from the front layer using the high-resolution retention network. High-resolution maintenance networks have become the backbone networks for the majority of common pose estimation models in recent years. The performance of keypoints extraction significantly improved after the HRNet high-resolution maintenance network [22] was introduced. In comparison to the human pose estimation task, the animal pose estimation task is more easily obscured by the background, every keypoint’s motion relationship is intricate, and mutual occlusion occurs frequently, all of which place higher demands on the ability to extract keypoints. In order to further enhance the extraction performance of important details of quadruped animal poses, this paper uses the HRNet network as the backbone network and enhances the network model on this basis.
In order to preserve high-resolution features and integrate multiscale low-resolution features, HRNet adopted the idea of a multibranch structure, with each branch corresponding to a feature map of different scale. As the network depth expanded, the network branches would also rise, but the branches corresponding to the larger-scale feature map would remain and move in reverse. The body portion of the HRNet network consisted primarily of four stages in order to actualize this idea. Each stage had several network branches, with the number of network branches increasing by one with each stage; the number of channels in the lower network branch was twice that of the upper network branch, and the feature map resolution was one-half that of the upper network branch. Thus, the number of network branches would gradually rise with each successive stage. Due to the unique multibranch structure of the HRNet, it can be seen that the ability to extract features from the first branch of stage 1 has a direct effect on the ability to extract features from each branch in the subsequent three stages, which in turn affects the extraction performance of the entire network model for keypoint information. If the capacity to extract features from the first branch of stage 1 of the HRNet network can be increased, the ability to extract features from the entire network model will be enhanced as a result of the transfer impact of each branch in subsequent stages.
Inspired by this, and based on HRNet, this research proposes an enhanced keypoint extraction network, RFB-HRNet, as shown in Figure 2, to further improve the performance of keypoint extraction of quadruped animals. The basic idea is to use a special receptive field block module to improve the feature extraction ability of the first branch of stage 1 of the HRNet network, and then to improve the overall feature extraction ability of the network model with the aid of the transmission effect of each branch in the later stage, thereby achieving improved quadruped animal keypoint extraction effects. To provide a receptive field mechanism that resembles human vision, a DyC-RFB (dynamic convolution receptive field block) with a dynamic convolutional layer was introduced after the first branch of stage 1 of the HRNet-W48 backbone network. The ability of the first branch to extract features was improved, and this effect was propagated to the subsequent stage, ultimately enhancing the extraction performance of the entire network for keypoint information. In addition, the computational complexity of the DyC-RFB module was minor after it was placed in the first branch of stage 1, which accounted for the trade-off between model complexity and computational speed and prevented a significant influence on network processing speed.
The model’s computation procedure is as follows: Firstly, the image resolution obtained by the object detection network is kept at its original aspect ratio of 288 × 384 × 3. The process is not a simple scaling of the original image, but rather is the filling of one dimension with 0 to compensate for another dimension’s deficiency while guaranteeing that the resolution of 288 × 384 is met. A feature diagram with measurements of 72 × 96 × 48 was presented after the updated DyC-RFB module. After successively completing stage 2, stage 3, and stage 4, four branches’ feature maps were obtained. Later, following multiscale feature fusion, the resolution was adjusted to 72 × 96 and the number of feature map channels was extended to 384. After a convolution with kernel size = 1, stride = 1, and padding = 0, the number of channels was resized to 17, and the heatmap was regressed 17 times, thus obtaining the two-dimensional coordinates of the quadruped’s keypoint, which were then scaled in succession. Finally, it was returned to the coordinate position of the keypoint according to the original resolution space.
To reduce the deviation of decoding from the heatmap to the keypoints, the formula k = D e c o d i n g ( E n c o d i n g ( k ) ) should be satisfied as much as possible, where k represents the keypoint coordinates marked by the dataset. This paper adopts the DARK method proposed in [11], and the process is shown in Formula (1):
p = m D m 1 D m ,
where m represents the position coordinates of the first maximum in the heatmap, and D and D are the first and second derivatives of the log-likelihood function of the predicted heatmap coding formula, respectively. The original formula is shown as follows:
D x ; p , Σ = ln 2 π 1 2 ln Σ 1 2 x p T Σ 1 x p ,
where Σ is the covariance matrix d i a g ( σ 2 ) , x is the two-dimensional position coordinate of the heatmap, and p is the keypoint position of the predicted heatmap.
The final coordinate position at the original resolution space can be expressed:
p ^ = λ p ,
where λ represents the scaling factor, and p ^ is the coordinate position of the keypoint under the original resolution space.

2.2.2. DyC-RFB Module

The RFB module is primarily utilized by the SSD [23] algorithm. By mimicking the receptive field of human vision, the RFB module can improve the network’s capacity for feature extraction. As depicted in Figure 3a, its structure is primarily based on the concept of an inception algorithm [24]. It adds a dilated convolution layer [25] to inception, which increases the model’s ability to extract features while taking into account the amount of computation required. Compared to static convolution, dynamic convolution offers a greater capacity for feature expression and can improve the model’s expression capability without expanding the network’s depth or width. Its calculation volume is just 4% greater than that of static convolution, but its performance in feature extraction surpasses that of static convolution. In order to further improve the model’s ability to express features, this research employs the dynamic convolution (DyConv) module [26] to upgrade the RFB module. It then offers an improved DyC-RFB module, as depicted in Figure 3b. Specifically, it replaces the 3 × 3 convolution of the final layer of the RFB module with dynamic convolution. The size of the dynamic convolution kernel remains as 3 × 3, and the respective dilation rates are 1, 3, and 5.
Figure 4 depicts the dynamic convolution (DyConv) module structure. Its structure has k convolution kernels and the attention module calculates the convolution kernel weight. Each convolution kernel’s size and output dimension are identical. The average pooling layer is carried out in the attention layer before being projected to the k dimension via two fully connected dense layers. Softmax normalization is then applied to the k convolution kernel weights and convolution kernels to aggregate them. After the aggregate convolution, the batch normalization is applied and the ReLU activation function is employed to generate the dynamic convolution module. Its calculation formula is as follows:
y = g W ˜ T x + b ˜ W ˜ = k = 1 K π k x W ˜ k b ˜ = k = 1 K π k x b ˜ k s . t .0 π k x 1 , k = 1 K π k x = 1 ,
where W ˜ k and b ˜ k are the weight vector and bias vector of the k th convolution kernel, respectively, and π k x is the attention weight learned by the attention module.

2.2.3. Evaluation Metric

The standard evaluation metric is based on object keypoint similarity (OKS), and average precision (AP), mean average precision (mAP), and average recall (AR) are the main evaluation metrics of the pose estimation task.
(1)
OKS
In this paper, after the pose estimation model obtains the prediction heatmap of 17 keypoints, the position coordinates corresponding to each keypoint are obtained by regression processing. Then the prediction effect is evaluated by comparing the position coordinates to the ground truth keypoint. The OKS calculating formula can be denoted as:
O K S = i exp d i 2 2 s 2 σ i 2 δ v i > 0 i n δ v i > 0 ,
where σ i 2 represents the normalization factor of the ith keypoint, which is the standard deviation between the manually labeled keypoints and the actual keypoints in all image data. The larger the standard deviation, the larger the labeling error for this type of key- point and the more difficult it is to label. Labeling this type of keypoint becomes easier as its labeling error decreases. The calculation formula is: σ i 2 = E [ d i 2 / s 2 i ] . The constants of each keypoint are different; the specific values were set according to the AP10k dataset processing code in the mmpose codebase. The normalization factors for 17 keypoints, including the nose, eye, neck, tail, shoulder, knee, and ankle, are [0.025, 0.025, 0.026, 0.035, 0.035, 0.079, 0.072, 0.079, 0.072, 0.062, 0.107, 0.087, 0.089, 0.107, 0.087, 0.087, 0.089]. d i represents the Euclidean distance between the detected keypoint and the corresponding ground truth. s is the object scale. δ i ( v i ) represents the visibility mark of the keypoint; when v i > 0 , this keypoint is visible, and δ ( v i ) = 1 . When v i < 0 , the keypoint is invisible, and δ ( v i ) = 0 . Each keypoint in the formula has a similarity between 0 and 1. Ideally, the predicted keypoint’s OKS = 1 when its coordinates match its actual keypoint.
(2)
AP
The test dataset Formula (6) depicts the AP of each keypoint. AP50 and AP75 represent the average precision when IoU equals 0.50 and 0.75, respectively. APM indicates the average precision of animals on medium objects, whereas APL represents the average precision of animals on large objects.
A p = p δ O o k s > s p 1 ,
where s is the OKS threshold. When O o k s > s , δ ( O o k s ) = 1 .
(3)
mAP
The mAP is the mean value of AP calculated for different types of keypoints in the entire dataset, reflecting the performance of the detection algorithm. The formula is P m A P = m e a n { A P @ s ( 0.50 : 0.05 : 0.95 ) } .
(4)
AR
AR reflects the proportion of the keypoints in the image that are successfully found, so the AR is calculated as follows:
A R = T P T P + F N ,
where TP is the number of keypoints correctly identified in the image, and FN is the number of keypoints not correctly identified in the image.

2.3. Animal Gait Parameter Extraction Model

2.3.1. Animal Gait Frequency Extraction Model

The motion state of quadruped animals can be separated into two phases: the swing phase and the support phase [27]. The swing phase is the motion state of the animal’s feet from leaving the ground to the next landing during the gait cycle, whereas the support phase is the movement state of the feet during a gait cycle when the feet are on the ground. The swing phase and support phase of a quadruped animal are shown in Figure 5.
Periodically, the limbs of the quadrupeds swing when they move. During this brief period of time, the relatively flat segment of the curve shows that the limbs are in the support phase, while the steeper segment (Figure 6a) indicates that the limbs are in the swing phase. Through the first-order differential processing of the corner points of the limbs, the differential frame (former frame t f r a m e , later frame t f r a m e + 1 ) between the two adjacent slopes is taken to obtain the minimum value, and the time t is mapped to frame F(fps). The video used in this paper is 30 frames, that is, the minimum time scale of a single frame is Δ t = 1/F. The formula for calculating the gait frequency of a quadruped animal is:
f = 1 t f r a m e + 1 t f r a m e Δ t ,
where t f r a m e is the previous gait cycle slope minimum frame; t f r a m e + 1 is the next gait cycle slope minimum frame; and Δ t means a minimum frame time unit, which is a constant of 1/30 in this paper.
In an ideal state, the first-order differential curve of feet-end displacement should produce a signal consisting of a square wave; however, this is not possible in practice. Therefore, the first-order differential curve depicted in Figure 6b is not a complete first-order differential processing of Figure 6a, but is a reasonable assumption.

2.3.2. Gait Sequence Recognition Model

During a gait cycle, the gait sequence of a quadruped animal is also an important feature, but it is easily affected by unfavorable circumstances such as environmental occlusion and shot angle when attempting to extract it. Based on the extracted relative position parameters of the foot end, this paper analyzes the gait sequence features of the quadruped animal over time, then binarizes it to obtain the gait phase diagram displayed in Figure 7. By the concept presented in Section 2.3.1, the first-order differential curve of the corner displacement of the quadruped animal is obtained and binarized to produce the gait phase diagram.
The actual first-order differential curve frequently has a transition process during the switching process between the support phase and the swing phase, i.e., the foot end has lifted a part but has not yet completely left the ground; therefore, a threshold value must be designed to fault-tolerantly control the process. If the binarization threshold is set as thr, then whether the quadruped animal is in the swing phase or the support phase can be judged by the following formula:
a = 0 , f ˙ i e l s e 1 , f ˙ i t h r δ 1 , t h r + δ 2 ,
where a is the label of the support phase and the swing phase, 0 represents the swing phase, and 1 represents the support phase. thr is the threshold of the swing phase and the support phase, δ 1 , δ 2 are the threshold margins. The specific size can be set according to the actual first-order differential curve. The degree of oscillation is set on demand so that the threshold can be dynamically adjusted according to the actual situation.
Figure 7 depicts the quadruped animal gait cycle for each limb. According to the color-coded blocks in the figure, the limb is currently in the support phase. When examining and calculating the order in which each limb’s support phase occurs throughout a gait cycle T, the gait sequence characteristics of each quadruped animal can be obtained appropriately.

2.3.3. Duty Cycle Parameter Extraction Model

The quadruped gait occupancy parameter describes the percentage of time that the pendulum support phase occupies throughout the gait cycle when quadruped animals move. We selected a gait phase diagram of one of the limbs to serve as a method for the extraction of occupancy parameters in a quadruped. From the Figure 8, we can calculate a gait cycle of T for each member of the quadruped: t 1 for the moment the foot initially contacts the ground, t 2 for the moment it leaves the ground, and t 3 for the moment it contacts the ground again.
Gait duty cycle parameter extraction is shown in Formula (10):
α = t g T ,
where t g is the duration of the limbs in the support phase during a gait cycle. The specific calculation formula is t g = t 2 t 1 , and T is the gait cycle.
The gait cycle of each limb varies slightly during quadruped animal movement, even at constant speeds. Hence, it is necessary to average all the occupancy parameters for each leg.

2.3.4. Gait Trajectory Extraction Model

Due to their distinct body composition and gait, quadruped animals can walk freely in various challenging ground environments, including plains, hills, and mountains. This inspires the design of legged bionic robots. Legged robot gait planning has traditionally been the subject of research in this area.
The recorded video data of the experimental animals are broken down into images frame by frame using the model method in this research, and the keypoints are then identified. The foot-end trajectory characteristics of the experimental animals can then be obtained by connecting the keypoint locations of each limb’s foot end in a systematic manner in accordance with the time sequence.

2.3.5. Evaluation Index of Gait Parameter Extraction

We analyze the gait parameter method proposed in this study by comparing it with manual computation to verify the practical effect of the gait parameter extraction method. The three different types of experimental animals include buffalo, horse, and dog. It consists mainly of the following two indicators.
(1)
Relative error
The gait parameters of the target animals were extracted by the method presented in this paper and compared with the actual value of the manually labeled, as follows:
E r e l = M c O A O A × 100 % M c = 1 4 M i O A = 1 4 O i ,
where M c represents the average measurement of an individual animal; O A is he actual value manually marked by individual animals; M i represents the measured value of the ith leg; O i represents the manual labeled value of the ith leg.
(2)
Gait sequence consistency judgment index
The indication C for the gait sequence consistency judgment index is used to calculate a quadruped animal sequence, as shown in Formula (12):
C = i δ S i c = S i a N ,
where N is the total number of steps the subject took throughout the experiment; S i c represents the leg the experimental object used in step I, and S i a represents the leg the experimental object actually used in step i. The four limbs of the experimental subjects can be represented in this work by the letters LF, RF, LB, and RB, which stand for the respective left front leg, right front leg, left hind leg, and right hind leg.

3. Experiments and Results

3.1. Animal Pose Estimation Experiment

3.1.1. Dataset Source and Preprocessing

In this study, we adopted the AP10K dataset [28], a public animal keypoint detection dataset. The dataset combines previously published datasets and arranges all animals into a collection of 54 species belonging to 23 families in accordance with the biological concepts of family and species. All 54 different animals are eventually labeled, yielding 10,105 labeled images and 13,028 pose annotations. The dataset animals’ entire bodies were split up into 17 keypoints, and Table 1 shows animal keypoint definitions. K-fold cross-validation was used to validate the dataset to fairly assess the model’s performance and fully utilize the data to prevent overfitting. Firstly, 10 slices of each species were cut, and the slices were then separated into three groups: a training set, a validation set, and a test set, in that order: 7:1:2. The dataset was rerandomized three times using the same methodology, and the evaluation score of the model was taken as the average of the three results.
The keypoint annotations format is (x, y, z), in which x and y are the pixel coordinates of the keypoint relative to the upper left corner of the image, and v represents the visibility of the keypoint. If v = 0 means that the keypoint position does not appear in the image, the keypoint is not marked, and the corresponding (x, y) is also set as (0, 0); v = 1 indicates that the keypoints appear in the image, but there is occlusion; v = 2 indicates that the keypoints are visible in the image and are not occluded. The connection order of the quadruped animal’s skeleton is as follows: [1 2], [1 3], [2 3], [3 4], [4 5], [4 6], [6 7], [7 8], [4 9], [9 10], [10 11], [5 12], [12 13], [13 14], [5 15], [15 16], [16 17]. The keypoints are connected in order, and the labeled information is shown in Figure 9.

3.1.2. Experimental Design

The experimental setup employed for this paper’s experiment is equipped with an Intel i5 10600kf core CPU, 32 GB of memory, and an NVIDIA RTX3060 graphics card. The deep learning framework chooses Pytorch1.8.2, Adam [29] optimizer, 16 for the batch size, 210 epochs, 0.001 for the learning rate, and 0.0001 for the learning rate after scaling the original image resolution to 288 × 384 resolution. This paper employs the pretraining model pose_hrnet_w48_288 × 384 to transfer the model, which speeds up the training process and lowers the time complexity of training the network from scratch.
This paper’s three sets of comparative ablation study were set up to contrast with the original HRNet network. The first group consisted of the original HRNet network by repeating the training network three times. The results were then averaged, and the acquired dataset was analyzed and confirmed. The second group added an RFB module, and the subsequent processing was the same as for the first group of studies. The DyC-RFB module and the same evaluation approach were introduced in the third group of studies.
Some blocked image data were introduced at random while the network model’s keypoint predictions were being made in the process to assess the network’s capacity to handle complicated networks. After discussing the similarities between human pose estimation and those of four-legged animals, a number of images from the COCO2017 dataset were chosen for experimental validation.

3.1.3. Experimental Results on the AP10K Dataset

Using the AP10K dataset, this experiment initially examined the performance of RFB-HRNet before testing the performance of alternative model approaches.
To further verify the prediction performance of the network model of this paper on 17 keypoints, we randomly selected 1280 images from the test dataset (the test data contained all 54 animal species in the dataset used in this paper) and randomly flipped, cut, added noise, random rotation ([−45°, 45°]), and random scale ([0.65, 1.35]). We obtained the accuracy of 17 types of quadruped animal keypoints, as shown in Table 2.
In Table 2, the average precision is better for feature keypoint with apparent characteristics such as the nose, eyes, and shoulder. The accuracy of recognition is only somewhat high for other feature points, such as wrist joints and tails, because these keypoints are influenced by the environment, the animal’s pose, and the characteristics of its hair, such as color and texture.
We report the results of our method and other methods in Table 3. The outcomes demonstrate that our method produced the best outcomes. The AP50, AP75, APM, APL, AR, and mAP increased by 2.2%, 1.6%, 4.4%, 1.7%, 1.9%, and 2.1%, respectively, compared to the original HRNet-w48 network. As a result, our method was much improved when compared to other models.
Our network RFB-HRNet, trained from scratch with input size 288 × 384, achieved a 0.75 mAP score more than other models with the same input size. (i) Our method improved mAP by 2.1 points compared to HRNet-W48, while the numbers of parameters are similar to HRNet-w48, and ours is slightly larger. (ii) Compared to ResNet101 and ResNet50, our method improved mAP by 6.7 points, compared to ResNet50, which improved by 6.9 points, respectively.

3.1.4. Ablation Study

Analysis and comparison were compared on the parameters and mAP score of the three different HRNet networks: the original HRNet-w48 network, the HRNet network with the RFB module added, and the HRNet network with DyC-RFB module. According to the findings, which are compared in Table 4, the RFB module’s network parameters increased by 0.32 M in comparison to the original HRNet network, and the mAP score increased by almost 1.3 points. The number of parameters increased by 0.057 M after adding the improved DyC-RFB module, and the performance of the mAP score improved by 0.8 points as a result.
We selected 10 animal species randomly to compare the recognition impact of our method with the original HRNet network and to compare our method’s prediction effect with the original HRNet-w48 network. Among the animals selected, some like to dwell in groups, while others prefer to move alone. The sampled images contain single-target images, multitarget images, small-area occlusions, and large-area occlusions. The detection results of the original HRNet-w48 network are shown in the even-numbered rows of Figure 10, and the detection results of the proposed front object detection network + RFB-HRNet network in this paper are shown in the odd-numbered rows.
As observed in Figure 10, the two networks can produce identical detection results for a single animal when the scale of the animal is large. However, our method is more accurate in some feet-end positions while the original HRNet network exhibits some bias. The detection performance of our method is noticeably superior to that of the original HRNet-w48 network for small target animals. For instance, our method can identify the facial features of the last group of cats in the image which are running. In contrast, the original HRNet-w48 network has a significant offset when identifying their faces and has a lower identification effect on the limbs than our method. Our method can completely detect numerous targets and effectively separate each individual animal, in contrast to the original HRNet-w48 network, which produces the scenario of missed detection and mutual adhesion and is unable to separate multiple targets effectively. This is controlled by the input–output structure of the pose estimation network; thus, if numerous animals are close together, it is simple to connect the coordinates of keypoints amongst different individuals, as demonstrated by the effect of the pose estimation network on the sheep in row 4. In contrast, due to the inclusion of a prior object detection network in the method proposed in this paper, as many animals as feasible in a picture including numerous animals can be detected, so that the task is broken into recognizing many single targets, making it significantly more effective than the original HRNet network.
In a sense, humans are also a special “four-legged animal”. Therefore, to verify the generalization ability of the proposed model, several human images were randomly selected from the COCO2017 dataset and their keypoints were predicted. The results are shown in Figure 11.
According to the above figure, quadruped animals have a body structure similar to humans. This is especially true in terms of facial feature recognition, which has a high level of accuracy. However, effective recognition is not possible when dealing with complex human body poses and varied scenes.

3.2. Gait Parameter Extraction Experiment

3.2.1. Video Data Collection

The quadruped animal gait parameter extraction experiment, which made up the second portion of the study, sought to confirm the reliability and validity of the suggested quadruped animal gait parameter extraction model. The gait parameter extraction experiment requires continuous motion video footage of different quadruped animals with multi-gait cycles. In this study, the experimental dataset for state parameter extraction was a motion video of quadruped animals that was shot in real time. Figure 12 depicts the quadruped animal video capture system, which was shot using a tripod-fixed shooting gear. The camera’s position is roughly 1 m above the ground, and its coordinates are in the O–XYZ space. The included angle between the motion direction of the quadruped animal and the X–Y plane is defined as the motion direction angle β . The motion direction is positive when it is far from the X–Y plane and negative when it is close to the X–Y plane. The captured video had 720 × 1280 pixels and a frame rate of 30 FPS, and the range of β was −33°~33°. Quadruped animals include buffalo, horse, and dog, representing typical quadruped animal of different sizes. Among them, buffalo and horse have a walking gait, and dog has a trot gait. The buffalo moved from right to left, while the horse and the dog moved from left to right. During the shooting, the walking process of the quadruped animal was recorded as completely as possible to ensure that the video contained multiple gait cycles.

3.2.2. Gait Frequency Extraction Experiment

Figure 13, Figure 14 and Figure 15 depict the foot distance curves of a buffalo, a horse, and a dog in the experimental animal’s x direction (where x indicates the animal’s heading direction and y represents the direction perpendicular to the ground).
The quadruped animal’s left front leg, right front leg, left hind leg, and right hind leg, as well as the first-order differential slope, are represented in the above image by the letters LF, RF, LB, and RB, respectively. Since the camera is fixed during the recording of the video material, it is clear from the figure that when quadrupeds move forward, their limbs alternately swing. Therefore, the experimental animal’s foot displacement direction should be monotonic, moving from right to left when its features are monotonically reducing, and from left to right when they are monotonically growing.
Because the quadruped animal’s forward movement process involves the four legs swinging in essentially the same movement, the difference between the starting frame and the end frame must take this into account. However, the order of the legs’ movements does alter slightly. As a result, one leg’s pixel change curve can be chosen as the reference, and the first derivative can then be determined. The gap frame period of a gait cycle is the difference between the minimum values of the first-order differential curve. Figure 13b, Figure 14b, and Figure 15b display the first-order differential curves. The gait frequency of the buffalo, horse, and dog may be estimated using Formula (8), as shown in Table 5.
Table 5 above shows that when compared to the manual method, our method has a maximum frequency relative error of 2.46%. In comparison to horses and dogs, buffalo showed frequency errors that were noticeably larger. This resulted from the buffalo we photographed having a darker background, which had a detrimental impact on the experimental results, but overall, the error was within the acceptable range. The gait frequency of the buffalo and horse is substantially lower than that of the dog. In general, there is a correlation between body size and the gait of quadruped animals. The frequency of gait decreases as body size increases.

3.2.3. Experiment of Gait Sequence Recognition

The leg stride order of quadruped animals is a crucial component of a gait cycle, but it can be easily influenced by a number of negative conditions during the extraction process, such as shooting angle and ambient occlusion. This paper examined the quadruped animals’ gait sequence features over time and binarized them to obtain the gait phase diagram, as shown in Figure 16. This analysis was based on the relative position parameters of the foot end that were extracted above.
Figure 17 depicts the gait patterns of a buffalo, horse, and dog. It is clear that the gait patterns of the two animals are identical. The left front leg comes first, followed by the left front leg- > right hind leg- > right front leg- > left hind leg- > left front leg throughout a full gait cycle. There will be more than two legs in the support phase because there is overlap in each leg’s movement. The initial motion state may differ from the shot scene, but it will eventually be in a stable state. With the exception of the swing phase, which accounts for a variable duty cycle throughout the gait cycle, the dog’s gait sequence is essentially in the same order as the first two. In most cases, only two legs are in the support phase or swing phase, and both legs belong to the same side.
The gait sequence of buffalo, horse, and dog is shown in Table 6.
Table 6 depicts that the gait sequence of buffalo, horse, and dog can be accurately extracted by the method proposed in this paper.

3.2.4. Gait Duty Cycle Extraction Experiment

Using the gait phase diagrams of buffalo, horse, and dog obtained in Section 3.2.3, we can plot the corresponding gait cycle curves, respectively, by using Formula (9) in Section 2.3.2. As shown in Figure 18, Figure 19 and Figure 20, where 0 represents the support phase and 1 represents the swing phase, the gait duty cycle data of each animal can be calculated by calculating the time occupied by the swing phase in a gait cycle.
We can calculate the gait duty cycle parameters for the buffalo, horse, and dog by using Formula (10) and Figure 18, Figure 19 and Figure 20, and the results are shown in Table 7.
According to the above table, the greatest inaccuracy of the suggested technique is 4.3% when compared to the manual calculation method, demonstrating that it is capable of reliably calculating the quadrupeds’ duty cycle parameters. It is clear that dogs have a relatively modest gait duty cycle in comparison to huge quadrupeds such as the buffalo and horse.

3.2.5. Gait Trajectory Extraction Experiment

In a complete gait cycle, the foot trajectory of the fore and hind limbs of the image sequence of buffalo, horse, and dog is calculated, and the experimental findings are depicted in Figure 21, Figure 22 and Figure 23. Comparing the foot trajectory of the forelimbs and hindlimbs of the buffalo and the horse, respectively, it can be seen that the trajectory of quadrupeds is not a complete polynomial curve during the movement process, but a downward movement occurs after reaching the highest point of its trajectory, so its trajectory has a “concave” segment, and there is a certain difference in the movement of the forelimbs and hindlimbs, that is, for the forelimbs, the phase difference between the support phase and the swing phase is 180 degrees in most cycles. In other words, when one limb is in the support phase, the other is in the swing phase and moves repeatedly in opposition. For the limbs on the same side, there is also a 180-degree difference between them. Therefore, it can be deduced that, for a complete gait cycle, the movement of the two limbs on the neighboring diagonals can be considered substantially synchronized, but not entirely synchronous. At some point, three legs are in the support phase, while the last leg is in the swing phase, allowing the animal to retain movement stability at moderate speeds. Both the buffalo and the horse move in essentially the same ways, promoting the body’s forward motion during the support phase and having a fairly identical swinging order. In conclusion, multiple limb joints in the movement process of quadrupeds coordinate and create smooth movement by varying their movement phase.

4. Conclusions and Discussion

A method for quadruped animal pose estimation and gait parameter extraction was presented in this paper. Target screening, animal pose estimation model, and animal gait parameter extraction are its three main components, which together form a vision-based computational framework that can fully and successfully address the issues of quadruped animal pose estimation and gait parameter extraction. The fundamental idea can be broken down into the following steps.
(1)
We converted the original video data to images and transmitted them to the network for object detection to obtain the location anchor box of the animal in the image.
(2)
The position anchor frame obtained in the first stage was used to crop the image and feed it into the RFB-HRNet network to obtain quadruped animal keypoints in original resolution space.
(3)
Various quadruped animal gait characteristics were obtained through computational research.
The test results using the public dataset AP10K showed that, in comparison to the original HRNet-w48 network and other methods, our method yielded the best results for the keypoint extraction of quadruped animal poses. The mAP was 2.10% more than the original HRNet-w48, while the AR increased by 1.9%. As for gait parameter extraction, three typical quadruped animals representing different body sizes, buffalo, horse, and dog, were tested experimentally, and the results demonstrated that the gait parameters, including gait frequency, gait sequence, and duty cycle, and foot trajectory could be automatically extracted, and the real-time and accurate gait trajectory could be obtained. The greatest error of gait frequency was 2.46%, the maximum error of duty cycle was 4.33%, and the detection of the gait sequence was accurate.
Based on the research work of this paper, the following conclusions were drawn.
(1)
The feature extraction capability of the network model as a whole could be significantly improved by using a special receptive field module DyC-RFB to improve the feature extraction capability of the first branch of stage 1 of the HRNet network and by using the transfer effect of each branch in the later stage. Even if there was only a small improvement, it was still possible to improve the performance of quadrupeds in terms of keypoint extraction without significantly increasing the network parameters or the computation.
(2)
A two-stage cascade network was created by adding an object detection network to the front end of the animal pose estimation model for target screening. This network could significantly improve the animal pose estimation effect of some small targets and multitargets, as well as the stability and reliability of pose estimation.
However, some deficiencies still need to be improved in the subsequent work. The three-dimensional gait data of quadrupeds cannot currently be calculated since the detection of animal joints still relies on two-dimensional plane estimation and the absence of depth data. Therefore, its potential will be investigated and improved upon in the future.

Author Contributions

Data curation, Z.G. and D.L.; investigation, Z.G., D.L., and Y.Z.; methodology, Z.G. and T.W.; software, Z.G.; visualization, Z.G. and Y.Z.; validation, Z.G.; writing—original draft preparation, Z.G. and T.W.; writing—review, Y.Z. and Z.G. All authors have read and agreed to the published version of the manuscript.

Funding

This research was funded by the National Natural Science Foundation of China (No. 51365019).

Institutional Review Board Statement

Ethical review and approval were waived for this study. For the following reasons. The research performed a non-invasive, quadruped animals gait extraction study based on computer vision. All of the data we use is from publicly available dataset and video taken in zoos, without contact with any animals. The study will not cause any harm to animals. According to the type of procedure used, no formal ethical approval was required.

Informed Consent Statement

Not applicable.

Data Availability Statement

The dataset (AP10K) used in this paper is publicly available and can be downloaded from AlexTheBad/AP-10K: NeurIPS 2021 Datasets and Benchmarks Track (github.com, accessed on 11 November 2022).

Acknowledgments

The authors greatly acknowledge the financial support by the National Natural Science Foundation of China. We thank Y.Z. for inspiring this paper in the methodology of the paper, and T.W. and D.L. for their contributions in software and data processing. Finally, thanks to the editors for their hard work.

Conflicts of Interest

The authors declare no conflict of interest.

References

  1. Toshev, A.; Szegedy, C. Deeppose: Human pose estimation via deep neural networks. In Proceedings of the IEEE Conference on Computer Vision and Pattern Recognition, Columbus, OH, USA, 23–28 June 2014; pp. 1653–1660. [Google Scholar]
  2. Fan, X.; Zheng, K.; Lin, Y.; Song, W. Combining local appearance and holistic view: Dual-source deep neural networks for human pose estimation. In Proceedings of the IEEE Conference on Computer Vision and Pattern Recognition, Boston, MA, USA, 7–12 June 2015; pp. 1347–1355. [Google Scholar]
  3. Pfister, T.; Charles, J.; Zisserman, A. Flowing convnets for human pose estimation in videos. In Proceedings of the IEEE International Conference on Computer Vision, Santiago, Chile, 7–13 December 2015; pp. 1913–1921. [Google Scholar]
  4. Li, C.; Lee, G.H. From synthetic to real: Unsupervised domain adaptation for animal pose estimation. In Proceedings of the IEEE/CVF Conference on Computer Vision and Pattern Recognition, Nashville, TN, USA, 20–25 June 2021; pp. 1482–1491. [Google Scholar]
  5. Newell, A.; Yang, K.; Deng, J. Stacked hourglass networks for human pose estimation. In Proceedings of the European Conference on Computer Vision, Amsterdam, The Netherlands, 11–14 October 2016; Springer: Berlin, Germany, 2016; pp. 483–499. [Google Scholar]
  6. Mu, J.; Qiu, W.; Hager, G.D.; Yuille, A.L. Learning from synthetic animals. In Proceedings of the IEEE/CVF Conference on Computer Vision and Pattern Recognition, Seattle, WA, USA, 13–19 June 2020; pp. 12386–12395. [Google Scholar]
  7. Yuan, Y.; Fu, R.; Huang, L.; Lin, W.; Zhang, C.; Chen, X.; Wang, J. Hrformer: High-resolution vision transformer for dense predict. Adv. Neural Inf. Process. Syst. 2021, 34, 7281–7293. [Google Scholar]
  8. Cao, J.; Tang, H.; Fang, H.S.; Shen, X.; Lu, C.; Tai, Y.W. Cross-domain adaptation for animal pose estimation. In Proceedings of the IEEE/CVF International Conference on Computer Vision, Seoul, Korea, 27 October–2 November 2019; pp. 9498–9507. [Google Scholar]
  9. Zhou, X.; Wang, D.; Krähenbühl, P. Objects as points. arXiv 2019, arXiv:1904.07850. [Google Scholar]
  10. Geng, Z.; Sun, K.; Xiao, B.; Zhang, Z.; Wang, J. Bottom-up human pose estimation via disentangled keypoint regression. In Proceedings of the IEEE/CVF Conference on Computer Vision and Pattern Recognition, Nashville, TN, USA, 20–25 June 2021; pp. 14676–14686. [Google Scholar]
  11. Zhang, F.; Zhu, X.; Dai, H.; Ye, M.; Zhu, C. Distribution-aware coordinate representation for human pose estimation. In Proceedings of the IEEE/CVF Conference on Computer Vision and Pattern Recognition, Seattle, WA, USA, 13–19 June 2020; pp. 7093–7102. [Google Scholar]
  12. Izonin, I.; Tkachenko, R.; Fedushko, S.; Koziy, D.; Zub, K.; Vovk, O. RBF-Based Input Doubling Method for Small Medical Data Processing. In Proceedings of the International Conference on Artificial Intelligence and Logistics Engineering, Kyiv, Ukraine, 22–24 January 2021; Springer: Berlin, Germany, 2021; Volume 82, pp. 23–31. [Google Scholar]
  13. Daou, H.E.; Libourel, P.A.; Renous, S.; Bels, V.; Guinot, J.C. Methods and experimental protocols to design a simulated bio-mimetic quadruped robot. Int. J. Adv. Robot. Syst. 2013, 10, 256. [Google Scholar] [CrossRef]
  14. Yang, A.; Huang, H.; Zhu, X.; Yang, X.; Chen, P.; Li, S.; Xue, Y. Automatic recognition of sow nursing behaviour using deep learning-based segmentation and spatial and temporal features. Biosyst. Eng. 2018, 175, 133–145. [Google Scholar] [CrossRef]
  15. Dissanayake, G. Infrastructure robotics: Opportunities and challenges. Assistive robotics. In Proceedings of the 18th International Conference on CLAWAR 2015, Hangzhou, China, 6–9 September 2015; p. 3. [Google Scholar]
  16. Peng, X.B.; Coumans, E.; Zhang, T.; Lee, T.W.; Tan, J.; Levine, S. Learning agile robotic locomotion skills by imitating animals. arXiv 2020, arXiv:2004.00784. [Google Scholar]
  17. Kim, C.H.; Shin, H.C.; Lee, H.H. Trotting gait analysis of a lizard using motion capture. In Proceedings of the 2013 13th International Conference on Control, Automation and Systems (ICCAS 2013), Gwangju, Korea, 20–23 October 2013; pp. 1247–1251. [Google Scholar]
  18. Chapinal, N.; de Passille, A.M.; Pastell, M.; Hänninen, L.; Munksgaard, L.; Rushen, J. Measurement of acceleration while walking as an automated method for gait assessment in dairy cattle. J. Dairy Sci. 2011, 94, 2895–2901. [Google Scholar] [CrossRef] [PubMed] [Green Version]
  19. He, K.; Zhang, X.; Ren, S.; Sun, J. Deep residual learning for image recognition. In Proceedings of the IEEE Conference on Computer Vision and Pattern Recognition, Las Vegas, NV, USA, 27–30 June 2016; pp. 770–778. [Google Scholar]
  20. Simonyan, K.; Zisserman, A. Very deep convolutional networks for large-scale image recognition. arXiv 2014, arXiv:1409.1556. [Google Scholar]
  21. Howard, A.G.; Zhu, M.; Chen, B.; Kalenichenko, D.; Wang, W.; Weyand, T.; Andreetto, M.; Adam, H. Mobilenets: Efficient convolutional neural networks for mobile vision applications. arXiv 2017, arXiv:1704.04861. [Google Scholar]
  22. Sun, K.; Xiao, B.; Liu, D.; Wang, J. Deep high-resolution representation learning for human pose estimation. In Proceedings of the IEEE/CVF Conference on Computer Vision and Pattern Recognition, Long Beach, CA, USA, 15–20 June 2019; pp. 5693–5703. [Google Scholar]
  23. Liu, W.; Anguelov, D.; Erhan, D.; Szegedy, C.; Reed, S.; Fu, C.Y.; Berg, A.C. Ssd: Single shot multibox detector. In Proceedings of the European Conference on Computer Vision, Amsterdam, The Netherlands, 11–14 October 2016; Springer: Berlin, Germany, 2016; pp. 21–37. [Google Scholar]
  24. Szegedy, C.; Vanhoucke, V.; Ioffe, S.; Shlens, J.; Wojna, Z. Rethinking the inception architecture for computer vision. In Proceedings of the IEEE Conference on Computer Vision and Pattern Recognition, Las Vegas, NV, USA, 27–30 June 2016; pp. 2818–2826. [Google Scholar]
  25. Yu, F.; Koltun, V. Multi-scale context aggregation by dilated convolutions. arXiv 2015, arXiv:1511.07122. [Google Scholar]
  26. Chen, Y.; Dai, X.; Liu, M.; Chen, D.; Yuan, L.; Liu, Z. Dynamic convolution: Attention over convolution kernels. In Proceedings of the IEEE/CVF Conference on Computer Vision and Pattern Recognition, Seattle, WA, USA, 13–19 June 2020; pp. 11030–11039. [Google Scholar]
  27. Golubitsky, M.; Stewart, I.; Buono, P.L.; Collins, J.J. Symmetry in locomotor central pattern generators and animal gaits. Nature 1999, 401, 693–695. [Google Scholar] [CrossRef] [PubMed]
  28. Yu, H.; Xu, Y.; Zhang, J.; Zhao, W.; Guan, Z.; Tao, D. AP-10K: A Benchmark for Animal Pose Estimation in the Wild. arXiv 2021, arXiv:2108.12617. [Google Scholar]
  29. Kingma, D.P.; Ba, J. Adam: A method for stochastic optimization. arXiv 2014, arXiv:1412.6980. [Google Scholar]
Figure 1. Quadruped animal pose estimation and animal gait parameter extraction computational framework.
Electronics 11 03702 g001
Figure 2. RFB-HRNet network structure.
Electronics 11 03702 g002
Figure 3. (a) RFB module; (b) DyC-RFB module.
Electronics 11 03702 g003
Figure 4. Dynamic convolution (DyConv) module.
Electronics 11 03702 g004
Figure 5. (a) The swing phase of a quadruped animal; (b) the support phase of a quadruped animal.
Electronics 11 03702 g005
Figure 6. (a) The feet-end displacement curve of a quadruped animal; (b) the first-order differential curve of feet-end displacement.
Electronics 11 03702 g006
Figure 7. Gait phase diagram of each limb’s gait (left front leg, right front leg, left hind leg, and right hind leg).
Electronics 11 03702 g007
Figure 8. A gait phase diagram of one of the limbs of a quadruped animal.
Electronics 11 03702 g008
Figure 9. The keypoints of the quadruped animal.
Electronics 11 03702 g009
Figure 10. Some qualitative results of our method (the odd rows) vs. original HRNet-w48 (the even rows) on AP10K.
Electronics 11 03702 g010
Figure 11. Some qualitative results of our method on the COCO2017 human keypoint task.
Electronics 11 03702 g011
Figure 12. Quadruped animal video capture system in our study.
Electronics 11 03702 g012
Figure 13. (a) Buffalo’s feet displacement curve; (b) first−order differential curve of buffalo’s feet displacement.
Electronics 11 03702 g013
Figure 14. (a) Horse’s feet displacement curve; (b) first−order differential curve of horse’s feet displacement.
Electronics 11 03702 g014
Figure 15. (a) Dog’s feet displacement curve; (b) first−order differential curve of dog’s feet displacement.
Electronics 11 03702 g015
Figure 16. (a) The gait phase diagrams of a buffalo; (b) the gait phase diagrams of a horse; (c) the gait phase diagrams of a dog.
Electronics 11 03702 g016
Figure 17. (a) Buffalo gait sequence; (b) horse gait sequence; (c) dog gait sequence.
Electronics 11 03702 g017aElectronics 11 03702 g017b
Figure 18. (a) Buffalo’s gait cycle curves of LF, RF leg; (b) buffalo’s gait cycle curves of LB, RB leg.
Electronics 11 03702 g018
Figure 19. (a) Horse’s gait cycle of LF, RF leg; (b) horse’s gait cycle of LB, RB leg.
Electronics 11 03702 g019
Figure 20. (a) Dog’s gait cycle of LF, RF leg; (b) dog’s gait cycle of LB, RB leg.
Electronics 11 03702 g020
Figure 21. (a) Foot trajectory of buffalo’s forelimbs; (b) foot trajectory of buffalo’s hindlimbs.
Electronics 11 03702 g021
Figure 22. (a) Foot trajectory of horse’s forelimbs; (b) foot trajectory of horse’s hindlimbs.
Electronics 11 03702 g022
Figure 23. (a) Foot trajectory of dog’s forelimbs; (b) foot trajectory of dog’s hindlimbs.
Electronics 11 03702 g023
Table 1. Definitions of animal keypoints.
KeypointDefinitionKeypointDefinition
1Left Eye10Right Elbow
2Right Eye11Right Front Paw
3Nose12Left Hip
4Neck13Left Knee
5Root of Tail14Left Back Paw
6Left Shoulder15Right Hip
7Left Elbow16Right Knee
8Left Front Paw17Right Back Paw
9Right Shoulder
Table 2. Average precision of keypoints.
KeypointAverage PrecisionKeypointAverage Precision
Left Eye0.810Right Elbow0.701
Right Eye0.799Right Front Paw0.693
Nose0.777Left Hip0.691
Neck0.652Left Knee0.718
Root of Tail0.694Left Back Paw0.685
Left Shoulder0.732Right Hip0.766
Left Elbow0.728Right Knee0.671
Left Front Paw0.704Right Back Paw0.722
Right Shoulder0.728
Table 3. Comparison on the AP10K validation set.
MethodsInput SizeGPLOPs#ParamsmAPAP50AP75APMAPLAR
ResNet50 [19]288 × 3845.39623.508M0.6810.9260.7380.5520.6870.718
ResNet101 [19]288 × 38410.27242.500M0.6830.9210.7510.5450.6900.719
HRNet-W48 [21]288 × 38421.05963.595M0.7290.9360.8020.5770.7360.762
RFB-HRNet288 × 38422.61263.972M0.7500.9580.8180.6210.7530.781
Table 4. Comparison of experimental results under different methods.
HRNetDyConvRFB#ParamsmAP
××63.595 M0.729
×63.915 M0.742
63.972 M0.750
Table 5. Gait frequency of buffalo, horse, and dog.
SpeciesMean Interval Frame (Frames)This Article (Hz)Manual MethodRelative Error/%
Buffalo38.250.7920.8122.46
Horse59.80.5070.4981.81
Dog12.752.3772.3311.97
Table 6. Gait sequence of buffalo, horse, and dog.
SpeciesS1S2S3S4S5Gait Sequence Consistency Judgment Index (Formula (12)
BuffaloLFRBRFLBLF100%
HorseLFRBRFLBLF100%
DogRFLBLFRBRF100%
Table 7. Gait duty cycle of buffalo, horse, and dog.
LimbBuffaloHorseDog
Our MethodManual
Calculation
Our MethodManual
Calculation
Our MethodManual Calculation
LF0.5430.5120.6150.6080.3720.356
RF0.5800.5630.6300.6220.3100.330
LB0.5460.5550.5970.5560.3600.321
RB0.5400.5250.6310.6420.3080.288
Average value0.5520.5390.6180.6070.3380.324
Relative error/%2.411.814.3
Publisher’s Note: MDPI stays neutral with regard to jurisdictional claims in published maps and institutional affiliations.

