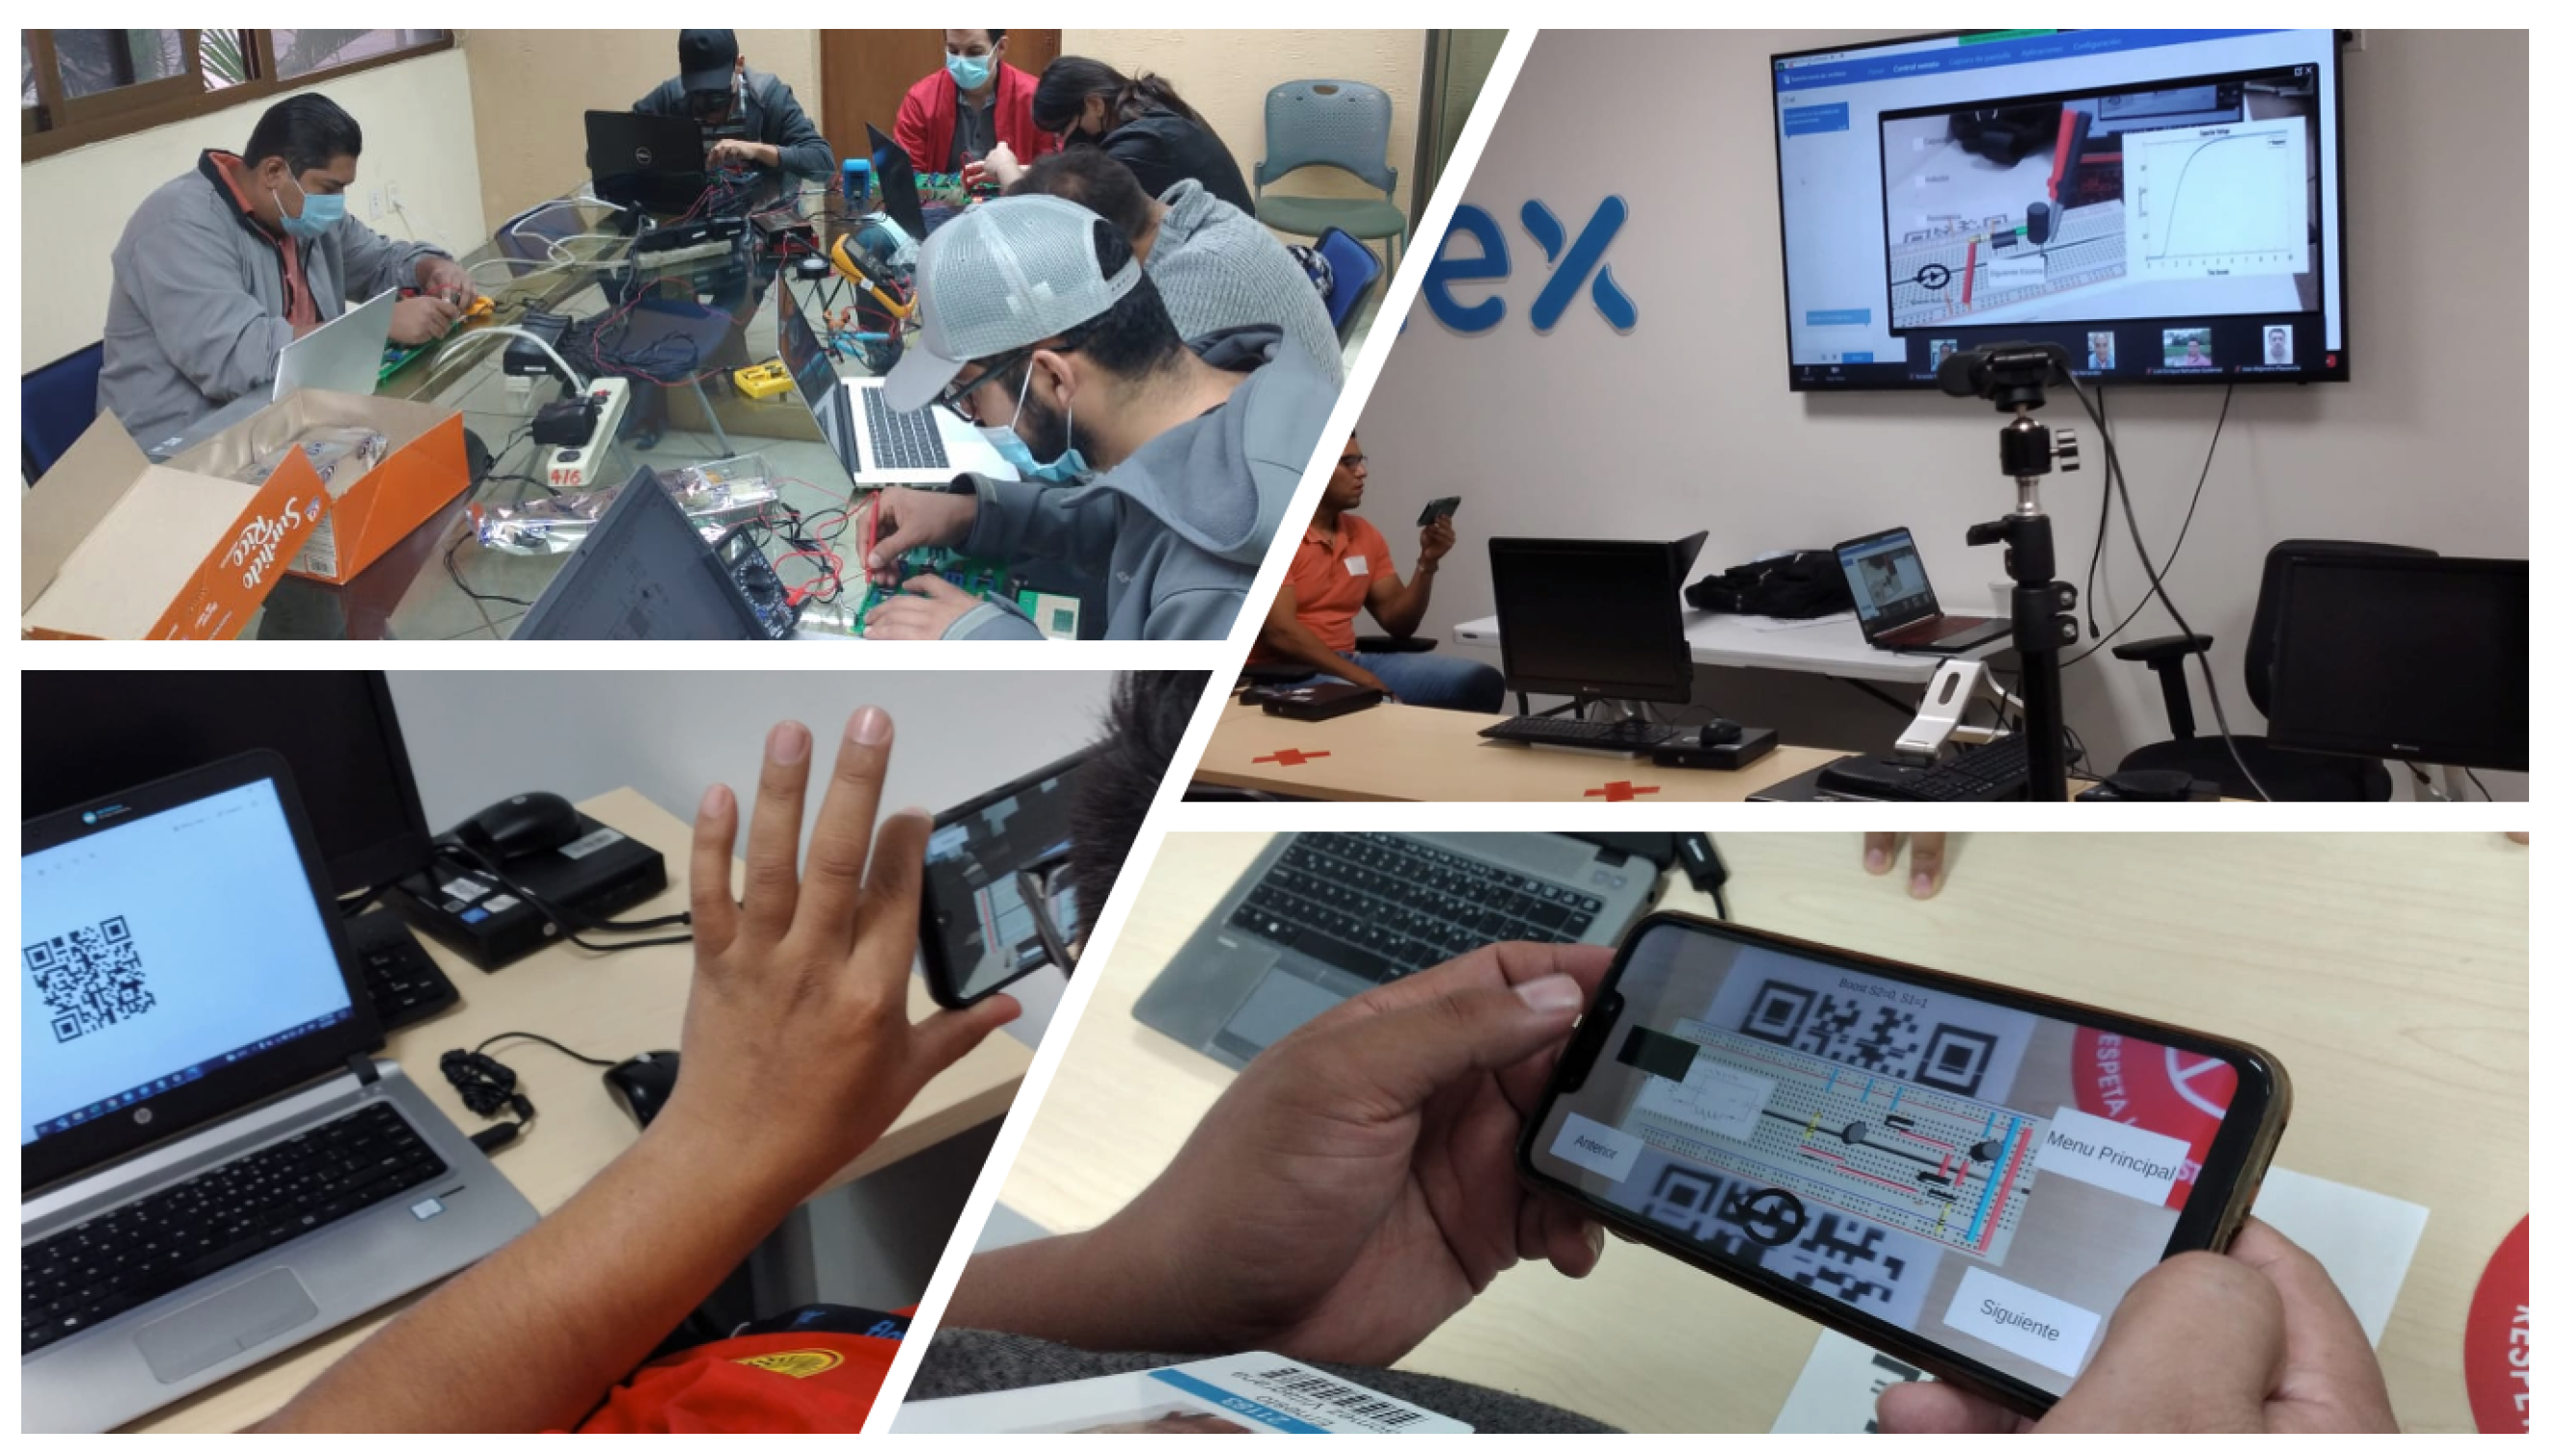
Teaching generally includes classroom and laboratory classes. These sessions include lectures and activities where the student performs application exercises and completes the laboratory activities. The materials provided in the electronics laboratory activities are manuals, including theoretical and practical developments and application examples. The laboratory manager provides the necessary material to carry them out; however, the material is not always enough for all students, so support tools such as the one presented in this article are always of great help. In the case of power electronics, the student must have prior knowledge of electrical circuits and of the analysis, simulation, and implementation of analog circuits. Furthermore, they must know linear algebra, derivation, and numerical integration.
Bloom’s taxonomy has been widely accepted in the educational community indicating the depth of understanding from the knowledge, applications, analysis, synthesis, and evaluation process [
34]. To acquire the depth of understanding, educators are motivated to use different teaching techniques; hands-on experiences significantly promote learning at all levels of science education when appropriately designed and guided by qualified educators [
35]. Practical laboratory experiences are fundamental to the learning process in all areas of study. Research has shown that students who face well-planned strategies in laboratory experiences obtain problem-solving and critical thinking skills. AR tools are quite efficient to help students understand and motivate them in the training process in the laboratory [
36].
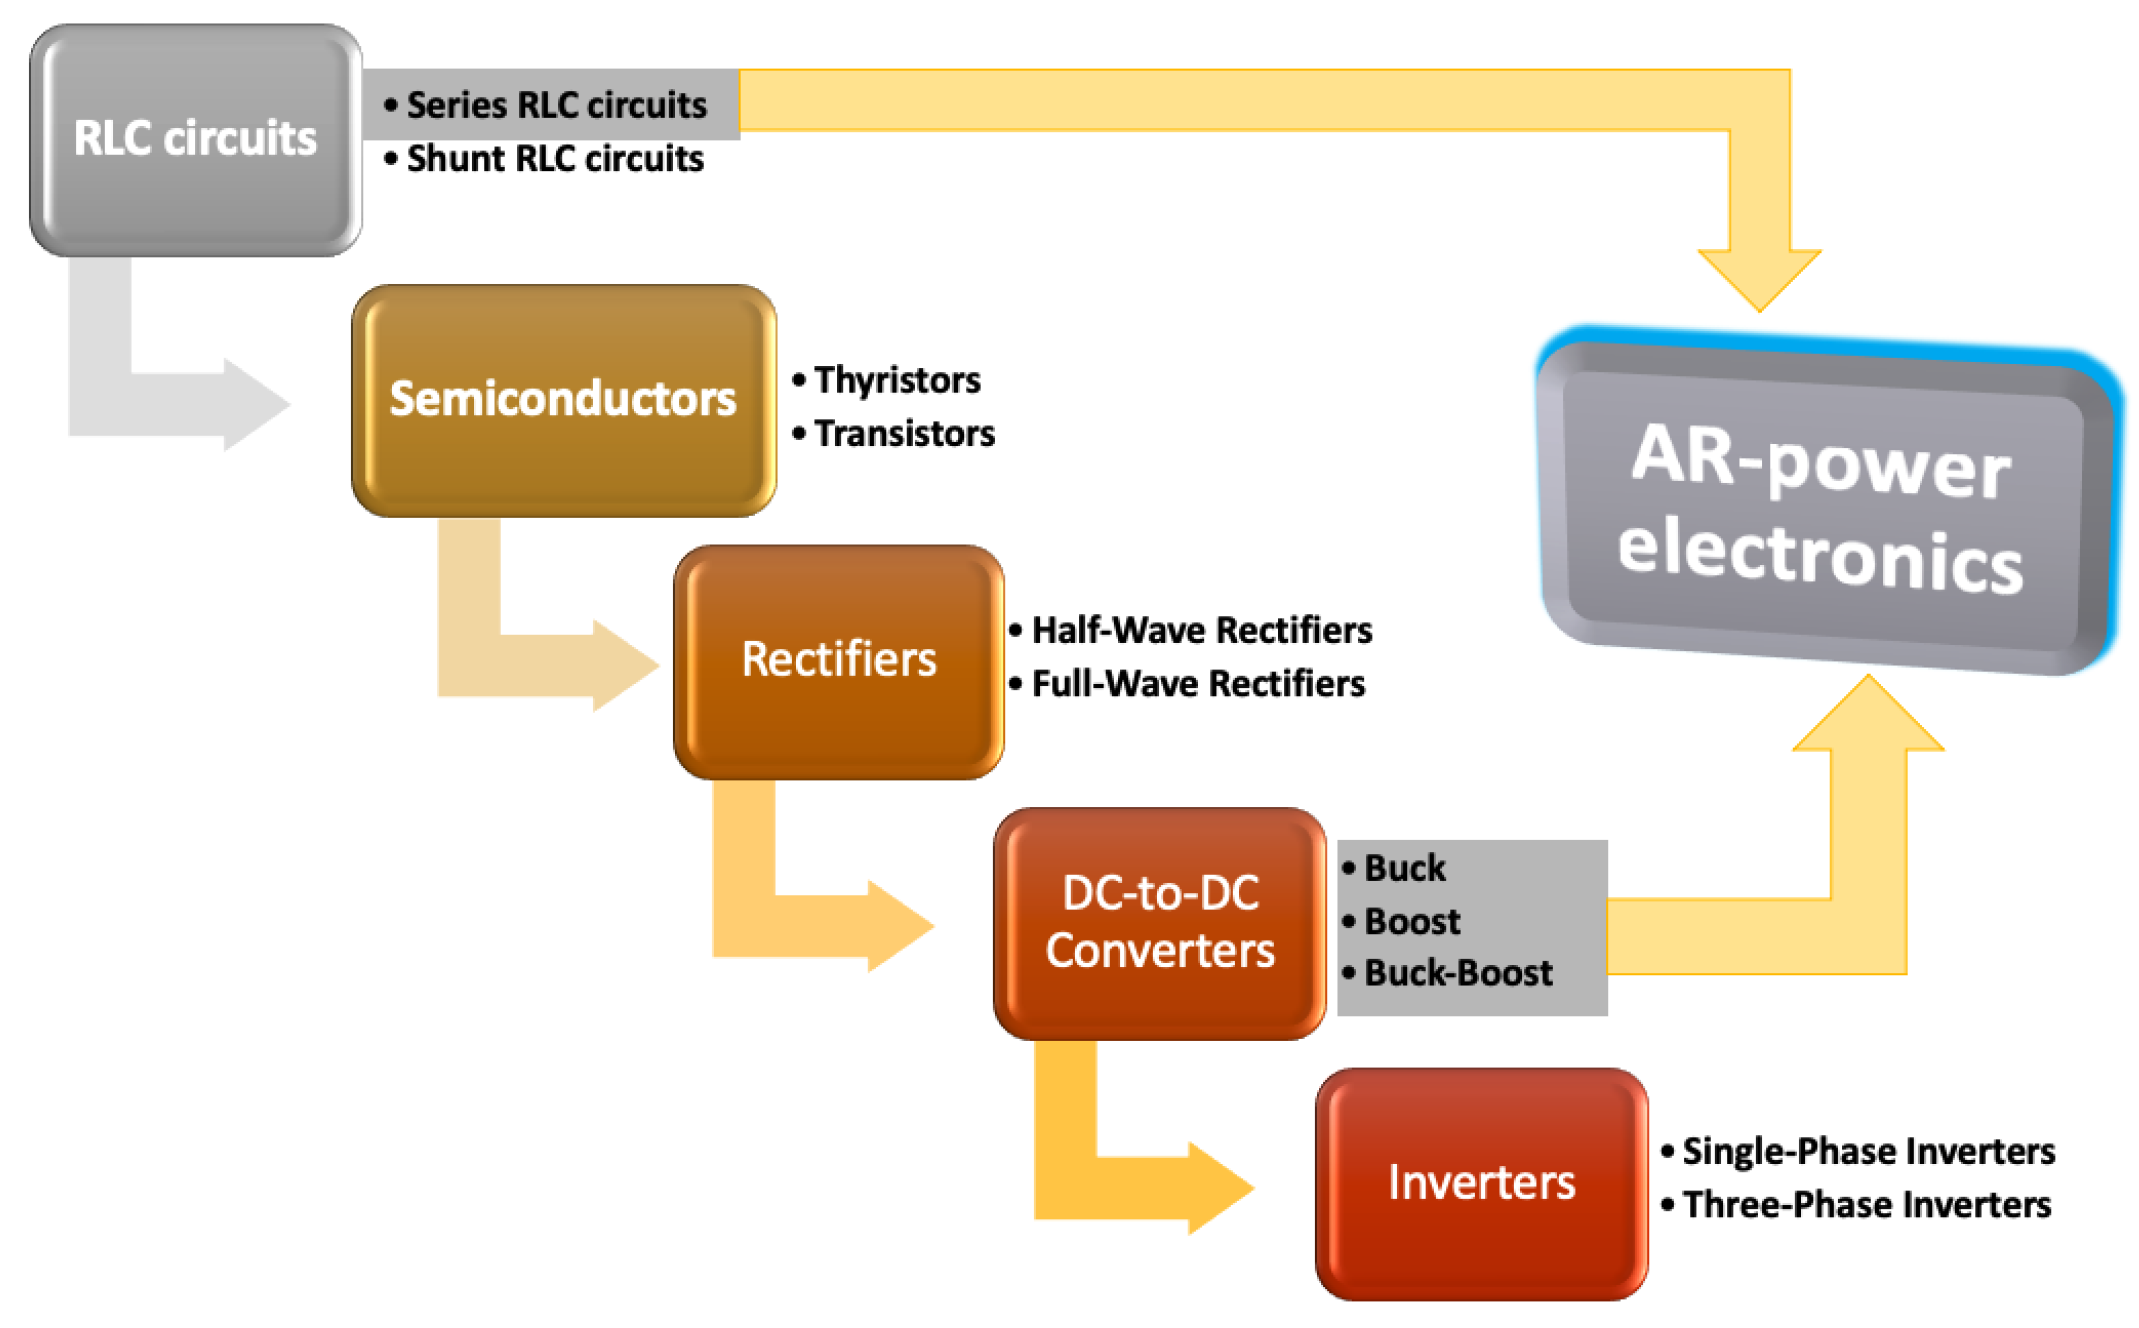
The implemented power electronics course for engineering students is summarized in
Figure 1. The main topics are RLC circuits, semiconductors, rectifiers, DC–DC converters, and inverters. Two main topics were selected to implement the AR tool: one was approached at the beginning of the course, to motivate the students with the new tool, the other AR topic was approached at the end of the course. Therefore, we can have an overview to see the feasibility of designing a complete course with this tool.
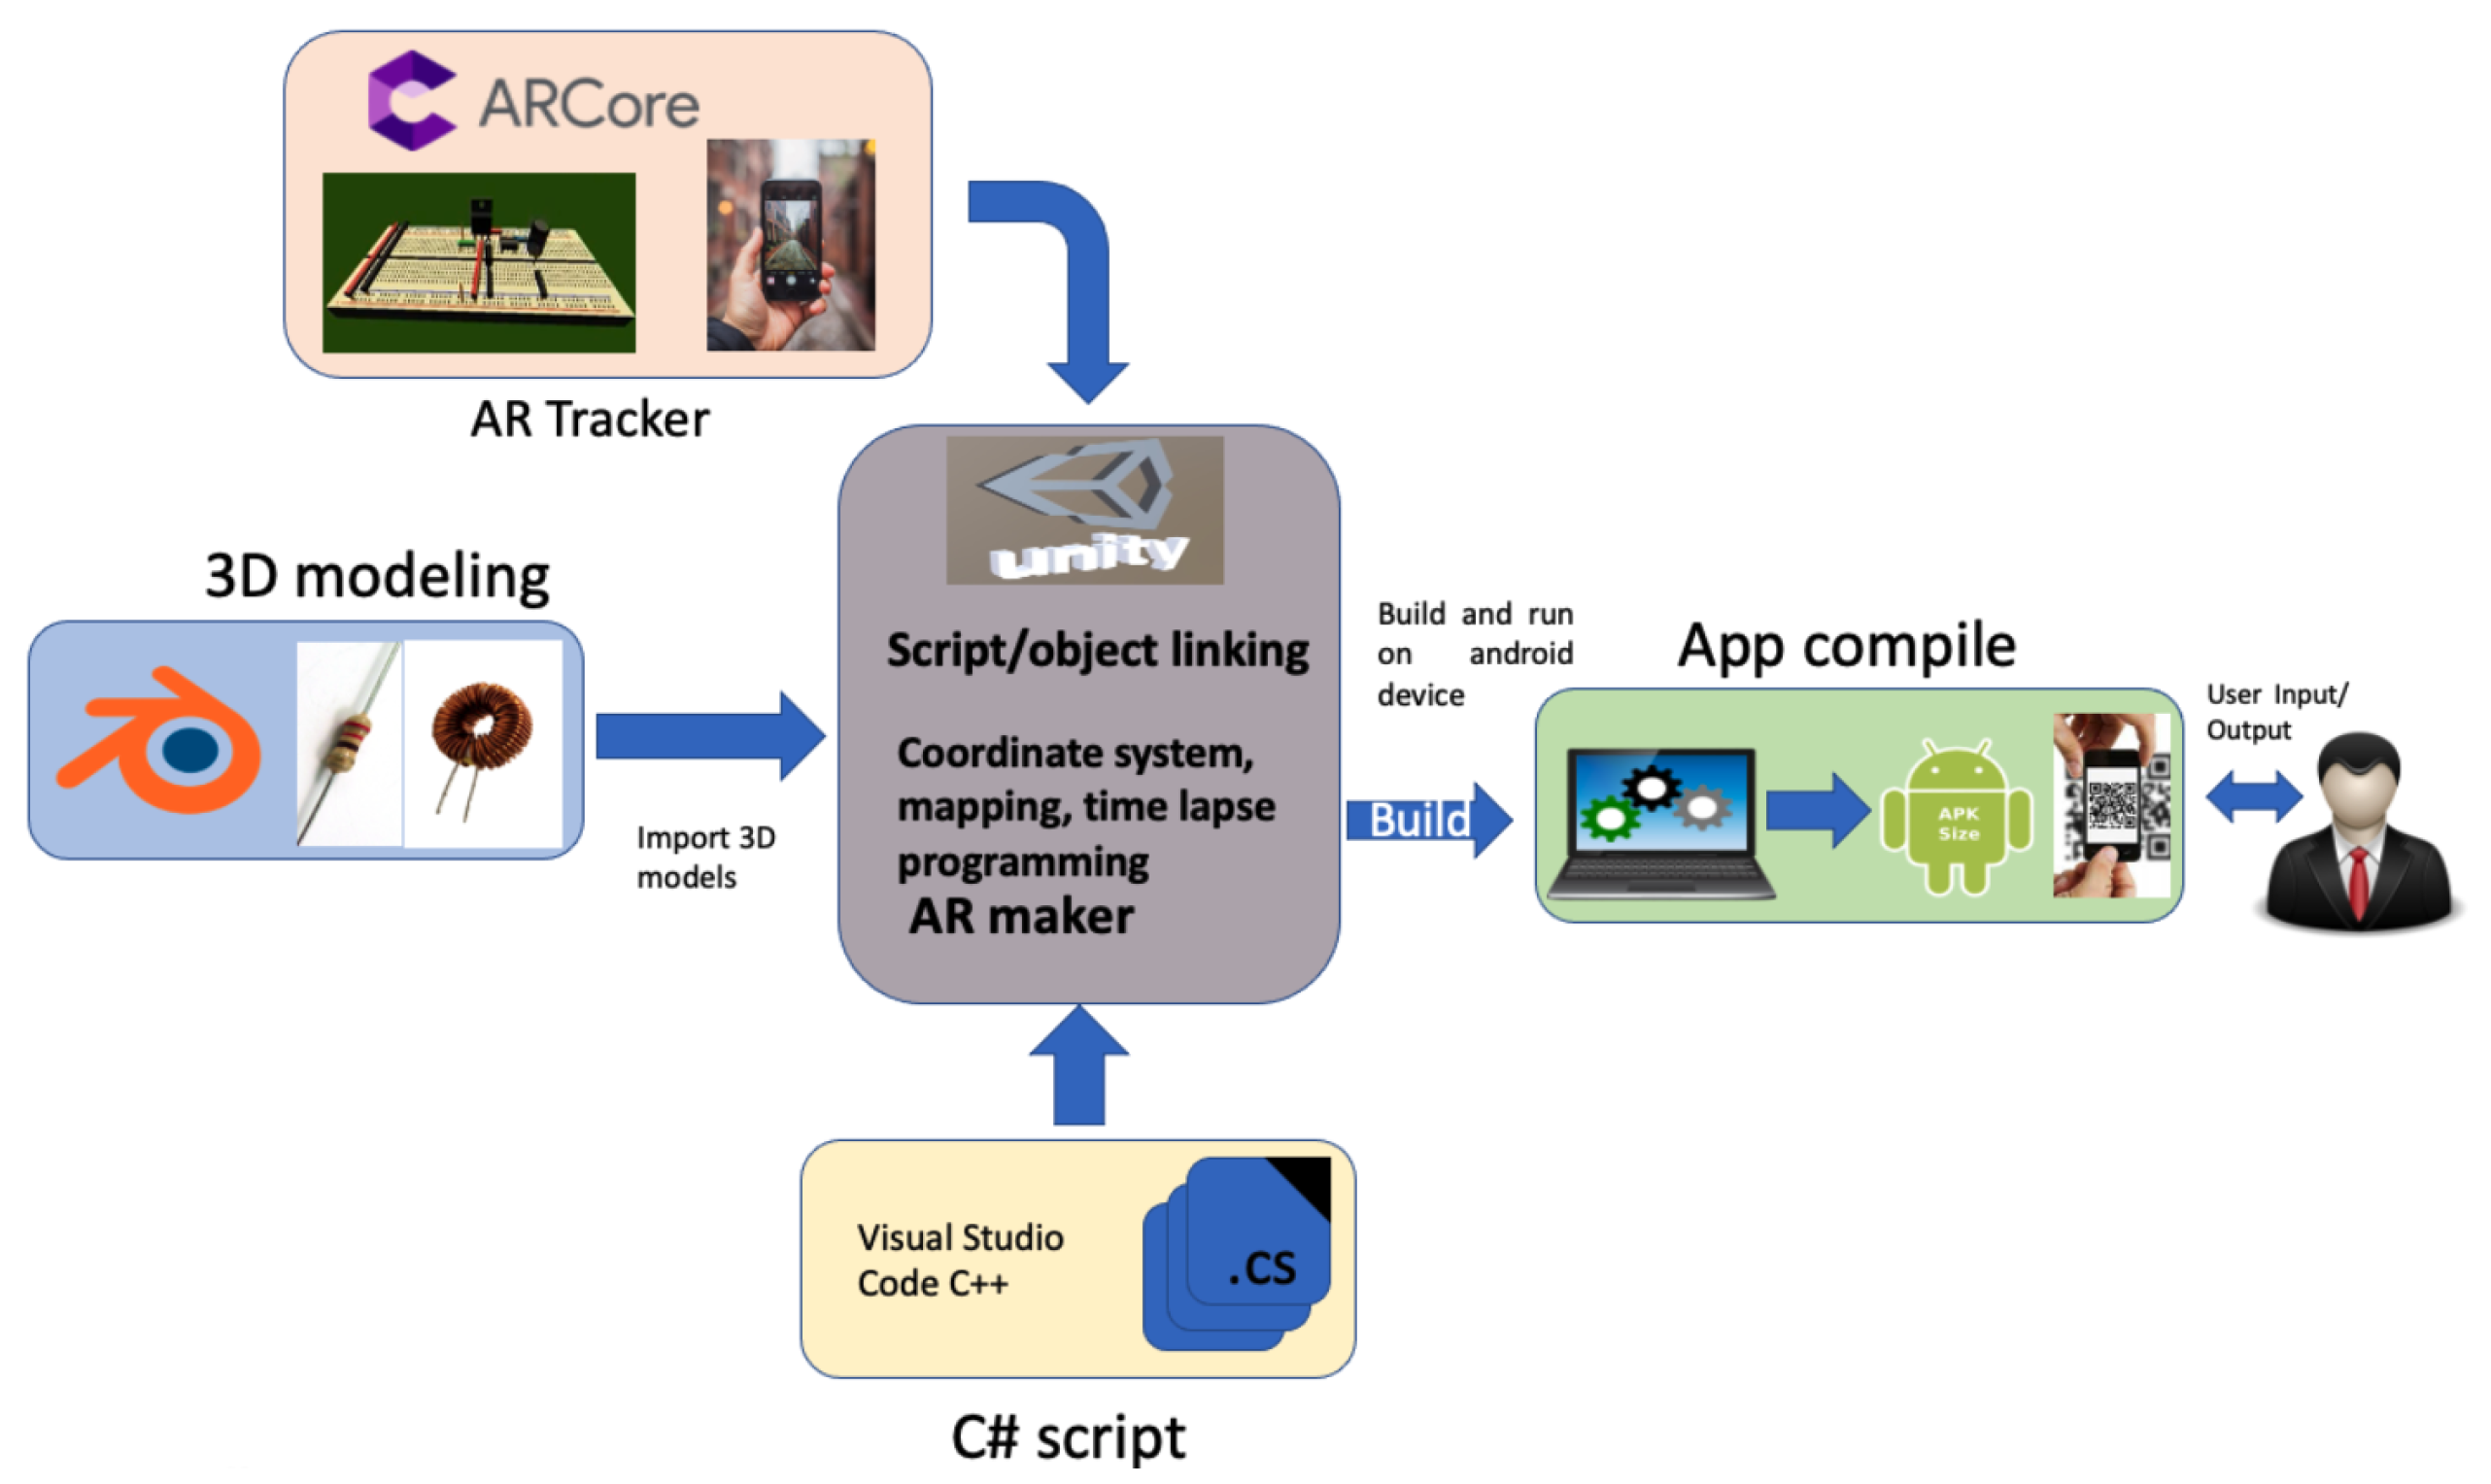
The AR-app design methodology is included in
Figure 2. For its design, the use of Blender [
37] was required for the elaboration of the 3D elements of electronic devices and the export of these designs to UNITY [
38] to elaborate and coordinate the activities in the C# script, together with the time-lapse programming, to build the APK, so that the users can provide the necessary inputs to guide them in the laboratory practices. Even though Vuforia and ARkit have great capabilities for AR applications, ARCore was chosen because it maintains larger maps in terms of monitoring the real-life environment compared to other augmented reality SDKs, such as Vuforia, without neglecting the documentation and existing support, both from Google and the community itself. In addition to the above, ARCore is totally free, and the configuration and integration of ARCore in UNITY is much easier, so that ARCore was used to perform the image tracking and recognition between the real world and augmented reality.
2.1. Description of the Designed and Developed Electronics App
An incremental model was adopted for the project design, in which a requirements analysis was performed for the the design of the models and interfaces; their coding and testing were carried out until the proposed changes were achieved and the functionalities added. For the logical architecture of the application, the functional requirements were considered such as the application for mobile devices, QR code recognition, and interactivity with the user, as well as non-functional requirements such as the usability and acceptable response times. The development tools and libraries used were ARCore [
39] and UNITY. Using different APIs, ARCore allows a cellphone to detect its environment, understand the world, and interact with information programmed in UNITY to create interactive 3D dimensional simulations. ARCore uses three key capabilities to integrate virtual content with the real world as viewed through the phone’s camera, tracking movement, understanding the environment, and light estimation, allowing the detection of the size and location of objects and the lighting conditions of the environment [
39].
To achieve the functionality 3D models developed in Blender, the creation of a 3D scene required at least three key components: models, materials, and lights, along with the editing of objects such as meshes, curves, and surfaces. Once the object has been developed in 3D, it can be exported in FBX format to be used in UNITY 3D. Once exported to UNITY, the developed objects must be assembled using the inspector tab to provide object textures, positions, sizes, and assembly.
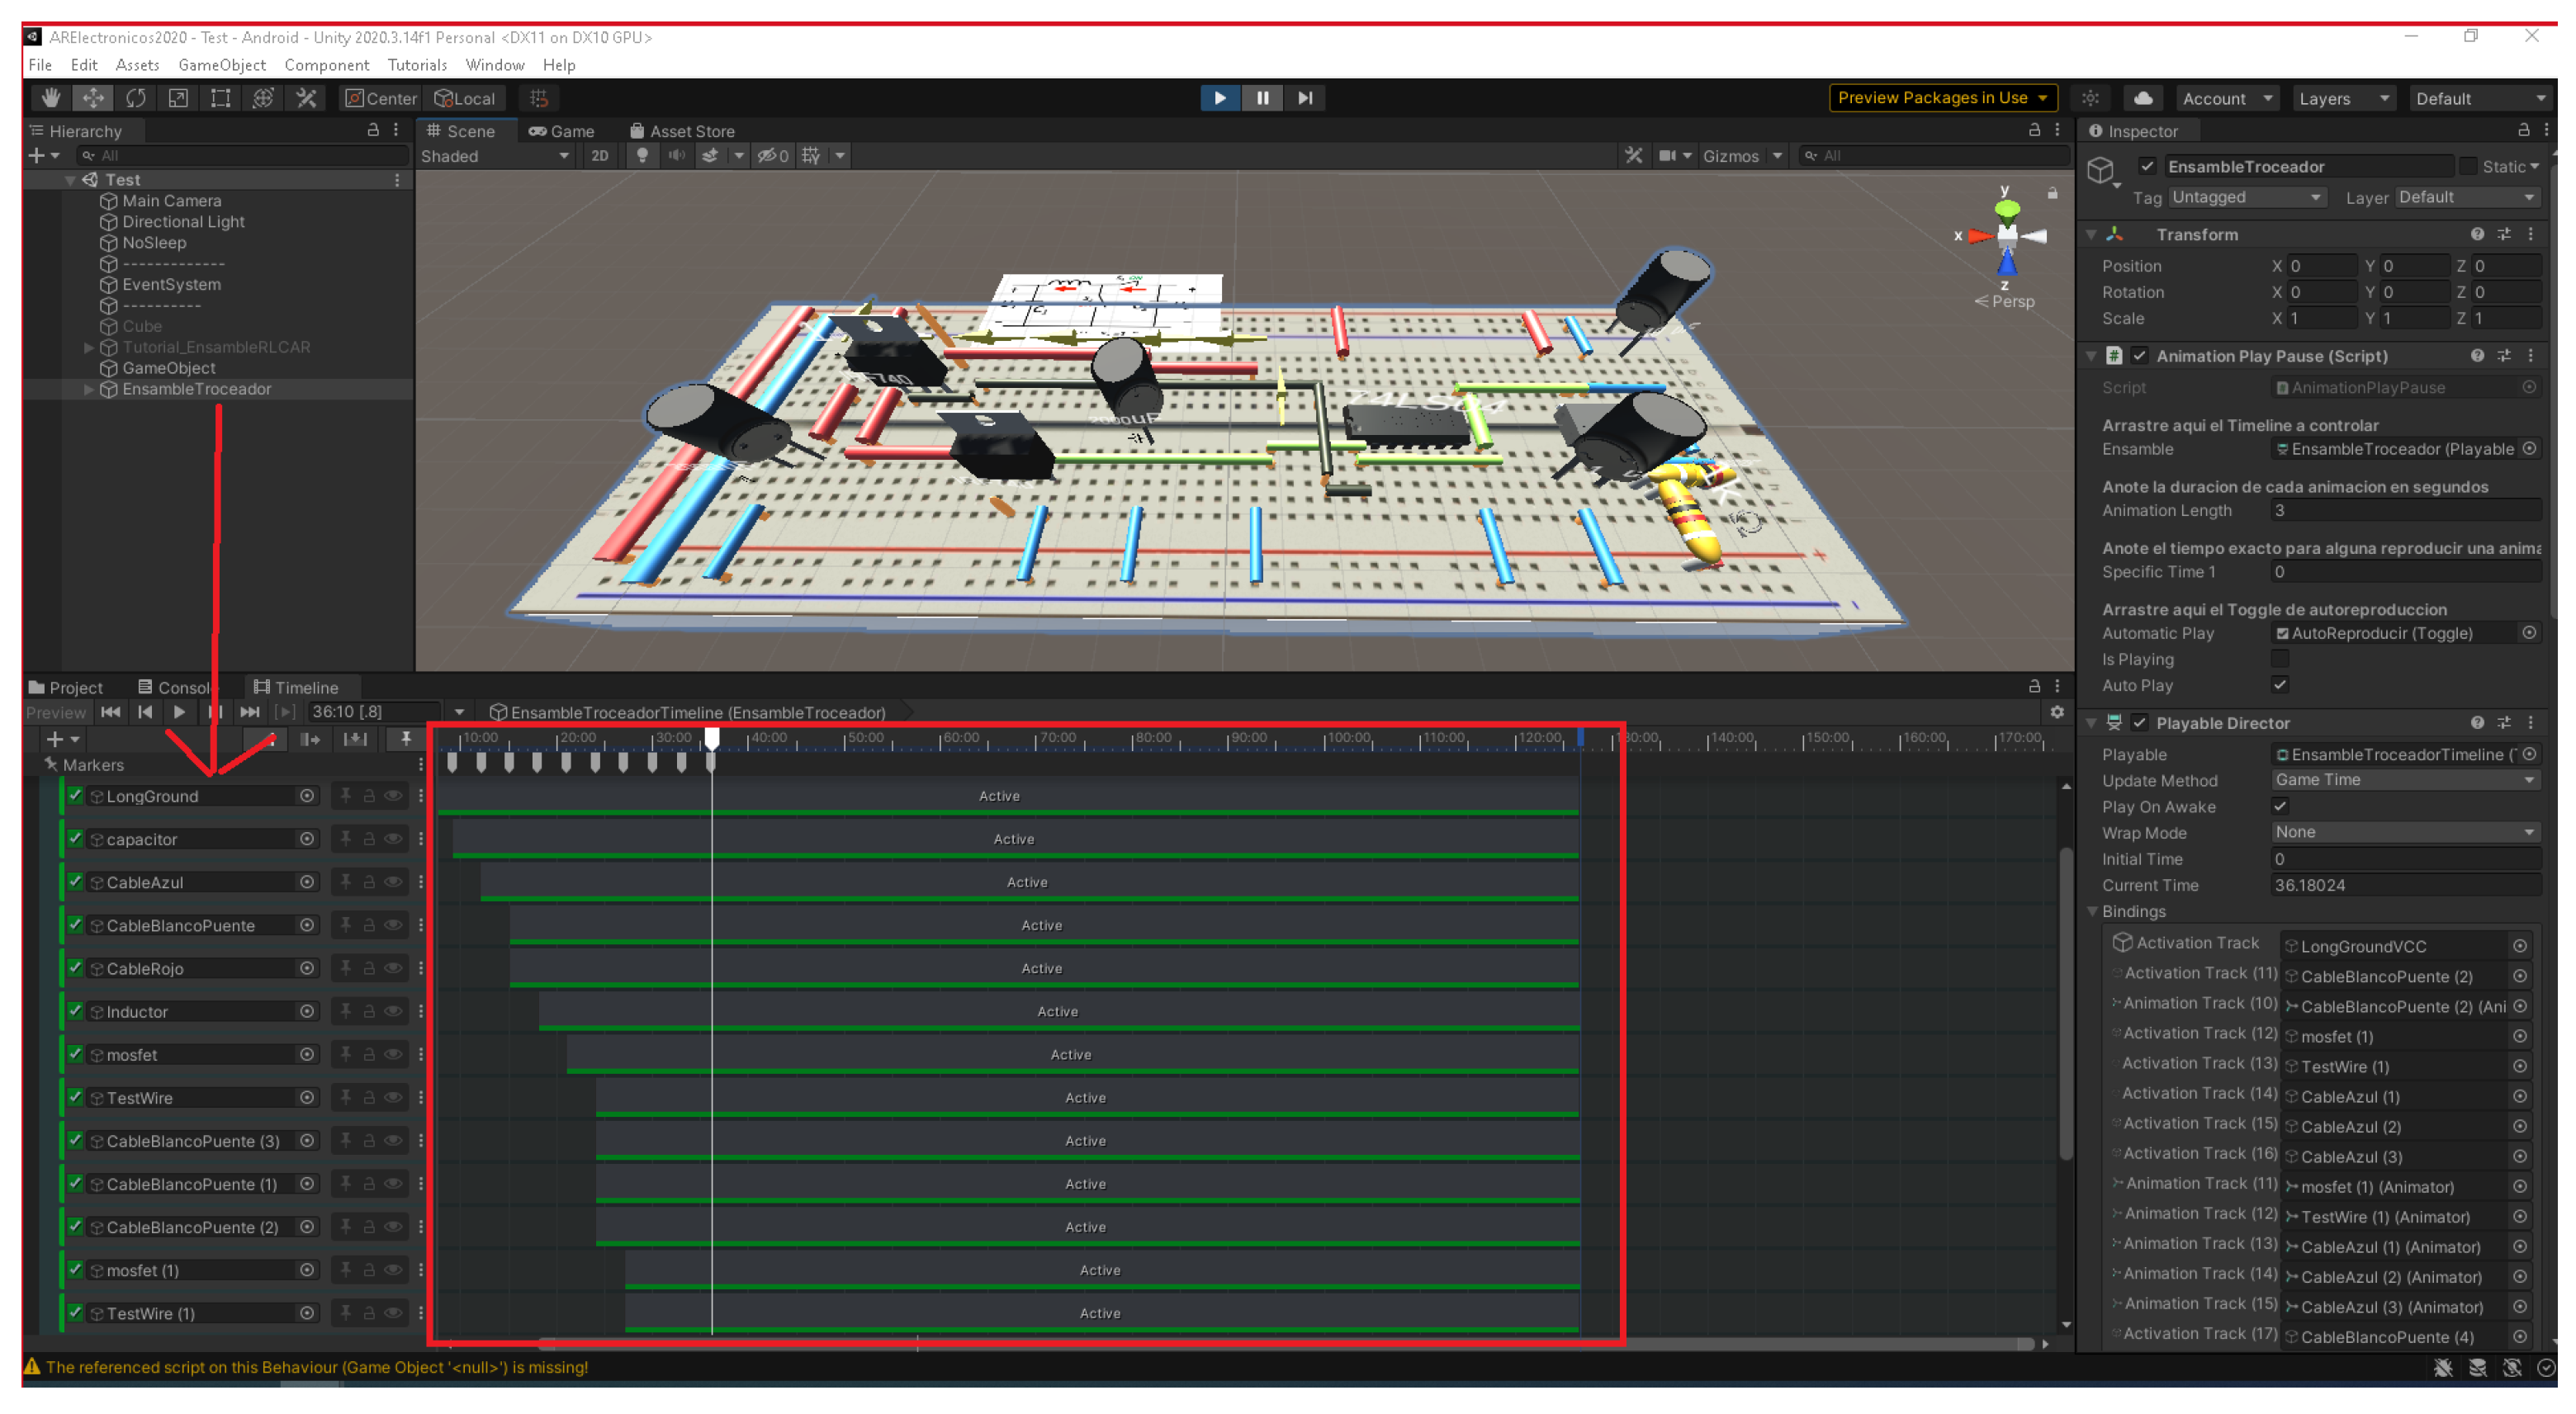
Figure 3 illustrates the design to carry out the interaction between the app and the user. Animations with timelines were created using the UNITY 3D (Timeline) sequencer to activate objects, buttons, sliders, and text in such a way that the users control the monitoring of their assembly process, both in the app and with the real elements in the Laboratory.
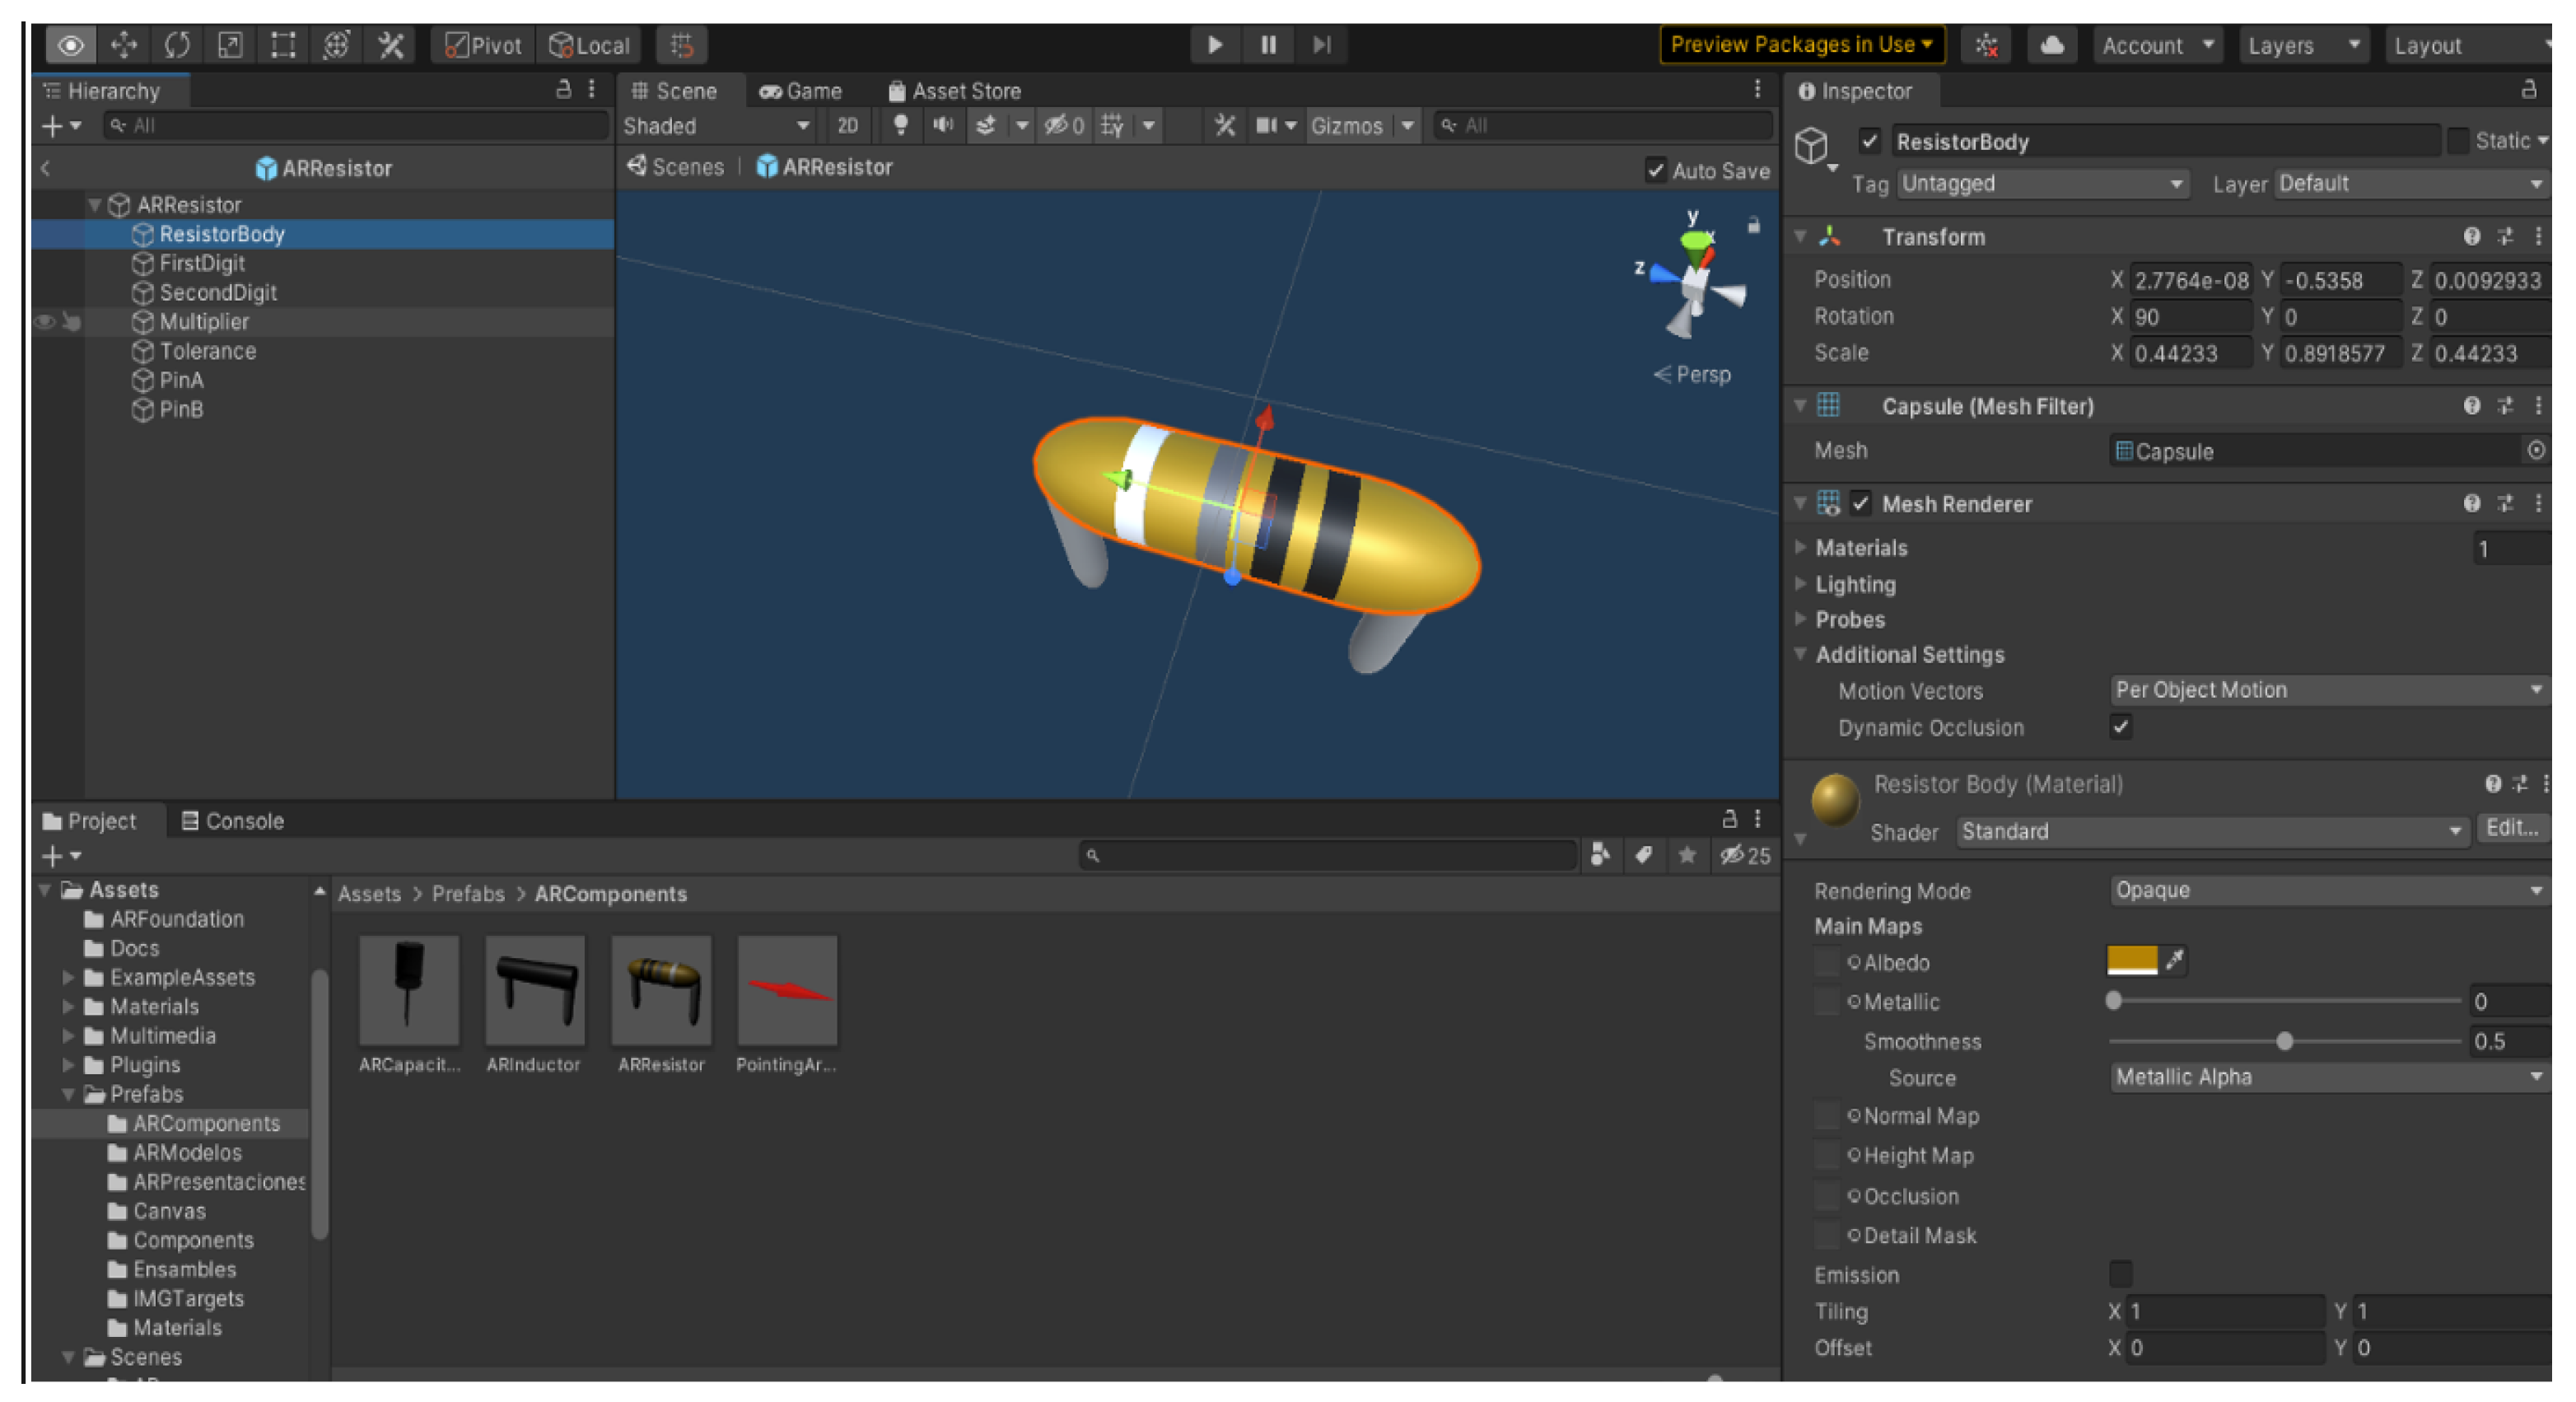
The electronic components were made from “primitive” shapes included in the UNITY 3D engine. In
Figure 4, a parent object called “ARResistor” can be seen, which is an empty GameObject where the elements that make up the resistance are placed as child objects; for example, the GameObject that is selected in the hierarchy in the image is identified by the name “ResistorBody”, e.g., the body of the resistor. The inspector shown in
Figure 4 illustrates that the GameObject has a “Transform” component, which provides information about the position, rotation, and scale of the GameObject, this component having its three parameters manipulated to give the shape and proportion and achieve the appearance that provides the GameObject the resistor’s shape. The “Mesh Filter” and “ResistorBody” components were placed to provide the typical characteristics of resistors. Similarly, the inductor, connection cables, and capacitors were created in this way.
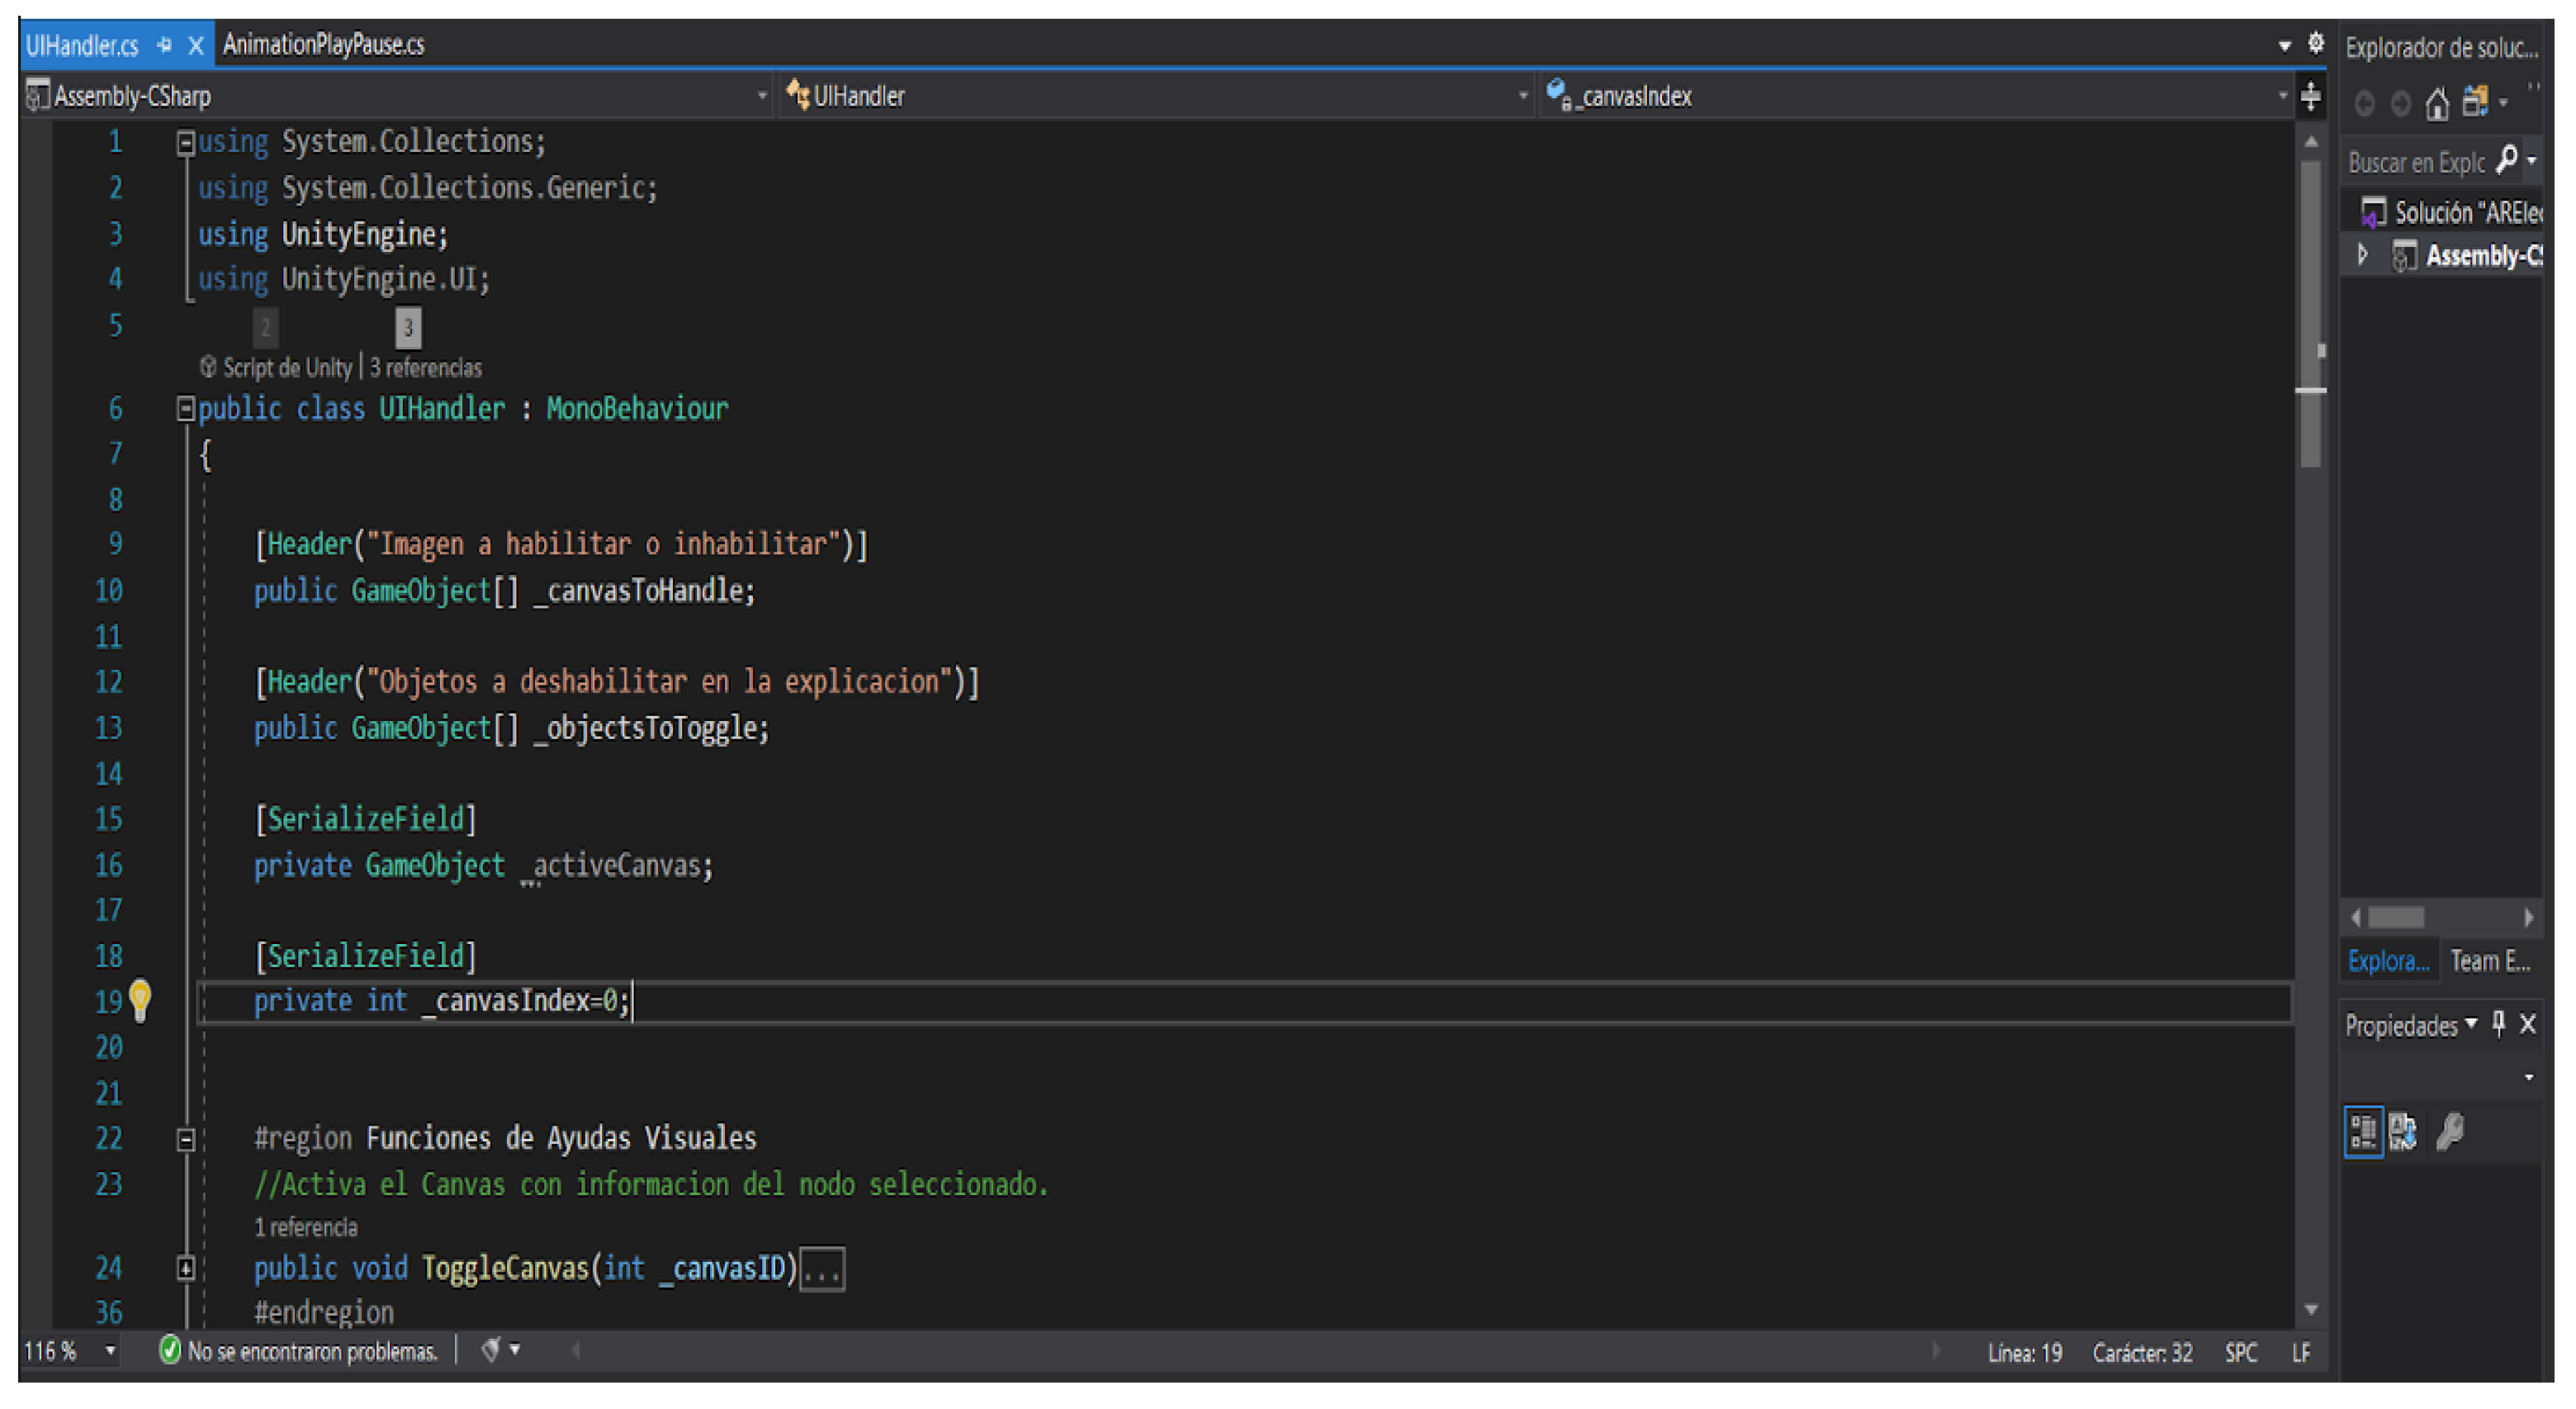
To control the scenes, some scripts were designed. For instance, “AssembleTroceador” in this case is the “Parent” object of a group of 3D models under its hierarchy. It contains the “AnimationPlayPause” script that is responsible for pausing, rewinding, and resuming the playback of the main timeline of the animation in each scene. Immediately under the hierarchy, known as the child object, a script named “UIHandler” is programmed (
Figure 5) in which the buttons “Previous” and “Next” of the canvas with the name “AnimationControl” are added. This script is in charge of activating and disabling on-screen images, as well as interactive on-screen menu-triggered events.
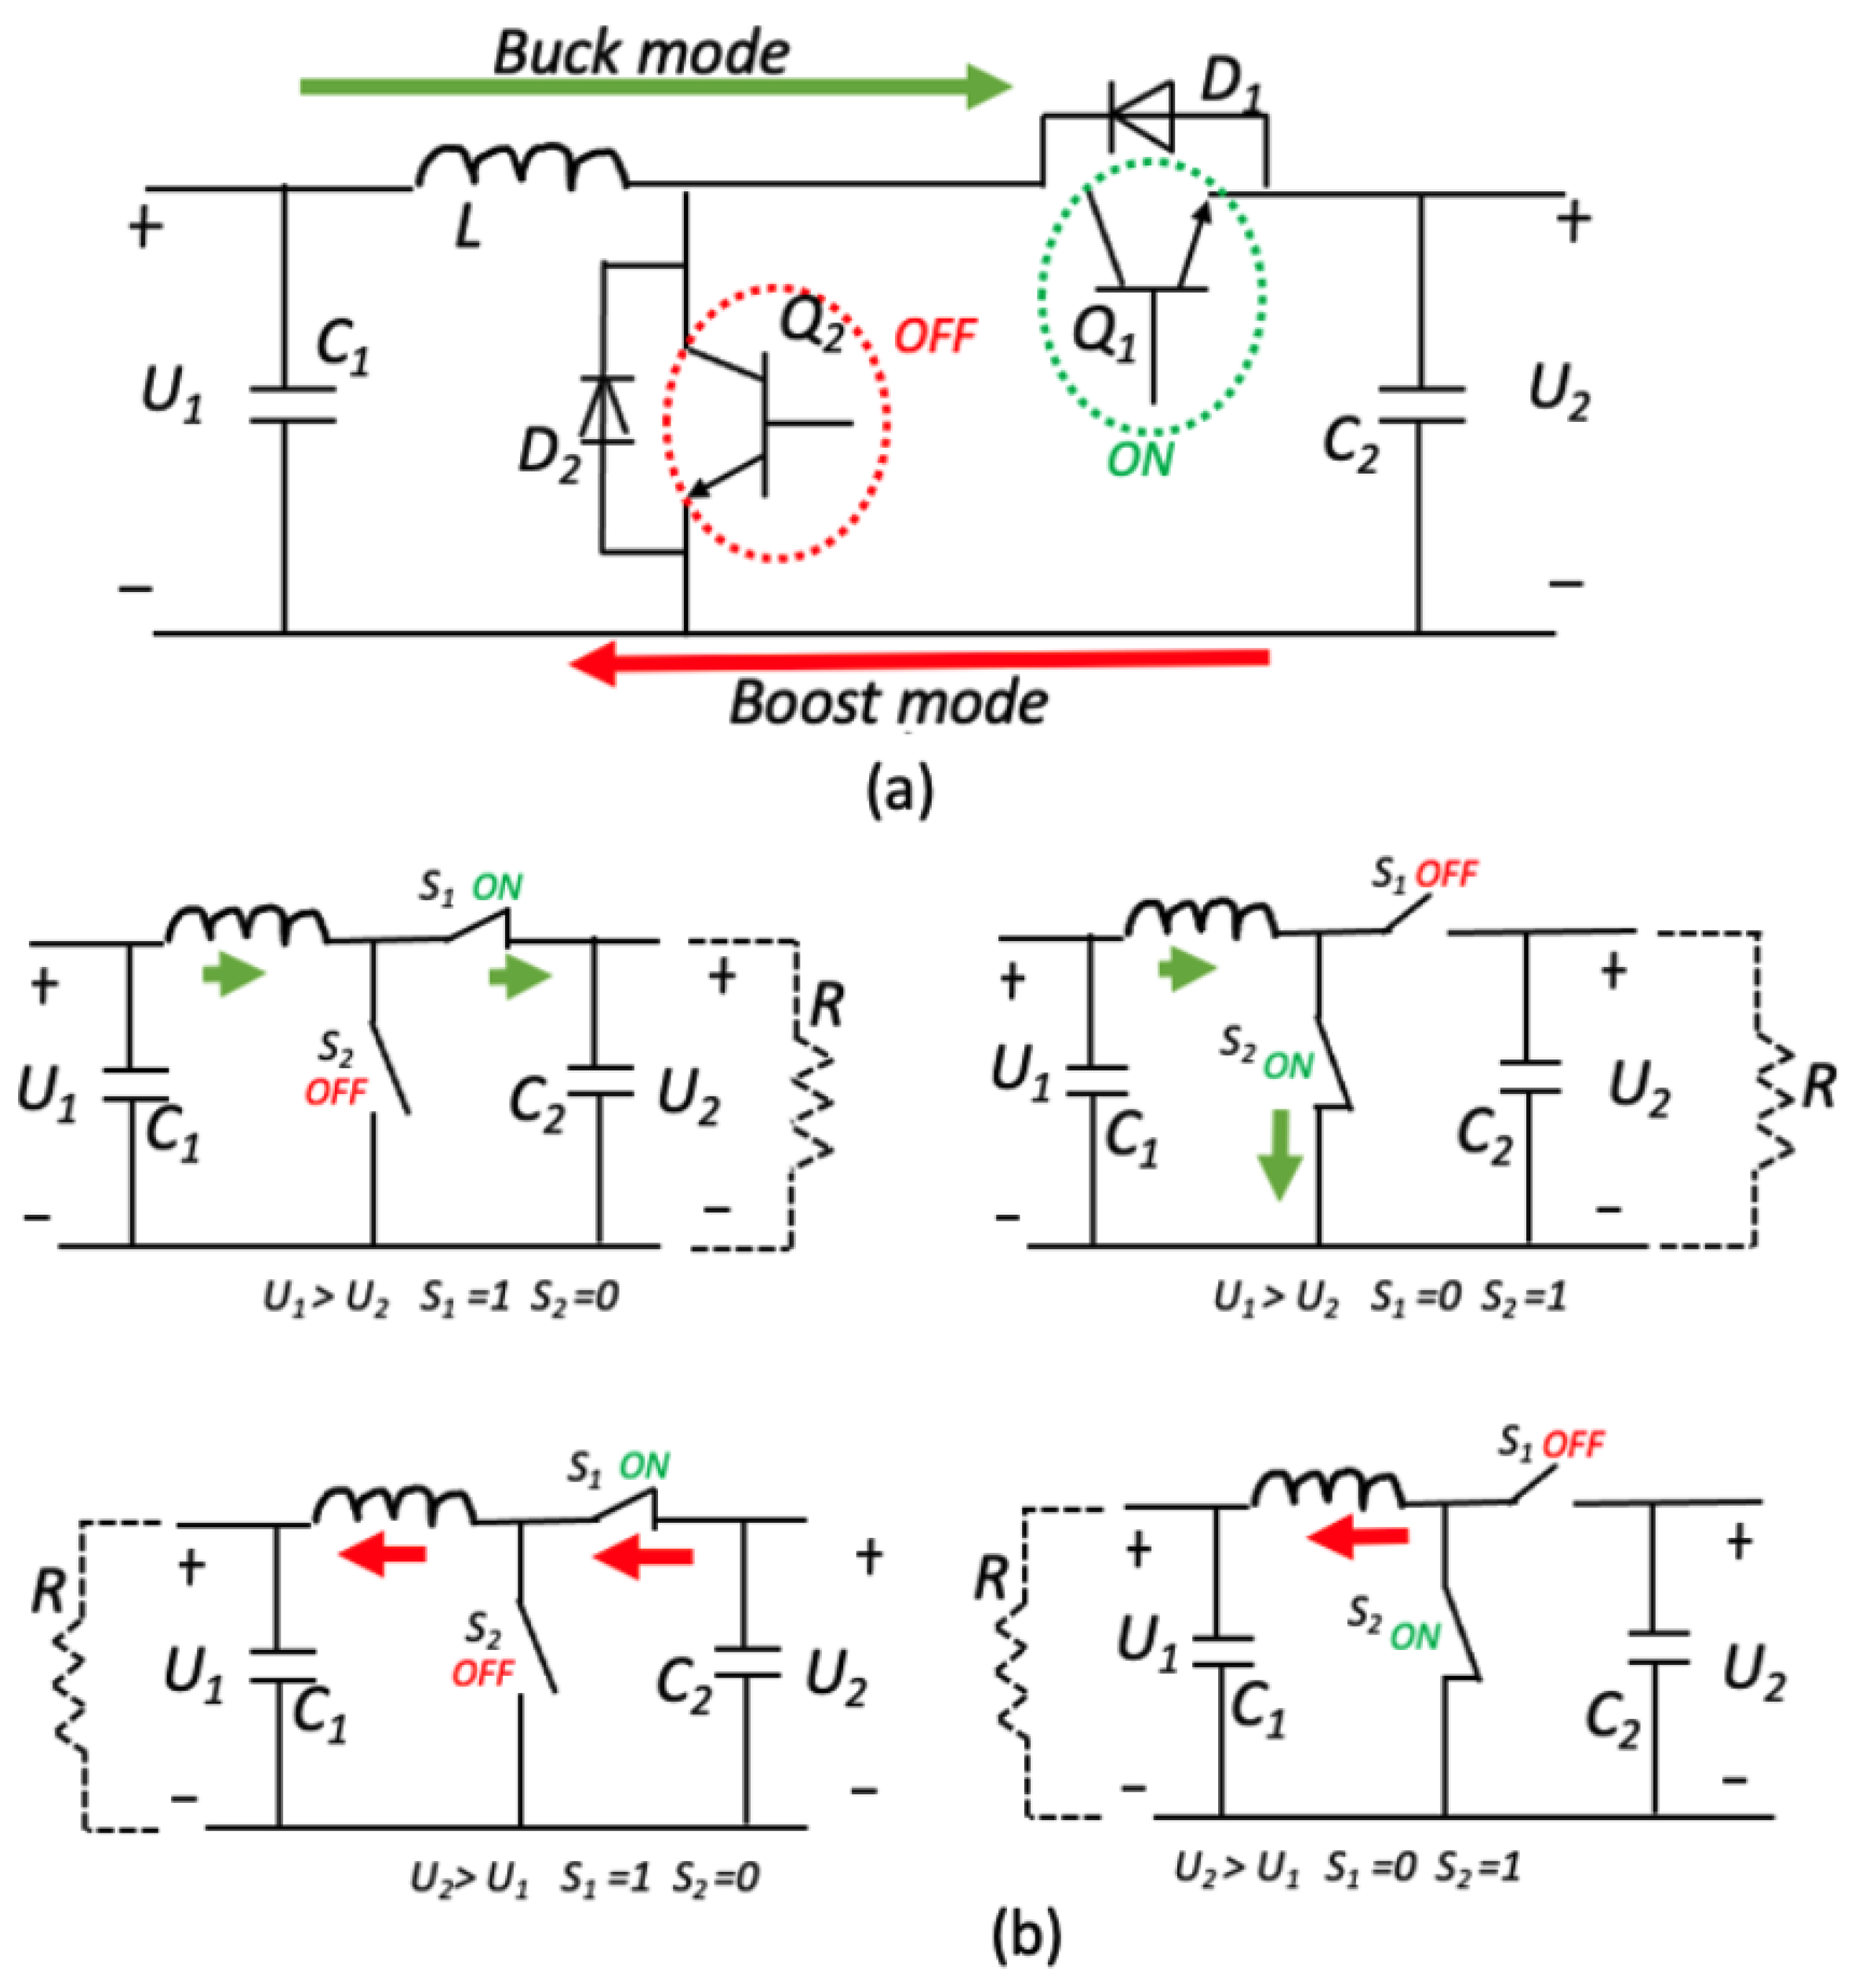
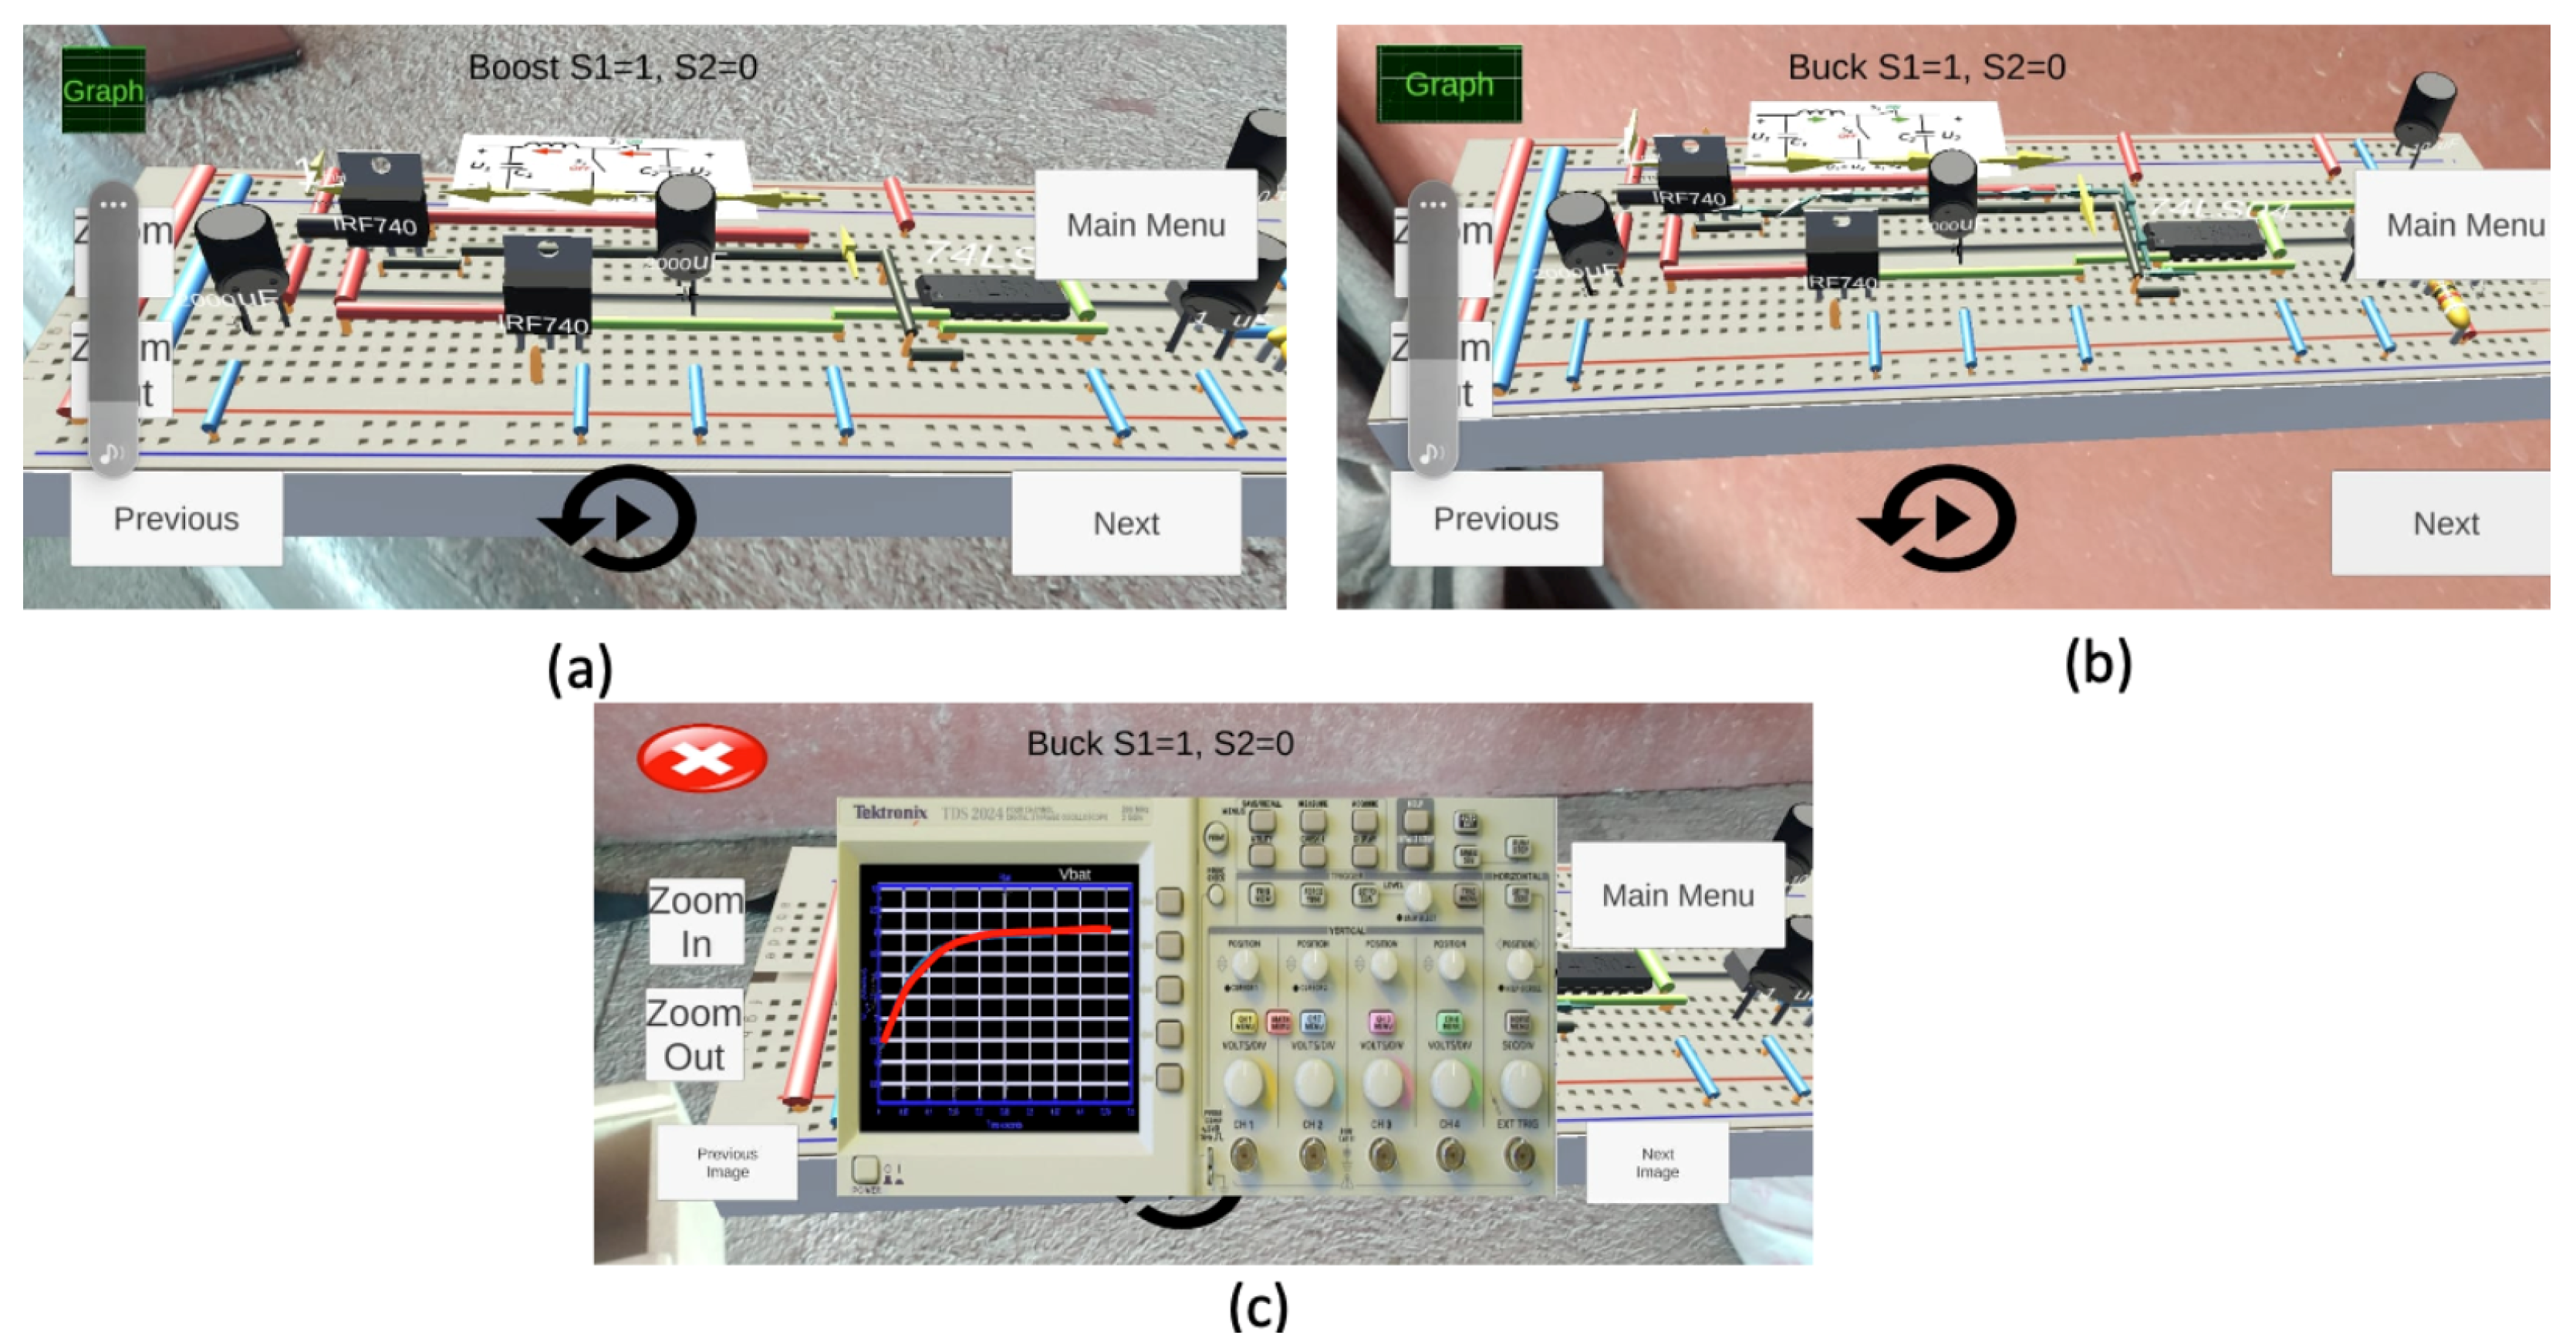
Once we have the elements to interact with, it is necessary to make adjustments to the User Interface (UI) using the UNITY GameObject menu and the Rect Tool to move, resize, and rotate the UI elements according to the interaction and give functionality to the programmed elements in UNITY. Then, an APK is built for the topic of RLC circuits configured to carry out the assembly in the laboratory and the mathematical analysis of the circuit. Similarly, for the bidirectional Buck–Boost converter, another APK is built to individually analyze the Buck and Boost converters and for it to work as a bidirectional converter.
2.2. Development of the AR for RLC Circuits
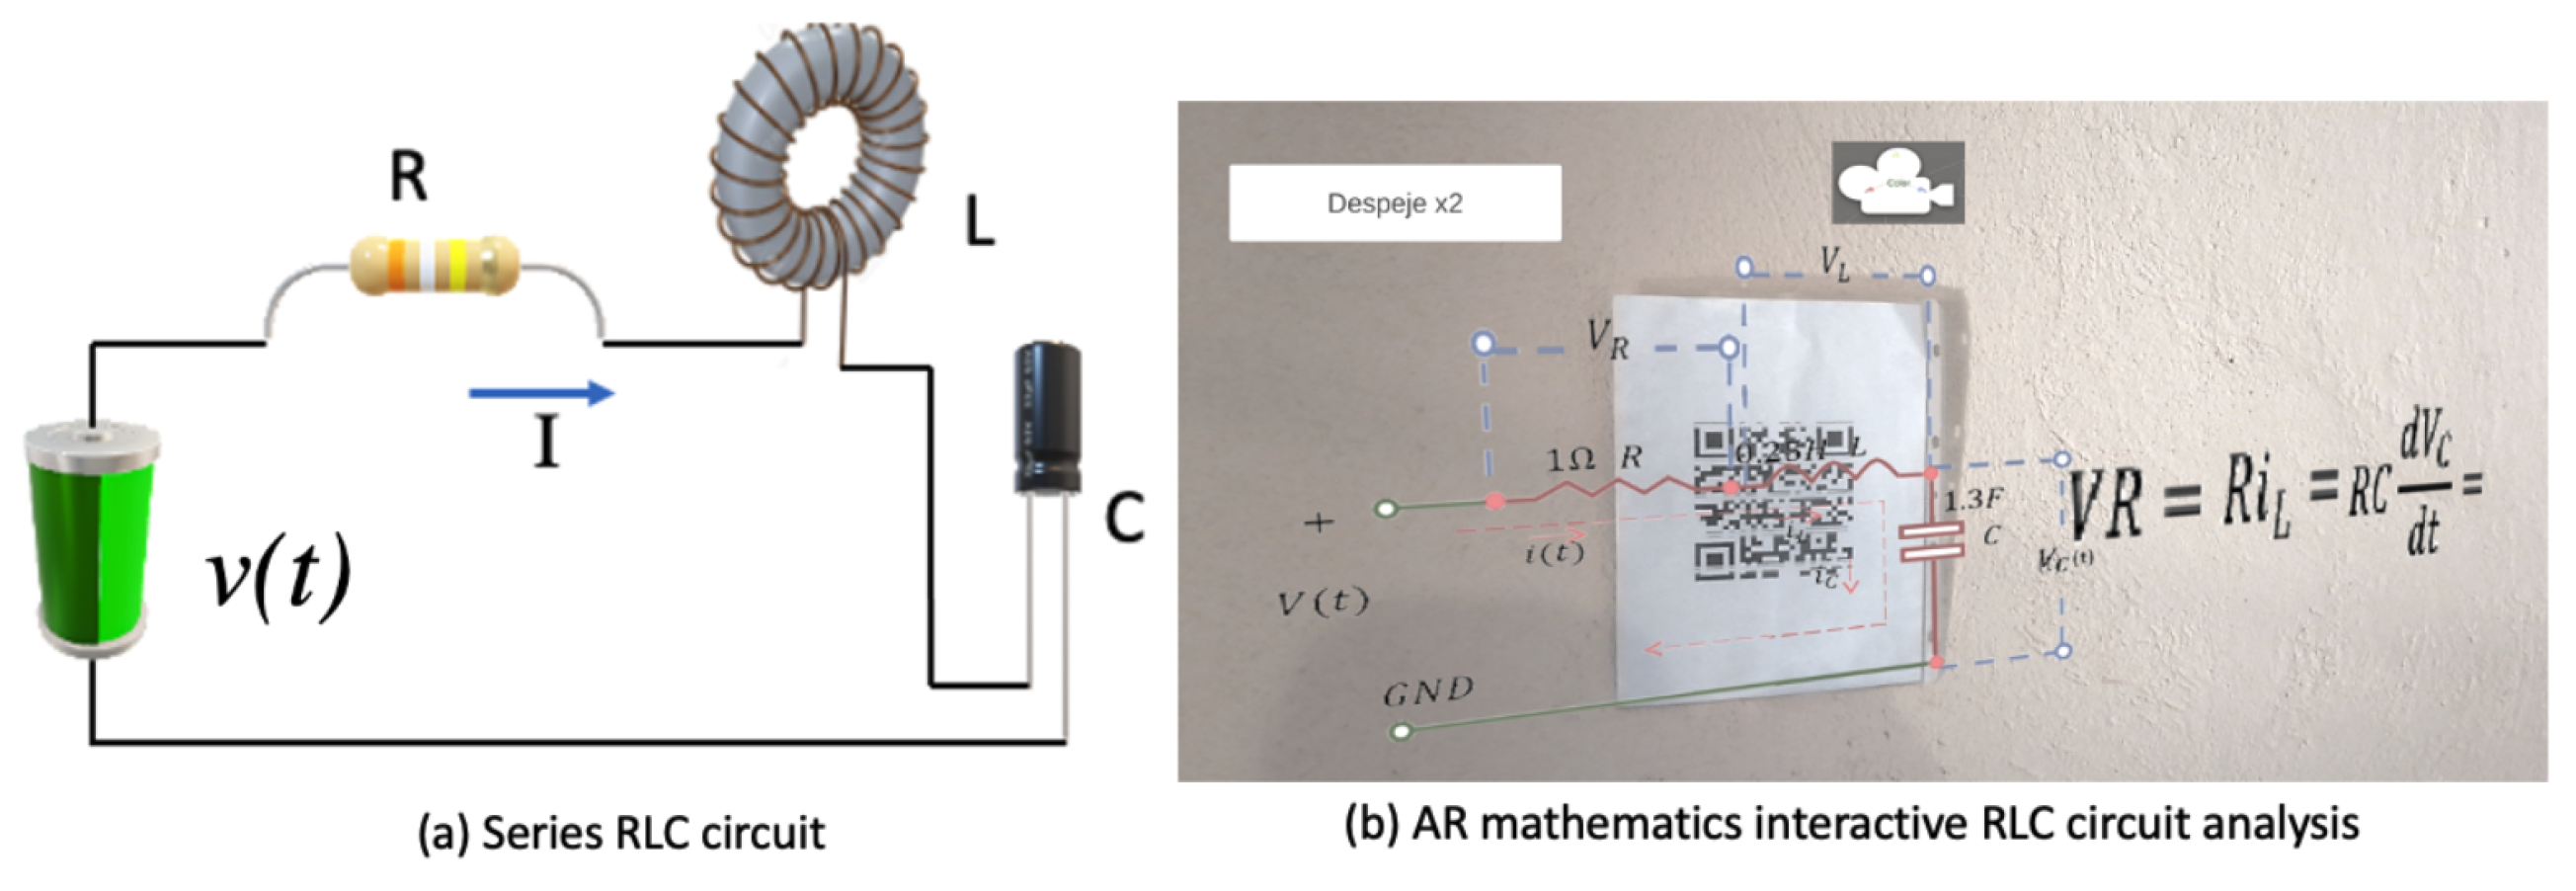
One of the main problems when teaching the mathematical analysis of RLC circuits is that some students cannot obtain their state-space equations. Hence, these equations were obtained interactively by designing them in AR, guiding the user to understand their modeling. The RLC circuit implemented in this study considers a series connection, as shown in
Figure 6a, and the equations in state-space are given by Equation (
1) [
40].
The design of the AR for RLC circuits was divided into two stages: an interactive mathematical explanation for obtaining its mathematical model in state spaces and representing the RLC circuit in two differential equations (
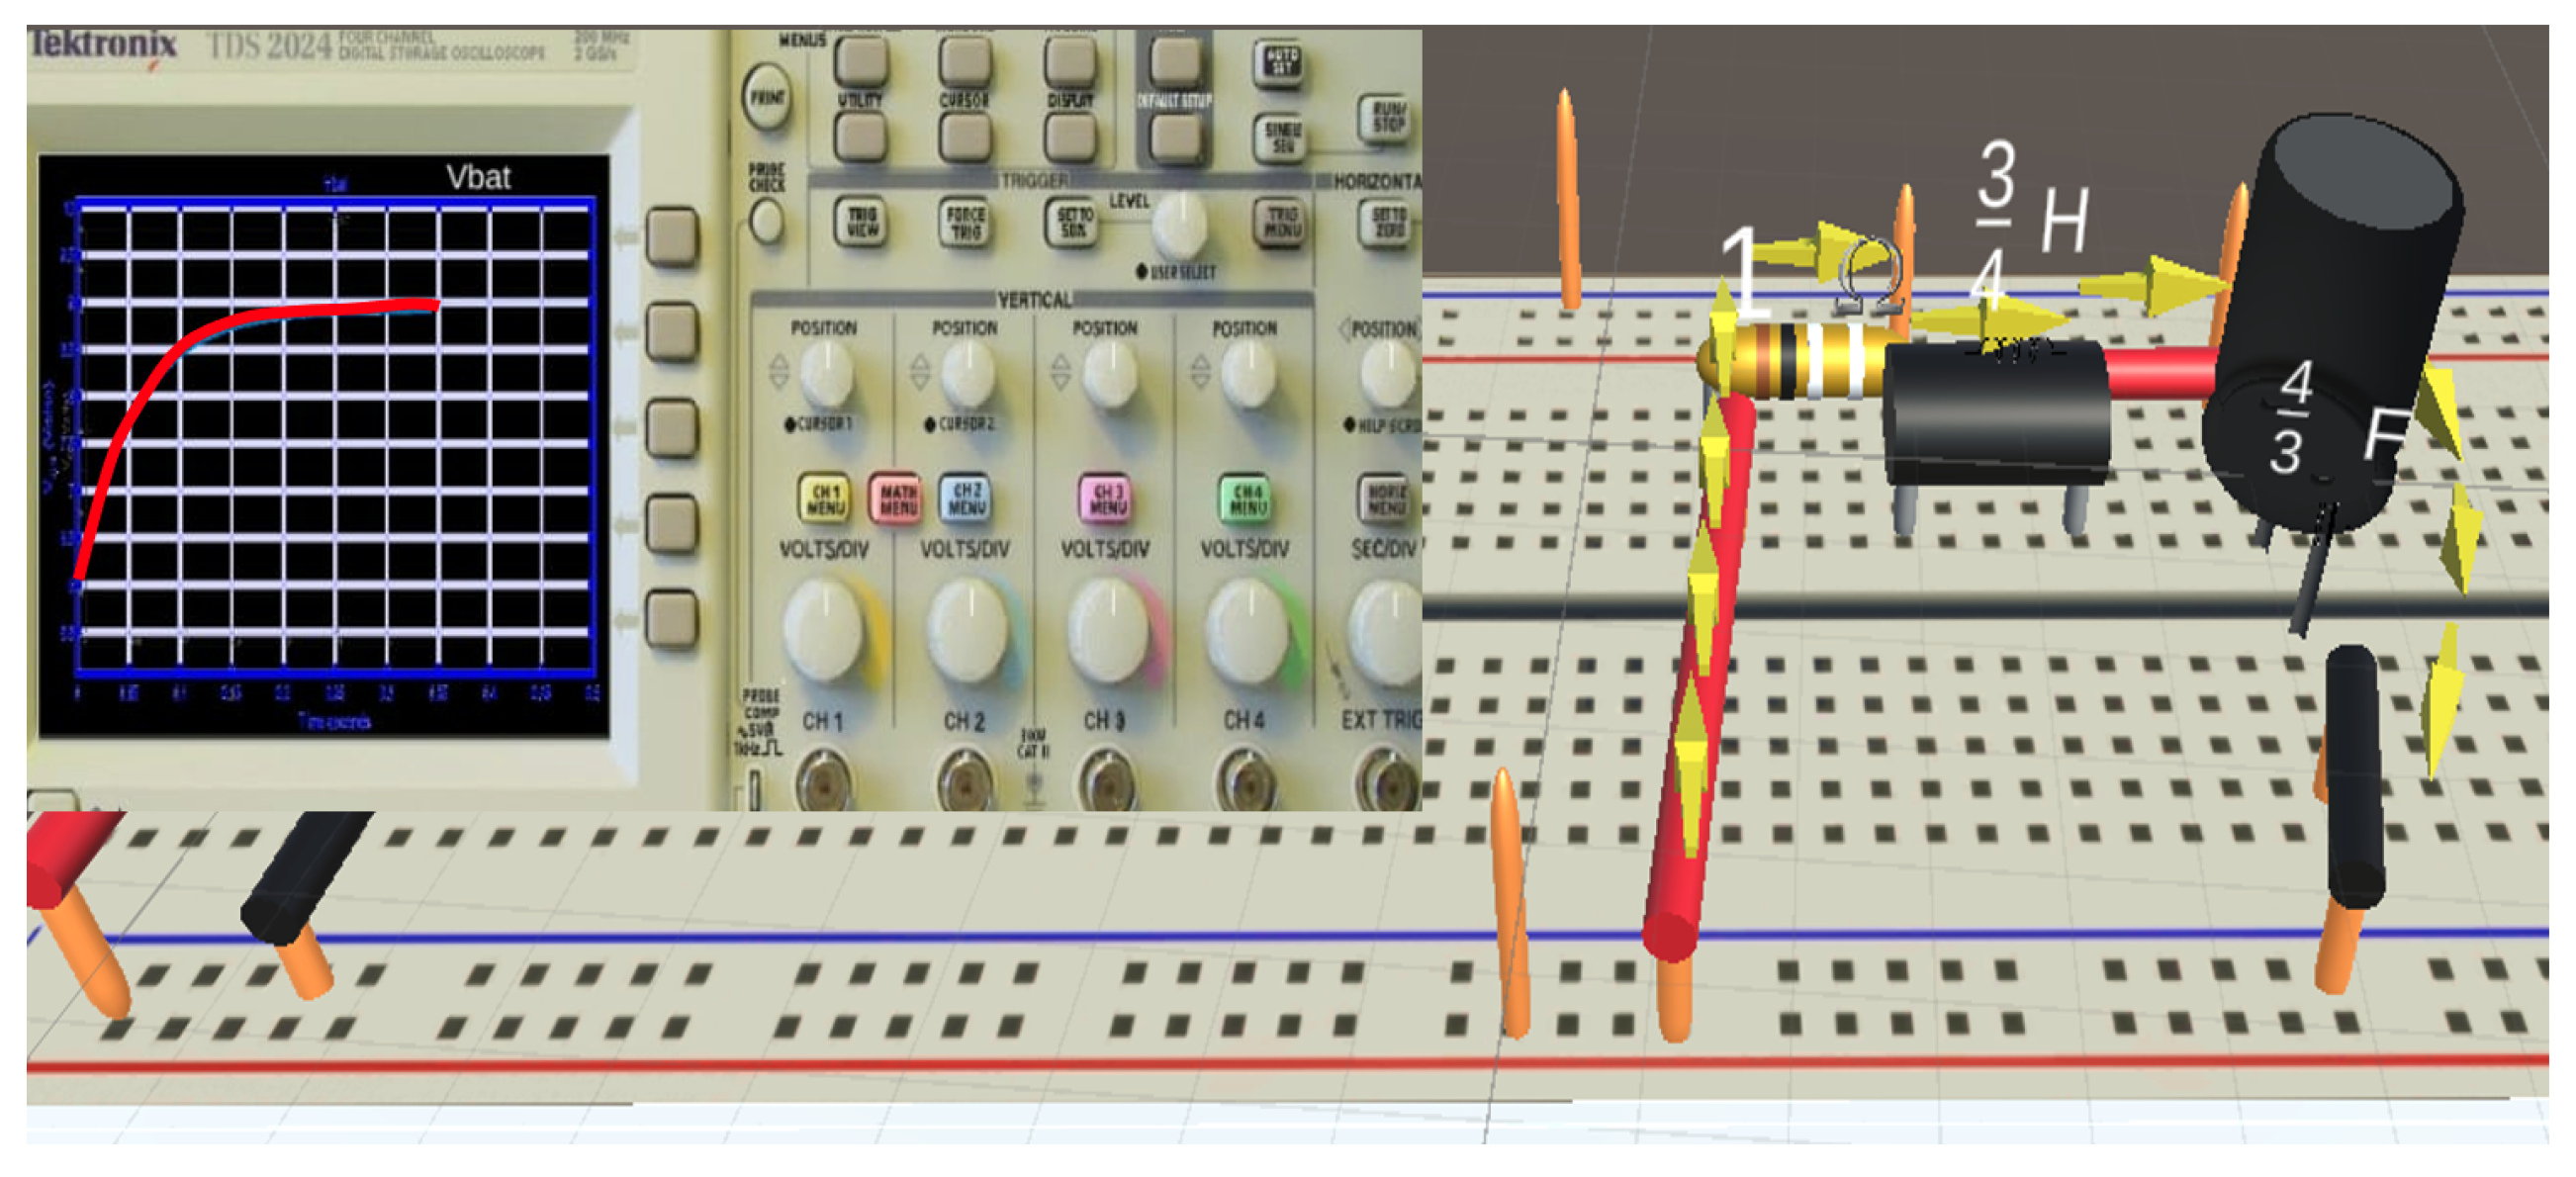
Figure 6b); the assembly of the RLC circuit in an electronic protoboard, showing the devices mounted on the protoboard step by step. Additionally, the behavior of the signals for voltage and current was added, as visualized in an oscilloscope (
Figure 7), which shows the student how to place the tips of the oscilloscope within the RLC circuit to obtain the responses of the waveforms.
Figure 7 illustrates the circulation of energy through each of the devices with arrows as well as it magnitude values.


 ,
, 


