1. Introduction
Recently, clean energy usage has increased significantly as demand for all other fuels declined because of environmental concerns. As a result,, the scientific community made substantial efforts to harvest energy from different ambient sources [
1,
2,
3,
4,
5]. Solar energy harvesting has become the most ideal option since it surpasses all traditional nonrenewable and renewable resources [
6]. As a result, the worldwide solar electricity sector is expanding significantly, with a current value of more than
$10 billion each year [
6,
7,
8].
Solar energy is converted into electrical energy by employing photovoltaic (PV) panels [
9]. Numerous PV panels are linked together in serial and/or parallel arrangements to create bulky solar energy plants equipped with maximum power point tracking (MPPT) systems to increase power generation. The primary goal of MPPT systems is to regulate the parameters of the PV system to generate optimum power [
9]. The rapid deviation of electrical energy production is a well-known property of solar plants [
9]. Many solar facilities are linked to local grids, and their operation at the same time as the grids causes voltage instability in distribution lines [
10]. Hence, stable and maximized power generation from solar plants is an essential requirement of the green energy movement. To obtain maximum power density, both theoretical and experimental studies were performed to optimize the parameters of PV panels [
4,
11,
12,
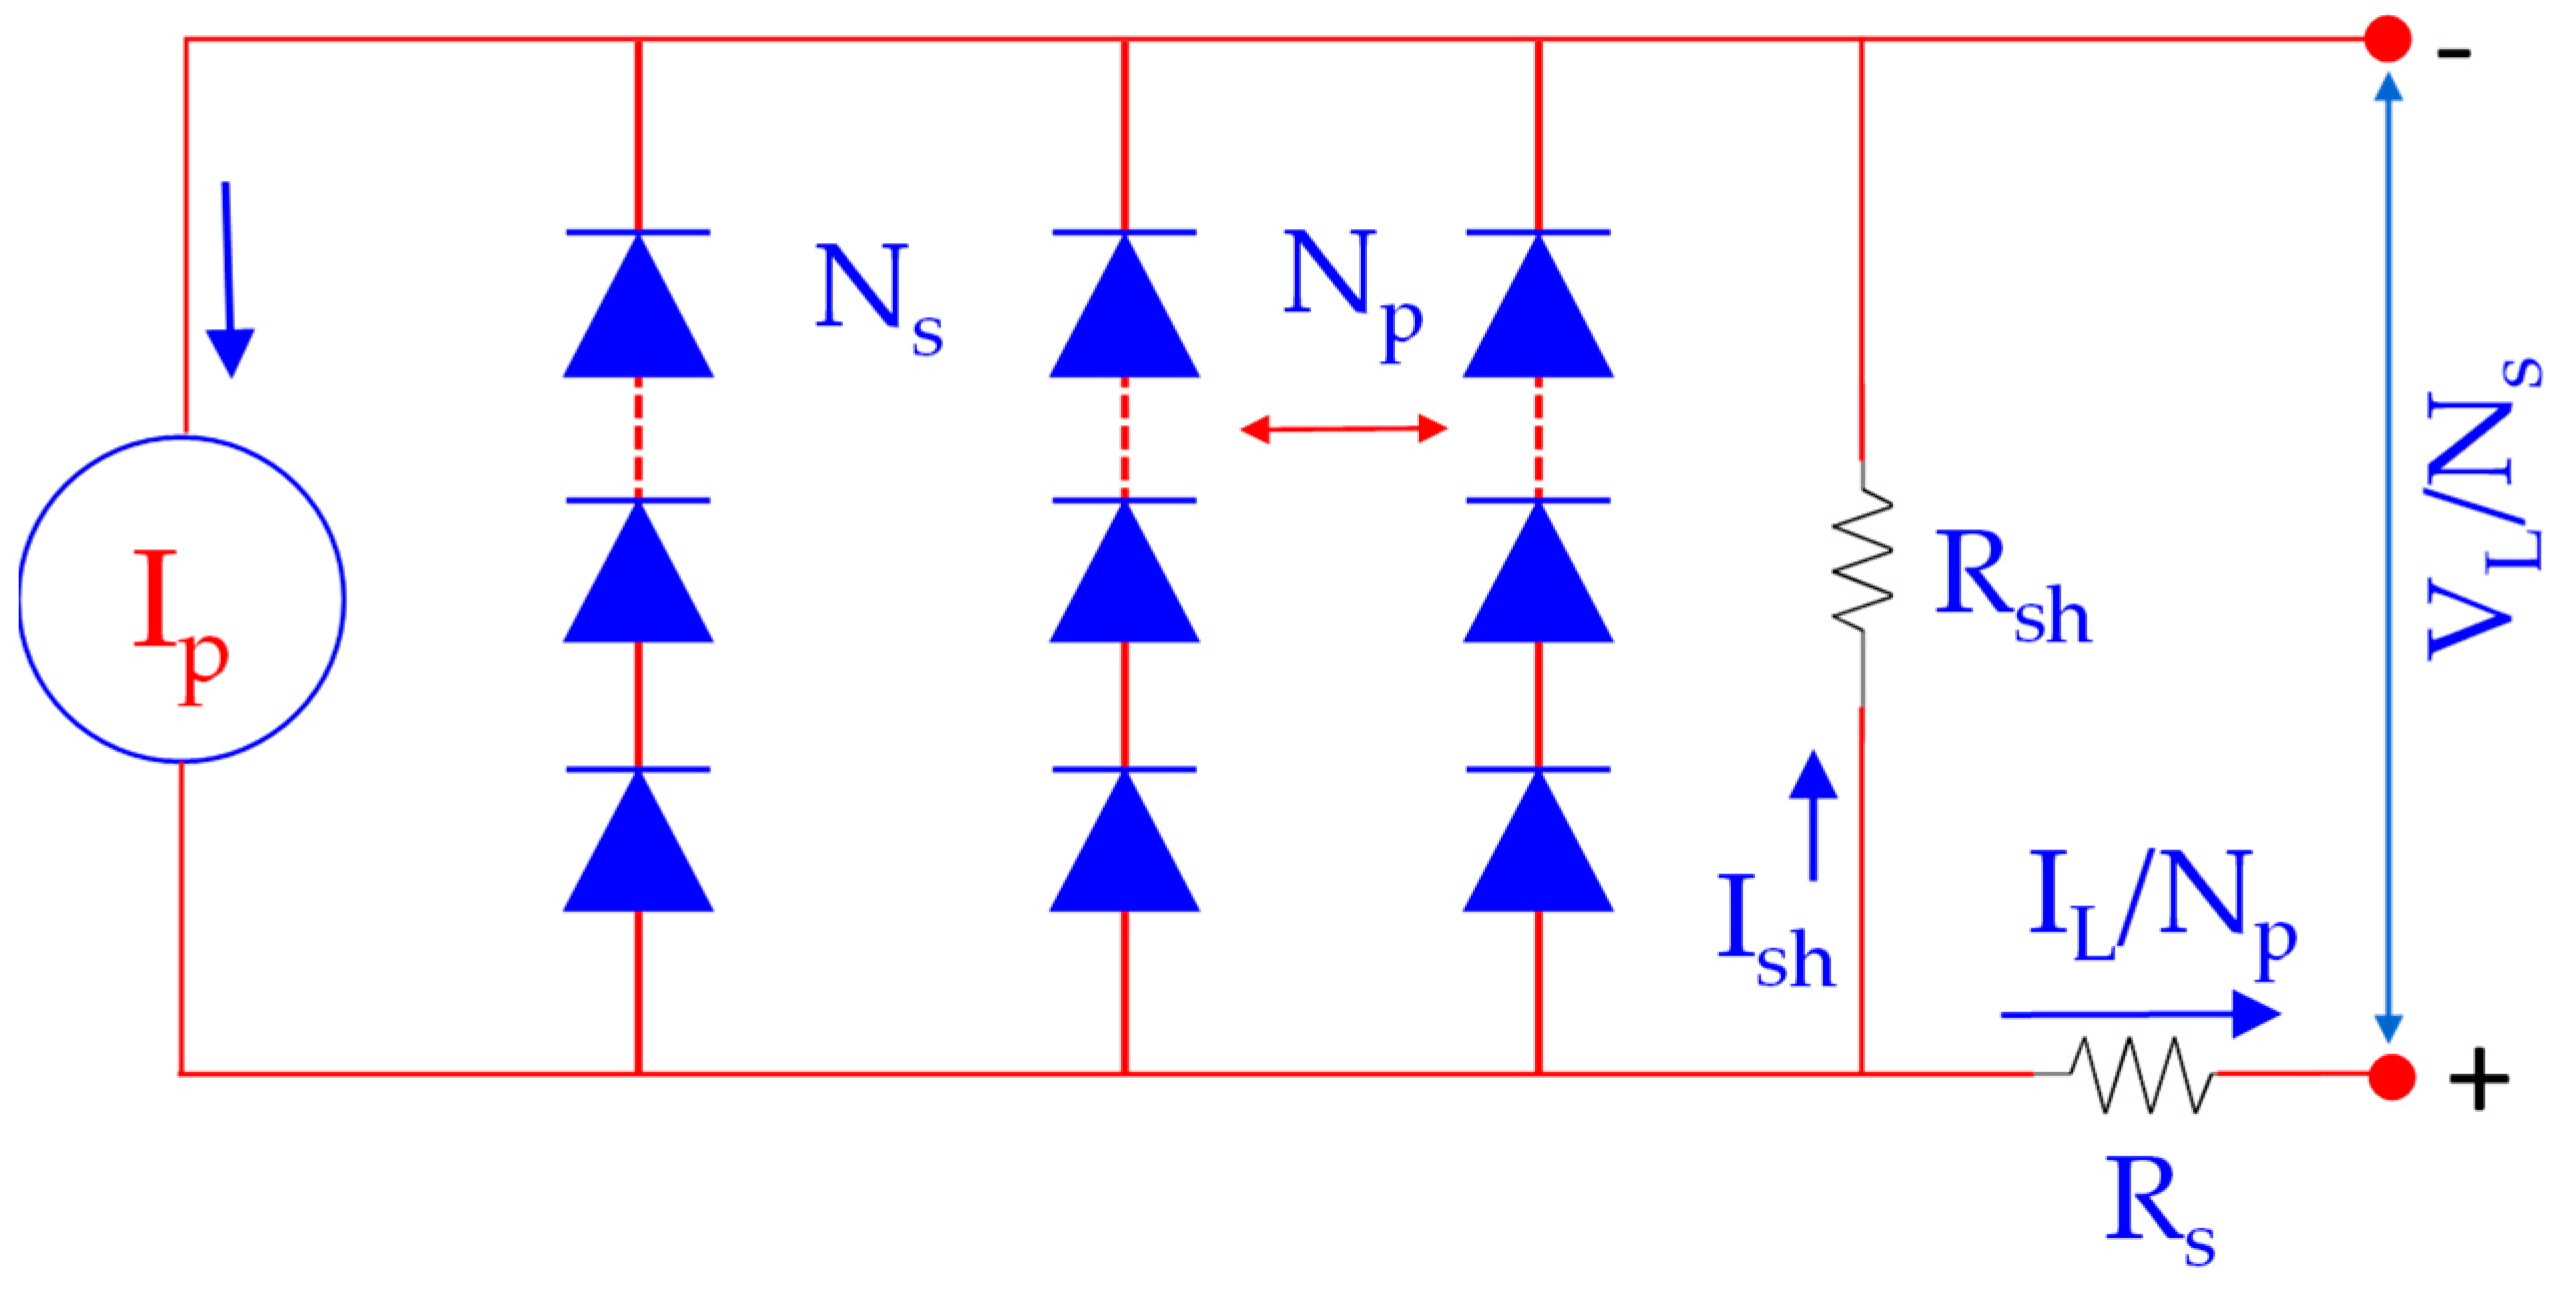
13]. Single, double, and triple diode models of PV cells are widely employed to identify the current-voltage parameters [
14,
15,
16]. These parameters are helpful for determining the accuracy and steadiness of the models. However, parameter assessment is not an easy task because of unbalanced operational cases such as faults and ageing. In most cases, the single diode model is employed because of ease and acceptance. On the other hand, the double diode model is anticipated to be more than the three-diode model accurate in case of lower solar irradiance.
Different types of algorithms were proposed and studied to get more accurate and precise parameters from nonlinear implicit equations with high accuracy [
17,
18,
19,
20,
21,
22,
23,
24,
25,
26,
27,
28,
29,
30,
31,
32,
33]. The merits and demerits of these algorithms are categorized because of the trade-off between exploration and exploitation capabilities [
17]. Some became caught in local optima solutions because of a lack of exploration capabilities for finding an optimal solution in the search space. Heuristic and deterministic are the two main groups of algorithms. Heuristic algorithms contain particle swarm optimization (PSO) [
18], cuckoo search algorithm [
19], harmony search [
20], cat swarm optimization (CSO) [
21], differential evolution (DE) [
22], artificial bee colony [
23], chaos CPSO [
24], simulated annealing [
25], biogeography-based optimization algorithm with mutation strategies [
26], genetic algorithms [
27], improved adaptive differential evolution [
28], pattern search [
29], generalized opposition-based teaching-learning-based optimization [
30], and Nelder–Mead modified PSO [
31]. The Lambert W-functions [
32], least squares [
33], iterative curve-fitting methods [
34], conductivity method [
35], Levenberg–Marquardt algorithm [
36], Newton–Raphson, and nonlinear least square are categorized as deterministic algorithms. The applicability of deterministic algorithms is restricted because of continuity, differentiability, and convexity related to objective functions. These algorithms are likewise sensitive to the starting solution and settle at local optima in most cases. Because they do not include difficult mathematics, biorelated algorithms are more realistic and robust optimization methods for simplifying complex transcendental equations.
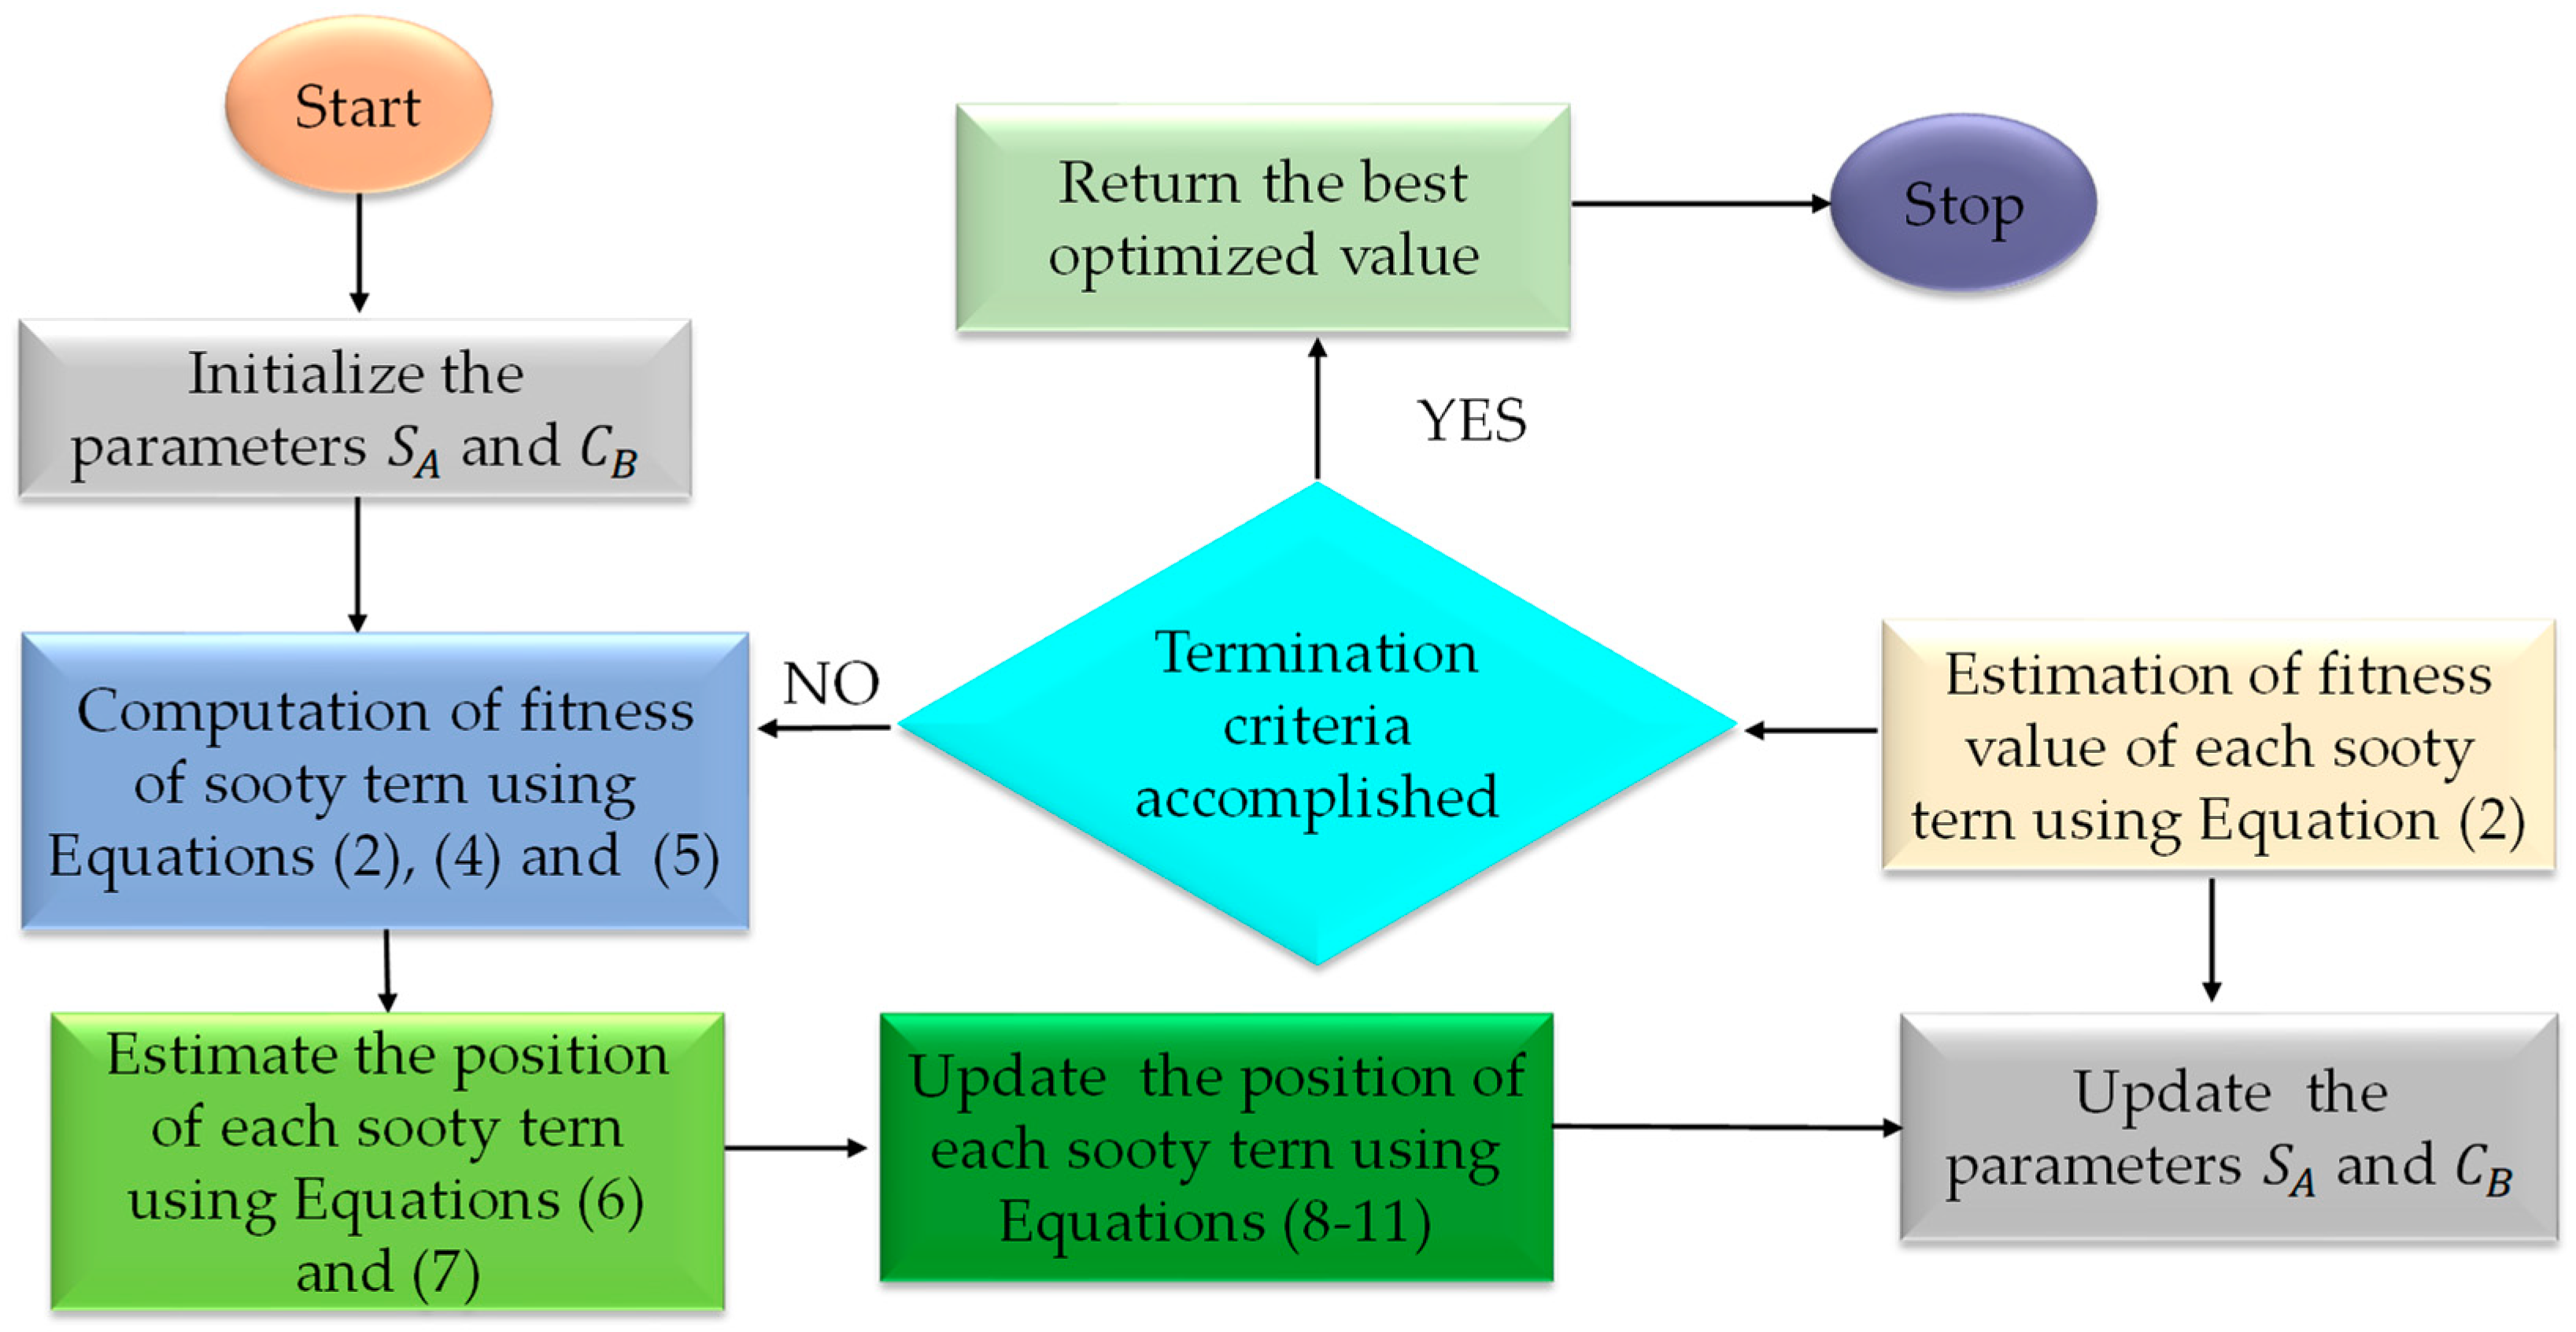
The sooty tern optimization (STO) algorithm mimics the attack and migration behavior of sooty terns (birds of tropical oceans). This algorithm provides a good balance between exploration and exploitation strategy and thus reaches optimal solution without getting trapped in a local solution. These benefits allow researchers to apply the STO for parameter extraction of a solar module. The key purposes of this research investigation are as follows:
To first present the experimental results that verify the performance of the STO in handling the parameter extraction problem of the solar module.
To use two test cases—R.T.C France solar cell and SS2018P polycrystalline PV module—to evaluate the effectiveness of the STO and compare it with other metaheuristic algorithms.
To use the experimental results to comprehensively confirm that STO is competitive compared to other existing methods in literature.
This study utilizes the STO algorithm for the parameter assessment of PV cells/modules. Initially, the mathematical model for PV cell/module and problem formulation is discussed. At the second stage, the STO algorithm is briefly introduced and used to assess the optimal magnitude of undetermined parameters. Next, the output results are examined with a measured dataset, and the algorithm is compared to pre-existing metaheuristic algorithms.
Section 5 contains the discussion and conclusion of manuscript.
4. Results and Discussion
In this section, we examine the validity of the STO algorithm and describe how we tested it under standard temperature conditions (1000 W/m
2 at 25 °C) utilizing primarily one R.T.C France solar cell and polycrystalline PV module (SS2018P). The extracted PV module characteristics were tracked and employed to generate simulated I-V and P-V data sets. The dependability of the STO algorithm was examined and compared to four metaheuristic algorithms: GSA [
41], SCA [
42], GWO [
43], and WOA [
44]. The size of the sample and the objective function evaluations for the experiment were fixed to 30 and 50,000, respectively. In addition, at least 30 independent runs were performed to avoid duplication.
The effectiveness of the proposed method was evaluated using several empirical constraints, e.g., internal absolute error (IAE), correctness of the curve-fitting, and global minimum convergence rates. The current and voltage data for the R.T.C France solar cell [
45] and the SS2018P polycrystalline PV module [
38] were collected experimentally. In the SS2018P PV module, 36 polycrystalline cells were connected serially [
38].
Table 1 tabulates the exploration ranges for every parameter (i.e., upper and lower bounds). These ranges were utilized by investigators in this study. The STO algorithm [
46] was simulated on a MATLAB 2018a (MathWorks, Mexico, DF, Mexico) platform with an Intel
® core TM i5-HQ CPU running at turbo frequency of 4.8 GHz and 8 GB of RAM.
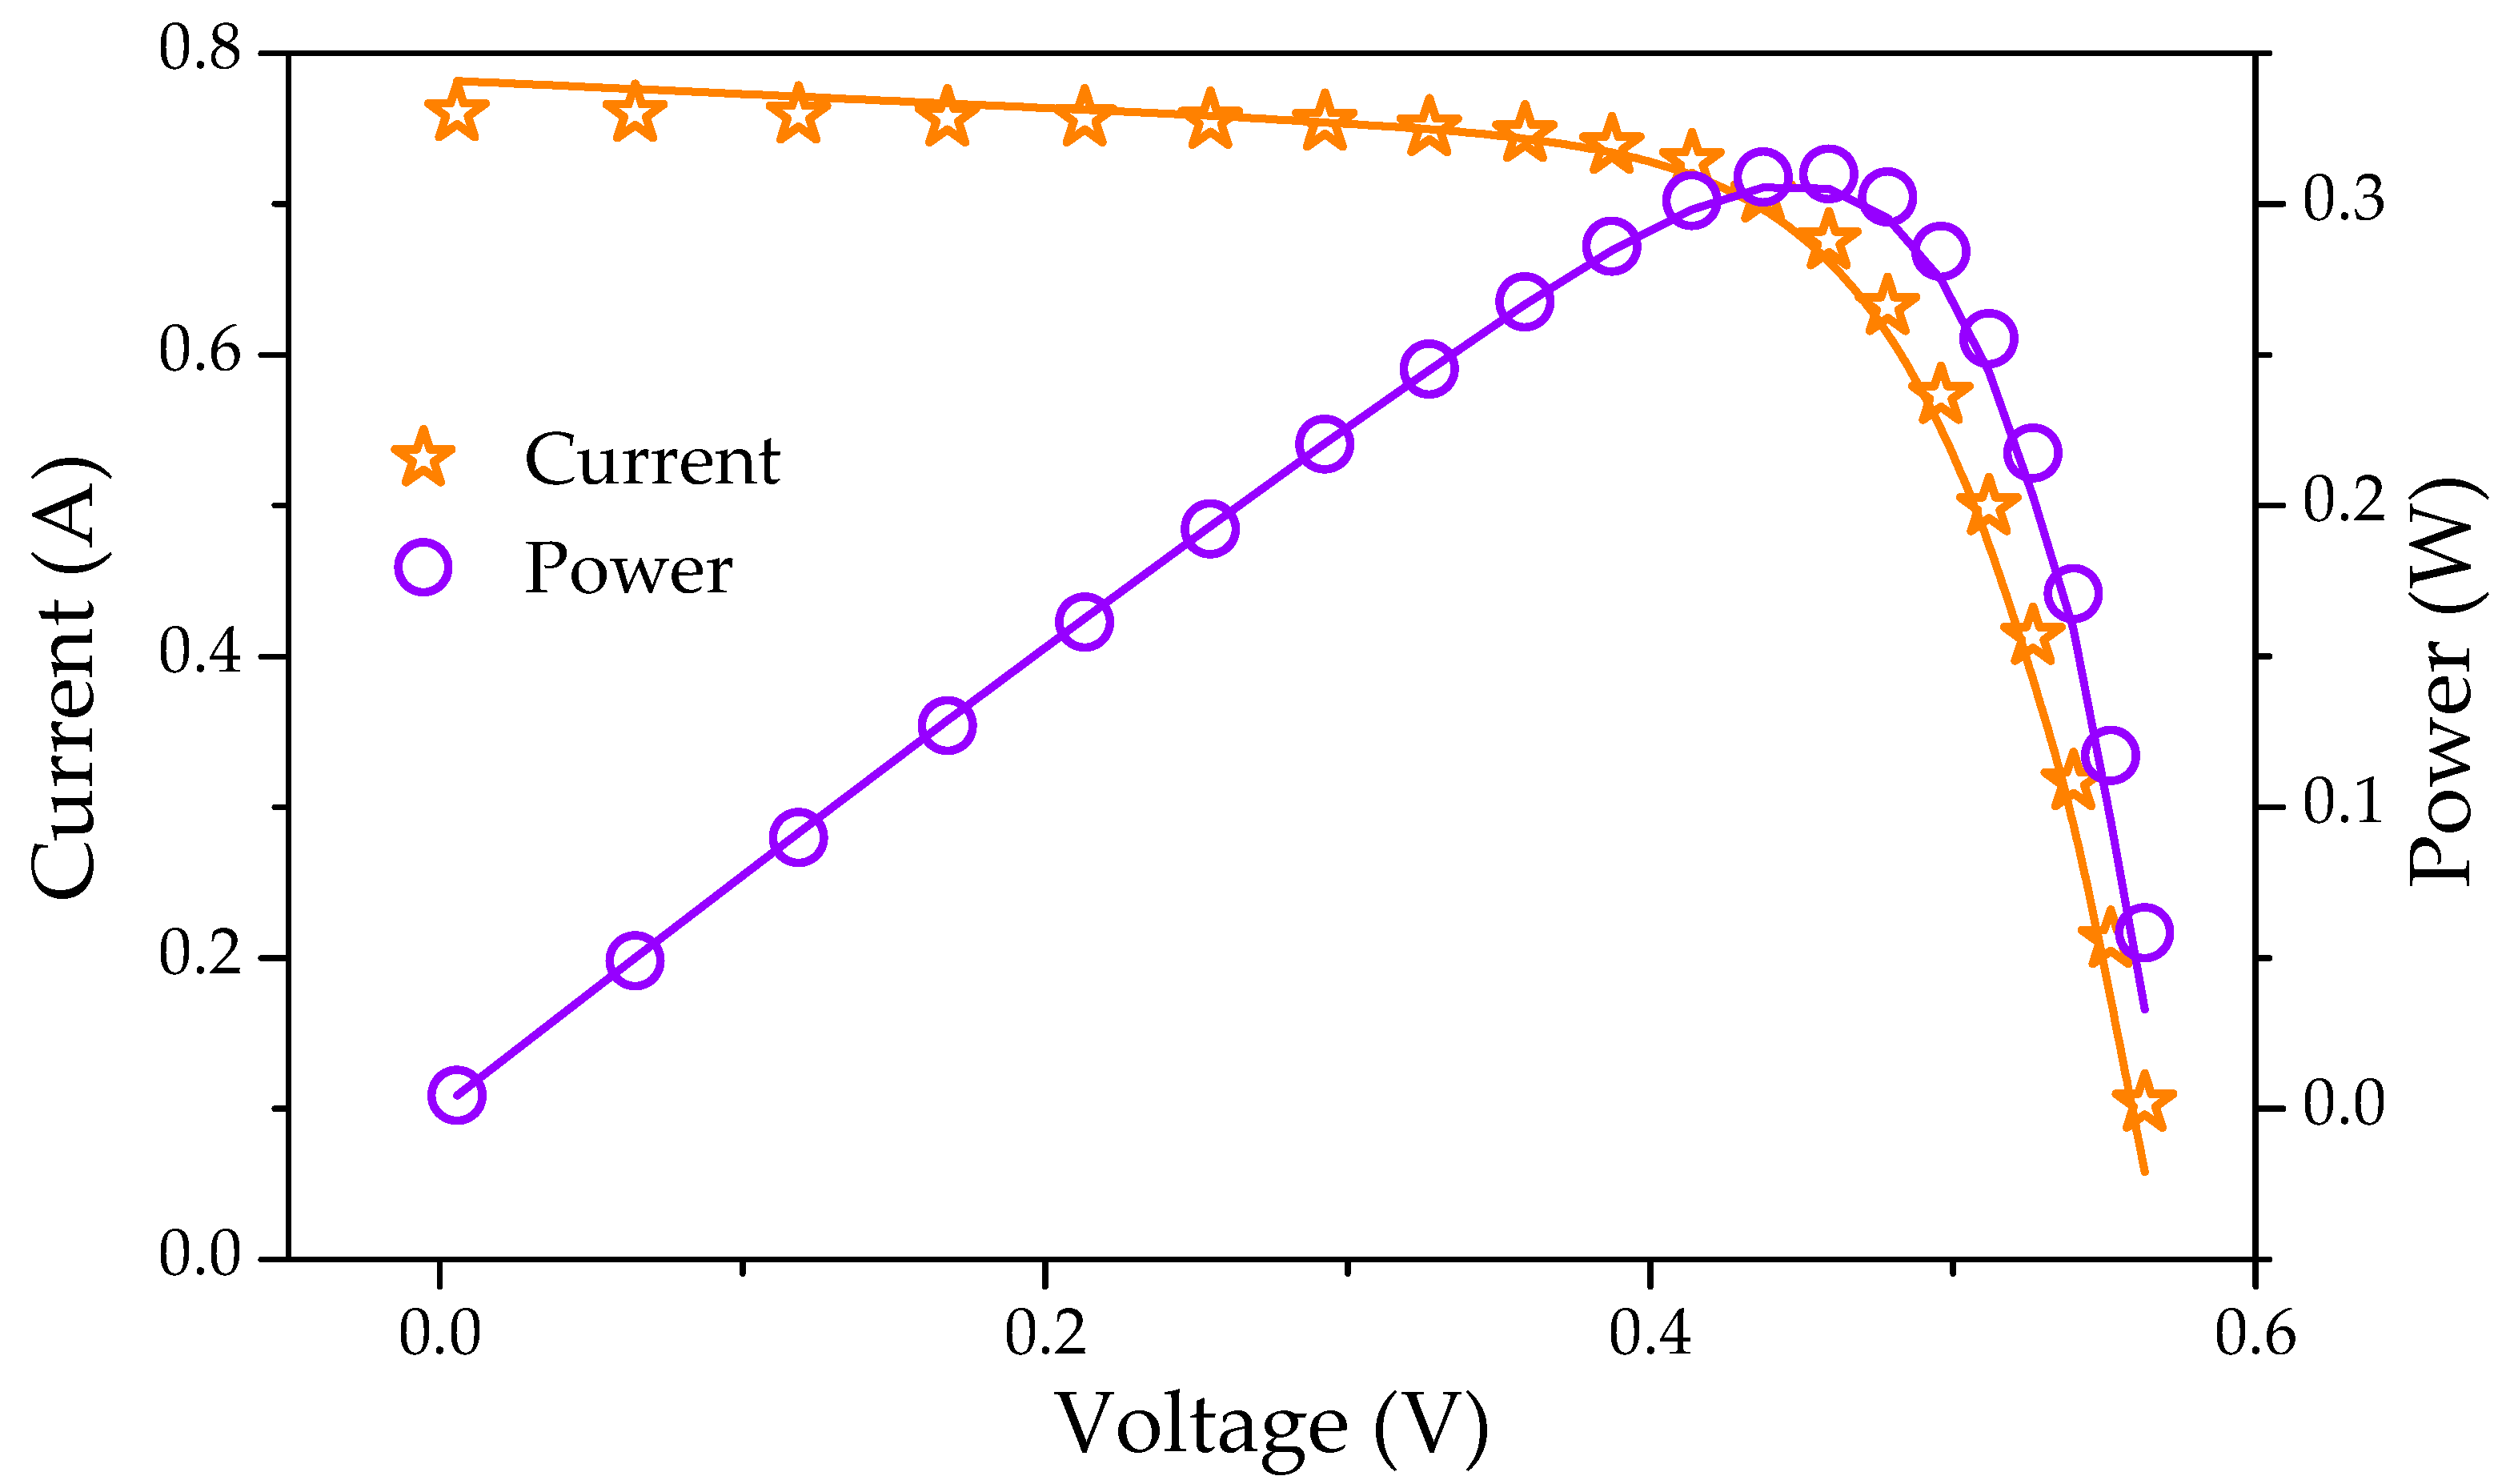
4.1. Parameter Extraction of the R.T.C France Solar Cell
For a single-diode model, five parameters (
,
,
,
,
) must be estimated. The values of simulated current and power with their IAE are charted in
Table 2.
Table 3 shows the values of the STO-optimized parameters and RMSE for comparison. The STO algorithm has the lowest RMSE of 8.6106 × 10
−4 when compared to other algorithms. In this case, RMSE values are obtained as an index for evaluating results with previously constructed techniques by the researchers.
Figure 3 depicts a redrawn current-voltage (I-V) and power-voltage (P-V) characteristics curve for a single-diode model based on the optimum optimized parameters achieved by executing the STO method. The computed data generated by the STO was found to be very close to the experimental data set across the whole voltage range.
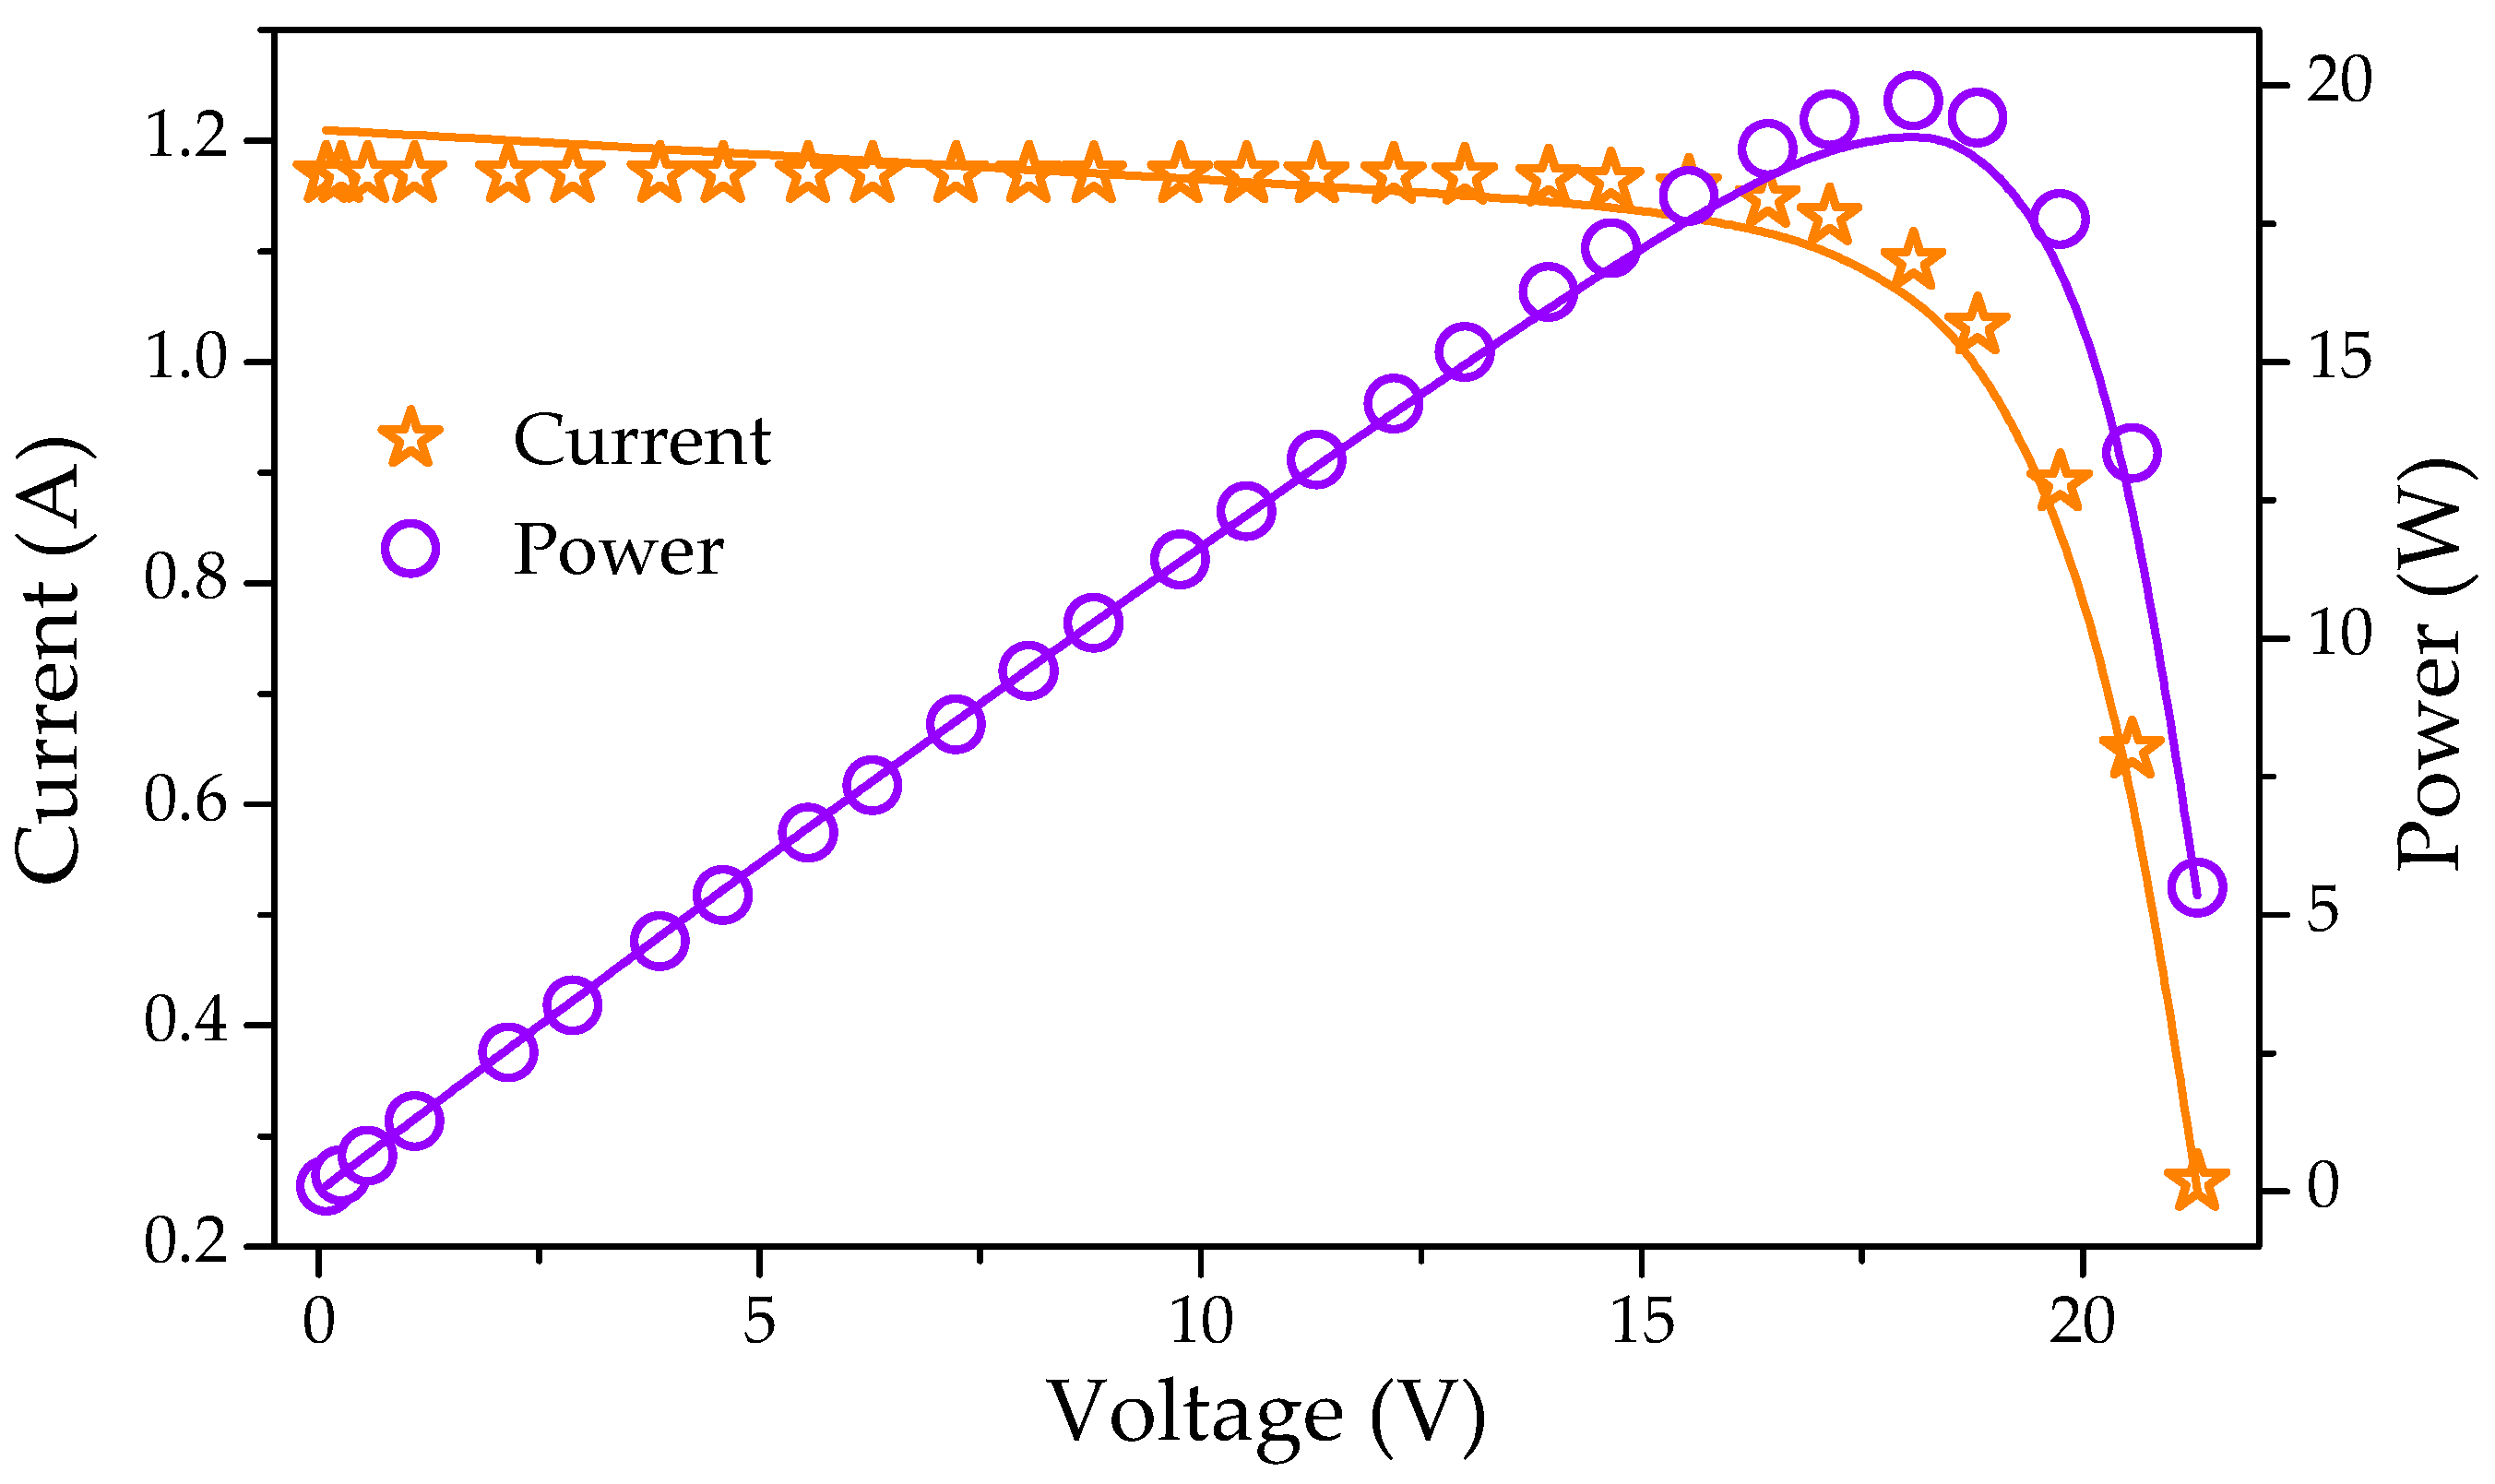
4.2. Parameter Extraction of the SS2018P PV Module
To properly assess the efficacy of the STO algorithm, parameters for the SS2018P PV module were computed at 1000 W/m
2 and 25 ℃, using the SDM model. The values of simulated current and power with their IAE are tabulated in
Table 4.
Table 5 shows the optimized value of all five parameters (
,
,
,
,
) for SDM of the PV module at standard temperature condition.
Figure 4 depicts a redrawn I-V and P-V characteristics curve for a single-diode model based on the optimum optimized parameters achieved by executing the STO method. It was observed that the simulated data provided by the STO was extremely closely related to the experimental data set.
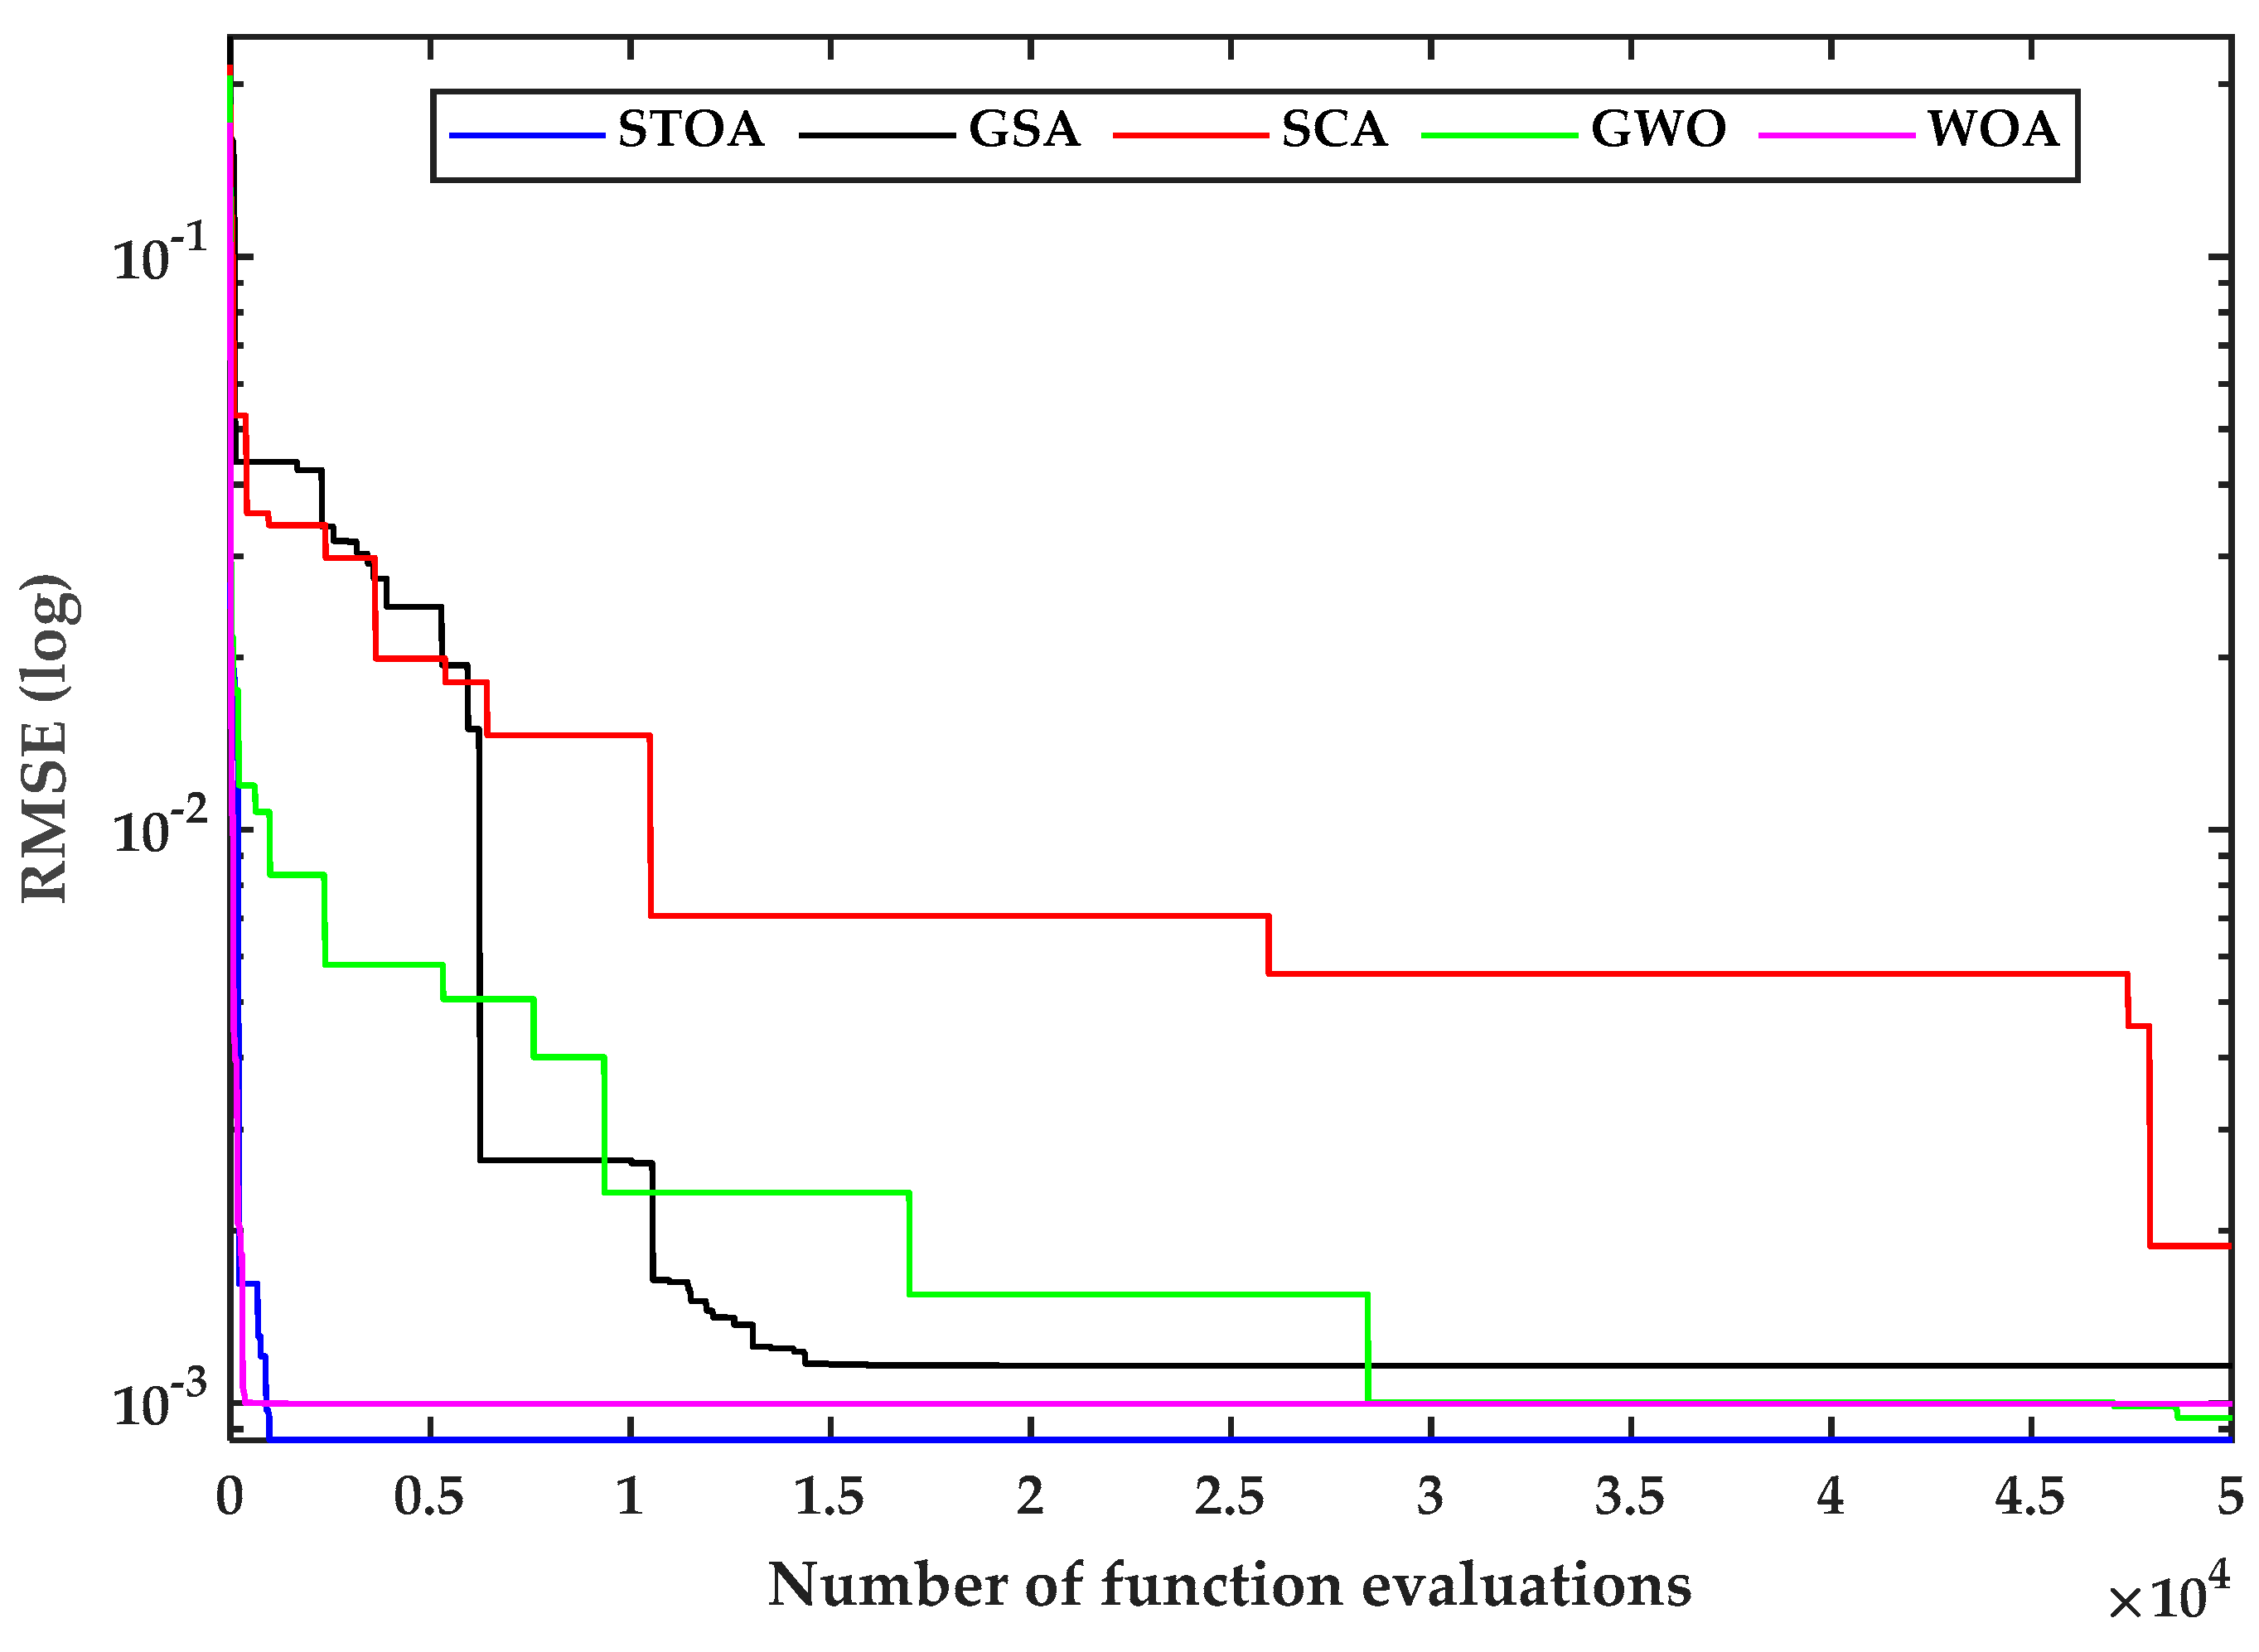
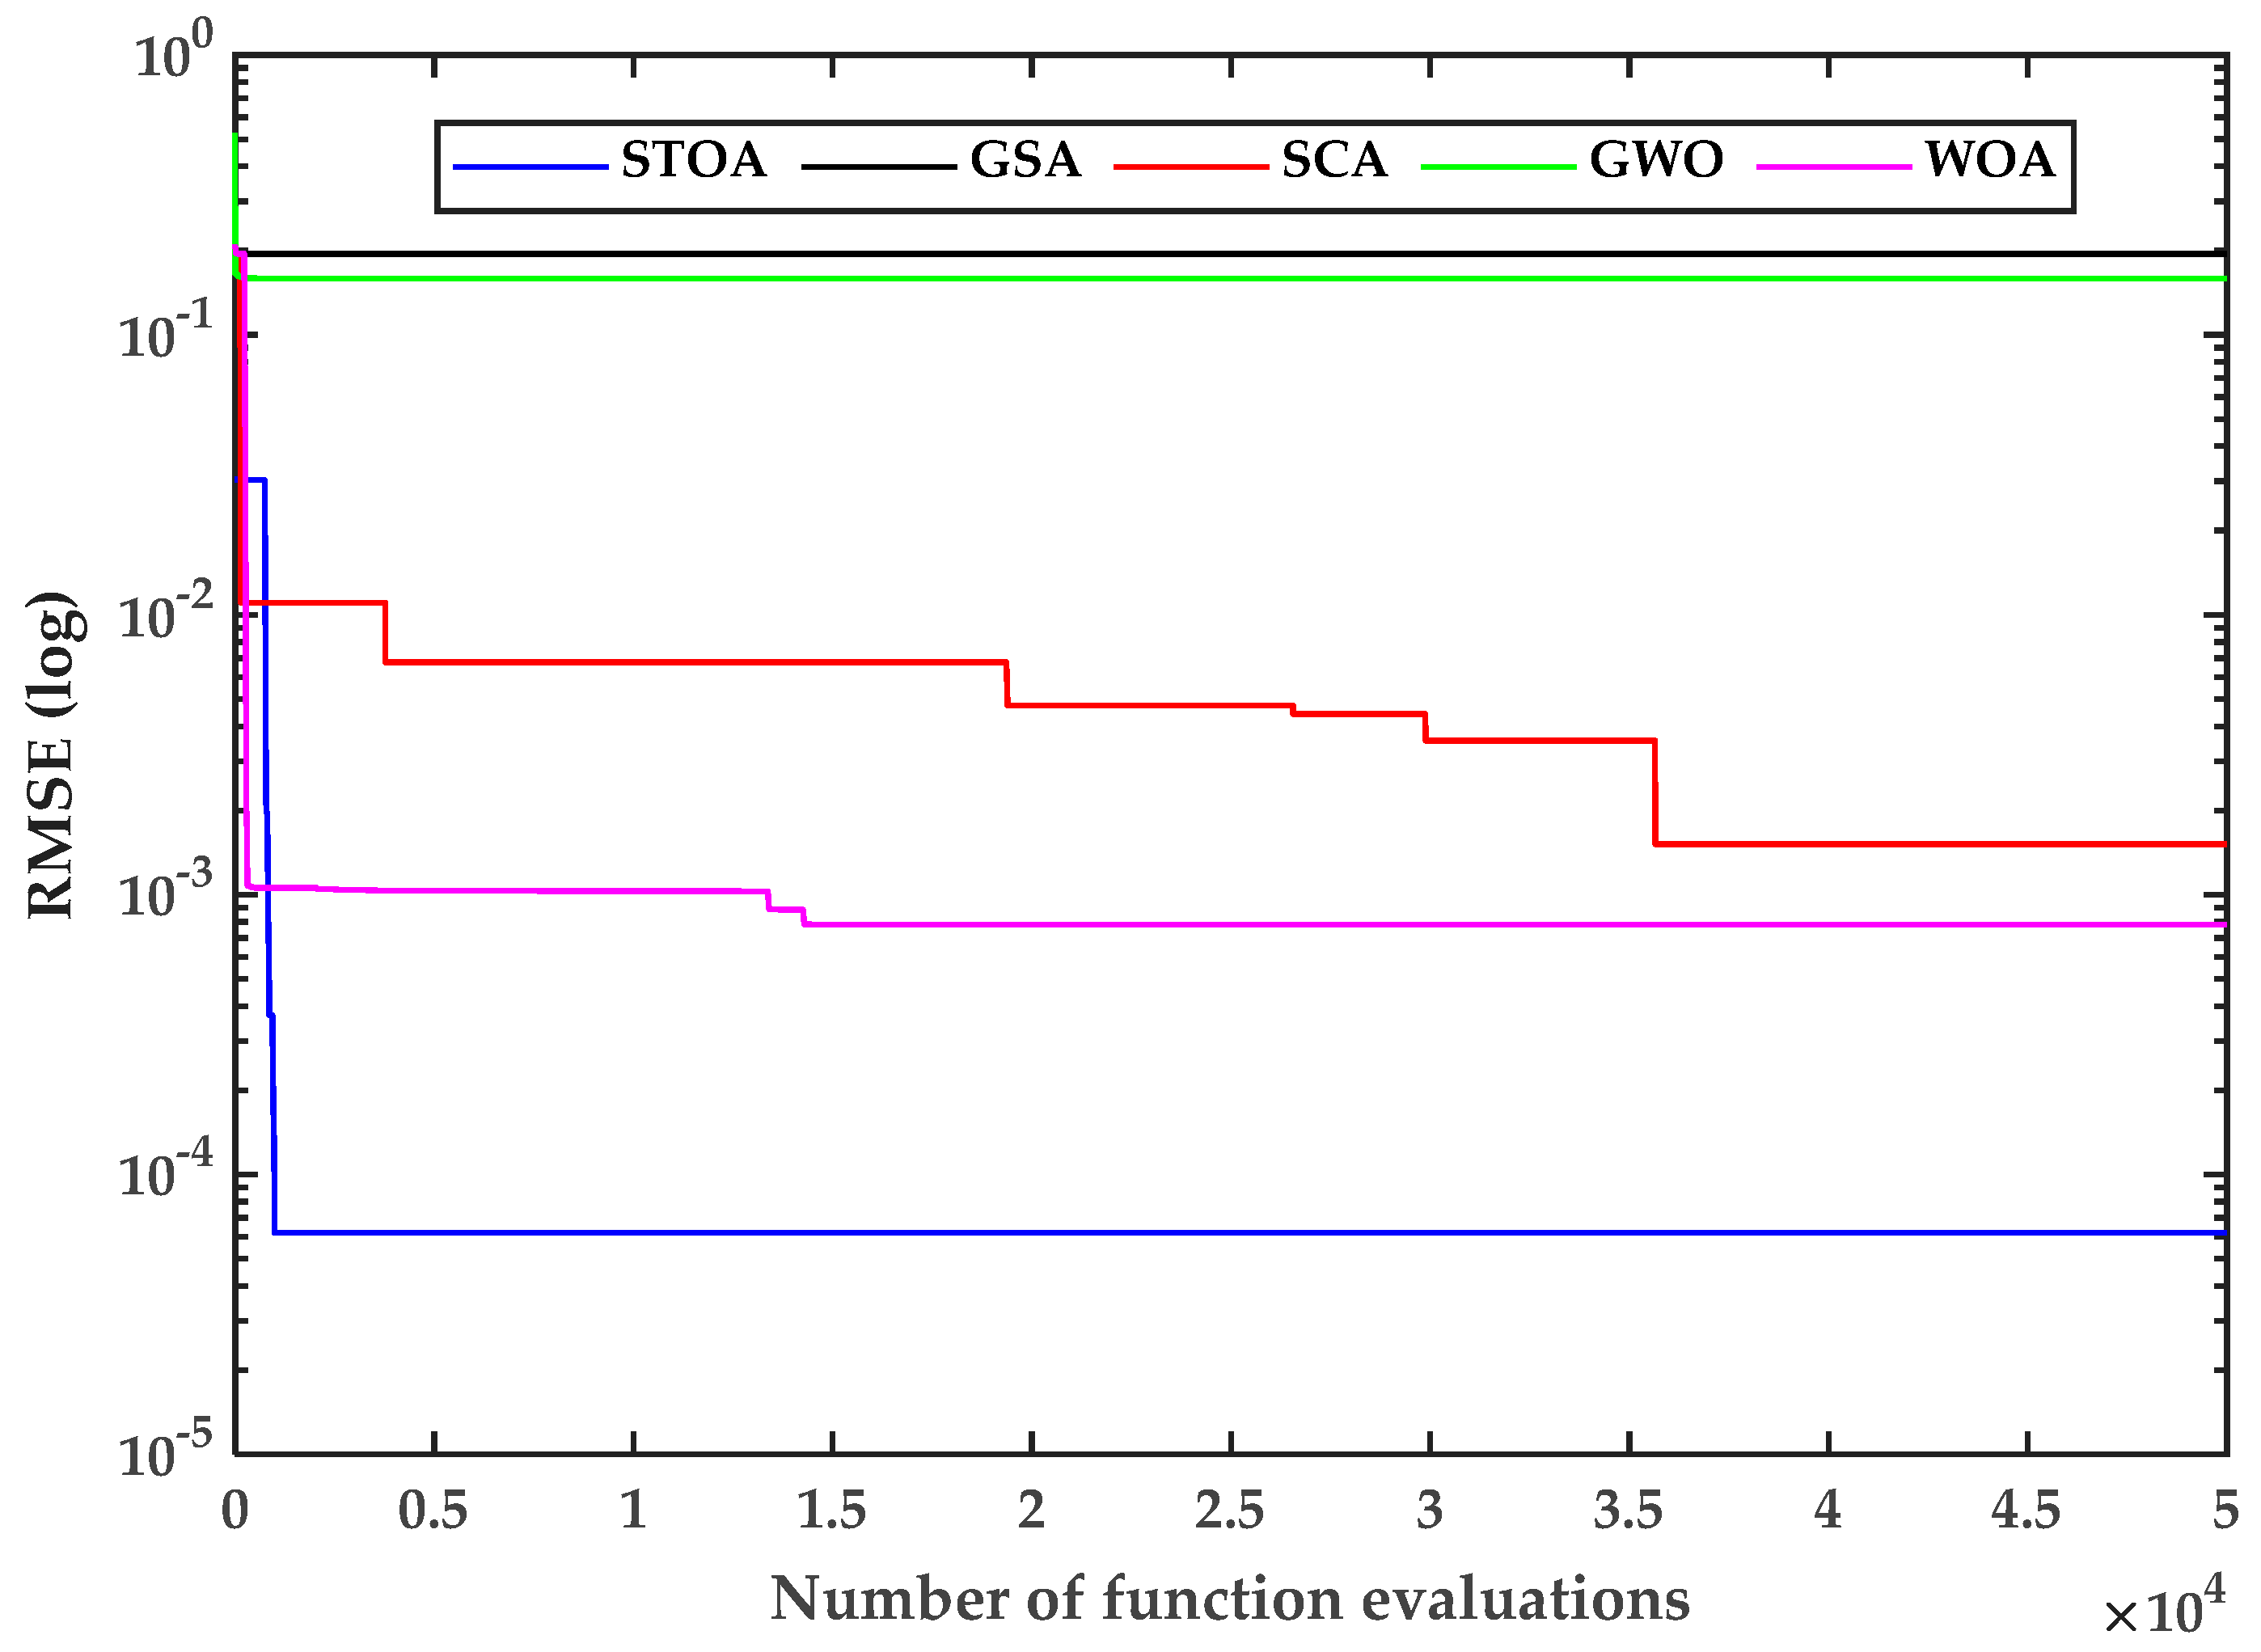
4.3. Convergence Analysis
Figure 5 and
Figure 6 depict the convergence curves of the R.T.C France solar cell and the SSS2018 polycrystalline PV cell for examining the computational competency of the STO. The convergence rate analysis shows that the STO algorithm is more accurate than the GSA, SCA, GWO, and WOA algorithms. Thus, the STO algorithm produces a realistic answer for the same amount of evaluation functions (i.e., 50,000).
4.4. Statistical and Robustness Analysis
This subsection offers statistical assessments of the mean, minimum, maximum, and standard deviation (SD) of RMSE for all recently created strategies. The accuracy and reliability comparison of the various algorithms in 30 runs is summarized in
Table 6. The RMSE mean and standard deviation were calculated to investigate the durability of the parameter estimation algorithms. According to the statistical data presented in
Table 6, the STO is found to be the most precise and trustworthy parameter optimization technique.
In addition to the conventional statistical analysis, we also applied the Friedman rank test [
47] to determine the relevance of the presented study. It is a nonparametric test which is employed to decide the rank of algorithms for the analysis of PV modules; lower the rank, better the algorithm.
Table 7 illustrates the Friedman ranking test results of different algorithms. The Friedman ranking test results show that the STO has the highest ranking compared to WOA, SCA, GWO and GSA. In the Friedman test, the null hypothesis
(
p-value > 5%) suggests that there are no noteworthy alterations among the compared algorithms. For all 30 runs, the contrary hypothesis
indicates a significant difference between the compared methods. Each algorithm is ranked in this test depending on its efficiency.


 ,
, 


