Article

Modified Yolov3 for Ship Detection with Visible and Infrared Images

1
Department of Communications, Navigation and Control Engineering, National Taiwan Ocean University, Keelung 202301, Taiwan
2
Department of Electrical Engineering, National Taiwan Ocean University, Keelung 202301, Taiwan
3
Department of Electrical Engineering, AI Research Center, National Taiwan Ocean University, Keelung 202301, Taiwan
4
Department of Electrical Engineering, National Taipei University of Technology, Taipei 106344, Taiwan
*
Author to whom correspondence should be addressed.
Electronics 2022, 11(5), 739; https://doi.org/10.3390/electronics11050739
Submission received: 15 February 2022 / Revised: 25 February 2022 / Accepted: 26 February 2022 / Published: 27 February 2022
(This article belongs to the Section Computer Science & Engineering)

Abstract

:
As the demands for international marine transportation increase rapidly, effective port management has become an important issue. Automatic ship recognition can facilitate the realization of smart ports, and improve the efficiency of port operation and management. In order to take into account the processing efficiency and detection accuracy at the same time, the study presented an improved deep-learning network based on You only look once version 3 (Yolov3) for all-day ship detection with visible and infrared images. Yolov3 network can simultaneously improve the recognition ability of large and small objects through multiscale feature-extraction architecture. Considering reducing computational time and network complexity with relatively competitive detection accuracy, the study modified the architecture of Yolov3 by choosing an appropriate input image size, fewer convolution filters, and detection scales. In addition, the reduced Yolov3 was further modified with the spatial pyramid pooling (SPP) module to improve the network performance in feature extraction. Therefore, the proposed modified network can achieve the purpose of multi-scale, multi-type, and multi-resolution ship detection. In the study, a common self-built data set was introduced, aiming to conduct all-day and real-time ship detection. The data set included a total of 5557 infrared and visible light images from six common ship types in northern Taiwan ports. The experimental results on the data set showed that the proposed modified network architecture achieved acceptable performance in ship detection, with the mean average precision (mAP) of 93.2%, processing 104 frames per second (FPS), and 29.2 billion floating point operations (BFLOPs). Compared with the original Yolov3, the proposed method can increase mAP and FPS by about 5.8% and 8%, respectively, while reducing BFLOPs by about 47.5%. Furthermore, the computational efficiency and detection performance of the proposed approach have been verified in the comparative experiments with some existing convolutional neural networks (CNNs). In conclusion, the proposed method can achieve high detection accuracy with lower computational costs compared to other networks.

1. Introduction

With the dramatic increase in the demand for international maritime trade, effective management of ports plays a pivotal role in many developing countries. In addition, real-time monitoring of ships to provide safe coastal areas is also an important issue when developing fishery economy and maritime transportation. As computer vision and artificial intelligence develop rapidly, the application of intelligence surveillance systems has been gradually used in various fields. Recently, ports are getting smarter through intelligent navigation, automation, and reducing the need for manpower. For instance, the target detection technology based on deep learning algorithms has attracted widespread attention in the field of autonomous ship navigation and intelligent ship monitoring [1]. Moreover, real-time detection of ships based on computer vision technology has greatly improved port management and maritime inspections [2].
Ship detection plays an important but challenging role in the field of image recognition. There are two types of data available for ship detection, radar images, and optical images. In general, radar images cover a wider range and optical images provide more detailed information. In the literature, Synthetic Aperture Radar (SAR) imagery [3,4,5] and optical images [6,7,8,9] have been widely used for ship detection methods. These studies conducted experiments in different complex backgrounds for SAR images and optical images, respectively. It was shown in [6] that the complex background will cause a lot of false alarms and even increase the computational time. Therefore, it is difficult to develop a suitable detection model for the complex ocean background characterized by rough surfaces, coastal areas, and river estuaries. Moreover, the utilization of SAR images is limited by noise response and low resolution. For example, the resolution of SAR images degrades the detection performance of small and densely distributed ships, especially for fishing vessels moored in ports. Furthermore, due to the time-consuming of image collection and preprocessing, it is difficult to use remote sensing data to achieve real-time ship detection.
With the rapid development of digital cameras, intelligent video surveillance systems are increasingly deployed in ports and coastal areas, which can be utilized for visible ship target detection. Through video surveillance, the port management system can automatically assign a suitable berthing position according to the ship detection results, which reduces ship waiting time and improves the throughput of berthing areas. This not only reduces the port operating cost but also improves the port service quality. Moreover, ship detection also plays an important role in coastal defense. In order to ensure the safety of coastal areas, the coast guard currently spends a lot of manpower in performing patrol and defense tasks. With the aid of ship detection, the coast guard can instantly understand the conditions of the coastal area. For example, ships smuggling or crossing the border can be detected by the video surveillance systems along the coastline. Therefore, the study used infrared and visible images for ship detection to monitor ships in the harbor day and night.
Clear and low-noise images are beneficial for subsequent object detection. However, real-world images are inevitably affected by noise, which may originate from adverse weather conditions, image acquisition chains, or image compression. These lead to the degradation of the obtained visual image. This degradation can be canceled or at least reduced by denoising preprocessing. In general, the image denoising methods can be divided into spatial domain methods and transform domain methods, such as kernel regression [10], nonlinear digital filters [11], and the most efficient denoising methods based on wavelets [12] of first-generation [13] or 2nd generation [14]. Such operations can not only improve the quality of the image, but also improve the performance of subsequent image processing (extraction of the desired information, prediction, classification, texture analysis, and segmentation).
In recent years, there have been several studies on ship detection using optical images [15,16,17]. Most algorithms contain three common processes, including region selection, feature extraction, and classification. Region selection [8] generally adopts the sliding window method to pass through the image globally. This causes a lot of computation redundancy, thus increasing processing time. Then, features of the target are extracted, which will affect the performance of subsequent target detection. There are some well-known feature extraction methods, such as local binary pattern (LBP) [15], scale-invariant feature transformations (SIFT) [18], and histogram of oriented gradients (HOG) [19], which need to be manually designed to obtain valuable features. In addition, the establishment of manual features relies too much on expert experience, and the generalization ability is weak. Based on the extracted features, targets are mapped and classified using a classifier, such as a support vector machine (SVM) [16,17,20] and Adaboost [6,21]. Most of the traditional ship detection methods were based on remote sensing data, which were captured from a top-down view. Therefore, the handcrafted features can be defined according to the ship’s aspect ratio, size, or scattering characteristics. In this paper, the ship images were taken by the camera in ports from different side-view angles. Even for the same ship type, different perspectives will lead to different ship characteristics. The traditional methods are limited by the manually designed object features and templates. For ship detection, the methods based on handcrafted features encounter bottlenecks in the case of ship targets with multiple scales, multiple types, and multiple side views, or under complex weather and ocean conditions [6,7]. When it is difficult to define object features by hand programming, machine learning provides a feasible solution to learn features from a large amount of observational data. Recently, computer vision based on deep learning and convolutional neural networks (CNNs) have been widely used in various fields, especially for object detection and classification. Semantic image features extracted by the deep CNNs (DCNNs) are robust to morphological changes, image noise, and relative object positions in visual images [22,23,24,25]. Therefore, this research was motivated to utilize an efficient deep learning network to achieve automatic feature extraction for machine learning. Ships of various sizes, shapes, and colors can be detected by deep learning methods with higher detection accuracy than traditional methods. However, it remains a challenge in detecting small or densely distributed ships, especially in ports.
However, many high-precision methods are computationally intensive. In recent years, the deep learning methods implemented on GPU have accelerated the computing speed of object detection [26,27,28,29,30]. Generally, there are two approaches for object detection based on deep learning: the one-stage method and the two-stage method. The two-stage approaches consist of two modules, DCNN, and region proposal network. The representative two-stage methods mainly include regional-based CNN (R-CNN) [30], Fast R-CNN [31], and Faster R-CNN [32]. For instance, Fan et al. [33] proposed the modified Faster R-CNN for ship detection using Polarimetric SAR (PolSAR) data, which was still difficult to detect in-shore small ships. The study [34] predicted ship navigation direction and detected dense ships through a detection model with multi-scale rotational R-CNN. The research [35] proposed a region of interest (ROI) method, which can achieve better small ship detection performance in SAR images by combining SVM and Faster R-CNN. Dong et al. [36] adopted a multi-angle box-based rotation in-sensitive structure of object detection to improve the R-CNN for very-high-resolution (VHR) ship images. The computational efficiency is still insufficient for real-time processing, even the detection performance of the two-stage approach is better than that of the traditional one. Subsequently, considering the requirement of fast processing in real-time object detection, the one-stage method was proposed to directly detect the category and position of the object by omitting the region proposal step. The main one-stage representative methods are Single Shot Multibox Detector (SSD) [37], Yolo [38], Yolov2 [39], Yolov3 [40], and Yolov4 [41]. In the literature, some studies have applied deep learning methods to ship detection in SAR imagery. For example, Wang et al. [42] improved the overall performance and detection accuracy on Sentinel-1 SAR images by using SSD to perform transfer learning. Zhang et al. [43] proposed a grid CNN (G-CNN) approach for real-time ship detection in SAR images, which had a faster detection performance by meshing the input images. Furthermore, studies [44,45] have proposed improved Yolo-based networks for ship tracking. Zhang et al. [45] solved the problems of missing and inaccurate localization through the combination of the HOG and LBP features by the ship detection method based on an optimized Yolo network. The study [44] realized the tracking and detection of ships in monitored marine areas by improving Yolov3 architecture based on Darknet.
In addition to the detection accuracy, improving the processing speed, reducing the model complexity, and adapting the ship detection model to the actual hardware conditions are of great significance to the system implementation. Considering the relatively balanced detection performance in processing time and detection accuracy of the Yolov3 algorithm [40], this paper utilized the Yolov3 architecture for the ship detection method by modifying the parameters and architecture of the network. In our previous study [46], the concept of modifying Yolov3 parameters for ship detection was proposed based on changing the input image size, the number of filters in the convolutional layer, and the detection scale. Compared with [46], this study further modified the Yolov3 network by using a spatial pyramid pool (SPP) module to improve feature extraction. More complete experiments have been conducted, such as selecting a more appropriate input image size for ship detection and comparing the proposed approach with other deep learning networks. In addition, the built dataset has been augmented and images of different complex backgrounds, ship types, and target scales have been used to verify the ship detection method in this paper. Experimental results showed that the proposed modified network achieved low computational complexity and robustness in real-time ship detection.
The rest of the paper was organized as follows. The framework of Yolo networks was given in Section 2. Section 3 described the details of the modified method. Section 4 presented the self-built ship data set and the experimental results. Finally, some conclusions were drawn in Section 5.

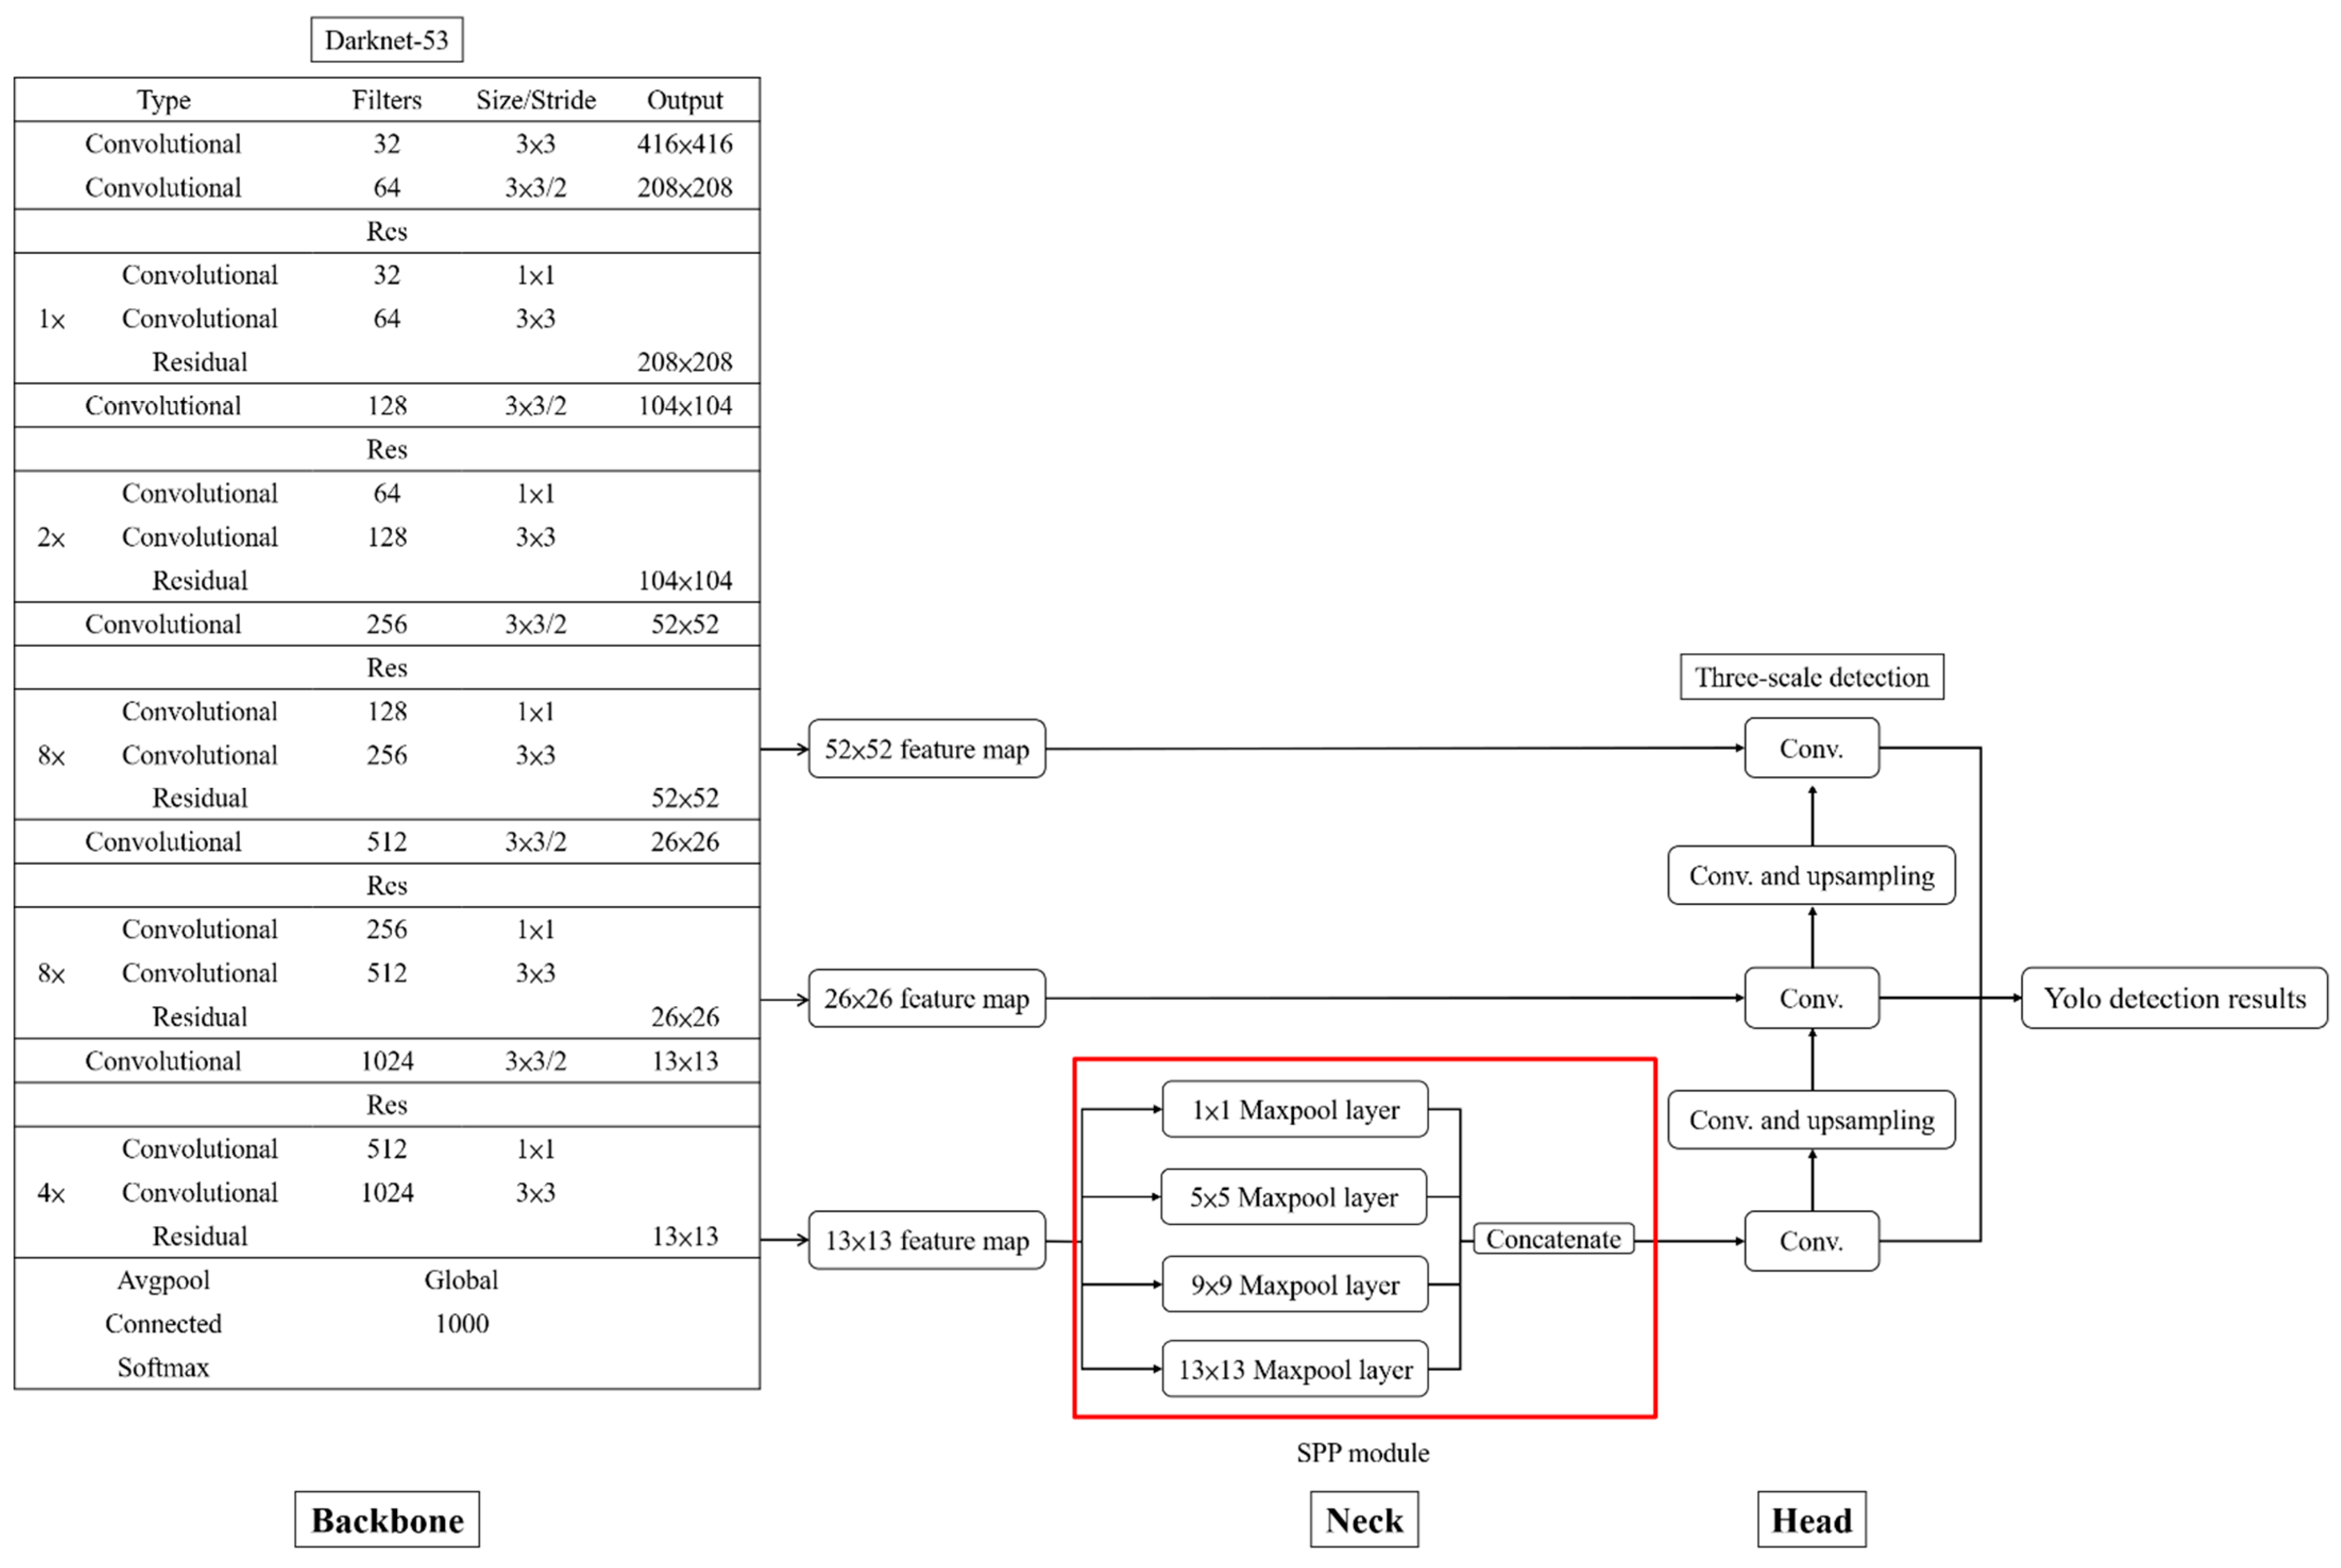
2. Yolov3 Network Architecture

Yolo, one of the popular end-to-end object detection networks, consists of the architecture of backbone and detection layers. The input image of the Yolo network is split into square grid cells of size S × S. The cell is responsible for detecting the object whose center falls within the cell. Each cell can predict N bounding boxes. For each box, there are 5+C predictions, including box size (h, w), box center coordinates (x, y), confidence score, and C class probabilities. h and w are the height and width of the bounding box. x and y represent the coordinates of the box center relative to the grid cell. The parameter C denotes the number of object categories in the dataset. The confidence score represents the likelihood that the bounding box is correct and is defined in Equation (1).
Box   Confidence = P r ( Object ) IoU ( truth predict )
In (1), P r ( Object ) denotes the probability of an object contained in the bounding box. IoU ( truth predict ) represents the intersection over union (IoU) between the ground truth and the predicted box, as shown in Equation (2).
IoU ( truth predict ) = ( box predict box truth ) ( box predict box truth )
IoU is often used to evaluate the accuracy of an object detector. For an IoU greater than the defined IoU threshold, it means that the prediction of a bounding box containing an object is “correct”. IoU is useful when assigning anchor boxes during training dataset preparation and when cleaning multiple prediction boxes for the same object using the non-maximum suppression algorithm. The default IoU threshold is usually assigned to 0.5, which is at least half of the ground truth, and the predicted box covers the same region.
Yolov1 is generally reported as having a faster network speed and less computation time. However, its detection accuracy is lower than other popular one-stage algorithms, such as SSD and Faster R-CNN. Compared with Yolov1, Yolov2 has significant improvements in computational efficiency and detection performance. Many improvements were proposed inYolov2. The fully connected layers were replaced by the convolutional layers, and the concept of anchor boxes was introduced. To match objects of different shapes and sizes, the anchors are usually set according to the size of the object in the training data set. Instead of computing class probabilities for each cell as in Yolov1, the class probabilities are calculated for each anchor box in Yolov2. In addition, the backbone network architecture of Yolov2 is Darknet-19.
Subsequently, Yolov3 was proposed to further improve the detection performance of the previous versions. The improvements include the multiscale detector, backbone network, and loss function. Through the Feature Pyramid Network (FPN), Yolov3 makes full use of CNN to generate three scaled feature maps for the prediction. Thus, Yolov3 is a multiscale detector that can find targets of various sizes in a single image. For example, when the size of an input image is 352 × 352, the three feature maps with sizes of 11 × 11, 22 × 22, and 44 × 44 are respectively responsible for detecting targets with large, medium, and small scales. Yolov3 provides nine anchor boxes, three for each scaled feature map, for object detection. These improvements make the network have better performance, especially for the small objects’ detection, but it takes more processing time. Besides, a deeper Darknet-53 backbone network was applied in Yolov3, which adopted the latest technologies such as up sampling, skip connections, and residual blocks. Darknet-53 consists of 53 convolutional layers for feature extraction and five residual blocks. The residual block was introduced to solve the problem of vanishing gradients with the depth increasing, greatly improve the computational efficiency, and facilitate the training procedure of deeper convolutional neural networks. Although Yolov3 improves the detection accuracy, it has a slower processing speed than Yolov2, which uses a lightweight Darknet-19 backbone.
In Yolov3, the loss function includes three kinds of errors, namely coordinate prediction error, IoU error, and classification error. The coordinate prediction error describes the localization accuracy of the bounding box and is defined as:
Error coord = λ coord i = 1 s 2 j = 1 B I ij obj [ ( x i x ¯ i ) 2 + ( y i y ¯ i ) 2 ] + λ coord i = 1 s 2 j = 1 B I ij obj [ ( w i w ¯ i ) 2 + ( h i h ¯ i ) 2 ]
λ coord is the weight of the coordinate error. s 2 is the number of grid cells per detection layer and B is the number of the bounding boxes in each grid cell. I ij obj indicates whether a target lies in the j-th bounding box of the i-th grid cell. ( x i ,   y i ,   h i ,   w i ) and ( x ¯ i ,   y ¯ i ,   h ¯ i ,   w ¯ i ) represent the center coordinate, height, and width of the ground truth and predicted box, respectively. The IoU error indicates the degree of overlap between the ground truth and the predicted box, which is given by
Error IoU = i = 1 s 2 j = 1 B I ij obj [ ( C i C ¯ i ) 2 ] + λ noobj i = 1 s 2 j = 1 B I ij noobj [ ( C i C ¯ i ) 2 ]
λ noobj is the confidence penalty that the prediction box does not contain an object. C i and C ¯ i represent the true and predicted confidence, respectively. Classification error represents the accuracy of classification. It can be defined as:
Error cls = λ coord i = 1 s 2 j = 1 B I ij obj c ϵ classes ( p i ( c ) p ^ i ( c ) ) 2
c represents the class to which the detected target belongs. p i ( c ) and p ^ i ( c ) refer to the true probability and predicted value of the target, respectively. Combining the above errors, the loss function of Yolov3 is expressed as:
Loss = Error coord + Error IoU + Error cls

3. Methodology

3.1. Proposed Modified Yolov3 Network Architecture

The proposed modified network architecture in this paper was based on the Yolov3 network. First, the study chose the anchor box size that was more suitable for the self-built ship data set in network training. The anchor boxes originally proposed in Faster R-CNN were used to detect multiple objects in one grid cell. Then, the Yolo matched the ratio of width to height of objects by anchor boxes. In Yolo, the width and height of anchor boxes were obtained based on the Pascal VOC [47] and COCO [48] data sets. Since those data sets contained various types of objects, the defined anchor box size was not suitable for the ship data set in this research. Based on the ship-type characteristics in the built ship data set, this research obtained the appropriate anchor boxes by the K-means [49] algorithm. Since the prediction layer of the Yolov3 network contains three anchor boxes for each scale, it is necessary to partition the sizes of bounding boxes into nine categories. In order to acquire optimal sizes of anchor boxes, the width and height of the bounding box are selected as the clustering features in K-means. In the clustering process, the bounding box size of each target in the dataset is divided into nine clusters according to the feature similarity, which is measured by the IoU value between the current anchor box and the bounding box. Then, the anchor box size is updated by the mean value of each cluster. These processes are performed iteratively until the centroid of each cluster does not change. Since the selected anchor boxes are much closer to the ship shapes in the ship data set, these anchor boxes can speed up the network training. The size of anchor boxes obtained by K-means were (14,21), (26,36), (47,38), (62,59), (91,77), (73,113), (130,109), (105,170), (186,172), which were applied in the following experiments.
Next, the study evaluated the influence of the input image size on the detection performance of the Yolo-based networks. For this purpose, the study examined the efficiency of networks with different input image sizes, from 288 × 288 to 512 × 512. Generally, the larger the input image size, that is, the larger the feature map in the deep learning network, the more features, and details of the image can be retained. Although the detection accuracy is better when the input image size increases, the computational complexity also increases. In order to achieve better detection performance and computational efficiency at the same time, the research will select the appropriate input image size in ship detection.
The multiscale detection module powerfully helps the Yolo network search and detect objects of different scales in the same image. However, the more complex the entire deep learning network, the longer the computation time required for object detection. In addition, with the refinement of the grid, more retained image details will increase the detection accuracy, but at the same time, more training and prediction times will reduce the computational efficiency. Considering the trade-off between detection accuracy and computation time, appropriate detection scales not only simplify network architecture but also improve detection performance. Therefore, it is important to choose an appropriate network scale for specific object detection, such as ships. The study will consider three combinations of detection scales, one of which has all three scales, another retains medium and small target scales (removing the large target scale), and the other only has the small target scale. Experiments will examine the ship detection efficiency of these three combinations.
Finally, the influence of the convolution filters on the network performance was considered. More convolutional filters mean more weights in the deep learning network, which can improve the detection accuracy of the network, but also increase the computational burden of the system. Since the built ship dataset includes only six types of ships, choosing an appropriate number of filters will improve the efficiency of storage and system implementation of the proposed Yolov3 network architecture. Therefore, this study examined the ship detection performance by reducing the filters of the convolutional layers in Darknet-53, the backbone of Yolov3. For example, when a 20% filter reduction was performed, the number of filters of 32 and 64 in the convolutional layers of the first residual block, shown in Figure 1, would be reduced to 26 and 52, respectively. The experiments in the next section showed that an appropriate number of filters can reduce the computational complexity of the system, improve the classification speed, and maintain the detection accuracy at the same time.

3.2. Spatial Pyramid Pooling

Spatial pyramid pooling (SPP) [50,51] is one of the most popular approaches for vision recognition. The SPP module divides each feature map into several different grid sizes (such as 4 × 4, 2 × 2, 1 × 1) and then performs the maximum pooling operation on each grid. After the maximum pooling, three feature maps with dimensions of 16 × C, 4 × C, and 1 × C will be generated for a C-dimensional input feature map. Then, the three feature maps are able to generate a fixed-length output feature map regardless of the input size and will connect to the following fully connected layers. Thus, regardless of the input dimension, the SPP module provides fixed-dimensional output, which was impossible in the previous networks using sliding windows. Due to the flexibility of the input dimensions, SPP can incorporate the functionality obtained in variable dimensions.
Moreover, SPP extracts the main spatial information of the feature map and performs stitching, which is a feature enhancement module. The receptive field of a single neuron is gradually increasing as the convolutional layers of the Yolov3 network are deepened during the feature extraction process. At the same time, the feature extraction capability has also been improved, and the extracted features have become more abstract. If the shape of the object’s feature map is blurred, the spatial information of the small object will be inaccurate at this time. Experimental results show that when using Yolov3 to detect multiple ships in one image, the phenomenon of missed detections will happen and the ship detection performance will be greatly reduced. Due to the enhanced feature extraction capability of SPP, the study proposed a modified Yolov3 network that adopts the SPP module to improve the performance of Yolov3 in multiple ship targets detection. As shown in Figure 1, the SPP module is added between the Darknet-53 backbone and FPN. The feature maps are pooled in different scales by different sliding windows, of which the sizes are 1, 5, 9, and 13 in local spatial bins, respectively. The stride of max-pooling is set to 1 and the padding is utilized to keep the size of the output feature maps unchanged. Then, these four feature maps concatenate and input to the subsequent detection layer. Experiments verified that the proposed modified Yolov3 has improved the ship detection performance, especially for blurred images with densely distributed ships.

4. Dataset and Experiment Results

The study conducted a series of experiments on the self-built ship data set and compared the proposed method with other state-of-the-art detectors to verify the efficiency of our approach in this section. All experiments were performed on a PC equipped with 16 GB of memory and Intel Core i7-8700k, with 10GB memory of NVIDIA RTX3080 and using cuDNN 8.0.4 with CUDA 11.0. The operating system was 64-bit Ubuntu 18.04. The study adopted the Darknet [52] framework to train the deep learning models. In training, the number of iterations was set as 20,000. The batch and subdivisions were set to 64 and 16, respectively. The study trained the network model with the stochastic gradient descent (SGD) [53] method. The learning rate of the approach decreased from 0.001 to 0.0001 after 16,000 steps and 0.00001 after 18,000 steps.

4.1. Ship Dataset

The lack of both visible and infrared images required to perform all-day ship detection in common datasets must be addressed. Therefore, the results of previous studies [22,23,24,25] cannot be compared because every approach utilizes a different dataset and no common basis for comparison is established. In order to compare the effectiveness of the proposed method with other ship detection methods, this study first constructed a ship data set composed of 5027 visible and 530 infrared images. Most of the ship images were taken from harbors and coastal areas in northeastern Taiwan and were captured by the SONY AX700 camera equipped with an infrared lens. The effective pixels of SONY AX700 are approximately 14.20 megapixels. Due to the COVID-19 epidemic, it was difficult to obtain some images of ships, such as cruises. The insufficient ship images were supplemented by Google search. There were six types of ships contained in the data set, including container ships, cruise ships, warships, yachts, sailboats, and fishing boats. The number of images of each ship type in the data set was summarized in Table 1. Figure 2 showed some samples in the ship data set. Each image in the data set first manually marked the border and labeled the ground truth of the object. The study used the LabelImg open source project on GitHub [54], which is currently the most widely used annotation tool. In the experiments, the ship data set was divided into 70% (3890), 20% (1111), and 10% (556) for the training set, verifications set, and testing set, respectively. In addition, to further improve the generalization ability of the model and increase the samples of the dataset, the data augmentation method was carried out by random changes in angle, saturation, exposure, and hue, to prevent overfitting. During the model training process, the results of the training set and the validation set were compared to check whether it was overfitting. When the training loss converges, but the mAP of the validation set decreases, it can be known that the overfitting has occurred. In addition, the model with the best weight was automatically selected after the training process was completed, even if the iteration exceeded the early stopping point. Moreover, to evaluate the performance of the proposed method for ship detection in videos, SONY AX700 recorded three video clips involving the aforementioned ship types in the Mpeg-4 video format. In the following experiments, the number of frames processed by the object detection algorithm was evaluated through these videos.

4.2. Evaluation Methods

In the study, the metrics including IoU, precision, recall, F1-score and mean Average Precision (mAP), frames per second (FPS), and billion floating point operations (BFLOPs) were utilized to evaluate the detection performance of the proposed modified network. The effectiveness of the predicted bounding box is determined according to whether the IoU is greater than the specified threshold [55]. In the experiment, the IoU threshold was set to 0.5. Precision, recall rate, and F1-score are common performance indicators for evaluating object detectors. Precision (P) refers to the ratio of true ships to all ships predicted by the network. Recall (R) refers to the proportion of true ships predicted by networks among all true ships. F1-score is a comprehensive indicator that combines precision and recall to evaluate the performance of different networks. The calculation formulas of the abovementioned indicators are as follows:
Precision = TP TP + FP
Recall = TP TP + FN
F1-score = 2 × Precision × Recall Precision + Recall
where TP (True Positive) represents samples that are actually positive and predicted to be positive; FP (False Positive) represents samples that are actually negative but predicted to be positive; FN (False Negative) refers to samples that are actually positive but predicted to be negative; TN (True Negative) refers to samples that are actually negative and predicted to be negative.
Average precision (AP) value is usually used as a performance index for object detection. It represents the accuracy of the model in a specific category, which can be calculated by the area under the Precision-Recall (P-R) curve, as shown in Equation (10),
AP = 0 1 P ( R ) dR
Moreover, to evaluate the precision of all categories, the mean AP (mAP), is often used as a performance measure for the network.
Frames per second (FPS) represents the number of frames processed by the detection method in one second. It is also an important metric for evaluating the real-time performance of the object detector. Besides the above performance metrices, BFLOPs represent the number of operations required by the detection algorithm and can be used as an indicator to evaluate the complexity of the network.

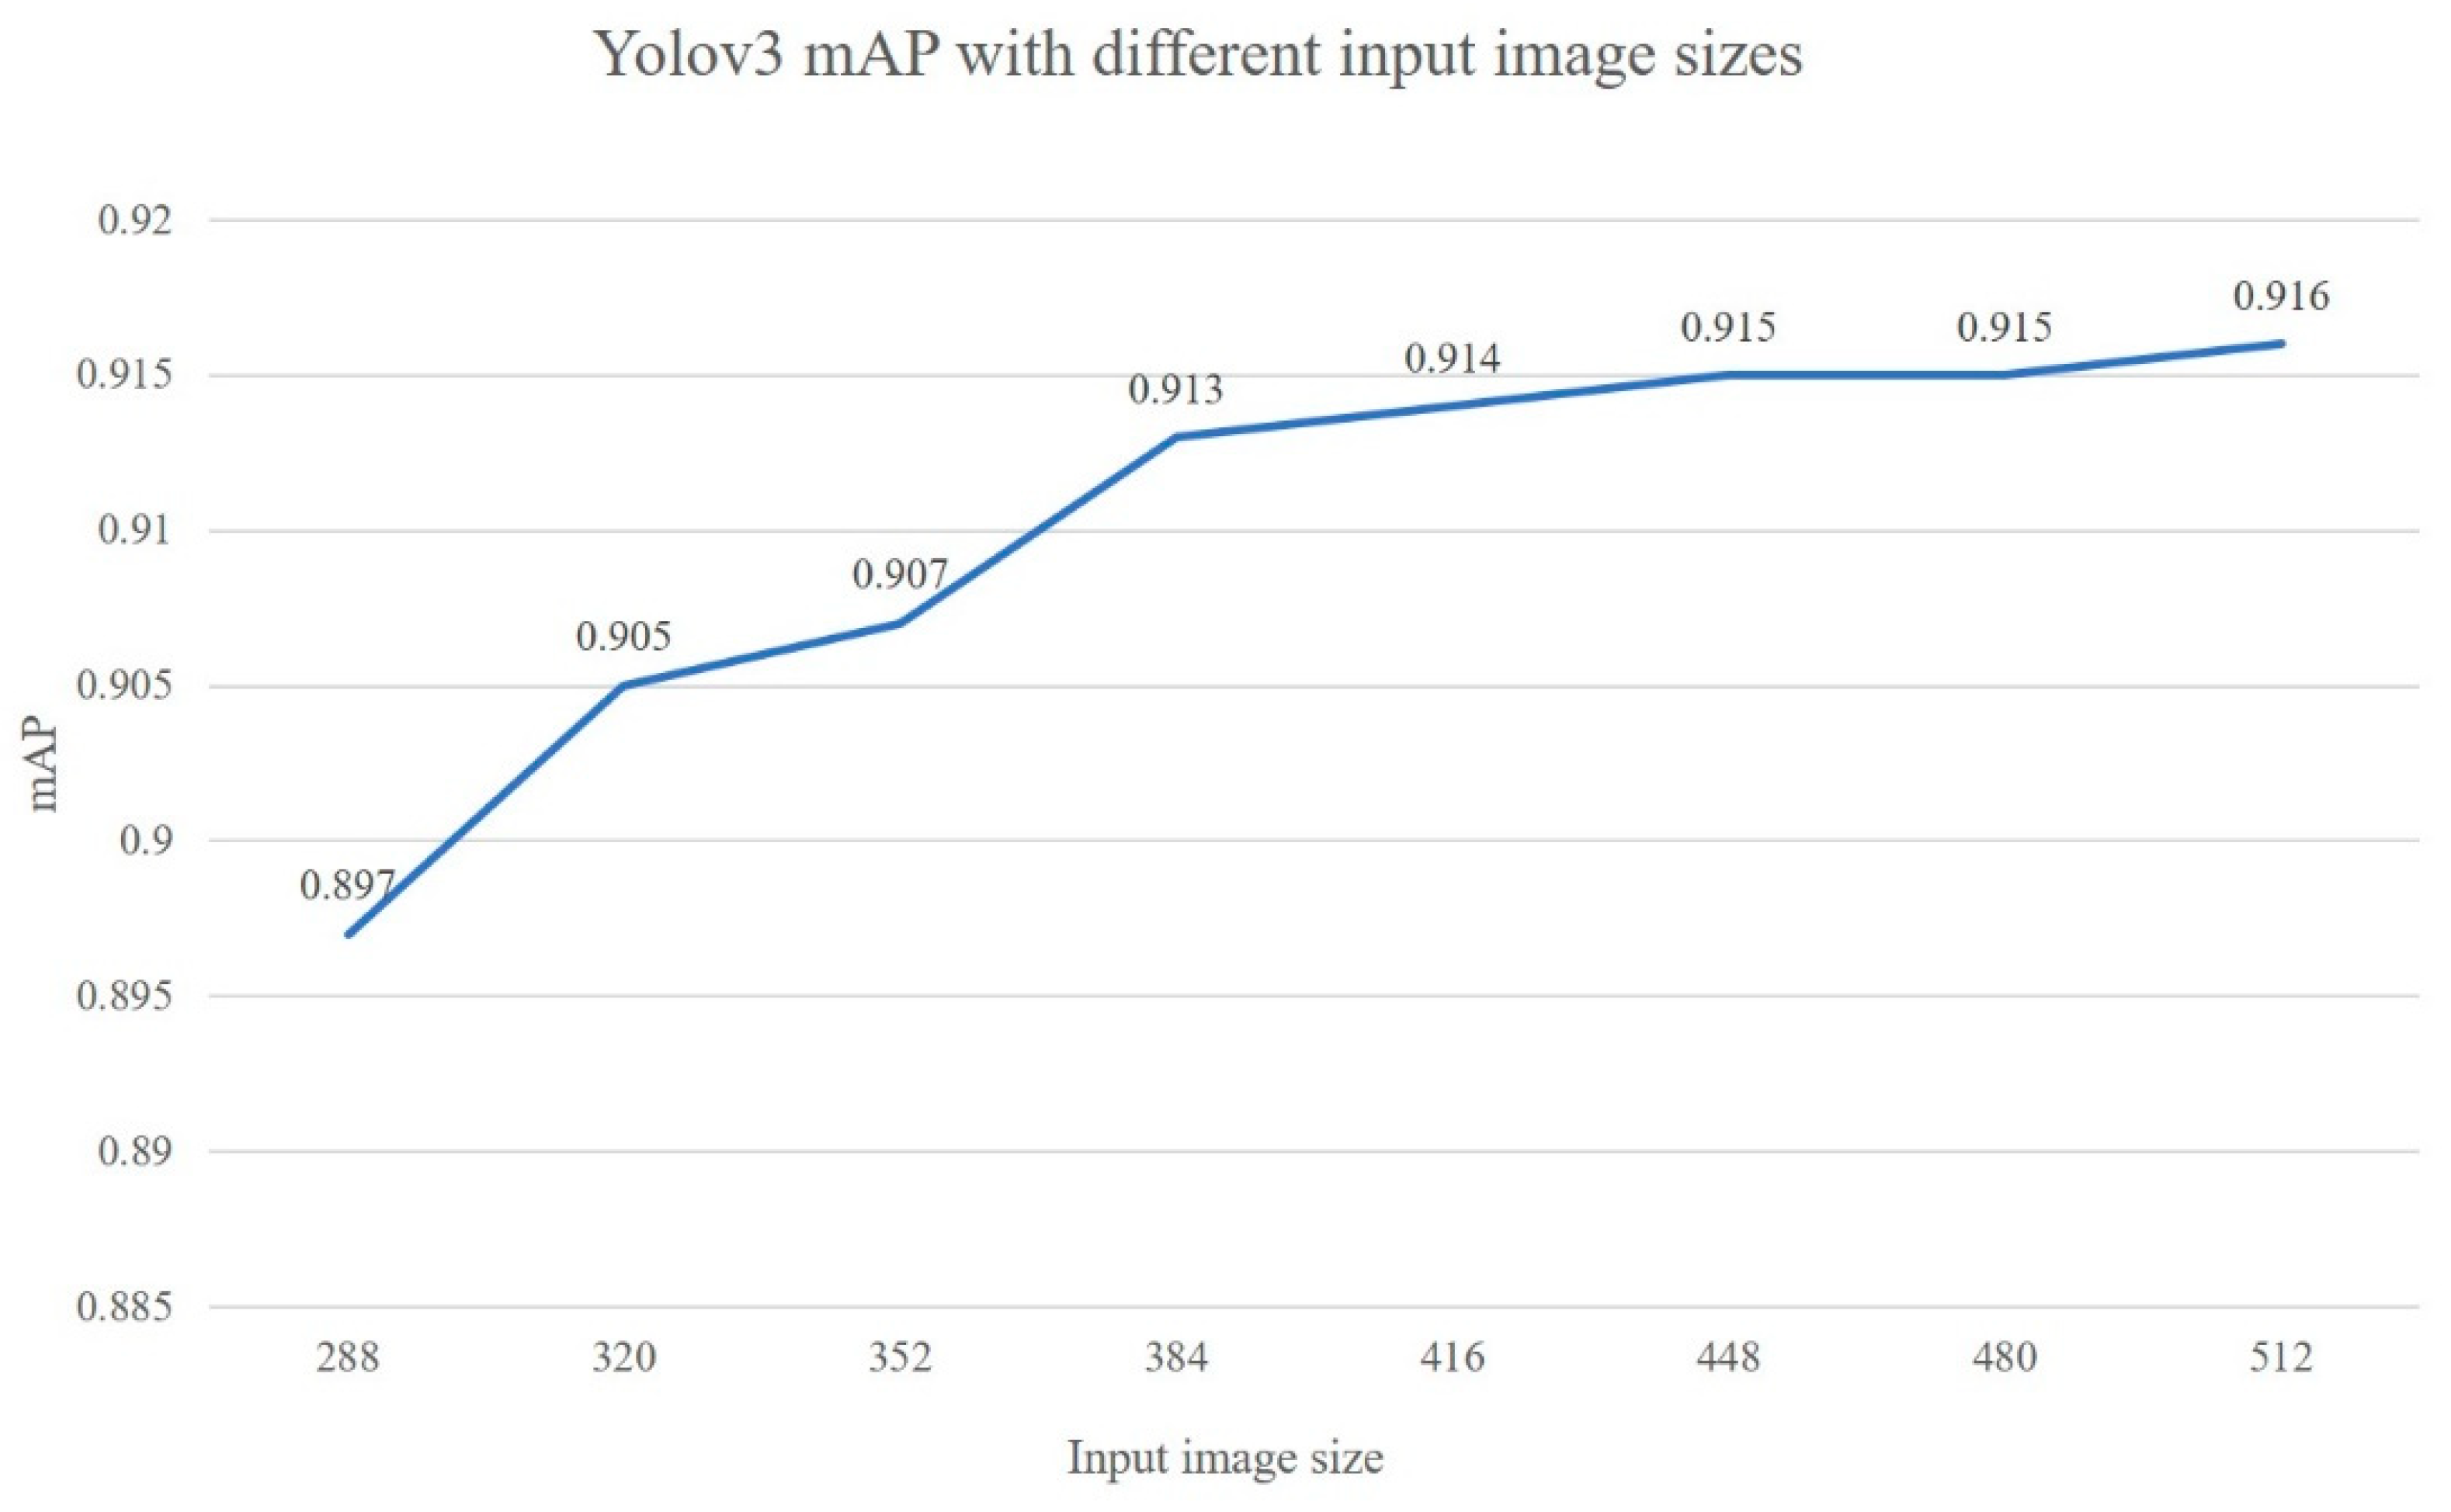
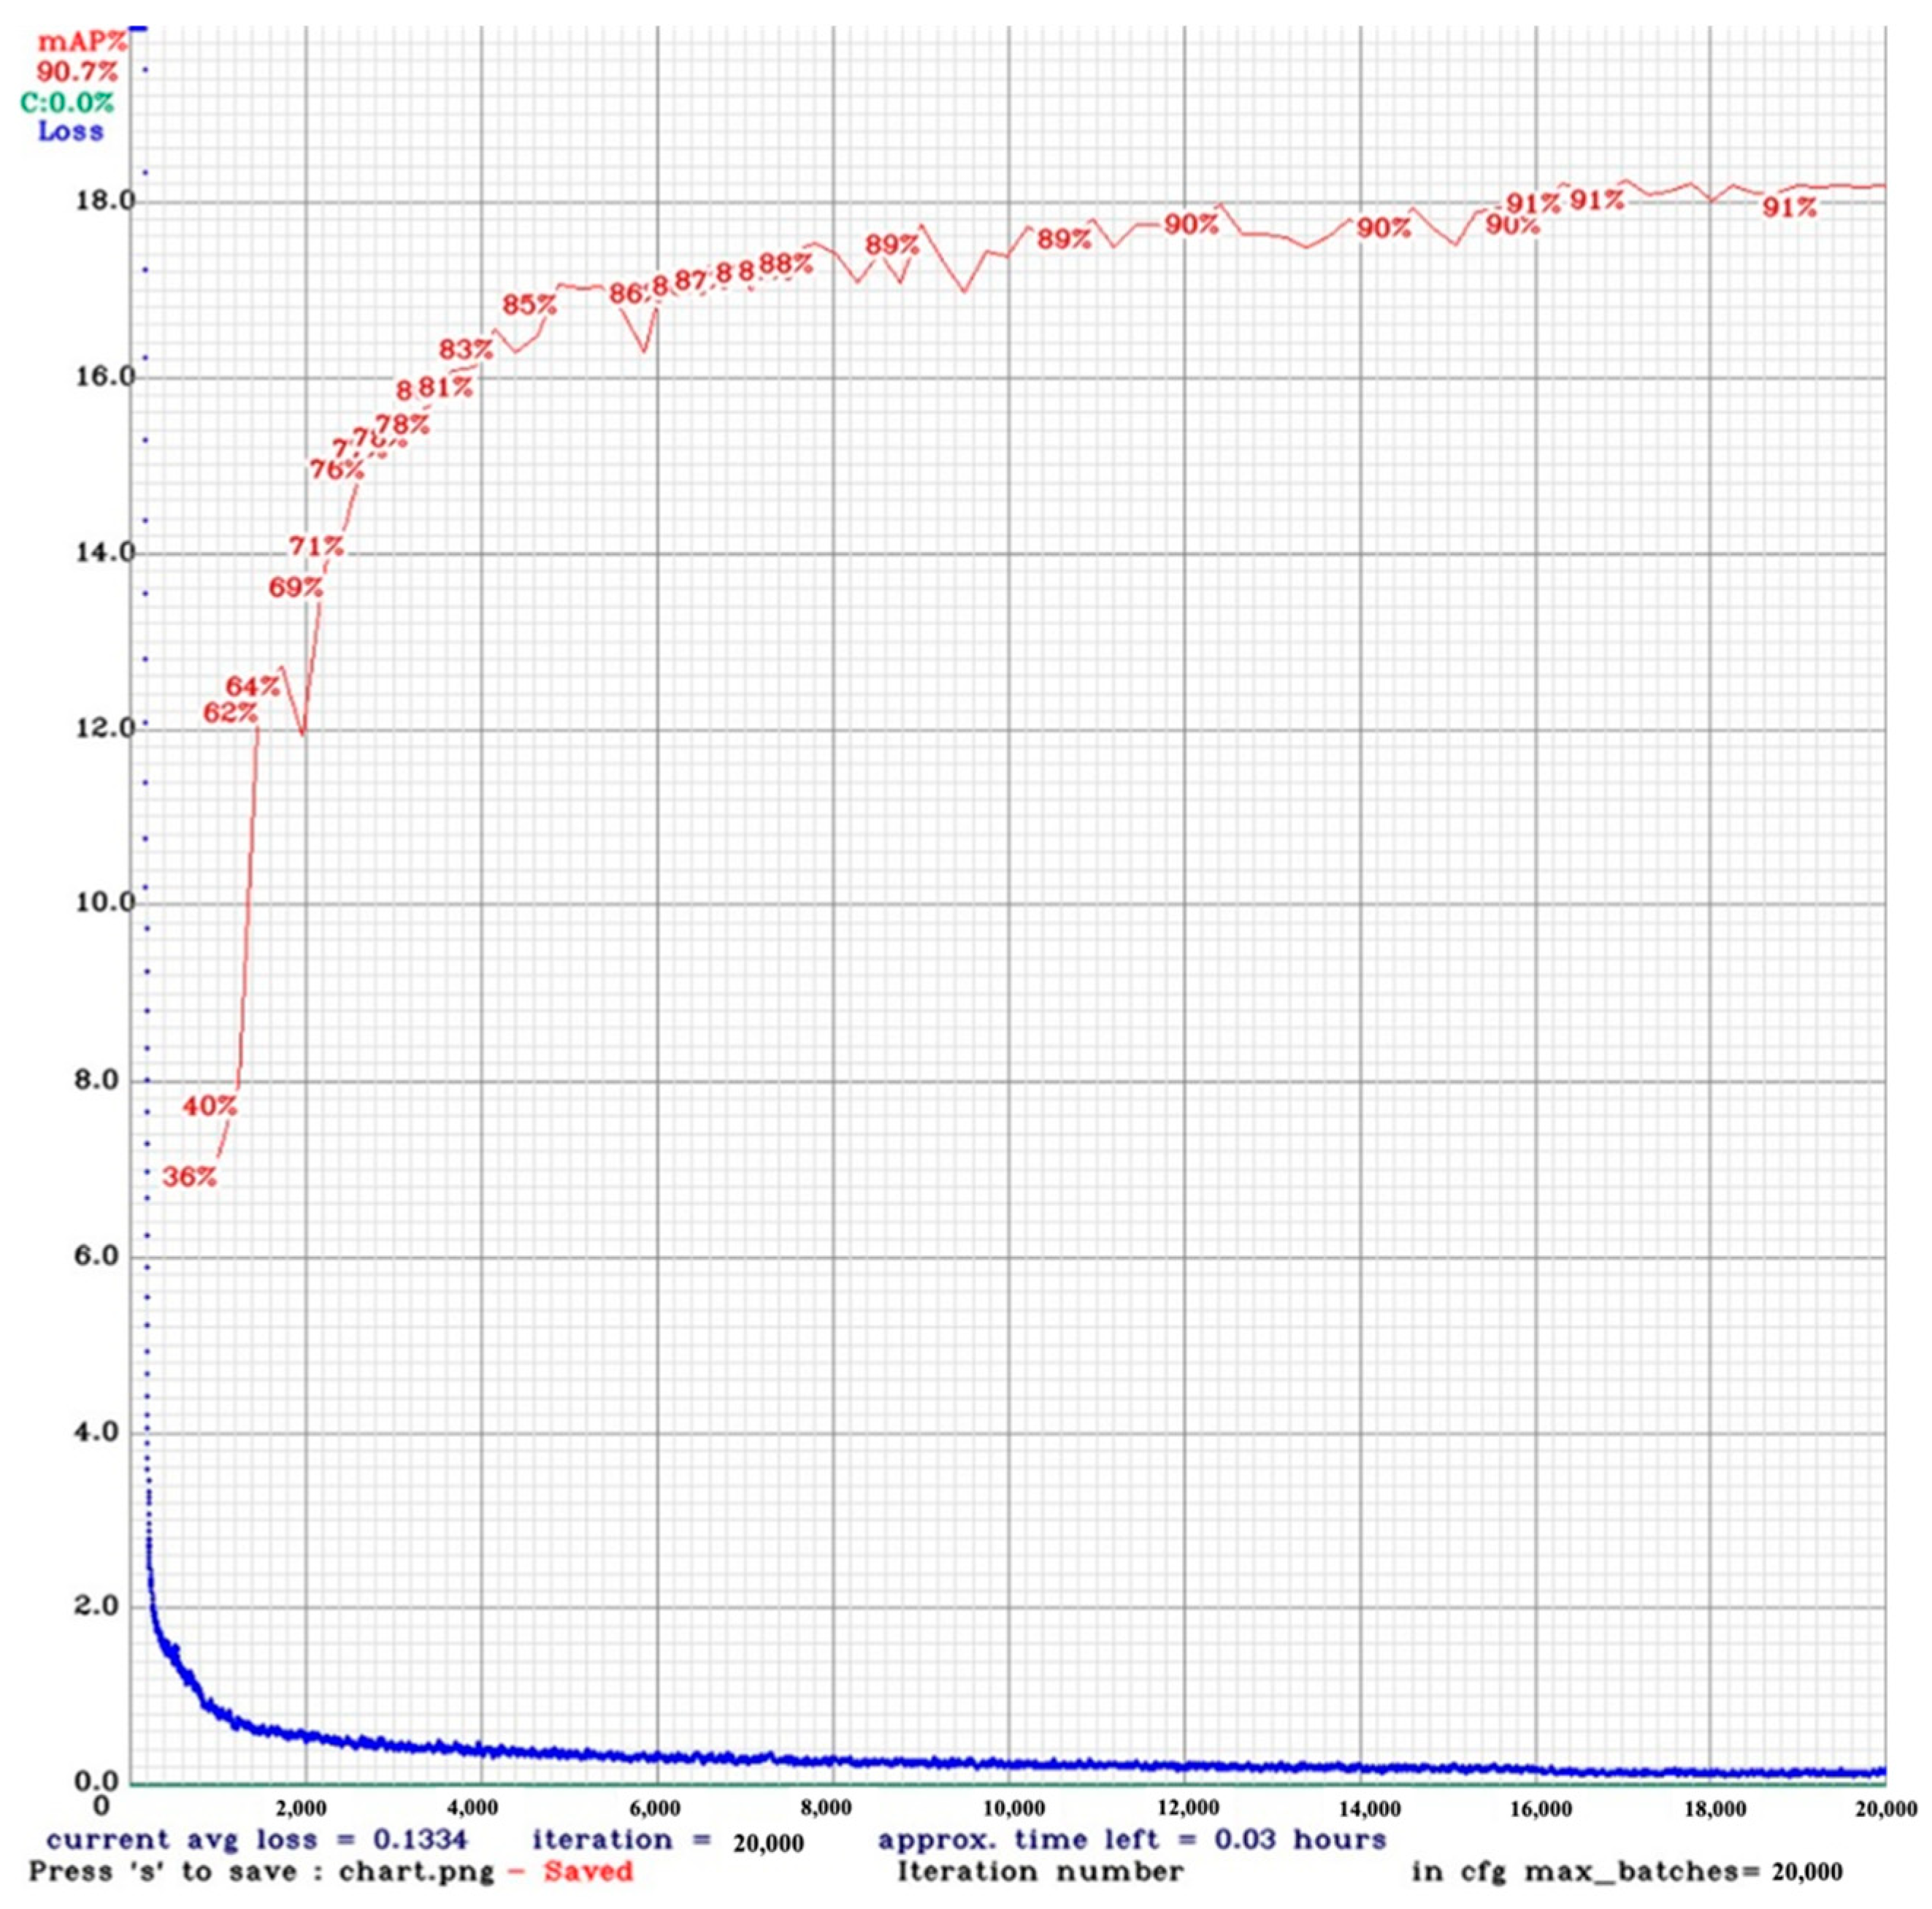
4.3. Modified Yolov3 Performance

In this experiment, the study compared the performance of the modified Yolov3 with different parameters, including input image sizes, detection scales, and the number of convolution filters.
First, ship detection experiments were conducted to evaluate the impact of the input image size on Yolov3 performance. In the experiment, the detection scales and convolution filters were maintained as those in the original Yolov3. Figure 3 displayed the mAP values of Yolov3 with input image sizes varying from 288 to 512. It can be observed that the mAP of Yolov3 has increased from 89.7% to 91.6%. However, the mAP only slightly increased when the input image size was larger than 384. In addition to mAP, other performance metrics BFLOPs and FPS were evaluated for simulation schemes with an input image size of 352 × 352, 384 × 384, 416 × 416, and 448 × 448. These results were presented in the first block of Table 2. It can be observed that the input image size has a great influence on the computational complexity of the network architecture. Although the mAP is higher when the input image size increases, the required operations BFLOPs increase relatively. In general, the larger the image size, the higher the mAP of the ship detection. Comparing the results in Table 2, the mAP of the 384 × 384 image can remain above 91% which was only 0.2% and 0.1% lower than the mAP of the 416 × 416 and 448 × 448 images, respectively. Whereas, the BFLOPs of the 384 × 384 image was 55.7, which was about 85% and 73% of the BFLOPs required for the 416 × 416 and 448 × 448 images, respectively. Considering the computational efficiency and mAP, the study selected the input image size to be 384 × 384 for the following experiments.
Next, the experiments were performed to examine the influence of the detection scales of Yolov3 on ship detection. The input image size was 384 × 384, and the convolution filters remained the same as those in the original Yolov3. Three combinations of detection scales were considered in the experiment: (1) with all three scales, (2) with two detection scales for medium and small targets (removing the large target scale), and (3) with only the small target scale. The detection performance of the three combinations was compared in the second block of Table 2. For the two detection scales combination scheme (2), the mAP was 90.8%, which was 0.5% lower than the mAP of Yolov3 with all detection scales (as shown in the first block of Table 2); and the BFLOPs was 51, which was about 91% of the operations required in Yolov3 with all detection scales. Although the mAP of the two detection scales decreased slightly, it still remained above 90%. Therefore, the simulation schemes of 384 × 384 image size and two detection scales (for medium and small targets) were considered in the following experiments.
Finally, the impact of reducing convolutional filters on network performance was examined. In the experiment, the network with 20%, 30%, and 40% filter reduction was considered. Moreover, the input image size was 384 × 384, and the network preserved two detection scales for small and medium targets. The detection performance was shown in the third block of Table 2. It can be observed that the Yolov3 with 30% filter reduction had a better performance, with 90.7% mAP and 28.9 BFLOPs. Compared with the network without reducing the convolutional filters, the network with 30% filter reduction had better calculation efficiency with similar ship detection performance. The BFLOPs of the network with 30% filter reduction have been reduced to 43.3% of the operations required by the network with all filters retained, while the mAP remained above 90%.
According to the above experimental results, the proposed Yolov3 modified the network parameters, in which the input image size was 384 × 384, the detection module retained two scales of small and medium targets, and the convolution filters were reduced by 30%. The modified Yolov3 greatly reduced the computation cost while maintaining ship detection accuracy, with 90.7% mAP and 28.9 BFLOPs. Moreover, the FPS of the modified Yolov3 was up to 106.2, which is about 9.6% higher than the original Yolov3. Figure 4 showed the training process of this modified Yolov3 model. It can be observed that after completing 20,000 iterations, the modified Yolov3 has reached an accuracy of more than 90%, with a loss of 0.13.
In the following, the detection accuracy of various types of ships in the testing data was studied for the Yolov3 network with different parameters. The study examined the effect of input image size, detection scales, and convolution filters on ship detection accuracy by the same three simulation schemes as Table 2. The corresponding results were shown in the first, second, and third blocks of Table 3, respectively.
Considering the effect of image size, it can be observed that the network with the input image size of 448 × 448 had better performance for every type of ship. The detection accuracy of 416 × 416 and 384 × 384 image sizes was very close, only about 2% lower than the detection accuracy of 448 × 448 image size. In fact, the larger the input image size, the better the detection accuracy, but the computational burden of the network also increases. In order to reduce the computational complexity, the research tried to select a moderate image size and used a network with appropriate detection scales and convolution filters. Based on the results of the second block of Table 3, when selecting the input image size of 384 × 384 and using the network with two detection scales and all convolution filters, the detection accuracy of ships has improved and the mAP reached 89.9%, which was 0.1% higher than the mAP corresponding to the input image size of 448 × 448. Finally, the results in the third block of Table 3 also verified that an appropriate number of convolutional filters would further improve the accuracy of ship detection. For the network with 30% filter reduction, mAP was up to 92.8%, which was 2.9% higher than the 89.9% mAP of the abovementioned network with all convolution filters.
The experimental results validated that the modified Yolov3, with input image size 384 × 384, two detection scales, and a 30% filter reduction in the convolutional layer, can achieve higher ship detection accuracy, superior performance, and better calculation efficiency than the original Yolov3 network.

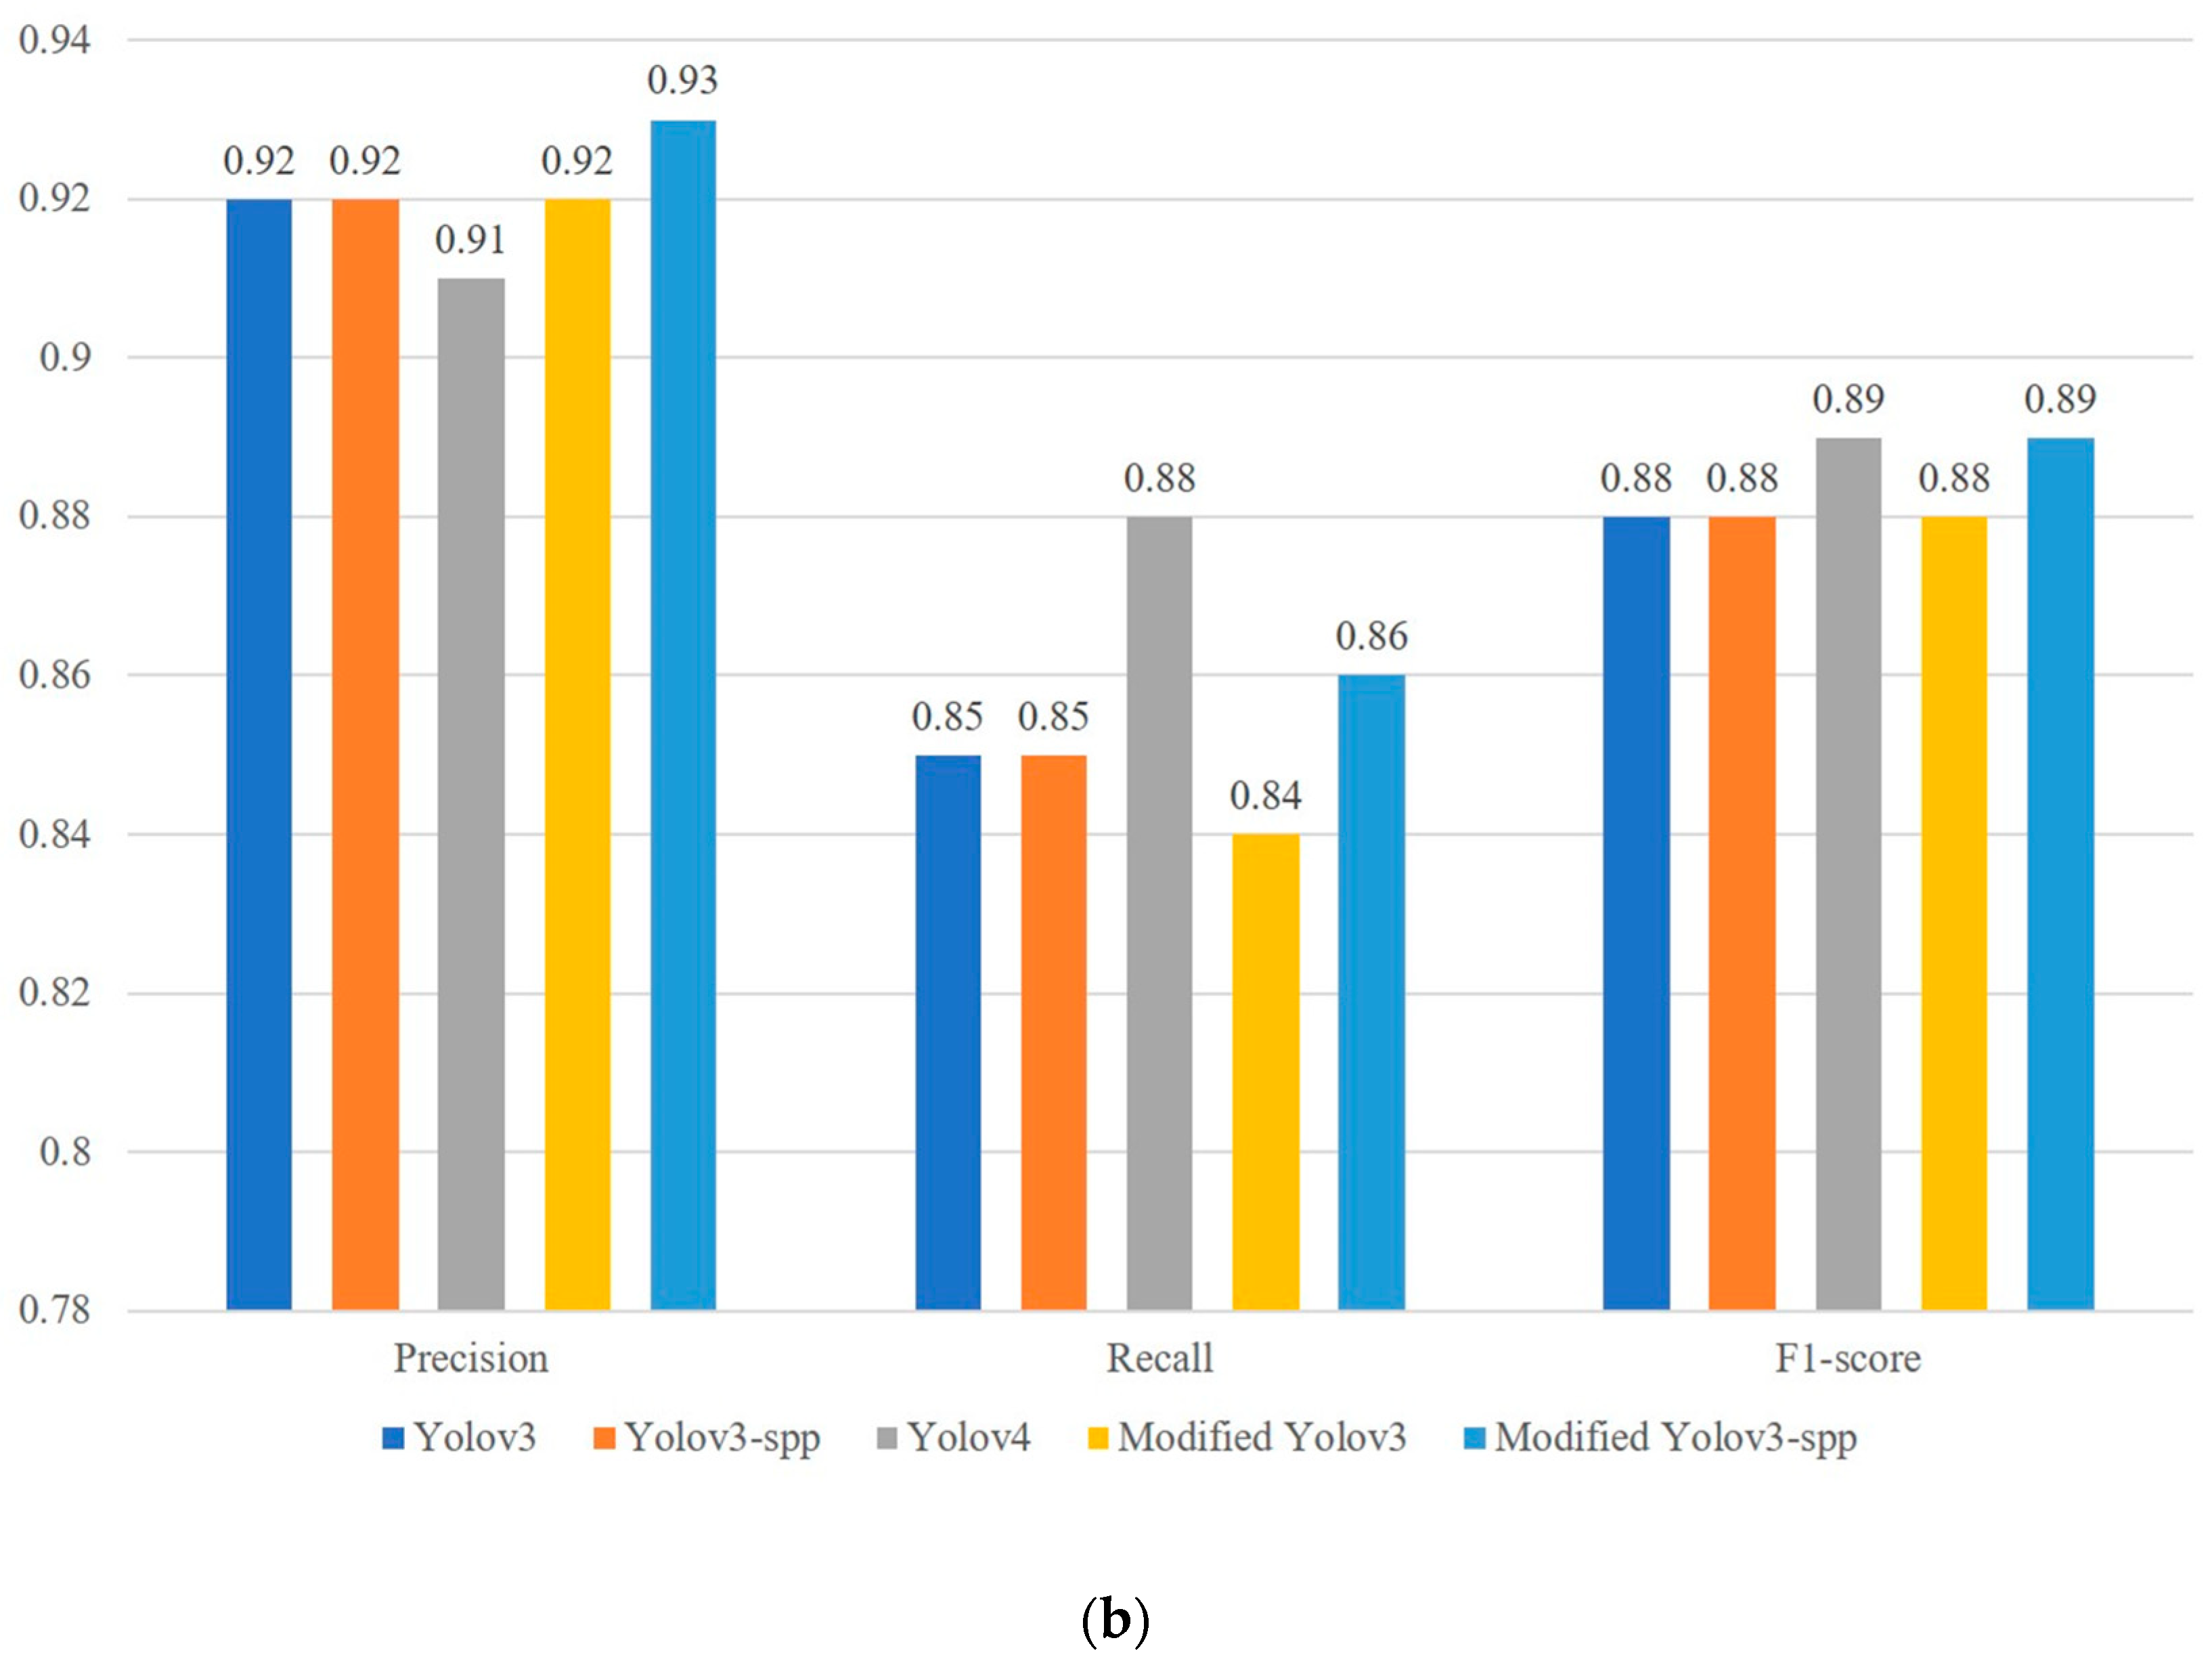
4.4. Network Comparison

Next, the study compared the detection performance of the proposed modified Yolov3 with the other CNN network architectures, including SSD, EfficientDet [56], ResNet152 [57], Yolov2, Yolov3-spp (which is Yolov3 with SPP module [51]), Yolov4, and tiny Yolo (which is a light and fast version of Yolo network). In the experiment, the input image size for all networks was fixed to 384 × 384. In addition, the study also added the SPP module to the modified Yolov3 to further improve the proposed network, called the modified Yolov3-spp, as shown in Figure 1. Table 4 summarized the performance evaluation of different network architectures from the training data. Yolov3 and Yolov4 can achieve better detection performance, with mAP greater than 90%. Although ResNet152 had an acceptable detection accuracy with 85.4% mAP, its BFLOPs was 86.5, which was the highest among all networks. In the Yolo-based models, the tiny Yolo networks provided poor detection results but had BFLOPs less than 5. This is not unexpected, since the tiny version of the Yolo model was designed to implement a fast object tracking system. Finally, the two proposed improved networks can achieve a mAP greater than 90%, which was close to the detection accuracy of the original Yolov3 networks. In particular, the mAP of the proposed modified Yolov3-spp was 93%, which was slightly lower than the mAP of Yolov4. However, the BFLOPs of the two proposed modified networks were both less than 30, which was almost 52% and 57% of the operations required by the original Yolov3 and Yolov4 networks. In addition, the FPS of the proposed modified networks was greater than 100, which was about 10 FPS faster than the original Yolov3 and Yolov4 networks.
In addition, Figure 5 showed the detection performance comparison between the proposed modified Yolov3 and other high detection efficiency methods, including Yolov3, Yolov3-spp, and Yolov4. It can be observed that the modified Yolov3-spp had better performance with high detection accuracy, low computational complexity, and fast processing speed.
Then, the detection results of the proposed modified Yolov3 and other CNN networks by using testing data were shown in Table 5. Yolov2-tiny and EfficientDet had poor detection results, with mAP of 64.8% and 61.9%, respectively. The detection accuracy of SSD was similar to that of Yolov2, and the mAP was about 76%. The reason for the poor detection efficiency was that the network cannot extract effective features from multiscale images, while the Yolov3 applied the FPN technique to address this problem. The mAP of Yolov3-spp has improved by 1.4% compared to the original Yolov3. The proposed modified Yolov3 and modified Yolov3-spp can improve the detection performance, with mAP of 92.8% and 93.2%, which were 5.4% and 4.4% higher than the original Yolov3 networks, respectively. Among Yolo-based models, Yolov4 achieved the highest detection performance, reaching 94.3% mAP. The mAP of the proposed modified Yolov3-spp was 1.1% lower than that of Yolov4, which was due to the slightly lower detection accuracy of the proposed approach for small vessels such as fishing boats. The precision and recall of Yolov4 were 0.2 lower and 0.2 higher than the proposed method, respectively. Both Yolov4 and the proposed method had an F1-score of 0.89. However, the BFLOPs of the proposed modified Yolov3-spp were only 57.5% of the required operations of Yolov4.
In summary, compared with other networks, the proposed modified Yolov3-spp can provide high detection accuracy and high calculation efficiency for ship detection. The results in Table 4 and Table 5 verified the superior performance of the proposed modified networks.

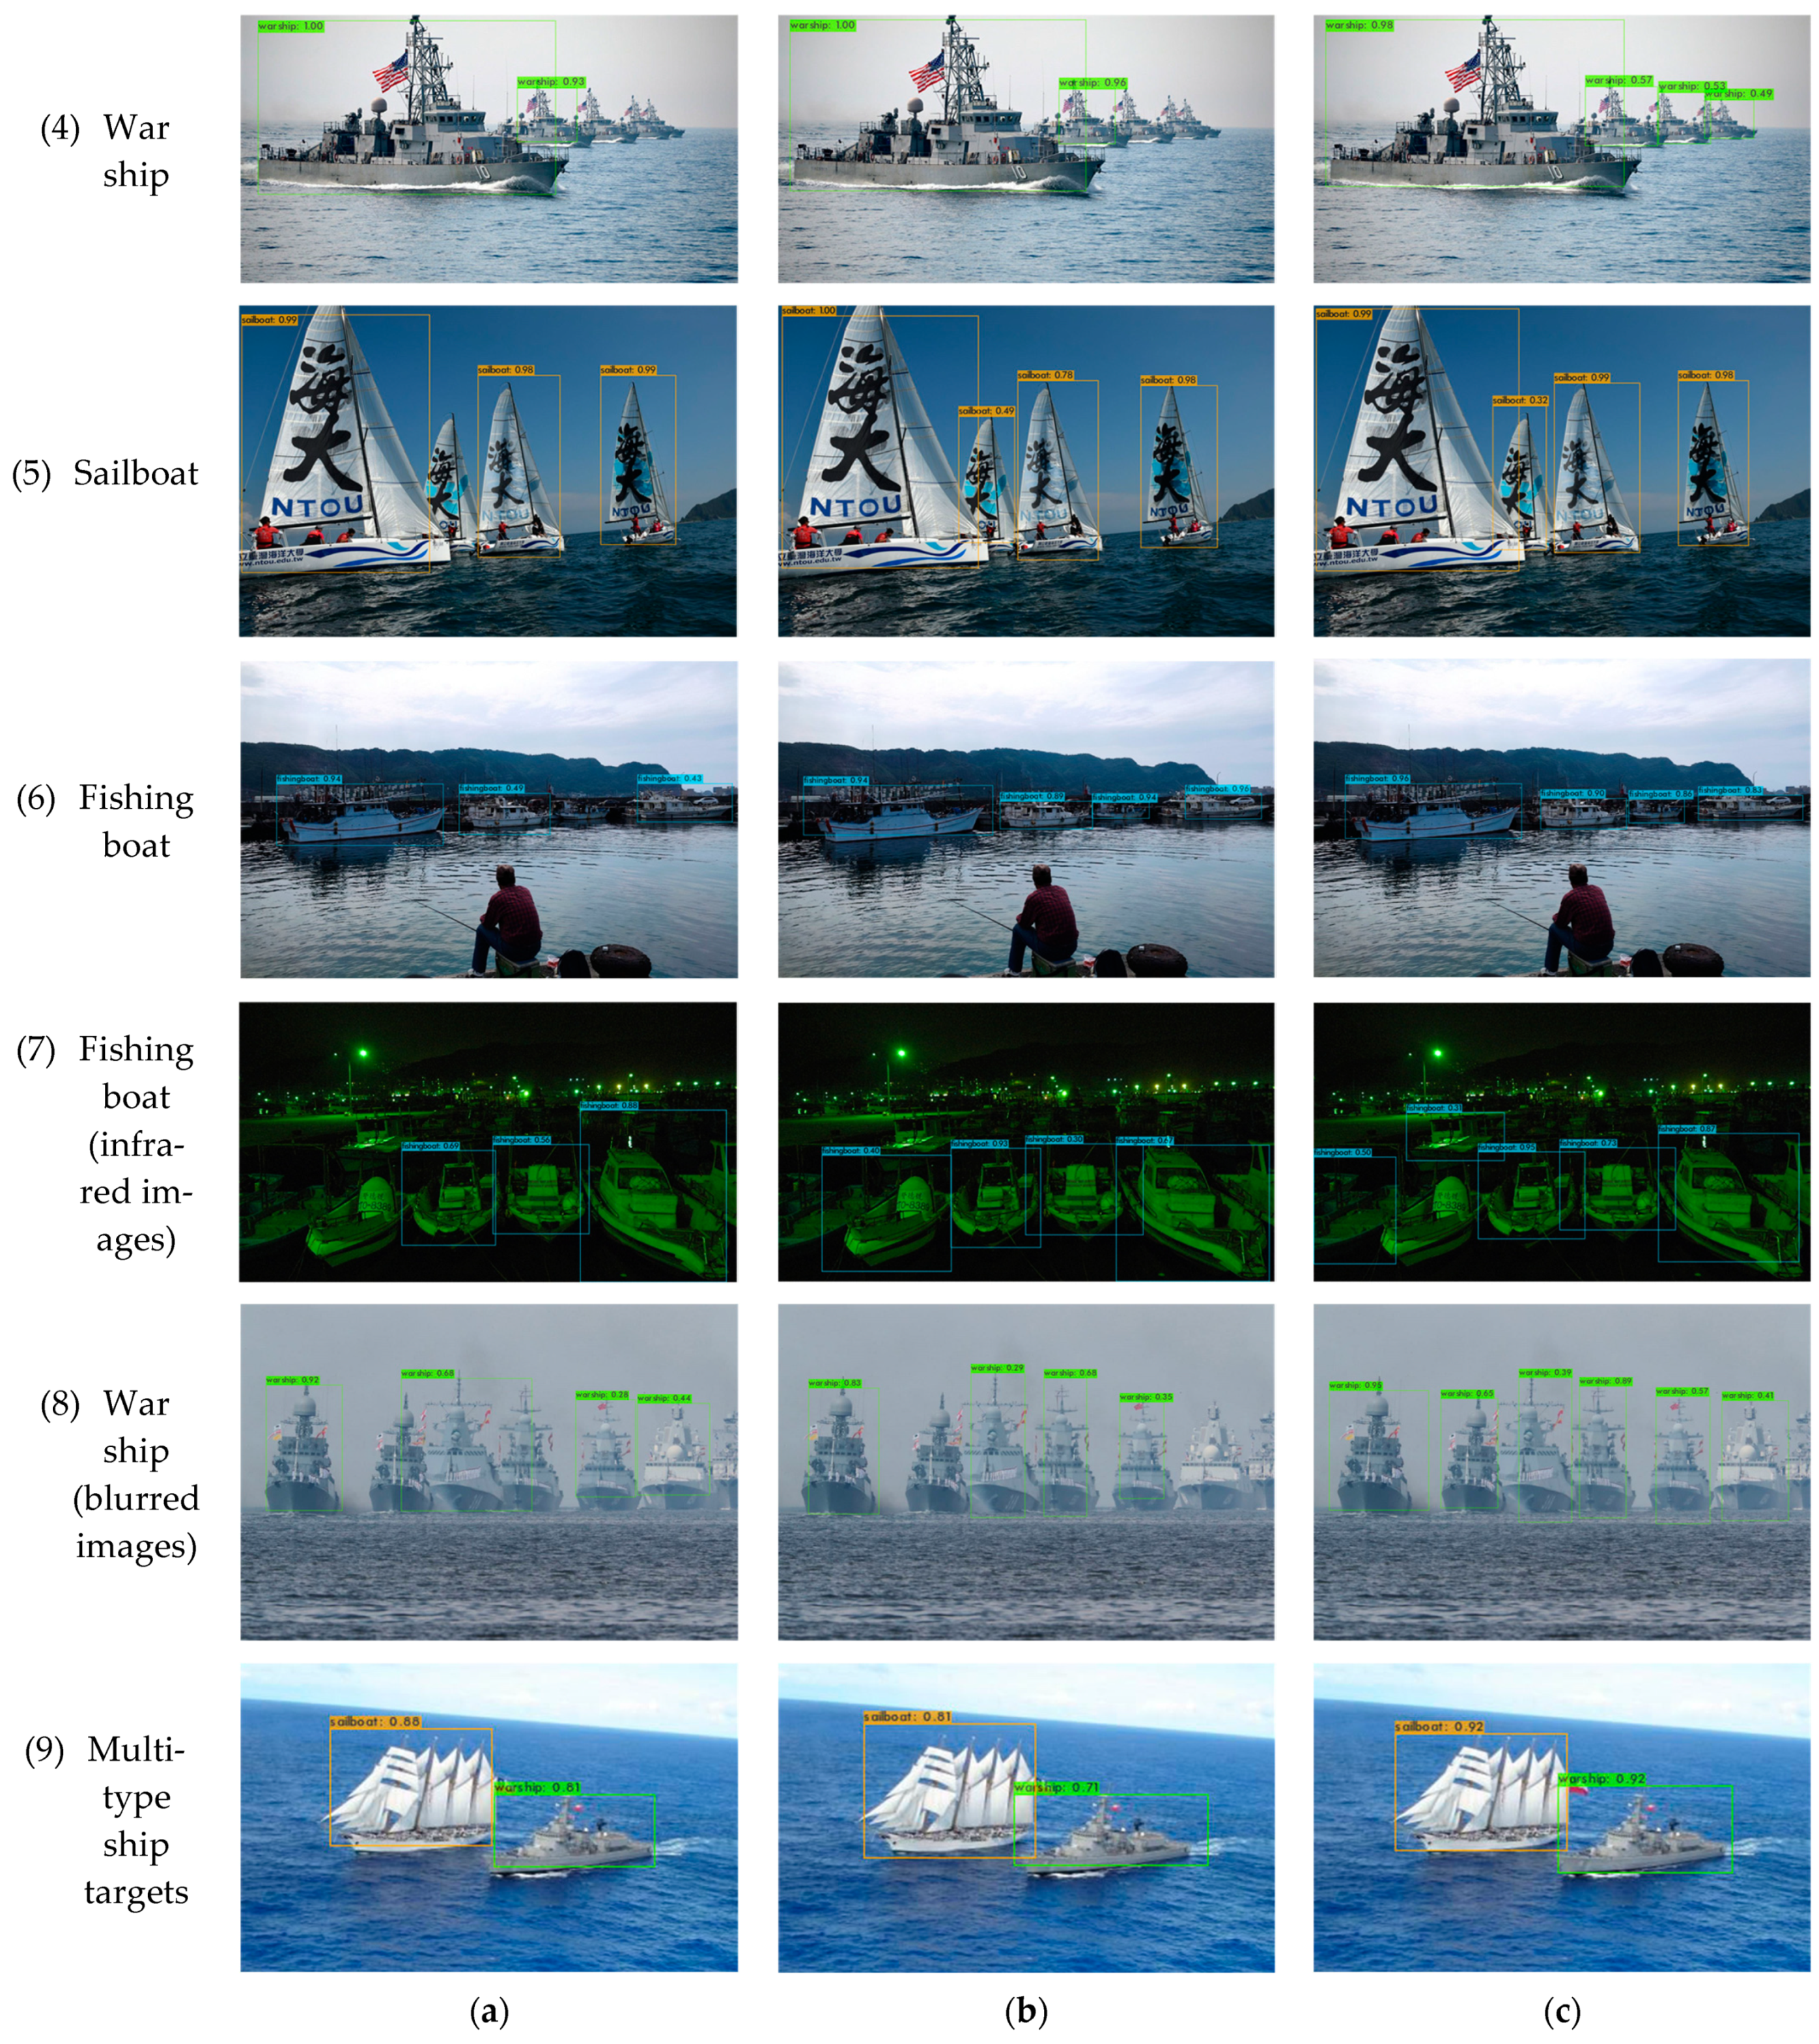
4.5. Real Image Verification

Furthermore, in order to qualitatively evaluate the ship detection performance of the proposed modified networks, the detection results of some samples were shown in Figure 6. The ship images sampled from the built data set were detected by the original Yolov3, the modified Yolov3, and the modified Yolv3-spp networks, and the corresponding detection results were displayed in the first, second, and third columns of Figure 6, respectively. In the first row of Figure 6, both modified Yolov3 networks detected the container ship even under complex backgrounds, but the original Yolov3 missed it. In addition, the modified Yolov3-spp achieved a higher detection confidence score. The images of the other 5 types of ships were from the second row to the sixth row in Figure 6.
From the results, it can be observed that the modified Yolov3 and the original Yolov3 have missed some small and obscure ships. However, the modified Yolov3-spp can avoid missing some densely arranged ships, and even detect partially obstructed ship targets. The adopted SPP modules improve the feature extraction and preserve spatial information by pooling in local spatial bins, thereby improving the ability to express ship features and alleviating the problem of multiscale ship detection. The modified Yolov3-spp has better detection performance than the modified Yolov3. In addition, the Yolov3 networks can successfully detect ships in infrared images, as shown in the seventh row of Figure 6. Due to the dense distribution of fishing boats in harbors, some fishing boats in this infrared image were missed detected by Yolov3 and the modified Yolov3. However, the modified Yolov3-spp achieved better detection and only missed one fishing boat, compared with the other two Yolov3 networks. Finally, even for blurred images or multitype of ship targets in an image, as shown in the eighth and ninth rows of Figure 6, the modified Yolov3-spp can detect almost all ships correctly and achieve the highest confidence score. In general, the proposed modified Yolov3-spp network can improve the performance of multi-scale ship detection, and the detection box is more accurate than the original Yolov3 network.

5. Conclusions

This study proposed a modified Yolov3-spp model for ship detection with visible and infrared images. The effectiveness of the proposed method in real-time detection was verified by the experiments on the built data set consisting of six types of ship images. Experimental results showed that the proposed modified Yolov3-spp outperforms most of the current CNN networks in terms of detection accuracy and computation efficiency. The proposed method achieved better detection performance than the original Yolov3 in ship detection, increasing mAP by 5.8%, FPS by 8%, and reducing BFLOPs by about 47.6%. Experiments also showed that the proposed method has high detection accuracy in multiscale detection situations, especially for the detection of densely distributed ships in ports. In conclusion, the proposed method has high computational efficiency and detection accuracy and meets the requirements of real-time detection. Furthermore, this study has investigated the ship detection algorithms in detail and developed a common ship dataset consisting of visible and infrared images. In future work, the attentional mechanism and the more complete data set will be a key research direction.

Author Contributions

Data curation, Y.-T.C.; Methodology, L.C.; Project administration, Y.-L.C.; Software, Y.-T.C.; Supervision, J.-H.W.; Validation, L.C.; Writing—original draft, Y.-T.C.; Writing—review & editing, L.C. All authors have read and agreed to the published version of the manuscript.

Funding

This research was funded by the Ministry of Science and Technology, Taiwan, under Grant Nos: MOST-109-2221-E019-054, MOST-110-2119-M-027-001 and MOST-110-2221-E-027-101.

Institutional Review Board Statement

Not applicable.

Informed Consent Statement

Not applicable.

Data Availability Statement

Not applicable.

Conflicts of Interest

The authors declare no conflict of interest.

References

  1. Chen, X.; Chen, H.; Wu, H.; Huang, Y.; Yang, Y.; Zhang, W.; Xiong, P. Robust visual ship tracking with an ensemble framework via multi-view learning and wavelet filter. Sensors 2020, 20, 932. [Google Scholar] [CrossRef] [Green Version]
  2. Hu, W.C.; Yang, C.Y.; Huang, D.Y. Robust real-time ship detection and tracking for visual surveillance of cage aquaculture. J. Vis. Commun. Image Represent. 2011, 22, 543–556. [Google Scholar] [CrossRef]
  3. Wang, X.; Chen, C. Adaptive ship detection in SAR images using variance WIE-based method. Signal Image Video Process. 2016, 10, 1219–1224. [Google Scholar] [CrossRef]
  4. Hwang, J.; Kim, D.; Jung, H.S. An efficient ship detection method for KOMPSAT-5 synthetic aperture radar imagery based on adaptive filtering approach. Korean J. Remote Sens. 2017, 33, 89–95. [Google Scholar] [CrossRef]
  5. Chang, Y.L.; Anagaw, A.; Chang, L.; Wang, Y.C.; Hsiao, C.Y.; Lee, W.H. Ship Detection Based on YOLOv2 for SAR Imagery. Remote Sens. 2019, 11, 786. [Google Scholar] [CrossRef] [Green Version]
  6. Shi, Z.; Yu, X.; Jiang, Z.; Li, B. Ship detection in high-resolution optical imagery based on anomaly detector and local shape feature. IEEE Trans. Geosci. Remote Sens. 2014, 52, 4511–4523. [Google Scholar]
  7. Liu, G.; Zhang, Y.; Zheng, X.; Sun, X.; Fu, K.; Wang, H. A new method on inshore ship detection in high-resolution satellite images using shape and context information. IEEE Geosci. Remote Sens. Lett. 2014, 11, 617–621. [Google Scholar] [CrossRef]
  8. Nie, T.; He, B.; Bi, G.; Zhang, Y. A Method of Ship Detection under Complex Background. ISPRS Int. J. Geo-Inf. 2017, 6, 159. [Google Scholar] [CrossRef] [Green Version]
  9. Dong, C.; Liu, J.; Xu, F. Ship detection in optical remote sensing images based on saliency and a rotation-invariant descriptor. Remote Sens. 2018, 10, 400. [Google Scholar] [CrossRef] [Green Version]
  10. Takeda, H.; Farsiu, S.; Milanfar, P. Kernel regression for image processing and reconstruction. IEEE Trans. Image Process. 2007, 16, 349–366. [Google Scholar] [CrossRef] [Green Version]
  11. Pitas, I.; Venetsanopoulos, A.N. Nonlinear Digital Filters: Principles and Applications; Kluwer: Boston, MA, USA, 1990. [Google Scholar]
  12. Ouahabi, A. Signal and Image Multiresolution Analysis; ISTE-Wiley: London, UK; Hoboken, NJ, USA, 2013. [Google Scholar]
  13. Ouahabi, A. A review of wavelet denoising in medical imaging. In Proceedings of the 8th International Workshop on Systems, Signal Processing and Their Applications (IEEE/WoSSPA), Algiers, Algeria, 12–15 May 2013; pp. 19–26. [Google Scholar]
  14. Ahmed, S.S.; Messali, Z.; Ouahabi, A.; Trepout, S.; Messaoudi, C.; Marco, S. Nonparametric denoising methods based on contourlet transform with sharp frequency localization: Application to low exposure time electron microscopy images. Entropy 2015, 17, 3461–3478. [Google Scholar] [CrossRef] [Green Version]
  15. Yang, F.; Xu, Q.; Li, B. Ship detection from optical satellite images based on saliency segmentation and structure-LBP feature. IEEE Geosci. Remote Sens. Lett. 2017, 14, 602–606. [Google Scholar] [CrossRef]
  16. Xia, Y.; Wan, S.; Yue, L. A novel algorithm for ship detection based on dynamic fusion model of multi-feature and support vector machine. In Proceedings of the IEEE Sixth International Conference on Image and Graphics (ICIG), Hefei, China, 12–15 August 2011; pp. 521–526. [Google Scholar]
  17. Xu, J.; Sun, X.; Zhang, D.; Fu, K. Automatic detection of inshore ships in high-resolution remote sensing images using robust invariant generalized Hough transform. IEEE Geosci. Remote Sens. Lett. 2014, 11, 2070–2074. [Google Scholar]
  18. Lowe, D.G. Distinctive image features from scale-invariant keypoints. Int. J. Comput. Vis. 2004, 60, 91–110. [Google Scholar] [CrossRef]
  19. Dalal, N.; Triggs, B. Histograms of oriented gradients for human detection. IEEE Conf. Comput. Vis. Pattern Recognit. 2005, 1, 886–893. [Google Scholar]
  20. Cortes, C.; Vapnik, V. Support-vector networks. Mach. Learn. 1995, 20, 273–297. [Google Scholar] [CrossRef]
  21. Schapire, R.E. Explaining AdaBoost. In Empirical Inference; Springer: Berlin/Heidelberg, Germany, 2013; pp. 37–52. [Google Scholar]
  22. Kim, K.; Hong, S.; Choi, B.; Kim, E. Probabilistic ship detection and classification using deep learning. Appl. Sci. 2018, 8, 936. [Google Scholar] [CrossRef] [Green Version]
  23. Huang, H.; Sun, D.; Wang, R.; Zhu, C.; Liu, B. Ship target detection based on improved Yolo network. Math. Probl. Eng. 2020, 2020, 6402149. [Google Scholar] [CrossRef]
  24. Li, H.; Deng, L.; Yang, C.; Liu, J.; Gu, Z. Enhanced Yolov3 tiny network for real-time ship detection from visual image. IEEE Access. 2021, 9, 16692–16706. [Google Scholar] [CrossRef]
  25. Li, Z.; Zhao, L.; Han, X.; Pan, M. Lightweight ship detection methods based on Yolov3 and DenseNet. Math. Probl. Eng. 2020, 2020, 4813183. [Google Scholar] [CrossRef]
  26. Yao, Y.; Jiang, Z.; Zhang, H.; Zhao, D.; Cai, B. Ship detection in optical remote sensing images based on deep convolutional neural networks. J. Appl. Remote Sens. 2017, 11, 042611. [Google Scholar] [CrossRef]
  27. Lin, H.; Shi, Z.; Zou, Z. Fully convolutional network with task partitioning for inshore ship detection in optical remote sensing images. IEEE Geosci. Remote Sens. Lett. 2017, 14, 1665–1669. [Google Scholar] [CrossRef]
  28. Yang, X.; Sun, H.; Fu, K.; Yang, J.; Sun, X.; Yan, M.; Guo, Z. Automatic ship detection in remote sensing images from google earth of complex scenes based on multiscale rotation dense feature pyramid networks. Remote Sens. 2018, 10, 132. [Google Scholar] [CrossRef] [Green Version]
  29. Li, Q.; Mou, L.; Liu, Q.; Wang, Y.; Zhu, X.X. HSF-Net: Multiscale deep feature embedding for ship detection in optical remote sensing imagery. IEEE Trans. Geosci. Remote Sens. 2018, 56, 7147–7161. [Google Scholar] [CrossRef]
  30. Girshick, R.; Donahue, J.; Darrell, T.; Malik, J. Rich feature hierarchies for accurate object detection and semantic segmentation. In Proceedings of the IEEE Conference on Computer Vision and Pattern Recognition, Columbus, OH, USA, 24–27 June 2014; pp. 580–587. [Google Scholar]
  31. Girshick, R. Fast R-CNN. In Proceedings of the 2015 IEEE International Conference on Computer Vision (ICCV), Santiago, Chile, 13–16 December 2015; pp. 1440–1448. [Google Scholar]
  32. Ren, S.; He, K.; Girshick, R.; Sun, J. Faster r-cnn: Towards real-time object detection with region proposal networks. In Proceedings of the Advances in Neural Information Processing Systems 28 (NIPS 2015), Montreal, QC, Canada, 7–12 December 2015; pp. 91–99. [Google Scholar]
  33. Fan, W.; Zhou, F.; Bai, X.; Tao, M.; Tian, T. Ship detection using deep convolutional neural networks for PolSAR images. Remote Sens. 2019, 11, 2862. [Google Scholar] [CrossRef] [Green Version]
  34. Yang, X.; Sun, H.; Sun, X.; Yan, M.; Guo, Z.; Fu, K. Position detection and direction prediction for arbitrary-oriented ships via multitask rotation region convolutional neural network. IEEE Access. 2018, 6, 50839–50849. [Google Scholar] [CrossRef]
  35. Zhasng, S.; Wu, R.; Xu, K.; Wang, J.; Sun, W. R-CNN-Based ship detection from high resolution remote sensing imagery. Remote Sens. 2019, 11, 631. [Google Scholar] [CrossRef] [Green Version]
  36. Dong, Z.; Lin, B. Learning a robust CNN-based rotation insensitive model for ship detection in VHR remote sensing images. Int. J. Remote Sens. 2020, 41, 3614–3626. [Google Scholar] [CrossRef]
  37. Liu, W.; Anguelov, D.; Erhan, D.; Szegedy, C.; Reed, S.; Fu, C.Y.; Berg, A.C. SSD: Single shot multibox detector. In Proceedings of the European Conference on Computer Vision, Amsterdam, The Netherlands, 11–14 October 2016; Springer: Amsterdam, The Netherlands, 2016; pp. 21–37. [Google Scholar]
  38. Redmon, J.; Divvala, S.; Girshick, R.; Farhadi, A. You only look once: Unified, real-time object detection. In Proceedings of the IEEE Conference on Computer Vision and Pattern Recognition, Las Vegas, NV, USA, 27–30 June 2016; pp. 779–788. [Google Scholar]
  39. Redmon, J.; Farhadi, A. YOLO9000: Better, faster, stronger. In Proceedings of the IEEE Conference on Computer Vision and Pattern Recognition, Honolulu, HI, USA, 21–26 July 2017; pp. 7263–7271. [Google Scholar]
  40. Redmon, J.; Farhadi, A. Yolov3: An incremental improvement. arXiv 2018, arXiv:1804.02767. [Google Scholar]
  41. Bochkovskiy, A.; Wang, C.Y.; Mark Liao, H.Y. Yolov4: Optimal speed and accuracy of object detection. arXiv 2020, arXiv:2004.10934. [Google Scholar]
  42. Wang, Y.; Wang, C.; Zhang, H. Combining a single shot multibox detector with transfer learning for ship detection using Sentinel-1 SAR images. Remote Sens. Lett. 2018, 9, 780–788. [Google Scholar] [CrossRef]
  43. Zhang, T.; Zhang, X. High-speed ship detection in SAR images based on a grid convolutional neural network. Remote Sens. 2019, 11, 1206. [Google Scholar] [CrossRef] [Green Version]
  44. Liu, B.; Wang, S.; Zhao, J.; Li, M. Ship tracking and recognition based on Darknet network and YOLOv3 algorithm. J. Comput. Appl. 2019, 39, 1663–1668. [Google Scholar]
  45. Zhang, Y.; Shu, J.; Hu, L.; Zhou, Q.; Du, Z. A Ship Target Tracking Algorithm Based on Deep Learning and Multiple Features; SPIE: Bellingham, WA, USA, 2020; Volume 11433. [Google Scholar]
  46. Chang, L.; Chen, Y.T.; Hung, M.H.; Wang, J.H.; Chang, Y.L. Yolov3 based ship detection in visible and infrared images. In Proceedings of the 2021 IEEE International Geoscience and Remote Sensing Symposium IGARSS, Brussels, Belgium, 11–16 July 2021. [Google Scholar]
  47. Everingham, M.; Van Gool, L.; Williams, C.K.; Winn, J.; Zisserman, A. The pascal visual object classes (VOC) challenge. Int. J. Comput. Vis. 2010, 88, 303–338. [Google Scholar] [CrossRef] [Green Version]
  48. Lin, T.Y.; Maire, M.; Belongie, S.; Bourdev, L.; Girshick, R.; Hays, J.; Perona, P.; Ramanan, D.; Dollár, P.; Zitnick, C.L. Microsoft COCO: Common Objects in Context. In Proceedings of the European Conference on Computer Vision (ECCV) 2014, Zurich, Switzerland, 6–12 September 2014; Springer: Cham, Switzerland, 2014; pp. 740–755. [Google Scholar]
  49. Kanungo, T.; Mount, D.M.; Netanyahu, N.S.; Piatko, C.D.; Silverman, R.; Wu, A.Y. An efficient k-means clustering algorithm: Analysis and implementation. IEEE Trans. Pattern Anal. Mach. Intell. 2002, 24, 881–892. [Google Scholar] [CrossRef]
  50. He, K.; Zhang, X.; Ren, S.; Sun, J. Spatial Pyramid Pooling in Deep Convolutional Networks for Visual Recognition. IEEE Trans. Pattern Anal. Mach. Intell. 2015, 37, 1904–1916. [Google Scholar] [CrossRef] [Green Version]
  51. Huang, Z.; Wang, J. DC-SPP-YOLO: Dense connection and spatial pyramid pooling based YOLO for object detection. Inf. Sci. 2020, 522, 241–258. [Google Scholar] [CrossRef] [Green Version]
  52. AlexeyAB. AlexeyAB/Darknet: Yolov3. 2020. Available online: https://github.com/AlexeyAB/darknet (accessed on 10 February 2022).
  53. Ruder, S. An overview of gradient descent optimization algorithms. arXiv 2016, arXiv:1609.04747. [Google Scholar]
  54. Tzutalin. Tzutalin/Labelimg. 2018. Available online: https://github.com/tzutalin/labelImg (accessed on 10 February 2022).
  55. Li, K.; Huang, Z.; Cheng, Y.C.; Lee, C.H. A maximal figure-of-merit learning approach to maximizing mean average precision with deep neural network based classifiers. In Proceedings of the 2014 IEEE International Conference on Acoustics, Speech and Signal Processing (ICASSP), Florence, Italy, 4–9 May 2014; pp. 4503–4507. [Google Scholar]
  56. Tan, M.; Pang, R.; Le, Q.V. Efficientdet: Scalable and efficient object detection. In Proceedings of the IEEE/CVF Conference on Computer Vision and Pattern Recognition, Seattle, WA, USA, 16–18 June 2020; pp. 10781–10790. [Google Scholar]
  57. He, K.; Zhang, X.; Ren, S.; Sun, J. Deep residual learning for image recognition. arXiv 2015, arXiv:1512.03385. [Google Scholar]
Figure 1. Proposed modified Yolov3 network with SPP module.
Electronics 11 00739 g001
Figure 2. The samples of the data set.
Electronics 11 00739 g002
Figure 3. The mAP of Yolov3 with different input image sizes.
Electronics 11 00739 g003
Figure 4. Training process of the modified Yolov3. The simulation scheme was 384 × 384 input size, two detection scales, and 30% filter reduction. The red line and blue line represent the mAP and training average loss, respectively.
Electronics 11 00739 g004
Figure 5. Performance evaluation of the Yolo-based networks, including (a) BFLOPs, FPS and mAP; (b) Precision, Recall, and F1-score.
Electronics 11 00739 g005aElectronics 11 00739 g005b
Figure 6. Ship detection results for multiscale targets. (a) Original Yolov3. (b) Modified Yolov3. (c) Modified Yolov3-spp.
Electronics 11 00739 g006aElectronics 11 00739 g006b
Table 1. The composition of self-built ship data set.
ClassContainerCruiseWar ShipYachtSailboatFishing Boat
Total numbers1009528100810431000969
Table 2. Performance of Yolov3 on training data under different simulation scenarios.
ParametersBFLOPsFPSmAPPrecisionRecallF1-Score
Input image size (Three detection scales)448 × 44875.894.091.5%0.920.850.88
416 × 41665.395.291.4%0.920.850.88
384 × 38455.796.991.3%0.920.850.88
352 × 35246.897.890.7%0.920.850.88
Scales
(Input image size 384 × 384)
Two detection scales51.098.490.8%0.930.840.88
Small target scale46.3101.288.0%0.930.800.86
Filters
(Input image size 384 × 384
and two detection scales)
−20%36.8102.590.1%0.920.830.87
−30%28.9106.290.7%0.920.840.88
−40%23.9119.389.8%0.900.800.86
Table 3. Detection accuracy of Yolov3 on test data under different simulation scenarios.
ParametersWarshipContainer ShipCruise ShipYachtSailboatFishing BoatmAP
Input image size (Three detection scales)448 × 44888.491.290.187.194.487.889.8
416 × 41684.691.188.085.192.084.087.5
384 × 38484.591.287.685.292.483.887.4
352 × 35282.492.385.882.794.681.086.4
Scales
(Input image size 384 × 384)
Two detection scales90.493.188.690.593.083.689.9
Small target scale87.692.285.087.289.480.487.0
Filters
(Input image size 384 × 384
and two detection scales)
−20%89.693.295.193.092.783.791.2
−30%91.892.494.594.196.387.692.8
−40%90.490.392.490.193.881.689.4
Table 4. Performance comparison of the proposed method with other networks on training data.
BFLOPsFPSmAPPrecisionRecallF1-Score
EfficientDet2.969.463.2%0.650.610.63
ResNet15286.559.885.4%0.890.780.83
SSD39.766.776.2%0.770.720.74
Yolov225.097.676.5%0.760.720.74
Yolov355.796.991.3%0.920.850.88
Yolov3-spp56.096.891.7%0.920.850.88
Yolov450.894.594.8%0.910.880.89
Yolov2-tiny4.6113.767.5%0.610.690.64
Yolov3-tiny4.7121.176.7%0.730.680.70
Yolov4-tiny5.0119.683.4%0.810.780.79
Modified Yolov328.9106.290.7%0.920.840.88
Modified Yolov3-spp29.2104.793.0%0.930.860.89
Table 5. Detection accuracy of the proposed modified methods and other networks on testing data.
WarshipContainer ShipCruise ShipYachtSailboatFishing BoatmAP
EfficientDet64.962.163.868.165.247.461.9
Resnet15181.286.583.586.887.880.284.3
SSD75.273.583.679.881.565.576.5
Yolov274.872.680.478.278.167.475.3
Yolov384.591.287.685.292.483.887.4
Yolov3-spp86.792.190.784.195.683.588.8
Yolov492.993.895.792.997.293.494.3
Yolov2-tiny65.867.864.765.371.853.464.8
Yolov3-tiny71.178.772.570.274.867.872.5
Yolov4-tiny79.687.082.377.387.577.281.8
Modified Yolov391.892.494.594.196.387.692.8
Modified Yolov3-spp92.993.295.493.595.888.993.2
Publisher’s Note: MDPI stays neutral with regard to jurisdictional claims in published maps and institutional affiliations.

