Article

Incorporation of Synthetic Data Generation Techniques within a Controlled Data Processing Workflow in the Health and Wellbeing Domain

1
Vicomtech Foundation, Basque Research and Technology Alliance (BRTA), 20009 Donostia-San Sebastian, Spain
2
eHealth Group, Biodonostia Health Research Institute, 20014 Donostia-San Sebastian, Spain
3
Biomedical Engineering Department, Mondragon Unibertsitatea, 20500 Arrasate-Mondragon, Spain
4
Laboratory of Medical Physics and Digital Innovation, School of Medicine, Aristotle University of Thessaloniki, 54124 Thessaloniki, Greece
5
European Network of Living Labs, 1210 Brussels, Belgium
*
Authors to whom correspondence should be addressed.
These authors contributed equally to this work.
Electronics 2022, 11(5), 812; https://doi.org/10.3390/electronics11050812
Submission received: 28 January 2022 / Revised: 2 March 2022 / Accepted: 3 March 2022 / Published: 4 March 2022
(This article belongs to the Special Issue Recent Advances in Synthetic Data Generation)

Abstract

:
To date, the use of synthetic data generation techniques in the health and wellbeing domain has been mainly limited to research activities. Although several open source and commercial packages have been released, they have been oriented to generating synthetic data as a standalone data preparation process and not integrated into a broader analysis or experiment testing workflow. In this context, the VITALISE project is working to harmonize Living Lab research and data capture protocols and to provide controlled processing access to captured data to industrial and scientific communities. In this paper, we present the initial design and implementation of our synthetic data generation approach in the context of VITALISE Living Lab controlled data processing workflow, together with identified challenges and future developments. By uploading data captured from Living Labs, generating synthetic data from them, developing analysis locally with synthetic data, and then executing them remotely with real data, the utility of the proposed workflow has been validated. Results have shown that the presented workflow helps accelerate research on artificial intelligence, ensuring compliance with data protection laws. The presented approach has demonstrated how the adoption of state-of-the-art synthetic data generation techniques can be applied for real-world applications.

1. Introduction

Synthetic data (SD) is data generated artificially by a mathematical model to replicate distributions and structures of some real data (RD) [1]. Research on health and wellbeing-related SD has gained importance in recent years due to the lack of sufficient RD (both in terms of access and availability) for artificial intelligence (AI) and machine learning (ML) model development. In this context, synthetic data generation (SDG) has been widely researched within health and wellbeing domains for different data types, including biomedical signals [2,3,4], medical images [5,6,7,8], time-series smart-home activity data [9,10,11,12], and EHR tabular data [13,14,15,16,17,18,19,20,21]. Some of these studies used SDG to preserve privacy, ensuring a secure data exchange [3,4,10,12,13,14,15,16,17,18,19,21], while others used it to augment RD for training different ML models, either seeking to balance classes or to achieve more data to improve ML model training [2,5,6,7,8,9,11,20]. Many of the studies related to SDG in this domain have been focused on building new SDG approaches and evaluating or comparing them with other techniques from the literature [14,21]. Other related studies have proposed different sets of metrics for SD evaluation, using them to evaluate and compare the SD generated with different approaches [22,23]. So far, the use of SDG technologies in health and wellbeing has been mainly limited to research activities. Although different open source and commercial packages have been released for facilitating SDG [24,25,26,27,28], they have dealt with SDG as a standalone data preparation process and are not integrated into a broader analysis or experiment testing workflow.
Rankin et al. [13] proposed a pipeline that integrates SDG to enable a secure data exchange between healthcare departments and external researchers (ER). With this pipeline, SDG models can be integrated into healthcare departments to generate private SD that can be shared with ER. Then, ER can develop AI algorithms or ML models with the obtained SD and share them with healthcare departments. Inside healthcare departments, the shared models can be rebuilt and tested with RD without compromising the privacy of the data. This way, RD never leaves the secure environment, and research on AI and ML can be accelerated, promoting the use of SD. However, this pipeline was not implemented, and it was presented to show the potential of SDG technologies. The core objective of this study is to demonstrate how SD can be used instead of RD for ML model training. Additionally, the proposed pipeline is a conceptual proposal and does not imply the inclusion and automation of SDG technologies within an overall technological workflow (i.e., this conceptual proposal can still be implemented with the standalone execution of SDG tools). Thus, there is a lack of development of a complete pipeline or workflow that integrates and automates SDG logic to enable researchers to make their own analyses with SD and execute them remotely in a controlled environment with RD. Throughout this paper, a controlled environment is defined as a setting where health and wellbeing personal data can only be accessed under restricted permissions and privacy-preserving approaches.
In recent years, Living Labs (LLs) have become resilient research and innovation ecosystems proving access to infrastructures. By involving the quadruple helix (public, private, academia, and society), with a special focus on people and their participation in research procedures, they have been demonstrated to be key for the integration of research and innovation processes in real-life environments. In this sense, the VITALISE project aims to open LLs Infrastructures to facilitate and promote research activities in the field of health and wellbeing in Europe and beyond [29]. This project is working to harmonize health and wellbeing LLs research procedures and services, including data capture protocols. One of the project’s objectives is to provide controlled access to analytics computation using LLs computational infrastructure on collected data for industrial and scientific communities and for the development of innovative data-driven digital health products and services [30]. This paper is related to one of the most important outcomes of the VITALISE project, which is the Information and Communication Technologies (ICT) tools for providing effective and convenient virtual access to researchers. Inside this outcome, the VITALISE LLs controlled data processing workflow is being developed, which can be used as the intermediary between LLs and ER. The workflow will enable (1) the storage and unification of the data generated from LLs under a defined data model, (2) the request of SDG for a specific query that can be made on the stored data, and (3) the remote execution of experiments with RD after having developed them locally with SD. This workflow will accelerate research on AI and ML model development, ensuring compliance with data protection laws. Moreover, providing controlled processing access to data captured in LLs to industrial and scientific communities, the development of innovative data-driven digital health products and services is streamlined.
The proposed workflow shares the basis of RD never leaving local institutions for AI and ML model development with Federated Learning (FL). Using FL techniques RD is stored locally in individual institutions (peer-to-peer FL), which can include a common server (aggregation server) [31]. With this approach, institutions can only access their own private data [32], and ER cannot access RD at all. ML models and AI algorithms are developed mostly based on a data model specification and with limited (or no) access to RD. Algorithmic models are trained and refined as part of an iterative process of the federated running of algorithms in different data nodes and progressive incorporation of results to the models. Complementary to this approach, the VITALISE LLs controlled data processing workflow offers ERs SD so that they can develop and train ML models while using their own computers. When they finish their analysis, they will be able to send the final and verified source code to the LLs infrastructure where the model can be trained with RD, solving the data privacy and siloing inconveniences.
In this paper, we present the initial design and implementation of our SDG incorporation approach into the VITALISE LLs controlled data processing workflow. Even though the workflow has been designed and implemented for a health and wellbeing application, it can be applied to other domains, such as education, industrial processes, weather and climate, or business. Additionally, we give a real-world usage example to demonstrate how it can help to accelerate research on AI and ML model development, ensuring compliance with data protection laws. The presented approach helps accelerate research in this field and the adoption of state-of-the-art SDG approaches for real-world applications. The workflow can be used to obtain a synthetic, thus anonymized, version of a real dataset, enabling ER to make their own analysis with SD locally and then execute the same analysis with RD remotely. Our contributions can be summarised as follows:
  • We present a controlled data processing workflow for a secure data exchange and analysis without compromising data privacy. The workflow involves the generation of SD based on previously uploaded RD and the remote execution of experiments with RD on LLs premises.
  • To the best of our knowledge, this work is the first attempt to propose the incorporation and automation of SDG models within a controlled data processing workflow whose objective is to ensure compliance with personal data protection laws.
  • We have conducted a real-world usage example to demonstrate the usefulness and efficiency of the proposed workflow. To conduct the experiments, we have used heart rate data measured from Fitbit smart wristbands.
  • Additionally, we have performed an experiment with the SD obtained from the heart rate values to analyze the performance on the resemblance and utility dimensions. For this analysis, we have used some metrics to evaluate the resemblance of SD to RD, and we have performed some forecasting analyses locally with different SD assets and executed them remotely with RD.
The remainder of this article is organized as follows. In the next section, the VITALISE LLs controlled data processing workflow and the SDG module integration are explained together with the methods used for their development. Next, the implementation of the proposed workflow is evaluated with real-life sample data, the obtained SD is compared with RD, and forecasting analyses are developed locally with SD and executed remotely with RD. Finally, the obtained results are discussed, and the main findings, limitations, and future work of the proposed workflow are analyzed.

2. Materials and Methods

In this section, the VITALISE LLs controlled data processing workflow is described together with the definition of the modules involved in it. Then, the integration of SDG in the workflow is more extensively described.

2.1. VITALISE LL Controlled Data Processing Workflow

To guide the reader in the workflow description, a simplified diagram of the VITALISE LLs controlled data processing workflow is depicted in Figure 1. The workflow diagram is comprised of three main blocks: (1) LLs, in which a high amount of health and wellbeing data is generated from different data collection devices, (2) the VITALISE Node Logic (VNL), which is a microservice architecture responsible for the execution of the workflow in a controlled environment, and (3) ER, who can explore the available data to request SD and execute experiments with it. Interactions with VNL are represented in Figure 1, and available datasets exploration are made through a web portal, which has been omitted from the diagram to provide a better understanding of how actual SDG approaches can be incorporated as a controlled data processing workflow enabler for a real-world application.
When the data manager of an LLs uploads the collected data into the VNL, this module transforms the received data into a defined data format and stores it in the database system. At any time, ER can explore and query metadata information of the available data to then make an SD request for the query results, which is managed by the VNL. With the requested SD, ER can develop AI algorithms or ML models locally, and then, through a request to the VNL, the developed experiment is run in a controlled environment using RD. Once the experiment is completed, ER can check the results to review and evaluate whether they are satisfactory. This way, ER can work on the experiments without having access to RD. Finally, if results are not deemed satisfactory, ER can further improve the developed algorithm with SD and obtained results, or alternatively request the generation of new SD for another data query that meets better-targeted experiment goals. Once ER are happy with the obtained results on RD, they can disseminate and exploit them, together with the developed experiment code. In this sense, the experiment, and the results of applying it to RD, can be publicly shared without showing any detail of RD and violating data protection and regulation laws. After this step and having satisfied ER with the obtained results from the local experiments and/or the remote experiments, the workflow execution is completed.
Previous works have shown that the best ML model trained with SD does not always match the best ML model trained with RD [23]. Thus, using the proposed approach, ER would not obtain the same results when modeling the algorithm locally with SD and when training and evaluating it remotely with RD, but SD can be useful to help ER to advance in algorithm development. It must also be considered that the final ML model will be built and evaluated on RD; the models built on SD are used to see the feasibility of different ML model approaches and help in the design and implementation of these models.

VITALISE Node Logic

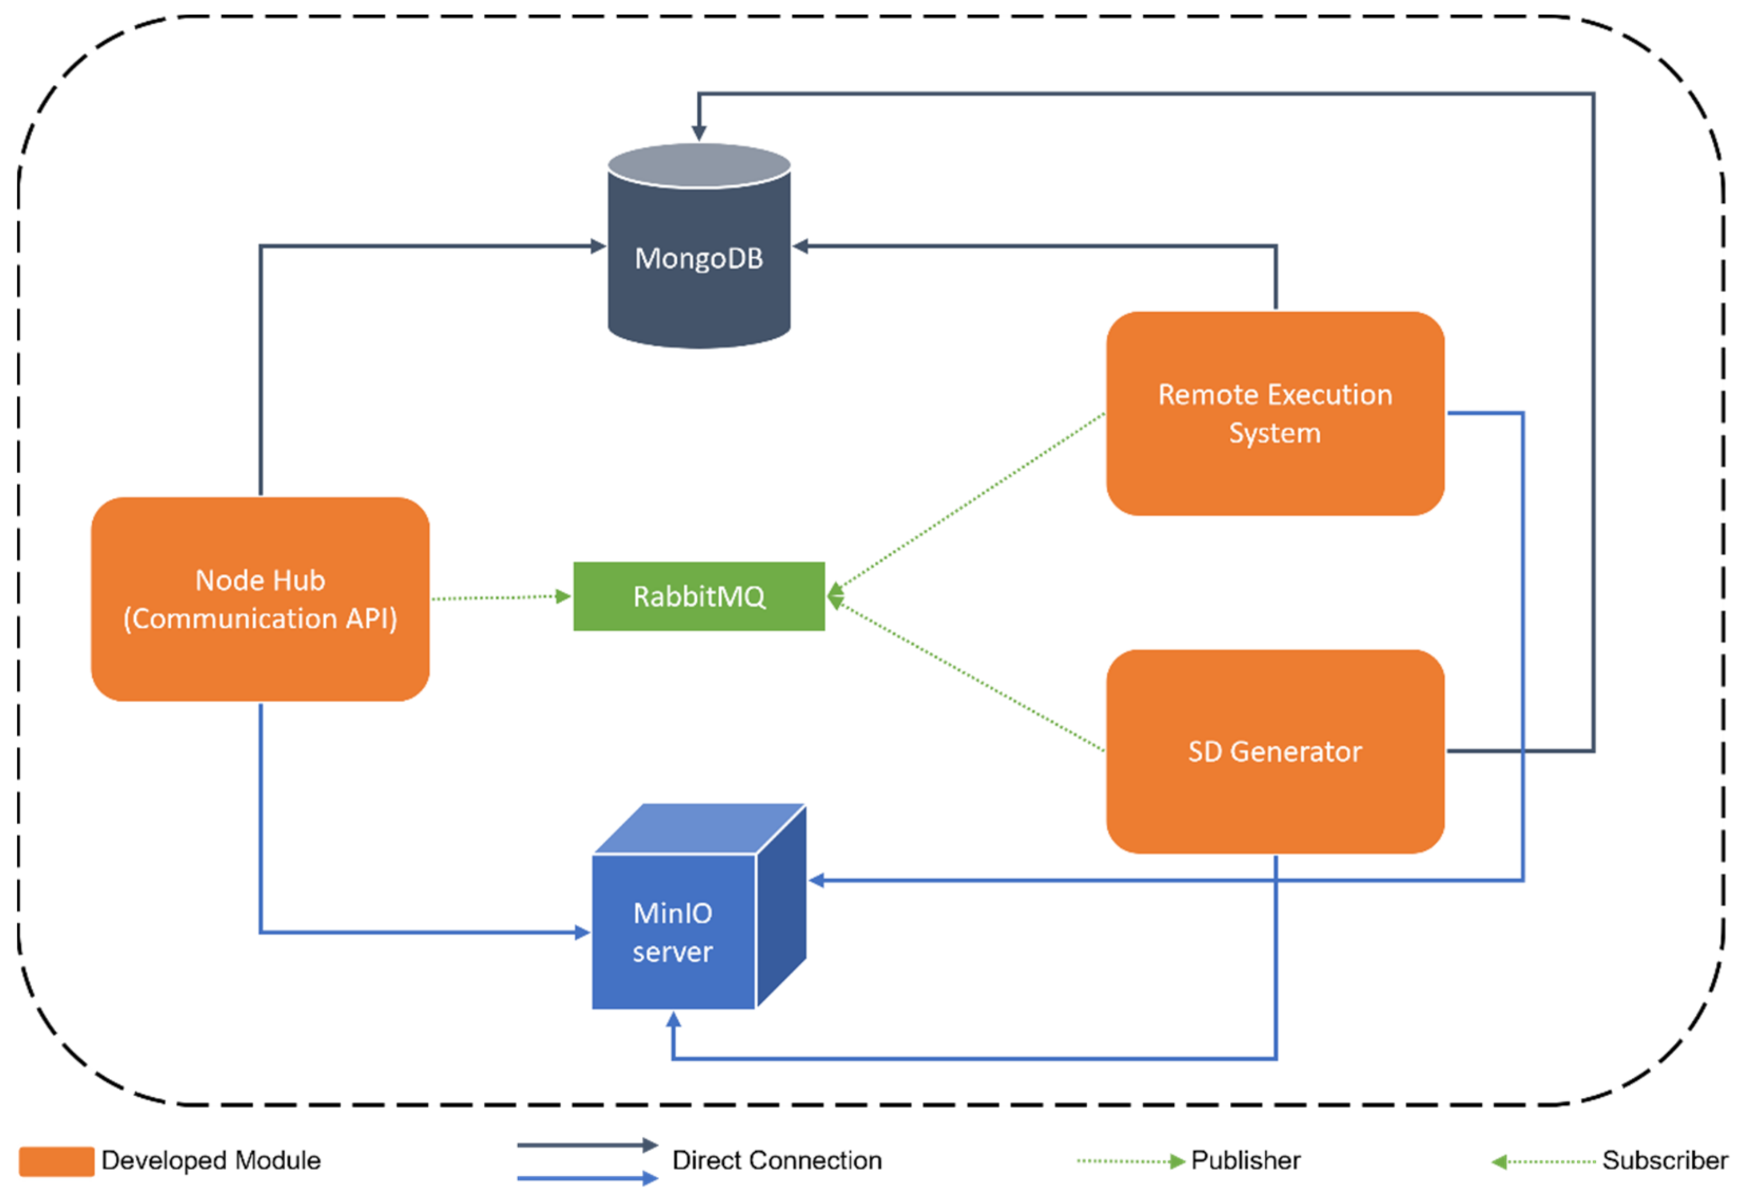
The VNL has been developed following a microservice architecture design, composed of six services that communicate with each other in the way depicted in Figure 2. These different services are bundled through containerization technologies and managed through docker-compose container orchestration technology to facilitate the deployment and update of Node Logic in different LLs.
  • MongoDB is a distributed NoSQL database system [33] to store real data from LLs and generated SD in the defined Vitalise Data Format.
  • RabbitMQ is an open-source message broker [34] used to communicate the modules of the environment and queue tasks.
  • MinIO server is an object storage server [35] that stores trained SDG models, generated SD in CSV format, the necessary files for the remote execution of experiments with RD, and the results produced as part of remote execution of experiments with RD.
  • The Node Hub is a Communication Application Programming Interface (API) developed in Python using the FastAPI framework [36] that handles the requests coming from ER through the web portal and works as an intermediary between the other two modules (SD Generator and Remote Execution Engine). Thereby, it has access to RabbitMQ (to queue tasks for the other modules), MongoDB (to store and query available RD and SD), and MinIO server (to write input files for the remote execution of experiments with RD).
  • The SD Generator is an MQTT client subscribed to the SD topic of RabbitMQ and developed in Python. This module is responsible for training SDG models and generating SD. Thus, it has access to RabbitMQ (to subscribe to the SD topic), MongoDB (to query available RD and store the generated SD), and MinIO server (to store the trained SDG models and the generated SD in CSV format).
  • The Remote Execution Engine is a distributed system, which is developed using Celery [37] and Python, to process and queue the tasks regarding the remote execution of analysis with RD that are sent through RabbitMQ by the Node Hub. It has access to RabbitMQ (to see the queued tasks regarding the remote execution), MongoDB (to query available RD and SD), and MinIO server (to access the necessary files for the remote execution of each experiment and to store the results of them).
As the main aim of this paper is to present the initial design and implementation result of our SDG incorporation approach into the VITALISE LLs controlled data processing workflow, in the next section, the integration of the SD Generator and the services communicated with it are more extensively described.

2.2. Synthetic Data Generation Module Integration

2.2.1. Synthetic Data Generation Approaches

For the generation of SD, many approaches can be found in the literature. Some of them employ statistical models to learn the multivariate distributions of RD [13,14,16,21,38], while others use generative models, especially different architectures of generative adversarial networks (GANs), to generate SD [14,17,18,19,20,39]. This kind of approach consists of two neural networks (a generator and a discriminator) that learn to generate high-quality SD through an adversarial training process [40]. Furthermore, there are open-source and commercial packages that are more accessible for researchers. Examples of them are Syntho [24], MedkitLearn [25], Ydata [27], and the Synthetic Data Vault (SDV) project [28,41].
The SDG techniques incorporated in the workflow are the ones provided by the previously mentioned SDV project. These approaches combine several probabilistic graphical modeling and Deep Learning (DL) based techniques [41]. They have been widely used in the literature and are taken as a baseline for comparison for different data types and scenarios [42,43,44,45]. For the future, it is intended to use different SDG models and allow for parameterization, and create a logic to select the most suitable model considering the input data type (time-series, tabular, etc.).

2.2.2. Synthetic Data Generation Model Training

Every time an LLs manager uses the Node Hub of the VNL to insert new data, the workflow described in Figure 3 is executed. In this process, the services of the VNL involved are the Node Hub and the SD Generator. When the LLs manager makes a request to the VNL to insert LLs data, the Node Hub transforms the data into the VITALISE data format and stores it in MongoDB. Then, a message is published to the SD topic of RabbitMQ to request training for an SDG model. As the SD Generator is subscribed to the SD topic of RabbitMQ, when it receives this message, the module creates a new SDG model and trains it with all available RD in MongoDB of the collection to which the LLs manager has inserted data. Once the model is trained, it is saved in the MinIO server.

2.2.3. Synthetic Data Generation with Trained Models

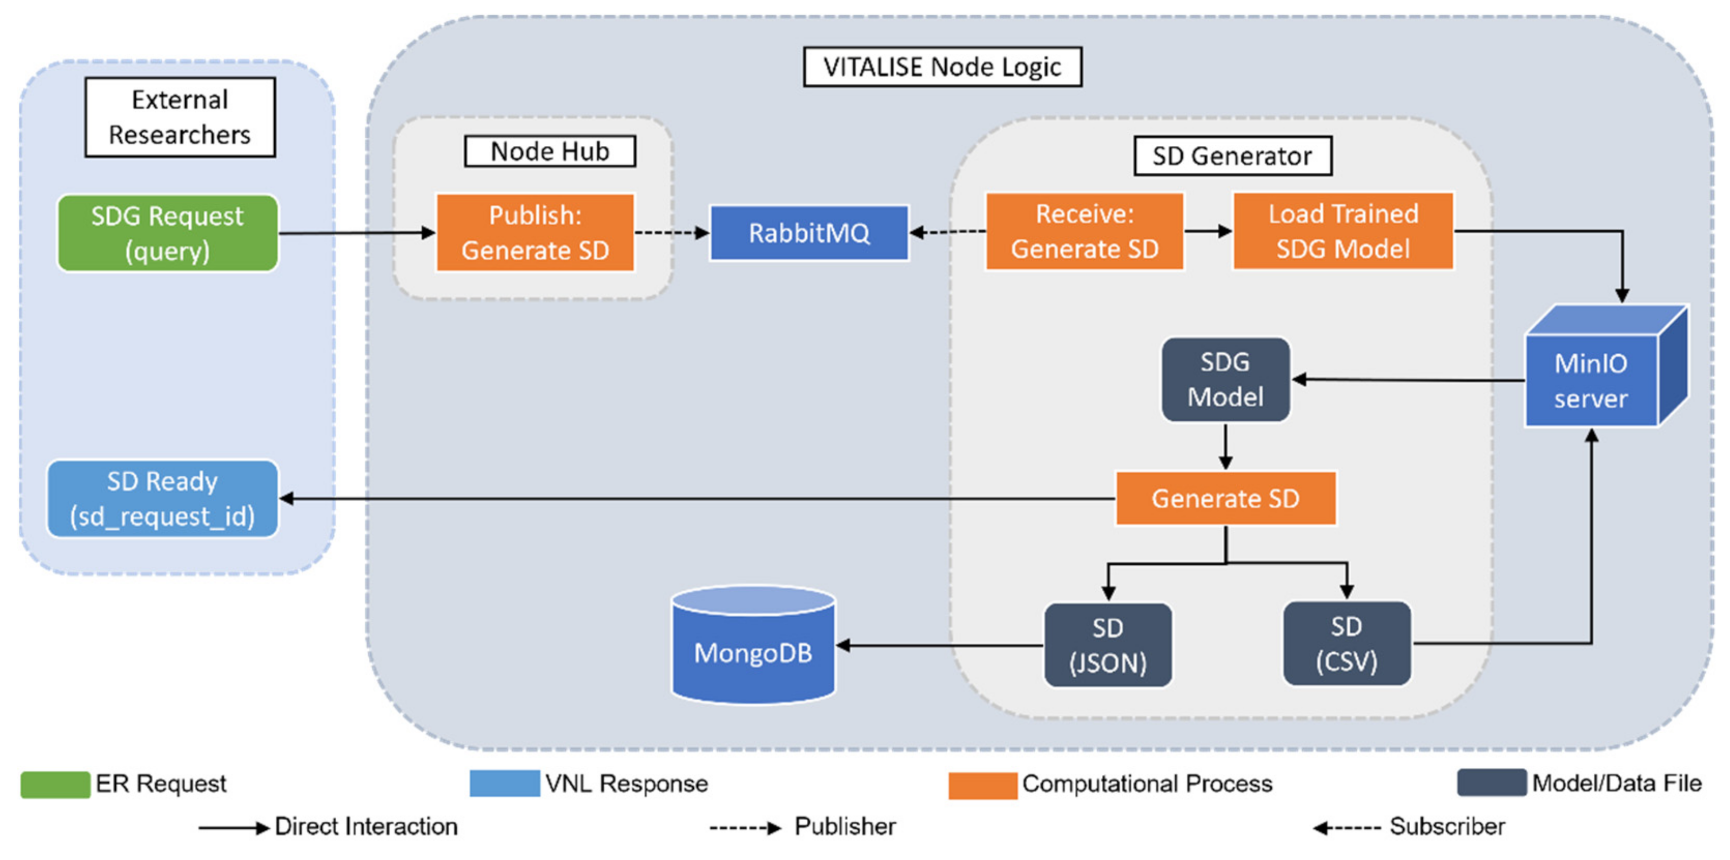
At any time, ER can make a request to generate SD for a specific data collection or query. Figure 4 describes the workflow of this request, being the Node Hub and the SD Generator the modules responsible for this action. When an SDG request comes from ER to the Node Hub, an SD request ID (a unique identifier of the generated SD asset) is generated, and a message is published to the SD topic of RabbitMQ to indicate the need to generate SD. When the SD generator receives this message, the module accesses the MinIO server to load the previously trained model. Then, the model is used to generate SD, and the generated SD is saved in the storage systems; MongoDB in JSON format and MinIO server in CSV format. Finally, the SD Generator returns a request ID that corresponds to the generated SD.

2.2.4. Generated Synthetic Data Retrieval

With the SD request ID, as shown in Figure 5, ER can download the requested SD in the desired format, JSON or CSV, through a request to the VNL. If the ER asks for data in JSON format, the Node Hub finds the SD asset in MongoDB. On the contrary, if the ER asks for data in CSV format, the Node Hub finds the SD asset in the MinIO server. In both cases, two files are returned to ER in a compressed folder: one file with the information of the SD asset (sd_request_id, timestamp, description, etc.) and the other file with the SD itself in the requested format.

3. Results

In this section, the results obtained when applying the VITALISE LL controlled data processing workflow to a real-world usage example are presented to evaluate the incorporation of SDG techniques in the presented workflow. This evaluation is based on the demonstration of the usefulness and the good performance of the proposed workflow. First, the data used for evaluation is described. Then, the workflow execution to upload data and make SD requests to the VNL is detailed. Next, the quality of the generated SD is analyzed in terms of resemblance with RD. Finally, forecasting analyses are implemented and evaluated with the requested SD assets, to then request the remote execution of the same analyses scripts with RD and compare both results.

3.1. Used Data

The data used to evaluate the proposed workflow is an anonymized dataset of heart rate measurements from Fitbit smart wristbands for a full day for one person. In total, there were 11,724 data points measured approximately every 5 s. The example data file is attached as a Supplementary Material (Data S1 Original Fitbit heart rate measurements) in both JSON and CSV formats. This example data is the only data type compatible with the actual implementation of the workflow. Since the heart rate measurements show the evolution of a variable, heart rate in this case, through time, it could be treated as time-series data. Through the rest of the paper, this data will be referenced as heart rate measurements.

3.2. Workflow Execution

To demonstrate the usefulness of the proposed workflow, a real-life example has been executed with the previously described data. The next steps have been involved in this execution.
  • By simulating the role of an LLs manager, the VNL has been used to upload the heart rate measurements to the VNL. At this moment, the SDG approach has been trained with the uploaded data.
  • By simulating the role of ER, a petition has been made to the VNL to request SD of the first five hours of the previously uploaded heart rate data.
  • Taking advantage of the obtained SD request ID, the ER has been able to obtain SD in the desired format, either JSON or CSV. In both cases, a zip file has been downloaded with two files, one with the information of SD (fields shown in Table 1) and the other with the SD itself.
  • Using the downloaded SD in CSV format, a brief evaluation of the SD resemblance has been done using some metrics proposed by Hernandez et al. [22] and Dankar et al. [23]. Since ER cannot access RD, this analysis is not performed for RD.
  • Using the obtained SD in CSV format, a forecasting model has been trained with measurements from four hours and tested, making predictions for the next hour.
  • The remote execution of the locally developed algorithm has been requested by the VNL to obtain the evaluation results of applying the same forecasting model to RD.
Table 1. Information fields of the downloaded SD.
FieldDescription
sd_request_idUnique identifier of the SDG request.
hash_query_real
description
timestamp
Hash to identify query of real data results.
Description of the query used for SDG.
Date of when the SD has been generated.
This process has been iteratively executed, requesting SD for four more hours until we obtained a complete SD asset with the measurements of a complete day, six iterations in total. The VNL architecture has been deployed with docker technology and tested in a virtual machine configured with an 8-cores CPU running at 2.30 GHz, 32 GB of SSD storage, and 128 GB RAM memory. The SDG approach used has been the Probabilistic AutoRegressive (PAR) model from the SDV library [28]. Training this model with the complete asset of heart rate measurements and 5000 epochs has taken 46 h (33 s per epoch). The generation of SD took around 2 h for each SD asset. Additionally, we tried to use the tabular data model from the same package. Even though the training and generation time is significantly lower (less than 5 min), the generated data was less representative and did not resemble the time nature of RD.
The downloaded SD files can be accessed as Supplementary Materials: Data S2 SD Information files, Data S3 SD in JSON format, and Data S4 SD in CSV format. For the resemblance evaluation of SD and the forecasting analysis explained in the next sections, data downloaded in CSV format has been used. In the next subsections, the results of the resemblance evaluation and the forecasting local and remote analyses are presented.

3.2.1. Resemblance Evaluation of Generated SD

The quality of the generated SD has been analyzed using some resemblance evaluation metrics and methods inspired by Hernandez et al. [22] and Dankar et al. [23]. As the generated SD corresponds to heart rate measurements in periods of time for a whole day (24 h), the used metrics and methods attempt to evaluate if the temporal nature and characteristics of RD measurements are fulfilled in SD measurements. The results of applying these resemblance evaluation metrics and methods are explained in this section, and the Jupyter Notebook used for it can be found as a Supplementary Material (Results S1 Resemblance evaluation).
First, a basic statistical analysis of the time series has been made, computing the mean and standard deviation (std) of heart rate values. Table 2 shows the mean and std values of the heart rate measurements for both RD and SD. The mean values from all the iterations indicate that despite being higher for SD on the initial iterations (with fewer hours of data volume requested), it was higher for RD on the last iterations (with more data volume being evaluated). Regarding the std, the values for RD are higher for all iterations. Iteration number 4 is considered to have the most similar statistics.
As shown in Table 2, the mean and std values are different between RD and SD on each iteration. To discover the significance of those differences, hypothetical testing techniques have been applied. The difference in means of each iteration has been evaluated with a Student’s t-test considering a significant difference between them as the alternative hypothesis. A Kolmogorov–Smirnov test has also been used to analyze whether the distributions of RD and SD are equal, considering a significant difference between them as the alternative hypothesis. Nearly all the p-values of both tests are close to 0, meaning that most of the null hypotheses are rejected. It must be mentioned that only the null hypothesis stating that means of RD and SD are equal has been accepted for Iteration 4. From these results, it can be confirmed that in most of the iterations, neither the mean nor the distribution of RD and SD are equal.
To understand better the values of heart rate, two plots have been analyzed for each SD request, a distribution plot, shown on the left of each iteration in Figure 6, and a boxplot, shown on the right of each iteration. The distribution plot shows that, effectively, the distributions of SD and RD are not equal, but their shape is quite similar, which indicates that SD represents quite well RD measurements. The boxplots also suggest that although SD measurements are not identical to RD measurements, most of the measurements of both RD and SD lay in approximately the same value range.
After analyzing the resemblance of the SD measurements, the resemblance of the temporal nature has been analyzed for each requested SD. For that, the autocorrelation of RD and SD has been measured, as each data point is highly correlated with the previous ones. As shown in Figure 7, the autocorrelation of SD does not exactly fit the autocorrelation of RD on each iteration. However, the autocorrelation plots of all the iterations imply a temporal nature of data, meaning that SD has been able to maintain the temporal nature of RD.
To analyze the resemblance of RD and SD in terms of time trends, a time plot has been analyzed for both RD and SD for each requested SD. As can be observed in Figure 8, the generated SD implies similar temporal nature that looks like a realistic time series, even if the SD values do not reach the highest values of RD.

3.2.2. Data Forecasting Analyses

After evaluating the resemblance of the characteristics and nature of SD and RD, a forecasting analysis has been developed for each requested SD locally. Forecasting is the process of predicting the next data points of a time series based on previous data points [46]. This type of analysis could be one of the experiments that ER would develop locally with SD and then schedule to run remotely with RD.
Considering that ER only has access to SD, the forecasting analysis has been locally developed with SD, tailoring all the forecasting parameters to it, and then the remote execution of it with RD has been requested to the VNL. This way, the Remote Execution Engine has been able to execute the forecasting analysis remotely with RD and to return the obtained results to ER. This process has been iteratively executed for the six SD requests, each one with more data points than the previous one.
In the aforementioned experiment, the Seasonal AutoRegressive Integrated Moving Average with eXogenous regressors (SARIMAX) model [47] has been trained and evaluated in all analyses. The forecasting model has been trained with all data points except for the data points corresponding to the last hour for each SD asset. The last hour of each asset has been used to evaluate the forecasting model. Analyses scripts have been developed in a Jupyter Lab environment. Local execution was run in the previously introduced virtual machine used for the workflow execution (8-cores 2.30 GHz, 32 GB SSD disk storage, and 128 GB RAM memory). The execution time was approximately 2 h for each locally executed (LE) and remotely executed (RE) analysis. The code of each forecasting analysis is attached as Supplementary Material (Results S2 Forecasting Analyses).
To evaluate the model performance and compare the real values with the predicted values, the Mean Forecasting Error (MFE), Mean Absolute Error (MAE), Mean Squared Error (MSE), and the Root Mean Squared Error (RMSE) have been used. Table 3 shows the results of this forecasting analysis for each iteration and both cases: the LE analysis with SD and the RE analysis with RD (results file attached as Supplementary Material with the title of Results S3 Remote Execution). The lower these metrics are, the better the ML model is. In the Table, the metric values of the winning forecasting model for both RD and SD are typed in bold and marked with *.
The forecasting analyses developed locally with SD gave satisfactory results, obtaining MFE values below 15. Even though the results from the forecasting executed remotely with RD are different from the ones obtained for SD, the MFE values are lower and remain in a similar range. Apart from that, the results show that using more data samples will not always mean that the prediction would be better. However, ER can decide using their own strategy which ML model to disseminate and exploit.
The obtained results have shown that the winning forecasting model is not matched for RD and SD. For the LE models with SD, the best forecasting model has been obtained in the fourth iteration (trained with 7808 samples), whereas for the RE models with RD, the best one has been obtained in the first iteration (trained with 1952 samples). Thus, from the developed analyses, the model to be disseminated and exploited would be the model trained on the first iteration using 1952 since it is the one with the best results for the RE analyses.

4. Discussion

In this section, the results obtained from the workflow execution are discussed, and the main findings, limitations, and future work of the developed research are presented.

4.1. SDG Integrated Workflow Execution Results

The real-world usage example of the workflow execution with heart rate measurements has been performed successfully. First, heart rate measurements data from an LLs has been correctly stored and transformed to the VITALISE data format in the VNL. Then, the SD version of the heart rate measurements has been requested and obtained for different data sizes in two data formats (JSON and CSV). Finally, local analysis has been performed with each obtained SD asset, and the remote execution of the same analyses with RD have been requested.
The downloaded SD in CSV format for each requested SD has been evaluated in terms of resemblance with RD. In this analysis, it has been proven that although measurements from SD are not equal to measurements from RD in all cases, basic characteristics and trends from RD are preserved in SD. Since the aim of this paper is to present the SDG-enabled VITALISE LLs controlled data processing workflow and verify its usefulness, an accurate resemblance of SD to RD is not critical. However, solid results have been obtained; SD has resembled most of the heart rate measurements of RD, preserving the distributions and temporal nature of RD measurements while keeping the privacy of RD.
The developed forecasting analyses have shown that when performing an analysis locally with SD and when doing it remotely with RD, similar prediction errors are obtained. An extensive parameter tunning was not performed since the objective of this analysis is to show the differences between the results of performing an analysis locally (with SD) and remotely (with RD), instead of obtaining the best forecasting model for heart rate measurement predictions. Although prediction errors are different for both analyses in all the iterations, lower prediction errors have been obtained with the analyses executed remotely with RD in most cases. However, the winning forecasting model is not the same as the models trained on SD and RD. This illustrates how the SD generated by the iterative execution of the workflow can be used to check the feasibility of ML models being generated, helping in the design and implementation of the best final ML model which can be built and evaluated with RD. In conclusion, with the presented results, it can be assured that the proposed workflow can be used for AI and ML model development without having access to RD, thus, ensuring compliance with personal data protection laws.
With these results, it has been demonstrated the efficiency of the presented workflow and how it can be used for a secure data exchange with real-world example usage. Furthermore, the obtained results are good enough to ensure that the workflow can be applied to other types of data and analyses in the future, not limited to the health and wellbeing domain, but also applying it to other domains where privacy concerns can arise, such as education, industrial processes, business, etc. Implementation of this workflow for privacy-preserving data processing can also be motivated by intellectual property rights protection and the uninterrupted operation of basic necessities services in the current cyber security threats context.

4.2. Main Findings

This paper has demonstrated that SDG techniques can be successfully integrated and automated within a controlled data processing workflow in the health and wellbeing domain. More specifically, through a real-world usage example, it has been shown that the VITALISE LLs controlled data processing workflow helps accelerate research on AI and ML model development, ensuring compliance with data protection laws.
Furthermore, the proposed approach overcomes the lack of a complete pipeline or workflow that integrates and automates SDG logic to enable researchers to develop their own analysis scripts with SD locally and execute them remotely in a controlled environment with RD.
Through the upload of heart rate measurements, SDG of those values, local forecasting analyses with SD, and remote forecasting analysis with RD, the efficiency and utility of the complete workflow have been demonstrated and validated.
The developed work is the first attempt to incorporate SDG techniques into a complete controlled data processing workflow (i.e., VITALISE LLs controlled data processing workflow) which ensures compliance with personal data protection laws.

4.3. Limitations and Future Work

The initial implementation of the presented workflow has allowed us to validate the approach, identify limitations, and spot future research areas to overcome identified limitations and extend current capabilities.
The complete execution of the workflow relies on ER satisfaction with the obtained results from the local experiments (executed with requested SD assets) and/or the remote experiments (executed with RD). If ER is constantly making SD requests or remote execution requests to the VNL, the workflow could suffer from computational resources overload. To overcome this issue, the definition and implementation of a strategy to limit the number of requests that ER can make to the VNL is planned. This limitation can be applied for monthly, weekly, or daily use, depending on the needs of ER and computational resources’ availability.
Currently, the presented workflow has been implemented for heart rate measurements from Fitbit devices captured from LLs. As the VITALISE data model definition advances according to LLs managers’ requests for types of data to be supported, the logic is being extended to support more data (types and source devices) generated from LLs, in addition to the already implemented heart rate measurements.
Regarding the first step of the workflow, every time new data is uploaded, an SDG approach is trained using all available data. This step could not be very efficient as the execution time might be slowed down. Thus, for a future version of the workflow, it is intended to decouple both operations and make the option to train an SDG to LLs when they desire instead of training it each time new data is available. This improvement will speed up the execution time of the first step of the workflow and give the opportunity to train a new SDG approach when LLs managers find it necessary with the desired data. Additionally, research is ongoing to enable automatic SDG model training (either suggesting LLs manager or directly starting model update) based on periodic evaluation of dataset statistics.
Another limitation of this work is that only one SDG technique has been incorporated in the workflow, and with this technique, the training of the approach and the generation of SD takes a long time. Nevertheless, the execution time would depend on the available hardware and the implemented SDG technique. Other SDG approaches need less time for training and generation, but they are not suitable for time-series data. The incorporation of only one SDG technique could also be a problem when more diverse data types are supported by the VITALISE platform due to the incompatibility between the implemented technique and the nature of the data. To solve this problem, it is intended to incorporate different SDG techniques for different data types (tabular, time-series, signals, etc.), together with the implementation of a logic for deciding which SDG technique will generate better SD considering the available data. Furthermore, the long training and SD generation time of the used SDG technique indicates that we should streamline the process of SDG. For this, a strategy that can queue the tasks of SDG in a way in which different SDG approaches are trained at the same time should be used, as well as research alternative approaches to current FIFO queues to guarantee fairer scheduling.
The effect on privacy of iterative complementary SD requests to the proposed framework has not been analyzed since the objective of the study is to demonstrate the integration of SDG approaches in our controlled data processing workflow. However, the analysis of these issues, such as subjects re-identification or privacy breaches, will be further analyzed, together with the proposed framework’s extension with countermeasures to avoid disclosure of sensitive information as a result of these types of privacy attacks.
Furthermore, an automatic and optimized parameter tuning for the implemented SDG approaches will be developed. This way, the best parameters of each SDG technique and RD combination can be found and applied with the objective to generate SD of better quality. Together with this improvement, when ER requests SD, metrics will also be provided to indicate the quality of SD compared to RD. This will give ER a better understanding of how RD might be without seeing it and help them perform better AI and ML model development. Besides, the provision of these metrics can help ER in the decision of requesting SD for a new query or developing another algorithm with the same SD.
Additionally, to give a higher utility to the workflow and enable ER to conduct more complete and specific analysis, the functionality to request SD for specific queries (that meet a series of conditions) is planned. This way, ER will be able to retrieve SD and develop and run algorithms for more specific experimental datasets created from more complex queries that could involve different data types. For example, ER will be able to request an SD version of heart rate, steps, and oxygen saturation of people above 40 years old. With this option, the complete workflow will be used in more varied types of analysis, improving its utility. This improvement will also affect the logic for SDG approaches training, enabling offering ERs two alternatives; (i) faster responding and probably less quality pre-trained generic SDG models and (ii) query-based on-situ SDG model training, which will have an extended SD generation time requirement, but presumably better-quality SD (i.e., increased resemblance and utility).

Supplementary Materials

The following supporting information can be downloaded at: https://www.mdpi.com/article/10.3390/electronics11050812/s1, Data S1 Original Fitbit heart rate measurements; Data S2 SD Information; Data S3 SD in JSON format; Data S4 SD in CSV format; Results S1 Resemblance evaluation; Results S2 Forecasting Analyses; Results S3 Remote Execution.

Author Contributions

Conceptualization, M.H., G.E., A.B. and R.Á.; Data curation, M.H., R.Á. and X.L.; Funding acquisition, G.E., P.B. and E.K.; Investigation, M.H. and G.E.; Methodology, G.E.; Project administration, G.E. and E.K.; Software, M.H., G.E., A.B., R.Á., C.M. and X.L.; Supervision, G.E.; Validation, M.H. and X.L.; Visualization, M.H. and X.L.; Writing—original draft, M.H.; Writing—review & editing, M.H., G.E., A.B., C.M., X.L., A.A., M.T. and E.K. All authors have read and agreed to the published version of the manuscript.

Funding

This research was partly funded by the VITALISE (Virtual Health and Wellbeing Living Lab Infrastructure) project, funded by the Horizon 2020 Framework Program of the European Union for Research Innovation (grant agreement 101007990).

Data Availability Statement

The data presented in this study is available as supplementary material.

Acknowledgments

VITALISE Consortium partners and external persons participating in requirements shaping open sessions.

Conflicts of Interest

The authors declare no conflict of interest.

References

  1. El Emam, K.; Hoptroff, R. The Synthetic Data Paradigm for Using and Sharing Data. Data Anal. Digit. Technol. 2019, 19, 12. [Google Scholar]
  2. Hernandez-Matamoros, A.; Fujita, H.; Perez-Meana, H. A novel approach to create synthetic biomedical signals using BiRNN. Inf. Sci. 2020, 541, 218–241. [Google Scholar] [CrossRef]
  3. Piacentino, E.; Guarner, A.; Angulo, C. Generating Synthetic ECGs Using GANs for Anonymizing Healthcare Data. Electronics 2021, 10, 389. [Google Scholar] [CrossRef]
  4. Hazra, D.; Byun, Y.-C. SynSigGAN: Generative Adversarial Networks for Synthetic Biomedical Signal Generation. Biology 2020, 9, 441. [Google Scholar] [CrossRef] [PubMed]
  5. Andreini, P.; Ciano, G.; Bonechi, S.; Graziani, C.; Lachi, V.; Mecocci, A.; Sodi, A.; Scarselli, F.; Bianchini, M. A Two-Stage GAN for High-Resolution Retinal Image Generation and Segmentation. Electronics 2022, 11, 60. [Google Scholar] [CrossRef]
  6. Porcu, S.; Floris, A.; Atzori, L. Evaluation of Data Augmentation Techniques for Facial Expression Recognition Systems. Electronics 2020, 9, 1892. [Google Scholar] [CrossRef]
  7. Han, C.; Hayashi, H.; Rundo, L.; Araki, R.; Shimoda, W.; Muramatsu, S.; Furukawa, Y.; Mauri, G.; Nakayama, H. GAN-based synthetic brain MR image generation. In Proceedings of the 2018 IEEE 15th International Symposium on Biomedical Imaging (ISBI 2018), Washington, DC, USA, 4–7 April 2018; pp. 734–738. [Google Scholar]
  8. Stephens, M.; Estepar, R.S.J.; Ruiz-Cabello, J.; Arganda-Carreras, I.; Macía, I.; López-Linares, K. MRI to CTA Translation for Pulmonary Artery Evaluation Using CycleGANs Trained with Unpaired Data. In Thoracic Image Analysis, Proceedings of the Thoracic Image Analysis, Lima, Peru, 8 October 2020; Petersen, J., San José Estépar, R., Schmidt-Richberg, A., Gerard, S., Lassen-Schmidt, B., Jacobs, C., Beichel, R., Mori, K., Eds.; Springer International Publishing: Cham, Germany, 2020; pp. 118–129. [Google Scholar]
  9. Dahmen, J.; Cook, D. SynSys: A Synthetic Data Generation System for Healthcare Applications. Sensors 2019, 19, 1181. [Google Scholar] [CrossRef] [PubMed] [Green Version]
  10. Norgaard, S.; Saeedi, R.; Sasani, K.; Gebremedhin, A.H. Synthetic Sensor Data Generation for Health Applications: A Supervised Deep Learning Approach. In Proceedings of the 2018 40th Annual International Conference of the IEEE Engineering in Medicine and Biology Society (EMBC), Honolulu, HI, USA, 18–21 July 2018; pp. 1164–1167. [Google Scholar]
  11. Li, Z.; Ma, C.; Shi, X.; Zhang, D.; Li, W.; Wu, L. TSA-GAN: A Robust Generative Adversarial Networks for Time Series Augmentation. In Proceedings of the 2021 International Joint Conference on Neural Networks (IJCNN), Shenzhen, China, 18–22 July 2021; IEEE: Shenzhen, China, 2021; pp. 1–8. [Google Scholar]
  12. Wang, J.; Chen, Y.; Gu, Y.; Xiao, Y.; Pan, H. SensoryGANs: An Effective Generative Adversarial Framework for Sensor-based Human Activity Recognition. In Proceedings of the 2018 International Joint Conference on Neural Networks (IJCNN), Rio de Janeiro, Brazil, 8–13 July 2018; pp. 1–8. [Google Scholar]
  13. Rankin, D.; Black, M.; Bond, R.; Wallace, J.; Mulvenna, M.; Epelde, G. Reliability of Supervised Machine Learning Using Synthetic Data in Health Care: Model to Preserve Privacy for Data Sharing. JMIR Med. Inform. 2020, 8, e18910. [Google Scholar] [CrossRef] [PubMed]
  14. Yale, A.; Dash, S.; Dutta, R.; Guyon, I.; Pavao, A.; Bennett, K.P. Generation and evaluation of privacy preserving synthetic health data. Neurocomputing 2020, 416, 244–255. [Google Scholar] [CrossRef]
  15. Beaulieu-Jones Brett, K.; Wu, Z.S.; Williams, C.; Lee, R.; Bhavnani, S.P.; Byrd, J.B.; Greene, C.S. Privacy-Preserving Generative Deep Neural Networks Support Clinical Data Sharing. Circ. Cardiovasc. Qual. Outcomes 2019, 12, e005122. [Google Scholar] [CrossRef] [PubMed]
  16. Wang, Z.; Myles, P.; Tucker, A. Generating and Evaluating Synthetic UK Primary Care Data: Preserving Data Utility Patient Privacy. In Proceedings of the 2019 IEEE 32nd International Symposium on Computer-Based Medical Systems (CBMS), Cordoba, Spain, 5–7 June 2019; pp. 126–131. [Google Scholar]
  17. Rashidian, S.; Wang, F.; Moffitt, R.; Garcia, V.; Dutt, A.; Chang, W.; Pandya, V.; Hajagos, J.; Saltz, M.; Saltz, J. SMOOTH-GAN: Towards Sharp and Smooth Synthetic EHR Data Generation. In Artificial Intelligence in Medicine, Proceedings of the Artificial Intelligence in Medicine, Minneapolis, MN, USA, 25–28 August 2020; Michalowski, M., Moskovitch, R., Eds.; Springer International Publishing: Cham, Germany, 2020; pp. 37–48. [Google Scholar]
  18. Yoon, J.; Drumright, L.N.; van der Schaar, M. Anonymization Through Data Synthesis Using Generative Adversarial Networks (ADS-GAN). IEEE J. Biomed. Health Inform. 2020, 24, 2378–2388. [Google Scholar] [CrossRef] [PubMed]
  19. Baowaly, M.K.; Lin, C.-C.; Liu, C.-L.; Chen, K.-T. Synthesizing electronic health records using improved generative adversarial networks. J. Am. Med. Inform. Assoc. 2019, 26, 228–241. [Google Scholar] [CrossRef] [PubMed]
  20. Che, Z.; Cheng, Y.; Zhai, S.; Sun, Z.; Liu, Y. Boosting Deep Learning Risk Prediction with Generative Adversarial Networks for Electronic Health Records. In Proceedings of the 2017 IEEE International Conference on Data Mining (ICDM), New Orleans, LA, USA, 18–21 November 2017; pp. 787–792. [Google Scholar]
  21. Goncalves, A.; Ray, P.; Soper, B.; Stevens, J.; Coyle, L.; Sales, A.P. Generation and evaluation of synthetic patient data. BMC Med. Res. Methodol. 2020, 20, 108. [Google Scholar] [CrossRef] [PubMed]
  22. Hernandez, M.; Epelde, G.; Alberdi, A.; Cilla, R.; Rankin, D. Standardised Metrics and Methods for Synthetic Tabular Data Evaluation. 2021. [CrossRef]
  23. Dankar, F.K.; Ibrahim, M.K.; Ismail, L. A Multi-Dimensional Evaluation of Synthetic Data Generators. IEEE Access 2022, 10, 11147–11158. [Google Scholar] [CrossRef]
  24. SYNTHO. Available online: https://www.syntho.ai/ (accessed on 13 January 2022).
  25. The Medkit-Learn(ing) Environment. Available online: https://github.com/vanderschaarlab/medkit-learn (accessed on 24 January 2022).
  26. Soni, R.; Zhang, M.; Avinash, G.B.; Saripalli, V.R.; Guan, J.; Pati, D.; Ma, Z. Medical Machine Synthetic Data and Corresponding Event Generation 2020. U.S. Patent Application No. 16/689,798, 29 October 2020. [Google Scholar]
  27. Build Better Datasets for AI with Synthetic Data. Available online: https://ydata.ai (accessed on 24 January 2022).
  28. The Synthetic Data Vault. Put Synthetic Data to Work! Available online: https://sdv.dev/ (accessed on 24 January 2022).
  29. VITALISE Project. Available online: https://vitalise-project.eu/ (accessed on 24 January 2022).
  30. Why VITALISE. Available online: https://vitalise-project.eu/why-vitalise/ (accessed on 13 January 2022).
  31. Rieke, N.; Hancox, J.; Li, W.; Milletarì, F.; Roth, H.R.; Albarqouni, S.; Bakas, S.; Galtier, M.N.; Landman, B.A.; Maier-Hein, K.; et al. The future of digital health with federated learning. NPJ Digit. Med. 2020, 3, 119. [Google Scholar] [CrossRef] [PubMed]
  32. Hallock, H.; Marshall, S.E.; Peter, A.C.’t.H.; Nygård, J.F.; Hoorne, B.; Fox, C.; Alagaratnam, S. Federated Networks for Distributed Analysis of Health Data. Front. Public Health 2021, 9, 712569. [Google Scholar] [CrossRef] [PubMed]
  33. MongoDB Documentation. Available online: https://docs.mongodb.com/ (accessed on 24 January 2022).
  34. Messaging That Just Works—RabbitMQ. Available online: https://www.rabbitmq.com/ (accessed on 24 January 2022).
  35. MinIO, Inc. MinIO|High Performance, Kubernetes Native Object Storage. Available online: https://min.io (accessed on 24 January 2022).
  36. FastAPI. Available online: https://fastapi.tiangolo.com/ (accessed on 24 January 2022).
  37. Celery-Distributed Task Queue—Celery 5.2.3 Documentation. Available online: https://docs.celeryproject.org/en/stable/ (accessed on 24 January 2022).
  38. Dalsania, N.; Patel, Z.; Purohit, S.; Chaudhury, B. An Application of Machine Learning for Plasma Current Quench Studies via Synthetic Data Generation. Fusion Eng. Des. 2021, 171, 112578. [Google Scholar] [CrossRef]
  39. Zhang, C.; Kuppannagari, S.R.; Kannan, R.; Prasanna, V.K. Generative Adversarial Network for Synthetic Time Series Data Generation in Smart Grids. In Proceedings of the 2018 IEEE International Conference on Communications, Control and Computing Technologies for Smart Grids (SmartGridComm), Aalborg, Denmark, 29–31 October 2018; pp. 1–6. [Google Scholar]
  40. Alqahtani, H.; Kavakli-Thorne, M.; Kumar, G. Applications of Generative Adversarial Networks (GANs): An Updated Review. Arch. Comput. Methods Eng. 2019, 28, 525–552. [Google Scholar] [CrossRef]
  41. Patki, N.; Wedge, R.; Veeramachaneni, K. The Synthetic Data Vault. In Proceedings of the 2016 IEEE International Conference on Data Science and Advanced Analytics (DSAA), Montreal, QC, Canada, 17–19 October 2016; pp. 399–410. [Google Scholar]
  42. Hittmeir, M.; Mayer, R.; Ekelhart, A. A Baseline for Attribute Disclosure Risk in Synthetic Data. In Proceedings of the Tenth ACM Conference on Data and Application Security and Privacy, New Orleans, LA, USA, 16–18 March 2020; Association for Computing Machinery: New York, NY, USA, 2020; pp. 133–143. [Google Scholar]
  43. Mayer, R.; Hittmeir, M.; Ekelhart, A. Privacy-Preserving Anomaly Detection Using Synthetic Data. In Data and Applications Security and Privacy XXXIV; Singhal, A., Vaidya, J., Eds.; Lecture Notes in Computer Science; Springer International Publishing: Cham, Germany, 2020; Volume 12122, pp. 195–207. ISBN 978-3-030-49668-5. [Google Scholar]
  44. Hittmeir, M.; Ekelhart, A.; Mayer, R. Utility and Privacy Assessments of Synthetic Data for Regression Tasks. In Proceedings of the 2019 IEEE International Conference on Big Data (Big Data), Los Angeles, CA, USA, 9–12 December 2019; pp. 5763–5772. [Google Scholar]
  45. Hittmeir, M.; Ekelhart, A.; Mayer, R. On the Utility of Synthetic Data: An Empirical Evaluation on Machine Learning Tasks. In Proceedings of the 14th International Conference on Availability, Reliability and Security, Canterbury, UK, 26–29 August 2019; ACM: Canterbury, UK, 2019; pp. 1–6. [Google Scholar]
  46. Hyndman, R.J.; Athanasopoulos, G. Forecasting: Principles and Practice; OTexts: Melbourne, VIC, Australia, 2018; ISBN 978-0-9875071-1-2. [Google Scholar]
  47. SARIMAX: Introduction-Statsmodels. Available online: https://www.statsmodels.org/dev/examples/notebooks/generated/statespace_sarimax_stata.html (accessed on 24 January 2022).
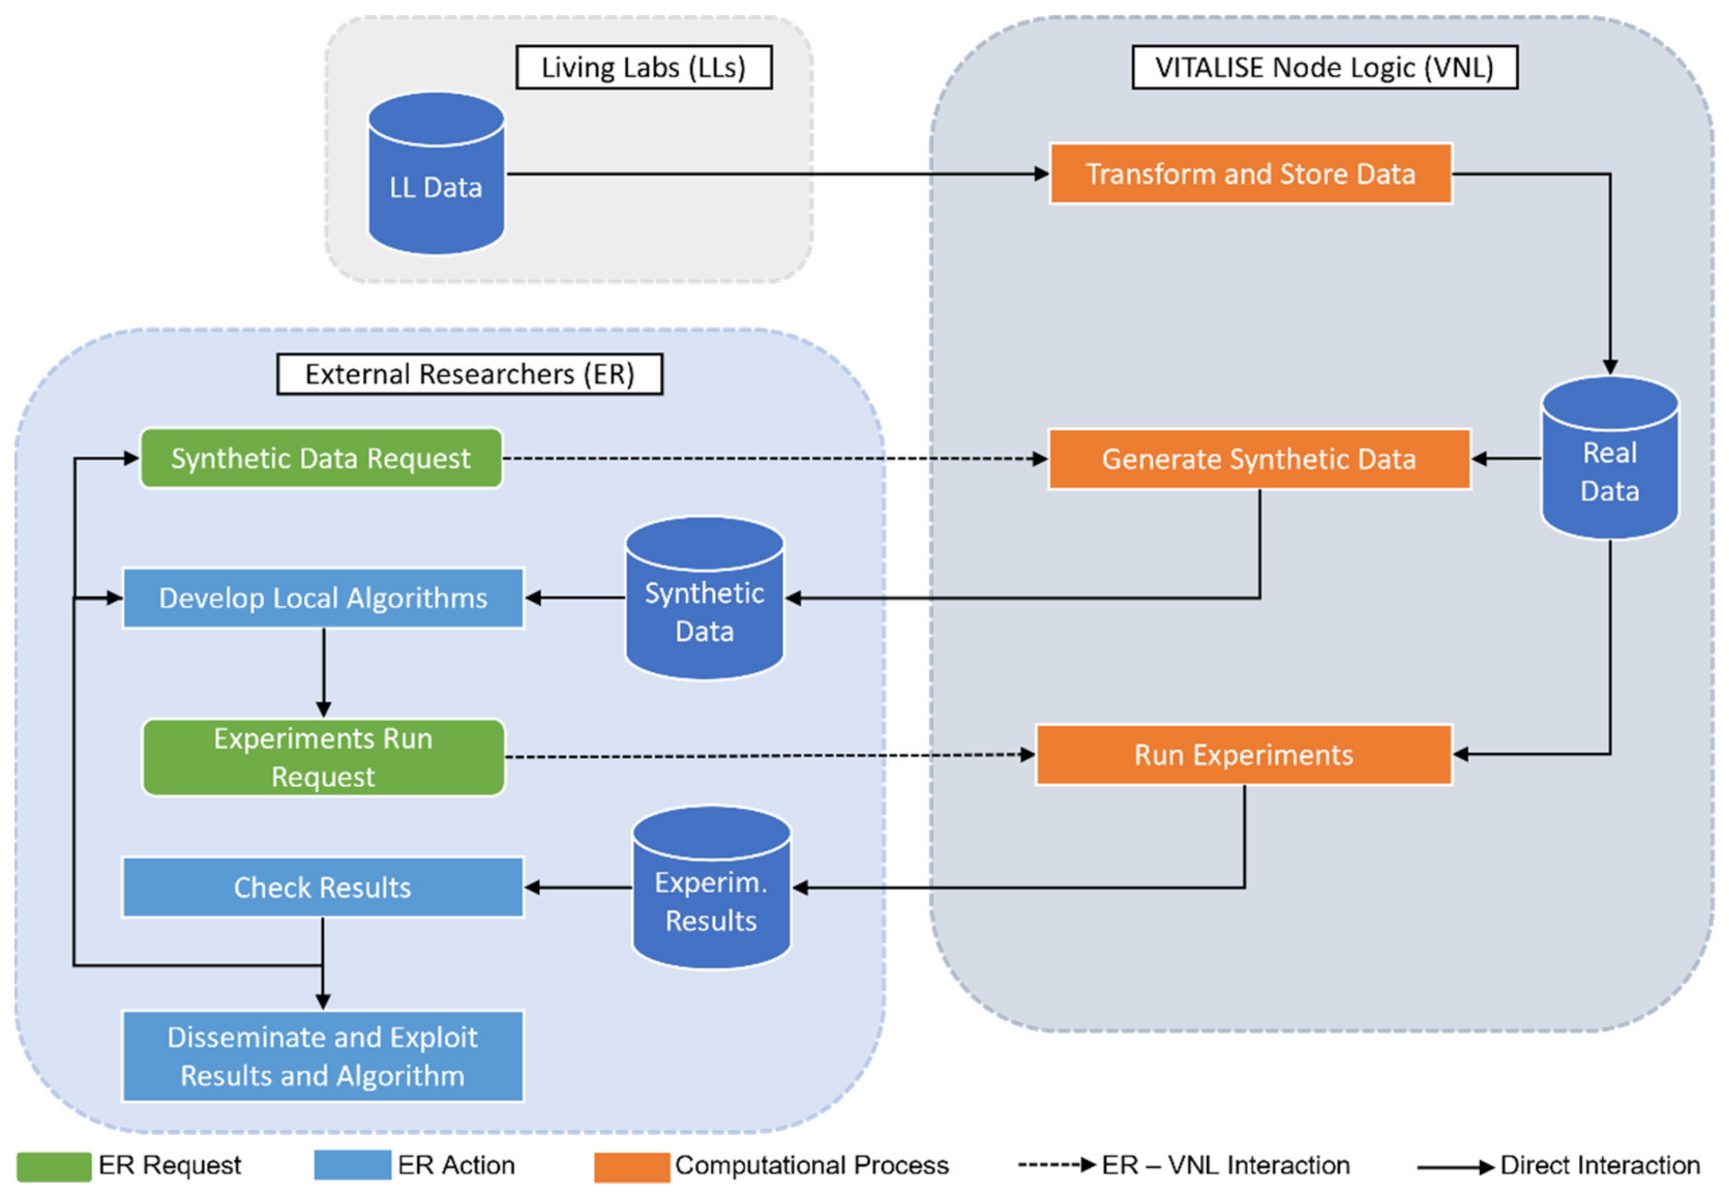
Figure 1. VITALISE LL controlled data processing workflow diagram.
Electronics 11 00812 g001
Figure 2. Components of the VITALISE Node Logic.
Electronics 11 00812 g002
Figure 3. SDG model training workflow.
Electronics 11 00812 g003
Figure 4. SDG workflow.
Electronics 11 00812 g004
Figure 5. SD downloading workflow.
Electronics 11 00812 g005
Figure 6. Visual Comparison of heart rate measurements distribution for RD and SD. Each pair of plots corresponds to one iteration. On the left of each iteration, the distribution plot of both RD and SD heart rate measurements is shown. In the right of each iteration, the boxplots of both RD and SD heart rate measurements can be seen.
Electronics 11 00812 g006
Figure 7. Autocorrelation plots of heart rate measurements for each iteration. In the right of each iteration, the autocorrelation plot of the RD data can be seen and on the left, the autocorrelation plot of SD.
Electronics 11 00812 g007
Figure 8. Time plot for visual comparison of RD and SD heart rate measurement values. Each plot corresponds to one iteration of the executed workflow.
Electronics 11 00812 g008
Table 2. Mean and Standard Deviation Values of Heart Rate Measurements for RD and SD.
It. Data SizeMeanstd
1RD244074.37±11.76
SD79.64±8.8
2RD439271.07±11.64
SD76.11±8.86
3RD634474.33±12.37
SD74.91±9.9
4RD829675.66±11.71
SD75.91±10.02
5RD10,24877.54±12.04
SD76.71±9.54
6RD11,72477.36±11.66
SD75.16±9.09
Table 3. Results of the forecasting analysis performed with heart rate data measurements for both RD and SD.
It. Train SizeTest SizeMFEMAEMSERMSE
1RD (RE) *19524883.7848 *4.6536 *38.4651 *6.2020 *
SD (LE)13.370913.3873233.155615.2691
2RD (RE)39044885.13356.989772.89148.5376
SD (LE)4.82788.0245112.418110.6027
3RD (RE)58564888.403610.2930191.526613.8393
SD (LE)1.48778.4385100.610610.0304
4RD (RE)78084889.811410.6352189.725413.7740
SD (LE)*2.1701 *6.6331 *62.1659 *7.8845 *
5RD (RE)97604886.29509.2991149.463112.225
SD (LE)2.73777.377076.28278.7341
6RD (RE)11,2245008.28608.6740105.970010.2941
SD (LE)5.37807.314089.04209.4362
Publisher’s Note: MDPI stays neutral with regard to jurisdictional claims in published maps and institutional affiliations.