Abstract
A UAV-assisted cellular network can provide ubiquitous links to everything and it is considered to be one of the key technologies for 6G wireless networks. In this paper, we consider an uplink wireless network with a macrobase station (MBS) and cellular users. However, the coverage equality of edge users cannot be guaranteed in scenarios where data service is dense. Specifically, a novel topology of the UAV-assisted wireless network is considered. UAVs are deployed upon the cell edge to serve edge users with poor communication quality. To avoid larger interference caused by users and UAVs in the overlapping area, the locations of these UAVs are modeled as a homogeneous Poisson point process (HPPP) under the Poisson cluster distance constraint (PCDC). In addition, we assume that edge users cluster around each UAV and model their locations as Poisson cluster processes (PCPs). Initially, the Laplace transforms of intra-cluster interference, inter-cluster interference, and other interference are derived. Subsequently, coverage probability and area spectrum efficiency are derived for UAVs and MBS using tools from stochastic geometry. Moreover, the energy efficiency of the system is obtained. Simulation results are examined to validate the accuracy of theoretical analysis and provide insights into the effects of the system parameters as well as useful guidelines for practical system design.
1. Introduction
With the commercialization of fifth-generation (5G) networks, technologies for the next-generation (6G) communications are also being explored to achieve faster and more reliable data transmissions. However, with this development, wireless networks will have to provide connections to hundreds of billions of devices, and current cellular technology will face tougher challenges caused by massive connections [1,2]. Traditional wireless networks infrastructure on the ground often faces overload or malfunction, and the new technology with 5G that deploys dense low-power base stations (BSs) to offload users in adjacent cells can improve the communication equality of every user [3]. Providing stable communication quality is important in unexpected scenarios, especially in collapse areas, sports events, outdoor concerts, or other temporary emergency special scenes. The air-to-ground (AG) communication will be a technology for future wireless communications [4]. The unmanned aerial vehicle (UAV)-assisted wireless network is emerging as a potential solution for estabilishing emergency networks with high mobility and air-ground line-of-sight (LoS) links [5]. Initially, UAV is used primarily for military affairs. However, in recent years, civilian UAVs have played an important role because of its flexibility of deployment, equipment miniaturization, and substantial cost reduction [6], especially in temporary events [7], logistics industries [8], and emergency search and rescue operations [9]. In addition, UAVs can combine with the reconfigurable intelligent surface (RIS) [10,11] to improve communication quality in LoS-blocked scenarios. Therefore, the assistance of UAVs has significant impacts on providing reliable communication in some special areas with limited communication infrastructure [12].
Due to more uncertain environments and more complex tasks, the UAV system will develop in the direction of clustering, autonomy, and intelligence [13]. There are multiple factors to consider in UAV-assisted wireless networks, and efficient three-dimensional (3D) deployment is one of the key challenges [14]. A reasonable three-dimensional (3D) deployment of UAV swarms [15] can not only significantly ameliorate the Quality of Service (QoS) of users but also provide higher coverage quality, especially for users at the cell edge. Therefore, we consider a novel scenario where UAVs are deployed at the cell edge and improve network performance by adjusting the deployment of UAVs and other parameters.
1.1. Related Work
The amalgamation between UAVs and cellular network systems has motivated extensive studies in the past decade. Several studies have suggested that the UAV-assisted cellular network is an effective method to satisfy the exponentially increasing demand for system capacity. To ensure reliable communication in the network, the time that a UAV takes to complete a task was minimized by optimizing trajectory, and the constraint account for the communication equality of the link between the terrestrial base station and the UAV was considered in [16]. The feasibility of UAV operations under existing cellular infrastructure through a practical cell association strategy was analyzed in [17] by considering the deployment of the UAV in the actual scenario. Based on the wireless powered communication (WPC) technique, a UAV was deployed as an aerial base station (ABS) and offered connectivity for IoT terminals, and the uplink performance was analyzed by considering UAV trajectories in [18]. However, these studies have focused on a single UAV to assist cellular networks. Expending to a multi-UAV network, Rohde et al. proposed that UAV swarms with the cellular technology can offload traffic into adjacent cells in [19]. Furthermore, by considering a resilient communication network to continue operations after a calamity, the co-existence of UAVs that were carrying small cells and cellular networks was investigated, the effects of the number of UAVs and their altitudes on the performance of ground users were analyzed in [20]. Moreover, a backhaul scheme was proposed to solve the extra interference caused by the wireless backhaul link in [21]. Different from the existing works that analyzed altitudes of UAVs in the performance analysis of the network, the positions of UAVs in UAV-assisted wireless networks were optimized in [22,23], and the transmission power of UAVs was analyzed in [24]. In the studies reviewed above, the number of UAVs is generally fixed, and the randomness of locations of them is seldom considered, hence the emerging need for the deployment of large-scale UAVs to satisfy the needs of network capacity in hot spot scenarios.
A large-scale UAV-assisted cellular network can be regarded as a temporary and urgent expansion of the existing network. Moreover, the proposal of stochastic geometry provides a new idea for large-scale nodes deployment and performance analysis [25]. Stochastic geometry has also been widely used as an effective mathematical tool in UAV-assisted cellular networks to analyze deployments of UAVs or mobile users [26,27,28,29,30,31]. In [26,27], the locations of UAVs followed a binominal point process (BPP) on finite planes, and the coverage probabilities of the typical ground receiver were analyzed, respectively. Furthermore, UAVs were deployed by using the Poisson point process (PPP) in a 3D plane, and the coverage probability was analyzed by adjusting the signal-to-interference ratio (SIR) threshold and other system parameters in [28]. By considering the distributions of UAVs following PPP, the interference in the directional UAV network was analyzed in [29]. To maximize the coverage probability of the network, the optimal height and density of UAVs were considered by distributing them according to a PPP in [30]. However, the deployment of PPP is not available when the users’ density is relatively high and concentrated around the UAV coverage area. In [31], the locations of users follow Poisson cluster processes (PCPs), and users were deployed around the projections of UAVs, and the coverage performance of UAVs via different path-loss exponents and heights of UAVs was analyzed. The coverage probability and area spectral efficiency were derived by considering the locations of UAVs and users as PCPs in [32]. Therefore, we propose a UAV-assisted cellular network by considering the combination of PPP and PCP to model the locations of nodes. However, users generally cause large interference because of their high density.
In this paper, the Poisson cluster distance constraint (PCDC) strategy is proposed to avoid larger interference caused by users and UAVs in the overlapping area. The locations of users at the cell center served by the macro base station (MBS) follow a homogeneous Poisson point process (HPPP) and edge users served by UAVs deployed as PCPs under PCDC strategy and clustered around each UAV. Using stochastic geometry tools, we analyzed network performance, including the coverage probability and the area spectrum efficiency of UAVs and the MBS and the energy efficiency of a UAV-assisted cellular network.
1.2. Summary and Organization
The summary and organization are as follows:
- By using the tools of stochastic geometry, a novel topology of the uplink UAV-assisted network consisting of MBS, large-scale UAVs, and users is proposed based on the Poisson hole process (PHP) model [33,34]. To improve the communication quality of edge users, we assume that UAVs are deployed on the cell edge to serve edge UAV users (EUUs). Specifically, the locations of center cellular users (CCUs) and UAVs are modeled as independent HPPPs, and EUUs are expected to cluster around each UAV. Hence, different from many previous studies where the locations of users and UAVs are uncorrelated, modeling the locations of EUUs as PCP is more suitable and realistic. Moreover, we combine the HPPP with PCP to provide an appropriate model in some complex scenarios.
- In the practical deployment of large-scale UAVs, there is strong interference caused by users and UAVs in the overlapping coverage. To enhance the coverage rate of UAVs, we proposed the PCDC strategy to model the distributions of UAVs and EUUs. Specially, there are distance constraints between UAVs, and the coverage area of each UAV does not overlap under this strategy. Moreover, using the tools of stochastic geometry, the interference among EUUs, CCUs, UAVs, and MBS is analyzed, respectively.
- The coverage probability and area spectrum efficiency are analyzed from the perspective of the UAV and MBS, respectively. The energy efficiency of the entire network is also investigated. Numerical results have shown that system performance can be further intensified by adjusting the transmit power of EUUs or CCUs, the number of EUUs in each cluster, the radius of the cluster, and other design settings. In particular, there exists an optimal value for the radius of the cluster to maximize the area’s spectrum efficiency.
The remainder of the paper is organized as follows. The UAV-assisted cellular network model and performance metrics are introduced in Section 2. The analysis of interference from cellular users to the UAV and the MBS is discussed in Section 3. The coverage probability and the area spectrum efficiency of UAVs and MBS and the total energy efficiency of the network are analyzed in Section 4. Simulation results and theoretical analysis are shown in Section 5. The conclusion of this paper is provided in Section 6.
2. System Model
2.1. The UAV-Assisted Network Model
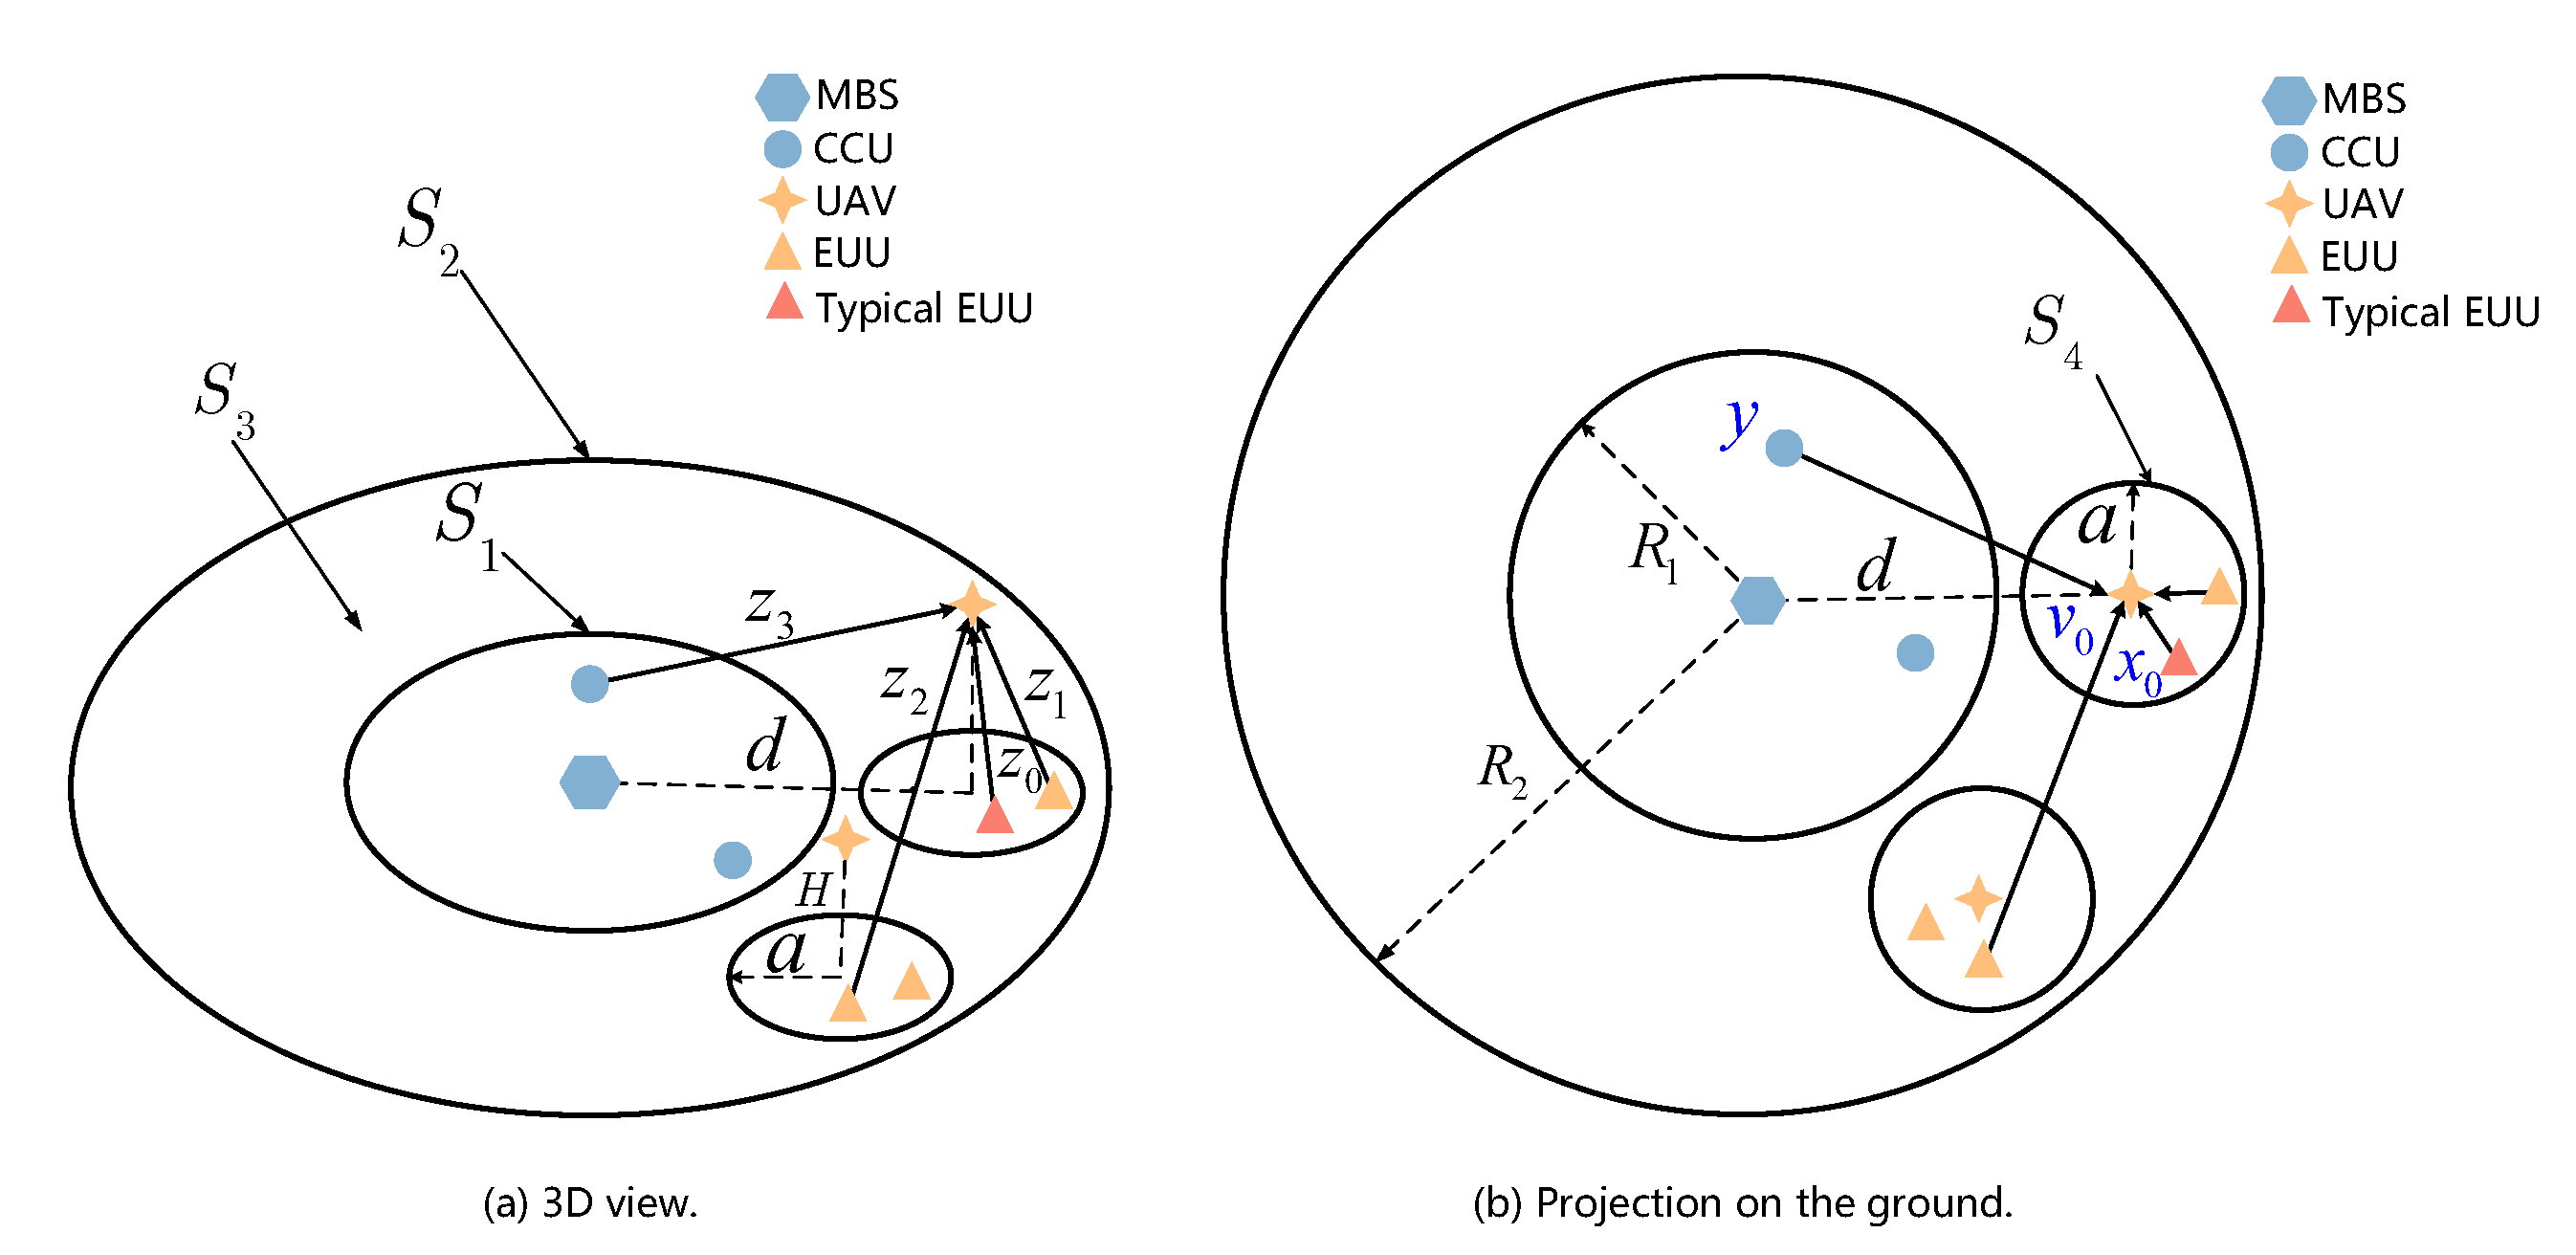
In this paper, we consider the uplink communication in a two-tier UAV-assisted cellular network, which is composed of ground MBS, large-scale UAVs, and cellular users. In some hot scenarios with large data traffic, the communication quality of users located at the edge of the cell is generally not guaranteed. Hence, to solve this problem, we deploy UAVs at the cell edge to provide coverage for improving communication. We divide users into cell-center cellular users and cell-edge UAV users, which are named CCUs and EUUs for simplicity, respectively. The description of the network model is described in Figure 1, and the users are assumed to be deployed in the annulus, and experience poor service connections; to improve their equality of communication, UAVs are deployed to serve EUUs at the cell edge. In particular, we consider a PHP model, where CCUs served by the MBS are modeled by HPPP, , with density , located in the center circle area, . For EUUs, which are connected with UAVs, they are distributed as PCPs, and UAVs are the parent processes, , with density at the cell edge, . The processes are independent of each other. In Figure 1, the coverage area of the network, , is a big disk of radius , , and the center coverage area, , is a small disk of radius , . Each cluster is a disk with radius a, . In addition, UAVs are deployed at the center of each cluster, and the height of UAVs, H, is considered to be a constant to prevent frequent ascension or descension caused by differences in terrain and buildings.
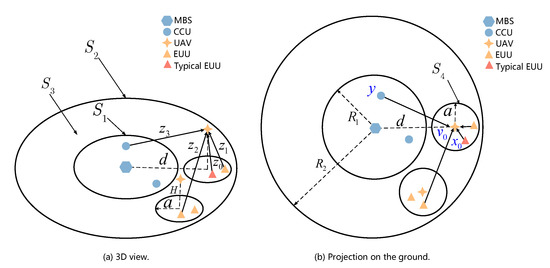
Figure 1.
The network model of UAV-assisted network with clustered edge users.
The distribution of users in the UAV coverage area is normally more densely concentrated near the UAV service area. Using HPPP is not an effective method to model the 3D air-ground network structure. Therefore, compared with the HPPP model, the PCP model is more appropriate and accurate. However, with the increase in the number of CCU nodes, UAV coverage areas will be overlapped, and EUUs in the redundant coverage area will cause large interference to adjacent UAVs. Therefore, based on the model mentioned above, the PCDC strategy is proposed to avoid overlapping of the coverage areas between clusters. The horizontal distance between two adjacent clusters with the UAVs is , where a is the radius of the cluster, and there will be no overlaps between clusters when as shown in Figure 1. The proposed model aims to improve the coverage probability of the system. In addition, the area spectrum efficiency of UAVs and the MBS and the energy efficiency of the network are also considered in this paper.
Three types of interference in the UAV-assisted cellular network are considered in our study, including intra-cluster, inter-cluster, and other interference. Different EUUs transmit information over nonorthogonal subchannels in the same cluster, and hence the intra-cluster interference is considered in this work. As shown in Figure 1, when the typical UAV, , receives information transmitted by a EUU in its coverage area, it will be affected by other EUUs in the same cluster, which is indicated as area . EUUs from the adjacent cluster will cause interference to the typical UAV. Cell-center cellular users in the area also cause interference to the typical UAV. Furthermore, the interference at MBS, which is caused by EUUs deployed in area , is also considered.
2.2. Air-Ground Channel Model
In general, on account of the presence of obstacles on the ground, two sets of different links in the channel between a UAV and a EUU or CCU are considered, which are line-of-sight (LoS) and non-line of sight (NLoS). By using Rician distribution with components and that represent the LoS and NLoS components, respectively, the channel h is given as follows:
where k is the terrestrial user which is EUU or CCU, , R is the Rician factor, and z indicates the distance from the typical EUU or CCU to the connected UAV. In the Rician channel model, when , h indicates a Rayleigh fading model, and when , h indicates an LoS channel.
2.3. Propagation Model
The illustration of the network is discribed in Figure 1, the Signal to Interference plus Noise Ratio (SINR), which is transmited from the typical user at the typical UAV, , from a connected EUU can be expressed as follows:
where , , and indicate the intra interference within the same cluster, the interference from EUUs in adjacent clusters at cell edge, and other-interference from CCUs, respectively. These types of interference are independent; hence, they come from different and uncorrelated sources. denotes the transmit power from the typical EUU, denotes power gain of the channel between the typical EUU and the typical UAV, and presents the power of additive white Gaussian noise (AWGN); is the distance from the connected EUU to the typical UAV within the same cluster, and indicates the path loss exponent. Next, we study the interference , , and , respectively, and then we provide the analytical expression of .
2.3.1. Intra-Cluster Interference
The interference caused by EUUs within the same cluster at the typical UAV is as follows:
where denotes the transmit power of EUUs. is the channel power gain, and is the distance from EUU to the typical UAV in the typical cluster, as shown in Figure 1. Here, is the number of EUUs within a cluster.
2.3.2. Inter-Cluster Interference
EUUs from adjacent clusters will cause interference for typical UAVs, and the interference can be expressed as follows:
where indicates the channel power gain, is the distance between the EUUs, which are served by the adjacent UAV and the typical UAV, .
2.3.3. Other Interference
In this paper, the interference from the CCUs is also considered to be transmitting over the same frequency, as mentioned earlier, and the deployment of CCUs follows an HPPP, , with density . Consequently, the interference from CCUs can be expressed as follows:
where is the channel power gain, and is the corresponding distance.
2.3.4. Interference from EUUs
Moreover, the impact of deploying UAVs to the cellular networks is also considered. Assuming that the uplink channels of CCUs are mutually orthogonal, only the interference caused by EUU is considered. As shown in Figure 1, for the typical CCU, , the SINR received at the MBS, is given as follows:
where refers to the interference from EUUs at the cell edge. is the transmit power from the typical CCU, ∼ exp(1) refers to small-scale fading coefficient, and is the distance from the typical CCU to the MBS.
Next, we will analyze the interference, , that is caused by CCUs, and then we can obtain the analytical expression of .
The interference from EUUs at the edge of the cell to the MBS can be expressed as follows:
where presents the channel power gain, and is the corresponding distance from CCUs to the typical UAV.
2.4. Performance Metric
Coverage Probability: We consider the coverage probability from different perspectives of the UAV and MBS to analyze network performance. The coverage probability marking a typical user successfully transmits information to UAV or MBS, which is the probability that the SINR received at the UAV or the MBS exceeds the threshold, . Therefore, the coverage probability can be derived as follows:
where superscript b in is u for UAV and m for MBS, , and is the threshold. and are defined in (2) and (6), respectively. The coverage probabilities are provided in Section 4.
Area Spectral Efficiency: The definition of area spectrum efficiency is that the network throughput is normalized for the bandwidth and the area. Then, area spectrum efficiency can be expressed as follows:
where superscript b in is u for UAV and m for MBS, , indicates the transmission rates of EUUs or CCUs, and are defined in (29) and (31) in Section 4, respectively.
Energy Efficiency: The ratio of effective transmission rate to the consumption of transmit power is defined as energy efficiency. It expresses the number of transmission bits that can be obtained when the system consumes per unit of energy and represents the system’s utilization efficiency of energy resources. In a determinate network, for users within per unit area, the total consumption of transmit power can be given as , where n indicates the number of EUUs within a cluster, and are the densities of UAVs and CCUs respectively, indicates the transmit power of the cellular users, and and are weighting coefficients. The energy efficiency of the determinate network is given as follows:
where is defined in (9).
3. Interference Analysis
We analyze the intra-cluster interference from EUUs in the same cluster, the inter-cluster interference from EUUs in adjacent clusters, and other interference from CCUs at the cell center in this section. For the MBS in the center cellular, we analyze the interference from EUUs at the cell edge of the UAV service.
3.1. Laplace Transforms for Interference at UAV
We investigate the Laplace transforms of interference from three sources at UAV in this section. In the case of the large-scale network, we consider the channel model as a special circumstance for performance analysis with stochastic geometry tools. For convenience, the calculation of the scattering scenario of in (1) is considered. We will further consider the case of multipath superimposed LoS channels. We assume that channel power gain h is an exponential distribution with a mean value of 1. First, we solve the intra-cluster interference as follows.
3.1.1. Intra-Cluster Interference
Lemma 1.
We assume that the number of EUUs within a cluster is same, and the Laplace transform of interference from EUUs in the same cluster can be expressed as follows.
Proof.
Lemma 2.
The probability density function (PDF) of the distance, , which is between an EUU and the UAV in the same cluster, is as follows.
Proof.
The distance from EUU to the UAV in the same cluster is , its ground projection distance is , and . The distribution of the distance is . Therefore, the PDF of can be obtained by the following.
Then, the complete proof of Lemma 2 is achieved. □
3.1.2. Inter-Cluster Interference
Next, the Laplace transform of the interference caused by EUUs in adjacent clusters to the typical UAV is analyzed.
Lemma 3.
The Laplace transform of the interference from EUUs from adjacent clusters can be then approximated as follows:
where the following is the case.
Proof.
For inter-cluster interference at UAV, each cluster has n EUUs. Based on (4), the Laplace transform is given by the following:
where is achieved by and obeys exponential distribution with unit mean, and is achieved by the generating a function of PPP. By using the Jensen inequality , the Lapalace transform can be approximated as follows:
where is achieved by changing coordinates. Then, the proof of Lemma 3 is accomplished. □
The PDF of the distance between the EUUs, which are in the adjacent cluster at the edge of the cell and the typical UAV , and the angle between the projection of and d on the ground, , are indicated in Lemmas 4 and 5, respectively.
Lemma 4.
The PDF of distance from EUUs to the connected UAV inside is the following:
where .
Proof.
It is necessary to obtain the distribution of the distance, , which is from the typical UAV to the EUU in the adjacent cluster. On the basis of the approach of formula [35,36], the distance distribution of can be derived as follows:
where .
Lemma 5.
Conditioned on , the PDF of the angle ω, is expressed as follows.
Proof.
By using the cosine rule, this lemma can be simply proved. □
3.1.3. Other Interference
Lemma 6.
The Laplace transform of other interference from CCUs is approximated as follows.
Proof.
The Laplace transform of other interference sat UAV, which comes from CCUs, is expressed as follows:
where is achieved by concerning the generating function of PPP. Then, the final result in Lemma 6 can be achieved. □
3.2. Lapalace Transforms for Interferences at MBS
In this part, the Laplace transform of the interference from EUUs at the MBS is derived.
Interference from Edge Users
Lemma 7.
The Laplace transform of interference caused by EUUs at the MBS can be given as follows.
Proof.
Based on (6) and (7), at the MBS, the Laplace transform of interference from EUUs is expressed as follows:
where is achieved by , which follows an exponential distribution with unit mean, and is achieved by applying the generating function of HPPP. By using Jensen inequality , the Lapalace transform of interference from EUUs in cell edge can be approximately expressed as follows:
where is achieved by transforming to polar coordinates. Then, the proof of Lemma 7 can be completed. □
Lemma 8.
The PDF of distance , which is between CCUs in and the MBS in the center of region , can be given by the following:
where is radius of the disk .
Proof.
Using a similar approach in the proof of Lemma 13, the distance distribution of can be derived. □
4. Performance Analysis
4.1. Coverage Probability Analysis
In this section, the coverage probability of the typical UAV and the MBS according to (8) is derived in Section 2.4.
By plugging (2) and (13) into (8), the coverage probability of the typical UAV can be given as follows.
According to (8), we can obtain the following:
where , , , and are the Laplace transforms of the power density distributions of , , and , respectively.
Result 1.
If EUUs follow PCPs and cluster around each UAV with a fixed number, the coverage probability of the typical UAV is approximated as follows:
where .
Similarly, we can obtain the transmission coverage probability of the MBS:
where , is the Laplace transform of the inteference from EUUs at the cell edge.
Result 2.
4.2. Area Spectral Efficiency
Result 3.
Result 4.
The area spectrum efficiency of MBS is given by the following:
where is the transmit rates of CCUs at the cell center, and is defined in (32).
Remark 1.
According to (33), we can derive that area spectrum efficiency decreases as cluster radius increases. Therefore, deploying EUUs densely around UAVs can increase area spectrum efficiency.
4.3. Energy Efficiency
As mentioned in Section 2, the power consumption for all users within per unit coverage area is indicated by for a given network, where is the transmit power of users, and and are weighting coefficients, where , .
Result 5.
Remark 2.
Energy efficiency also decreases as cluster radius a increases. Accordingly, deploying EUUs around each UAV densely can be an effective method to enhance energy efficiency.
5. Numerical Results
This section gives out the analytical results analyzed above and the simulation. In the simulation, the results are simulated by the Monte Carlo. We deploy UAVs as HPPP with density over an annulus region, for which the inner diameter is and the outer diameter is , and cellular users at the cell center are deployed as HPPP with density . In addition, EUUs form PCPs and the number of EUUs n in each cluster is fixed. In the simulation, the default system parameters of the UAV-assisted cellular network are listed in Table 1.

Table 1.
Defalut System Parameters Settings.
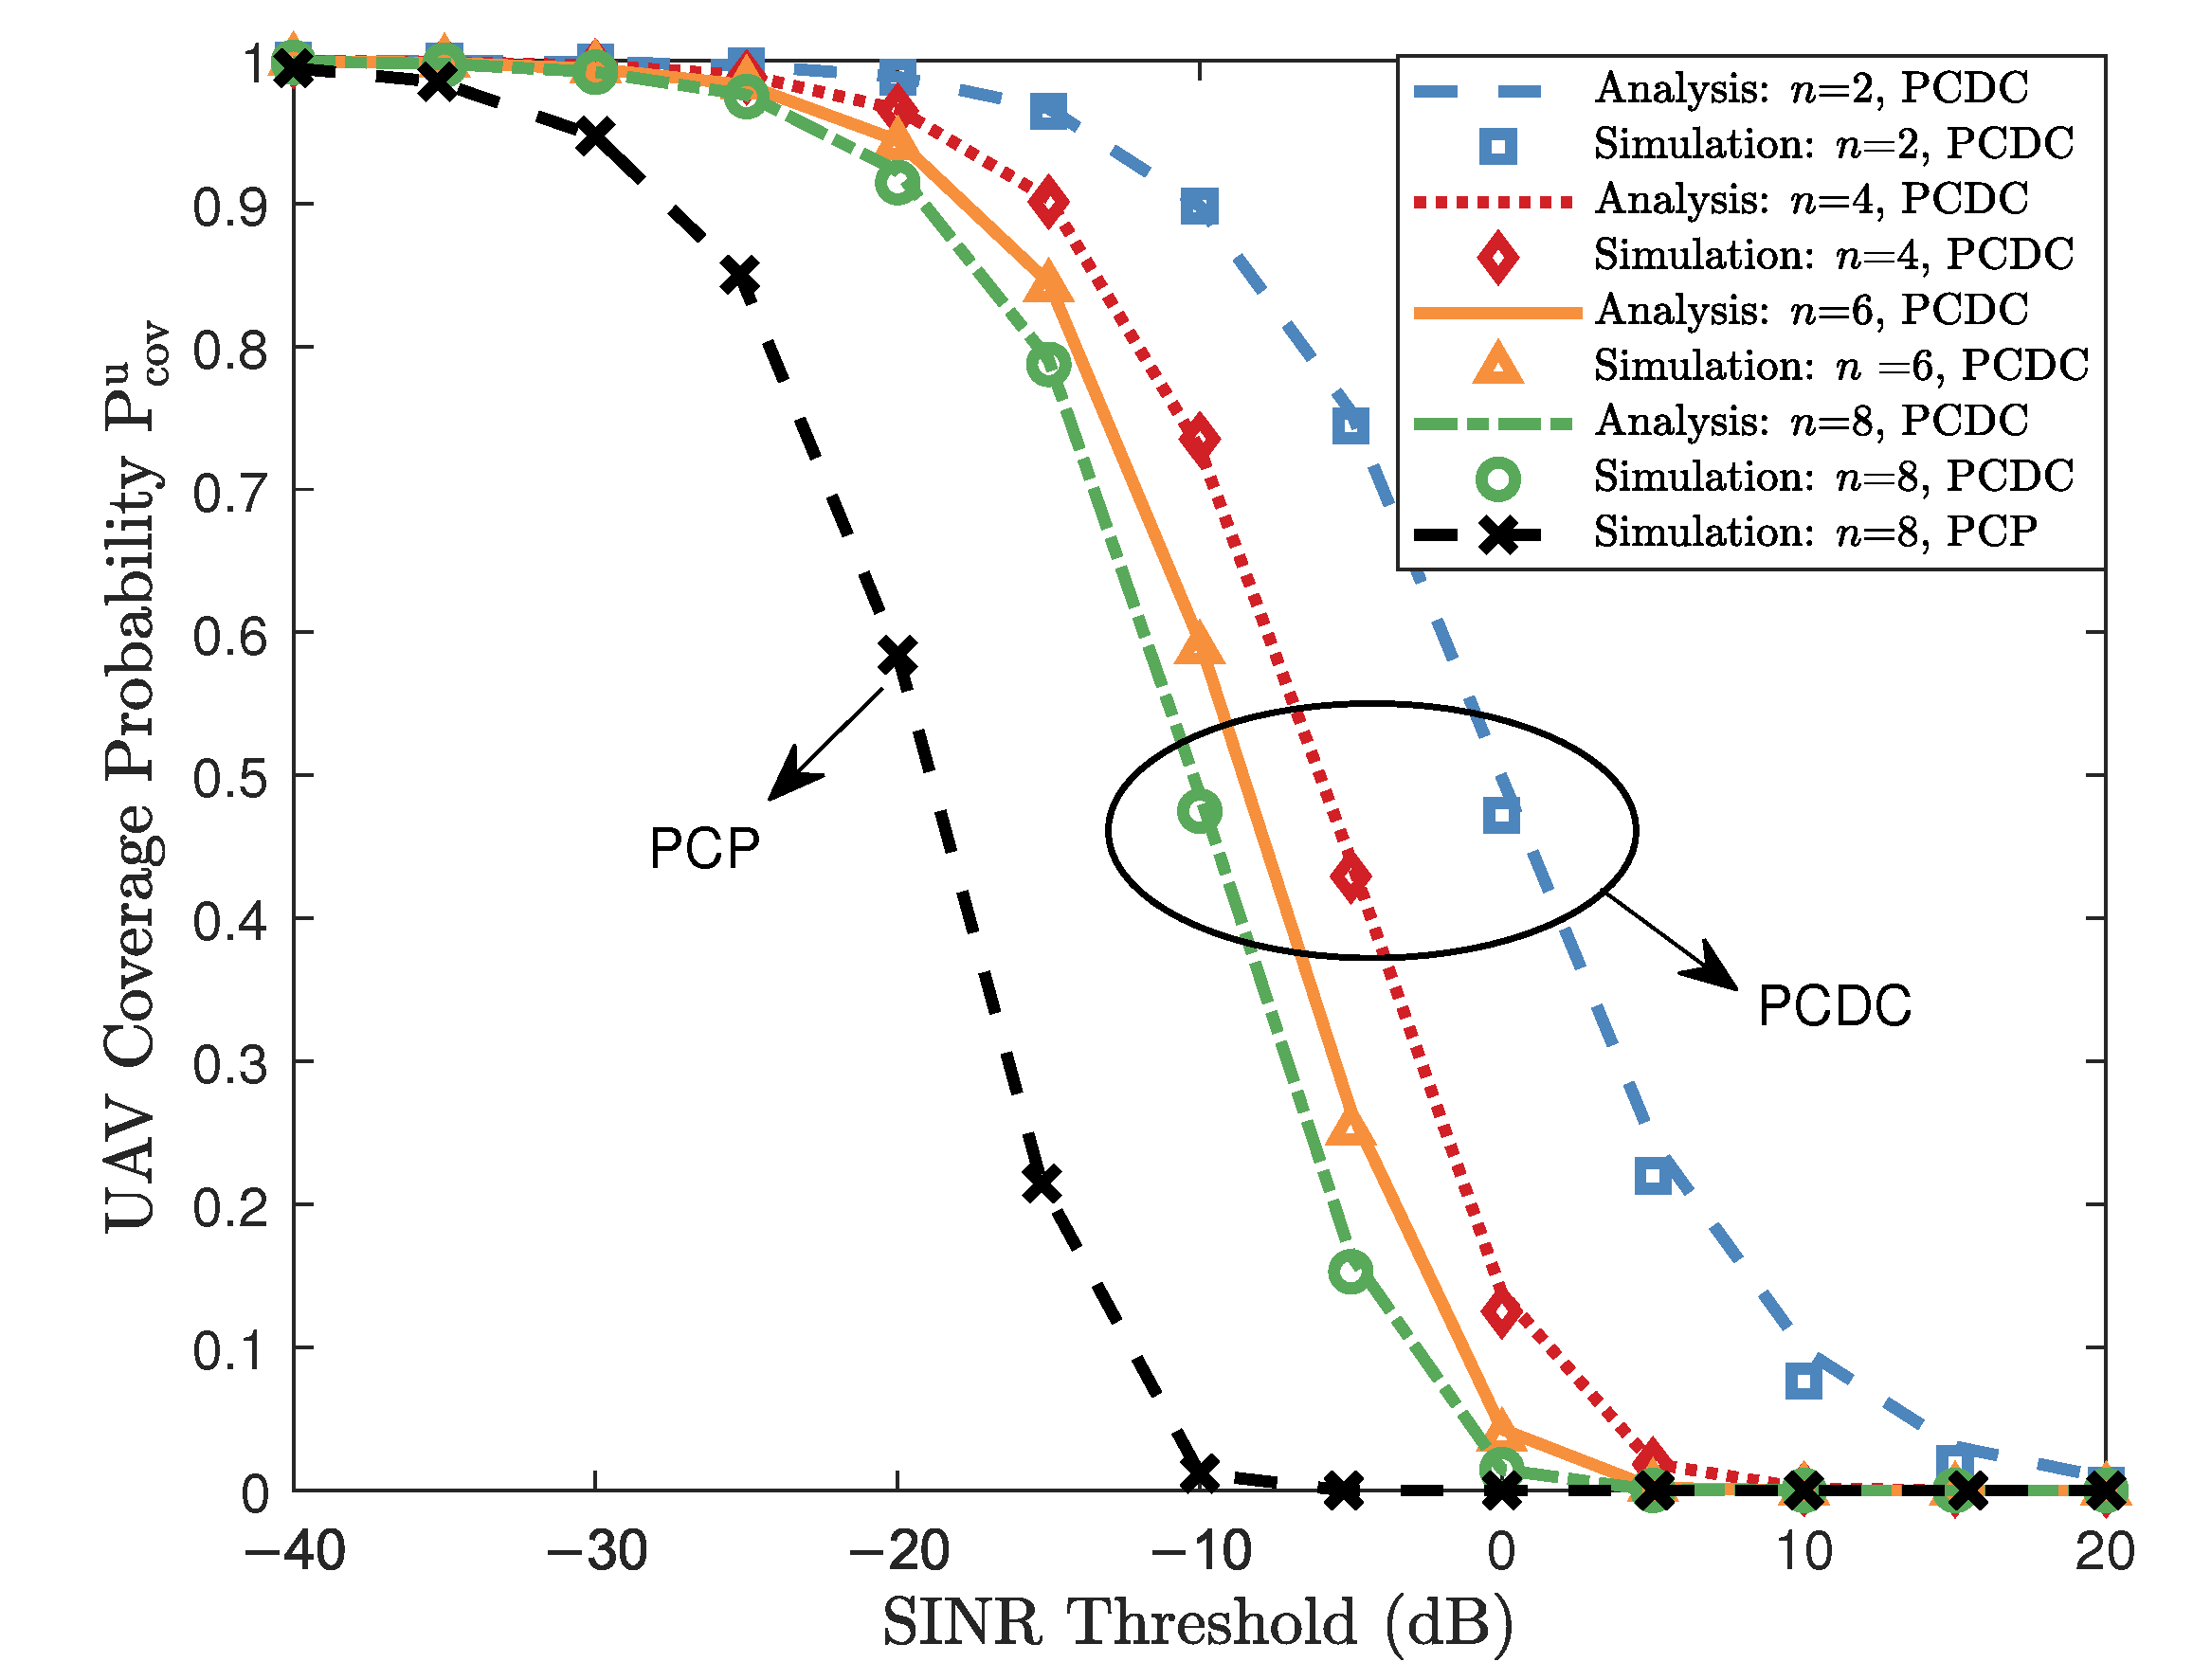
Figure 2 plots the coverage probability of the UAV-edge cellular with different SINR thresholds and different numbers of EUUs, n, in each cluster. The observations are as follows. First, the simulation curves are consistent with our analytical results for the different values of EUUs numbers and SINR thresholds. Second, when the number of EUUs within a cluster is , the coverage probability under PCDC outperforms that under PCP as much as 267%, at SINR threshold equals dB. Finally, the coverage probability of the UAV decreases as the number of EUUs in each cluster increases because, with the invariable radius of the cluster, intra-cluster and inter-cluster interferences increase as the number of EUUs in each cluster increases.
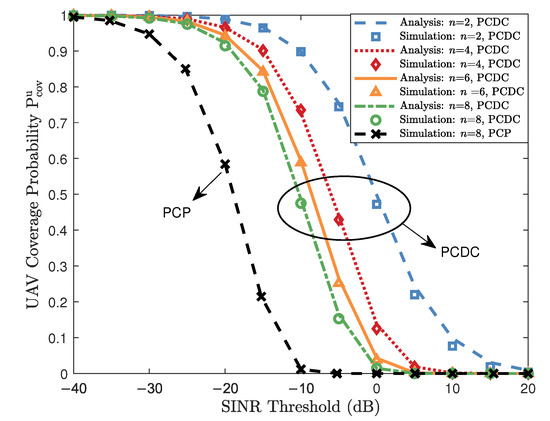
Figure 2.
Coverage probability of UAV versus the SINR threshold with different numbers of EUUs n within a cluster; the cluster radius a = 50 m; the transmit power of EUUs is 10 dBm.
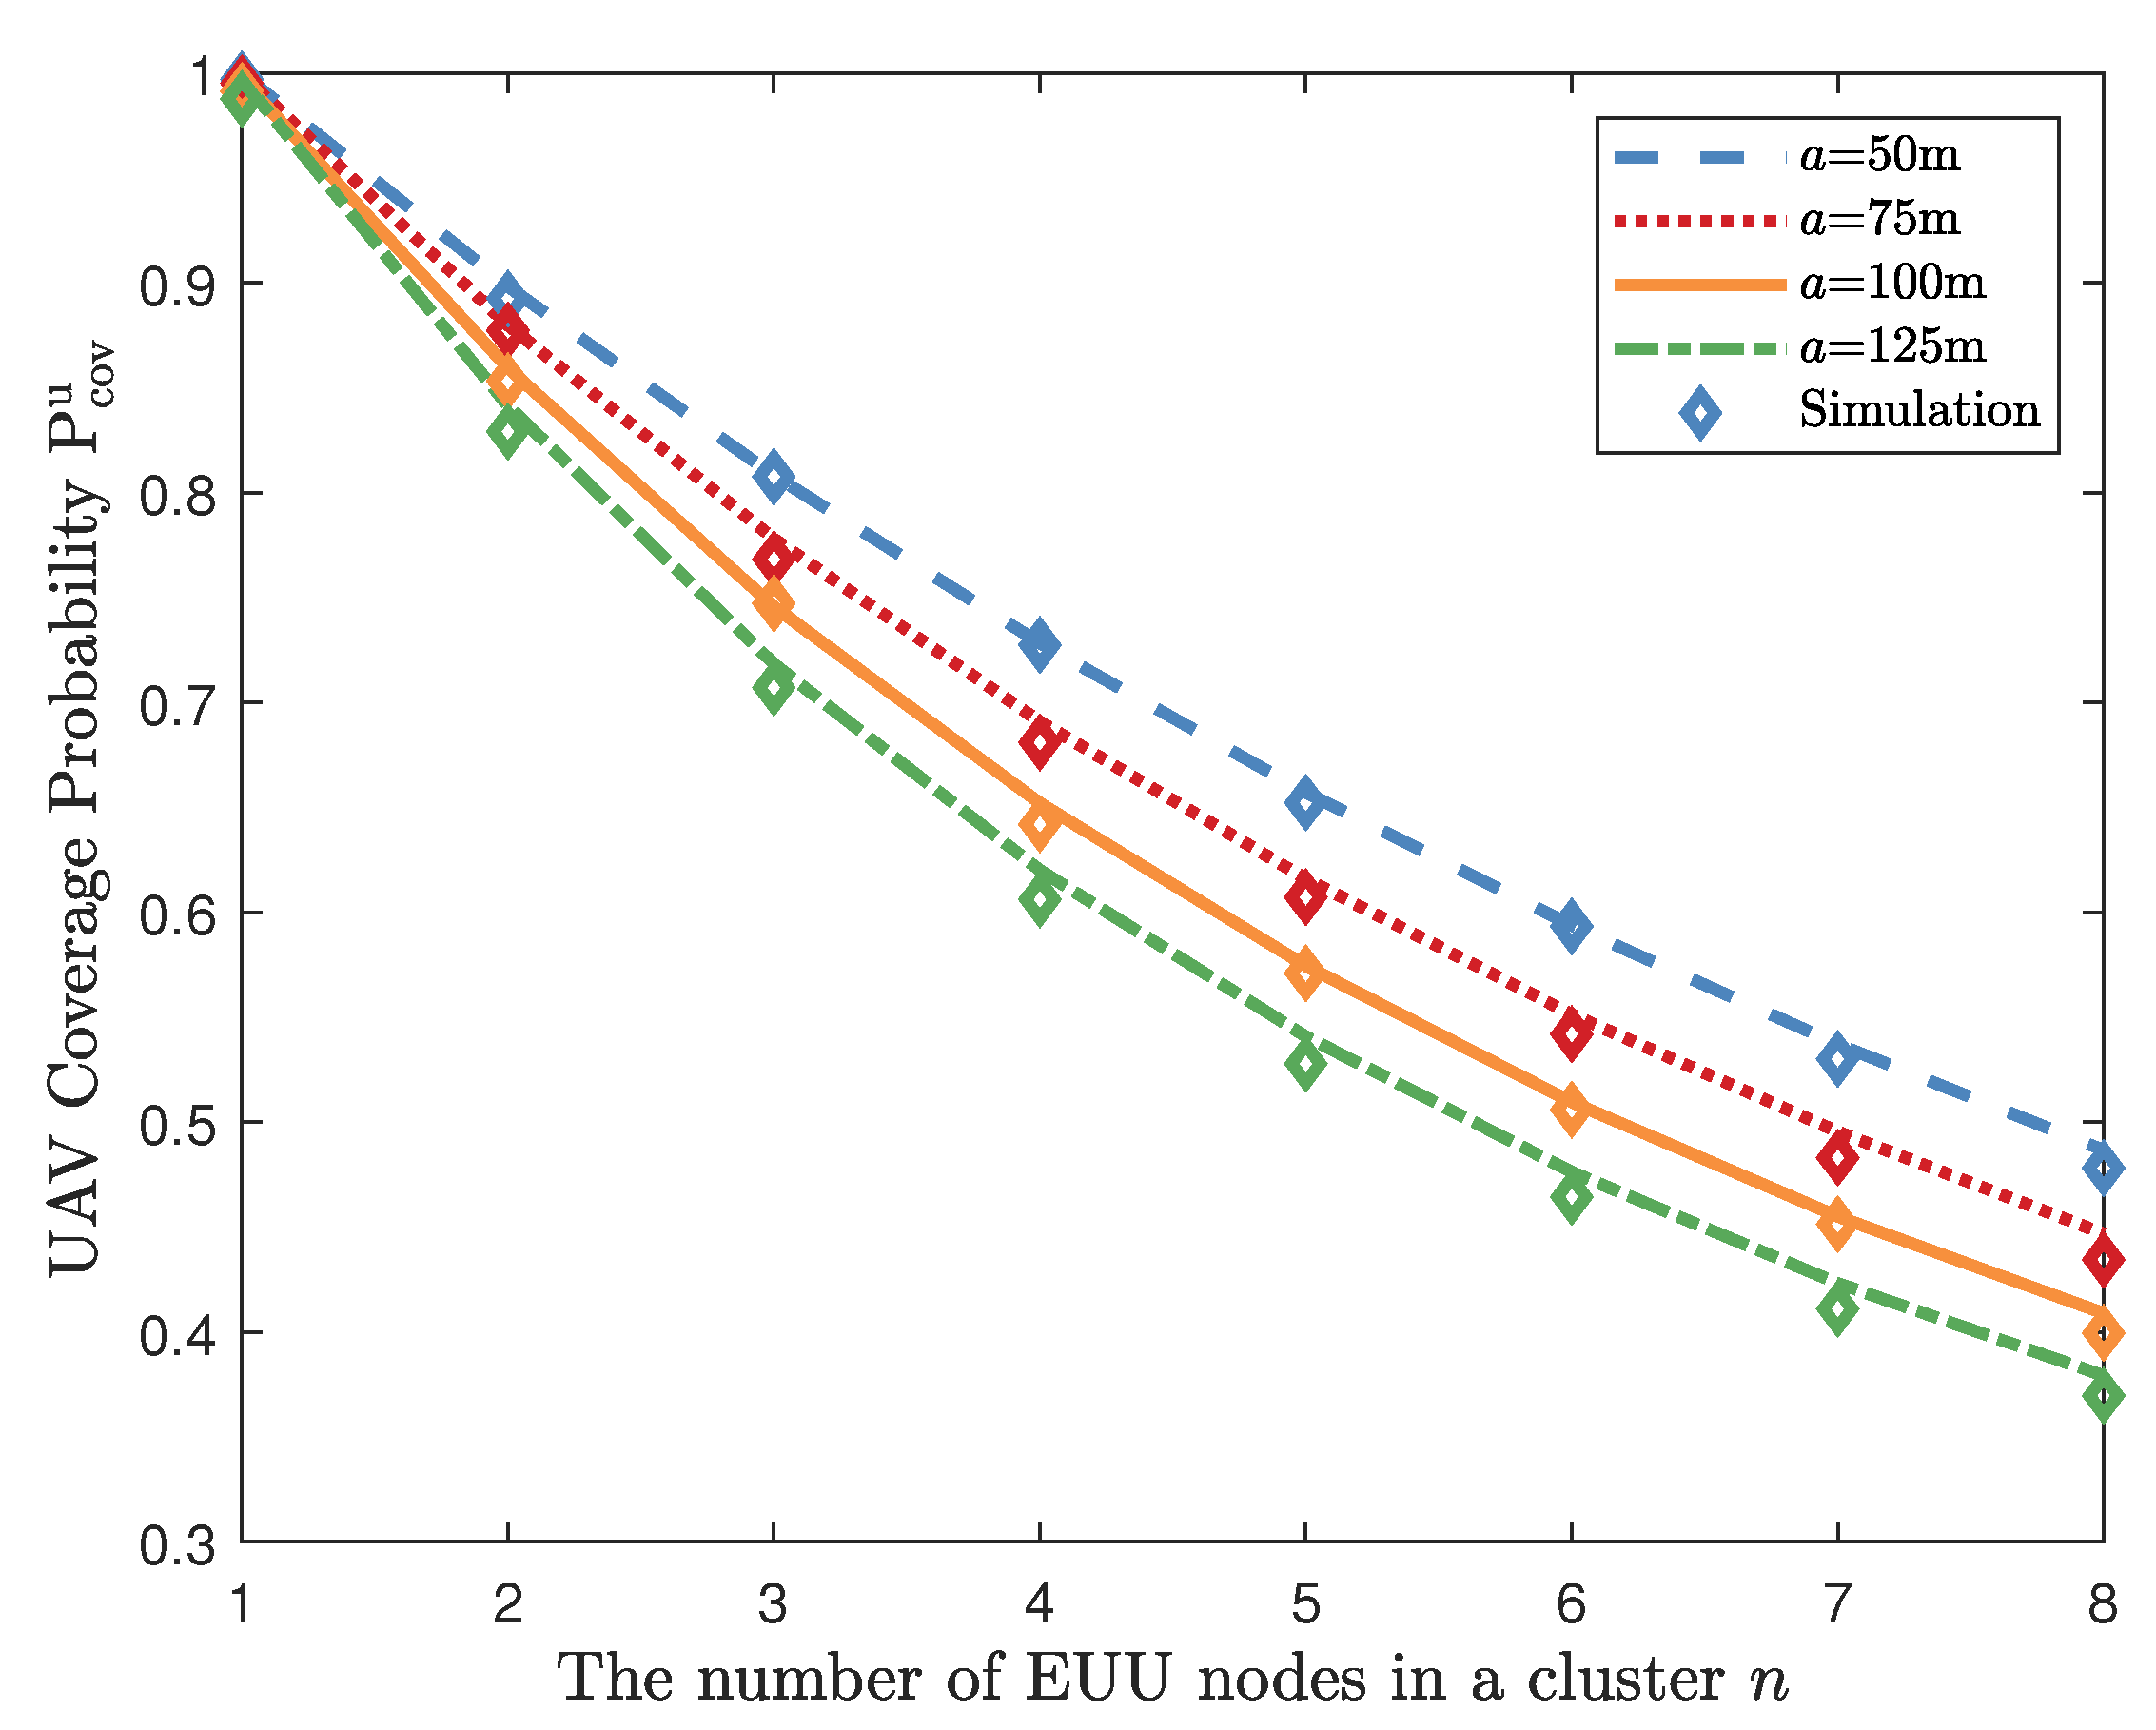
The coverage probability of the UAV with the different numbers of EUUs in each cluster n and different radius of cluster a is shown in Figure 3. The observations are as follows. First, the simulation results fulfilled the theoretical results. It is necessary to note that there is no association between cluster radius a and the number of EUUs n within the cluster. Second, when the radius of cluster a increases, the coverage probability of the UAV decreases. When the radius of the cluster increases, the distance between the EUU in the typical cluster and the EUU in the adjacent cluster decreases. Therefore, inter-cluster interference takes over a dominant part of the network. Consequently, coverage probability decreases when the number of EUUs within a cluster and the radius of the cluster increase.
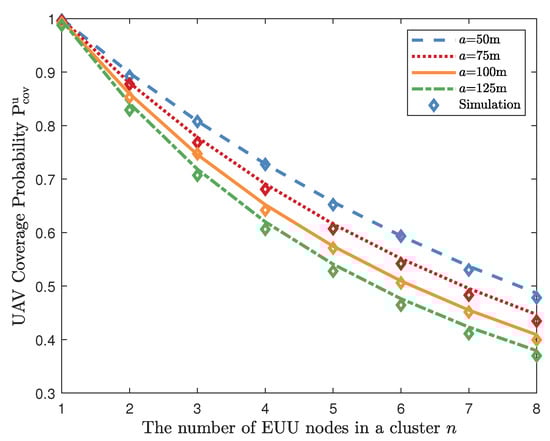
Figure 3.
The coverage probability of the UAV versus the number of EUUs within a cluster n with different radius of cluster a, the transmit power of EUUs is 10 dBm.
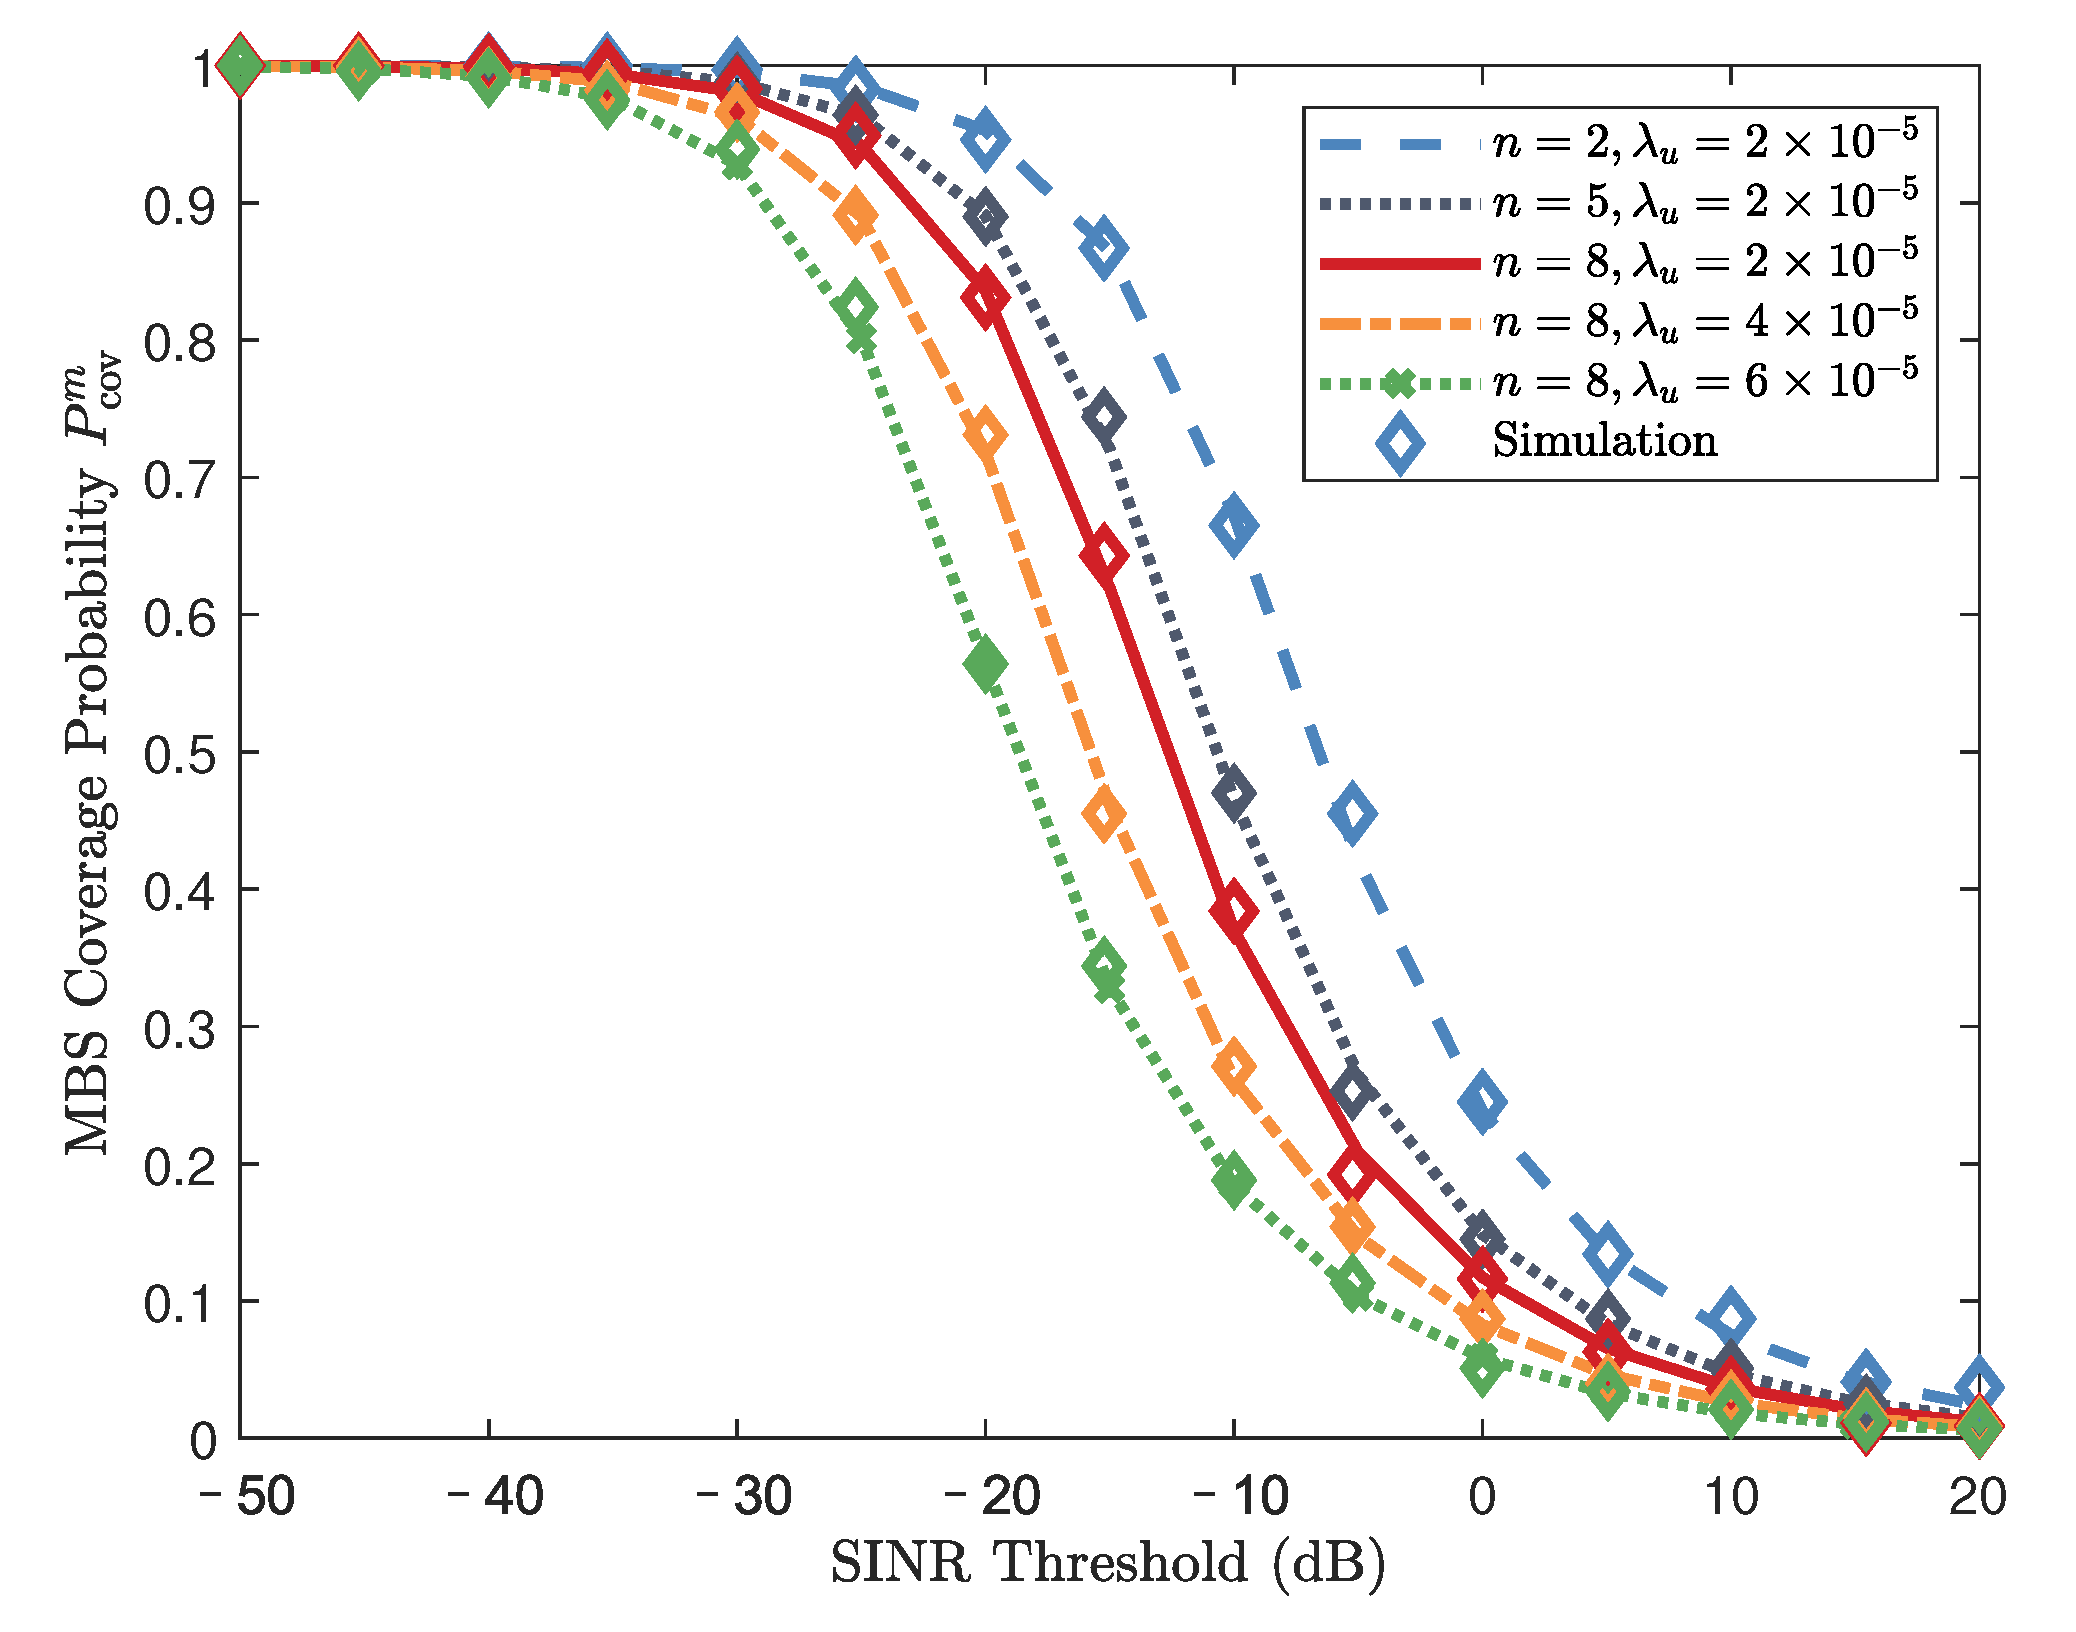
In Figure 4, by adjusting different SINR thresholds , the density of UAVs, and the number of EUUs within a cluster, n, the result of the coverage probability of the MBS-center cellular is given. First, the simulation curves are consistent with our analytical results. Second, the results show that when the number of EUUs in each cluster increases, the coverage probability of MBS decreases. This is because, with the invariable radius of the cluster, the interference caused by EUUs increases with the number of them within each cluster. In addition, the number of EUUs increases with the density of UAVs, which results in a decrease in coverage probability.
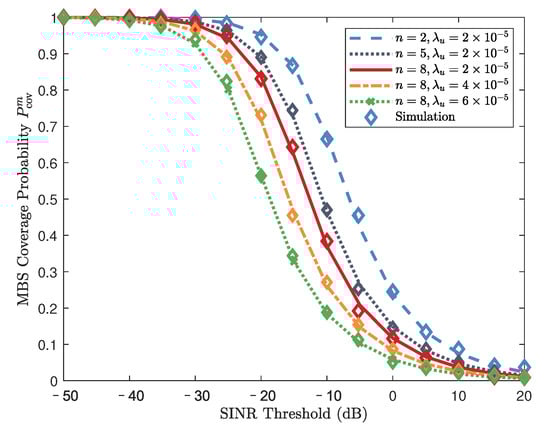
Figure 4.
The coverage probability of the MBS with differenet SINR threshold and different numbers of EUUs n within each cluster; the cluster radius a = 50 m; the transmit power of EUUs is 10 dBm.
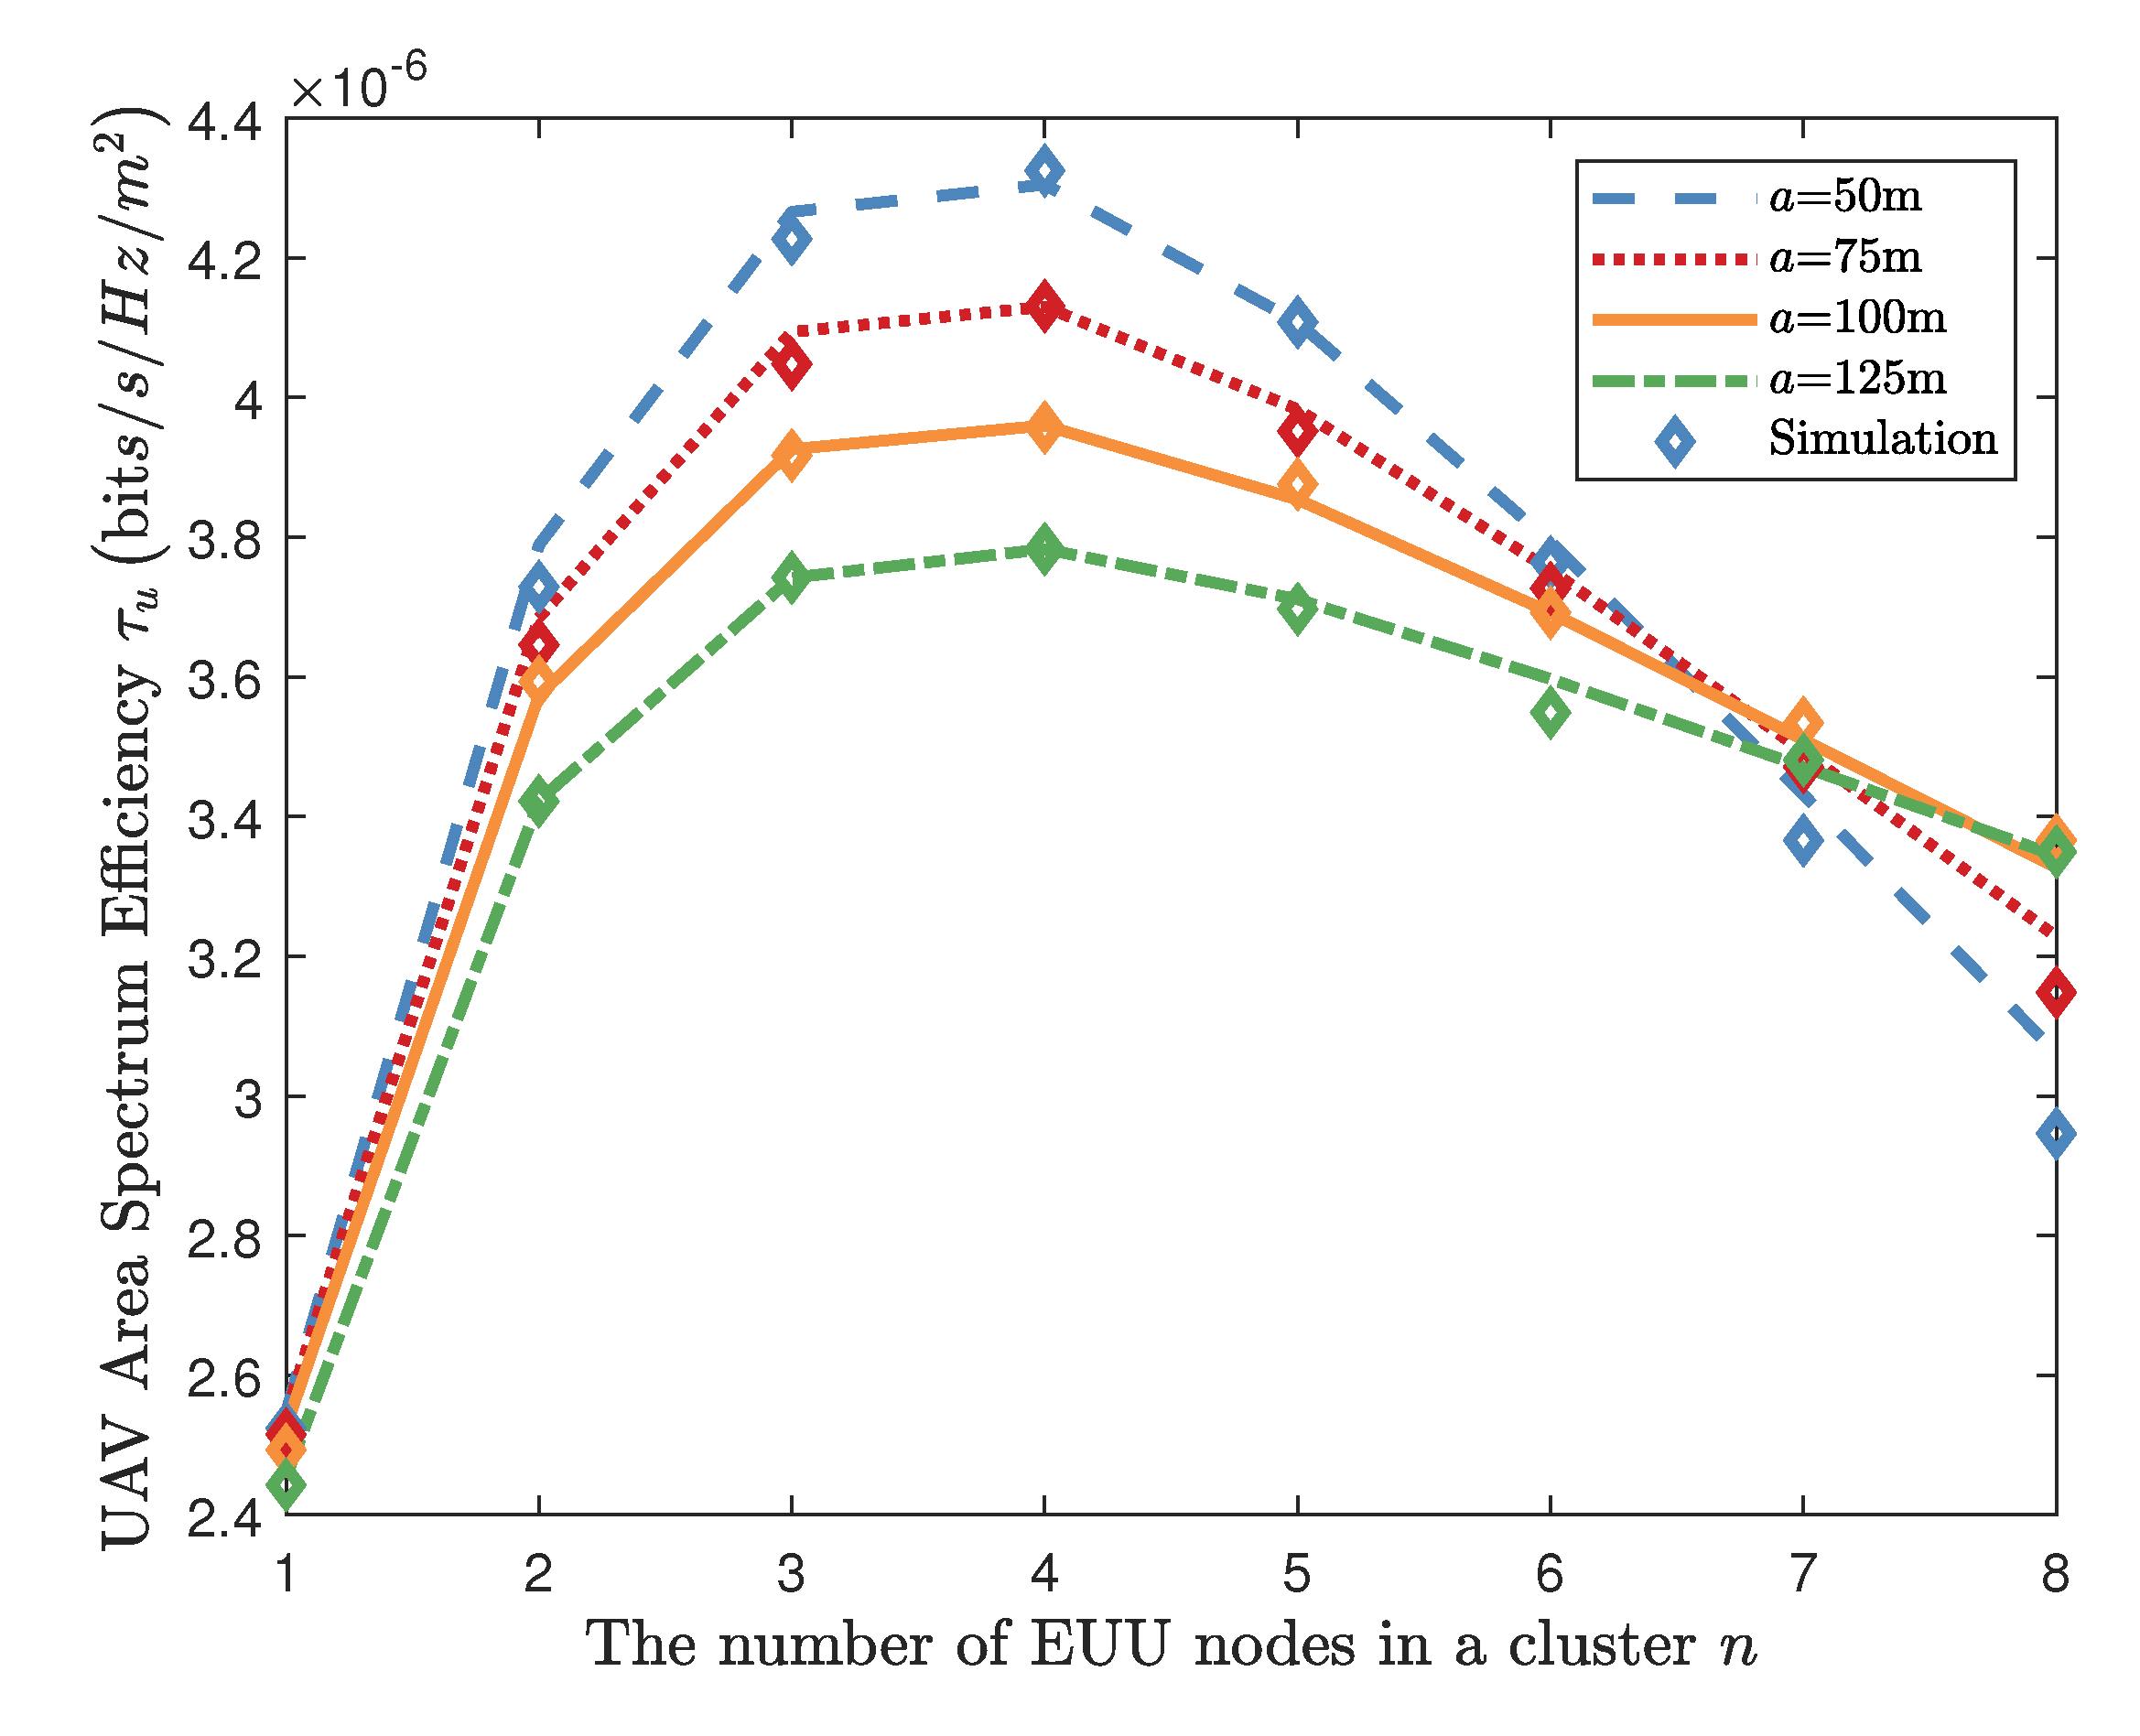
In Figure 5, the relation between the area spectrum efficiency of the UAV and different numbers of EUUs in each cluster n and different radius of cluster a are shown. The figure shows that the area spectrum efficiency of the UAV can be maximized by selecting an appropriate number of EUUs. The reason for this phenomenon can be given as follows: on one side, more transmitting links between EUUs and UAVs bring larger inter-cluster interference, and the coverage probability of the UAV decreases, which will decrease area spectrum efficiency. On the other side, larger n means that the spectrum will be more efficient per unit area, which intensifies the area spectrum efficiency of the UAV. Furthermore, we can also observe that there is an intersection in the figure when . This behavior can be explained that when the number of EUUs exceeds a specific value, the influence of interference from EUUs is larger and more dominant; therefore, area spectrum efficiency decreases faster.
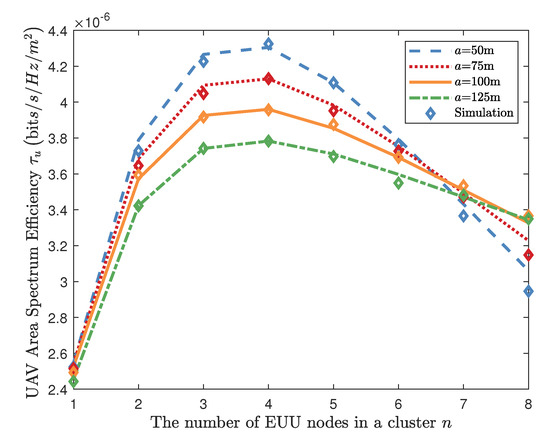
Figure 5.
The area spectrum efficiency of the UAV, , versus the number of EUUs within a cluster n with different cluster radius a; SINR threshold is = −5 dB; the transmit power of EUUs is 10 dBm.
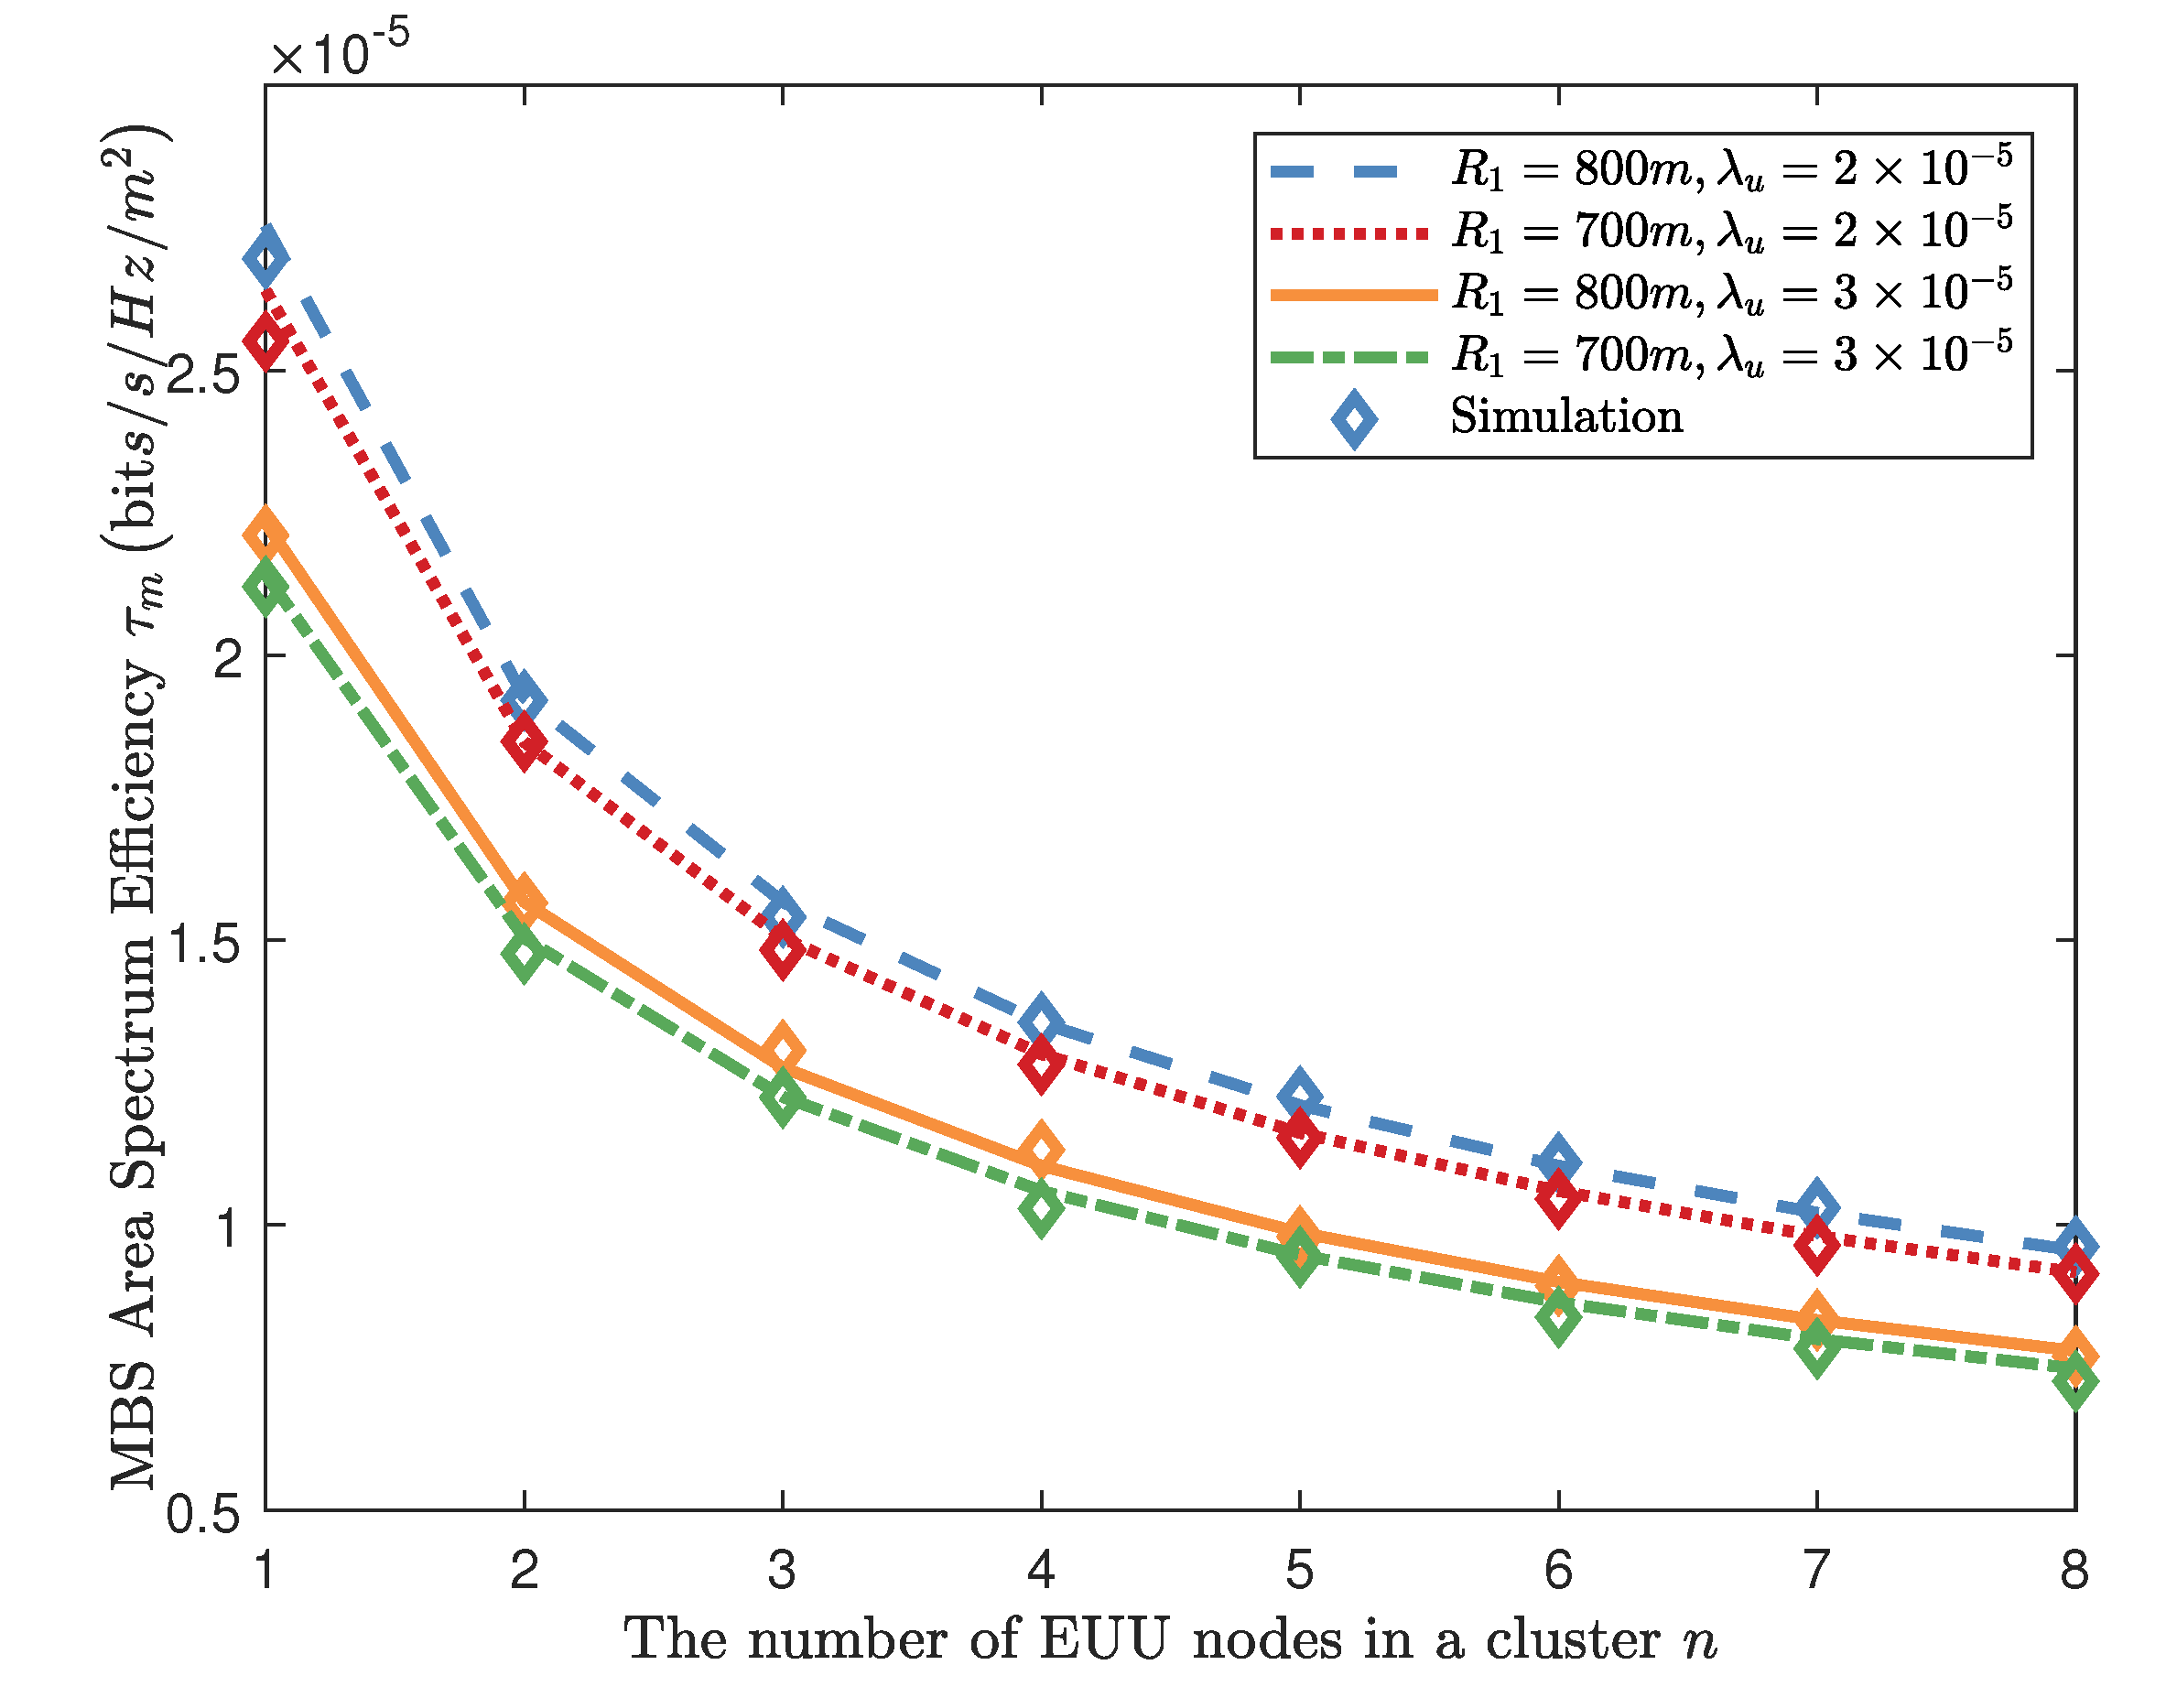
In Figure 6, we consider the area spectrum efficiency of the MBS with different densities of UAVs at the cell edge and different radius of the center coverage area, . From the figure, the observations are as follows. First, the area spectrum efficiency decreases when the number of EUUs within a cluster n increases. Second, when the density of users increases, the area spectrum efficiency of the MBS decreases. Third, the area spectrum efficiency increases with a decrease in the radius of MBS coverage area, . These observations can be explained by the fact that more EUUs and UAVs bring larger interference to the MBS, which results in a drop in the coverage probability, which will decrease the area spectrum efficiency. Moreover, a larger radius of the MBS coverage area leads to the spectrum being efficiently used per unit area. Consequently, area spectrum efficiency is enhanced.
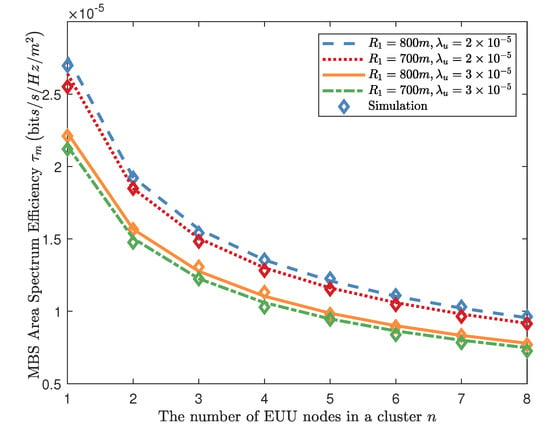
Figure 6.
The relation between area spectrum efficiency of the MBS, , and the number of EUUs within a cluster, n, with different cluster radius a; SINR threshold is = 5 dB; the transmit power of EUUs is 10 dBm.
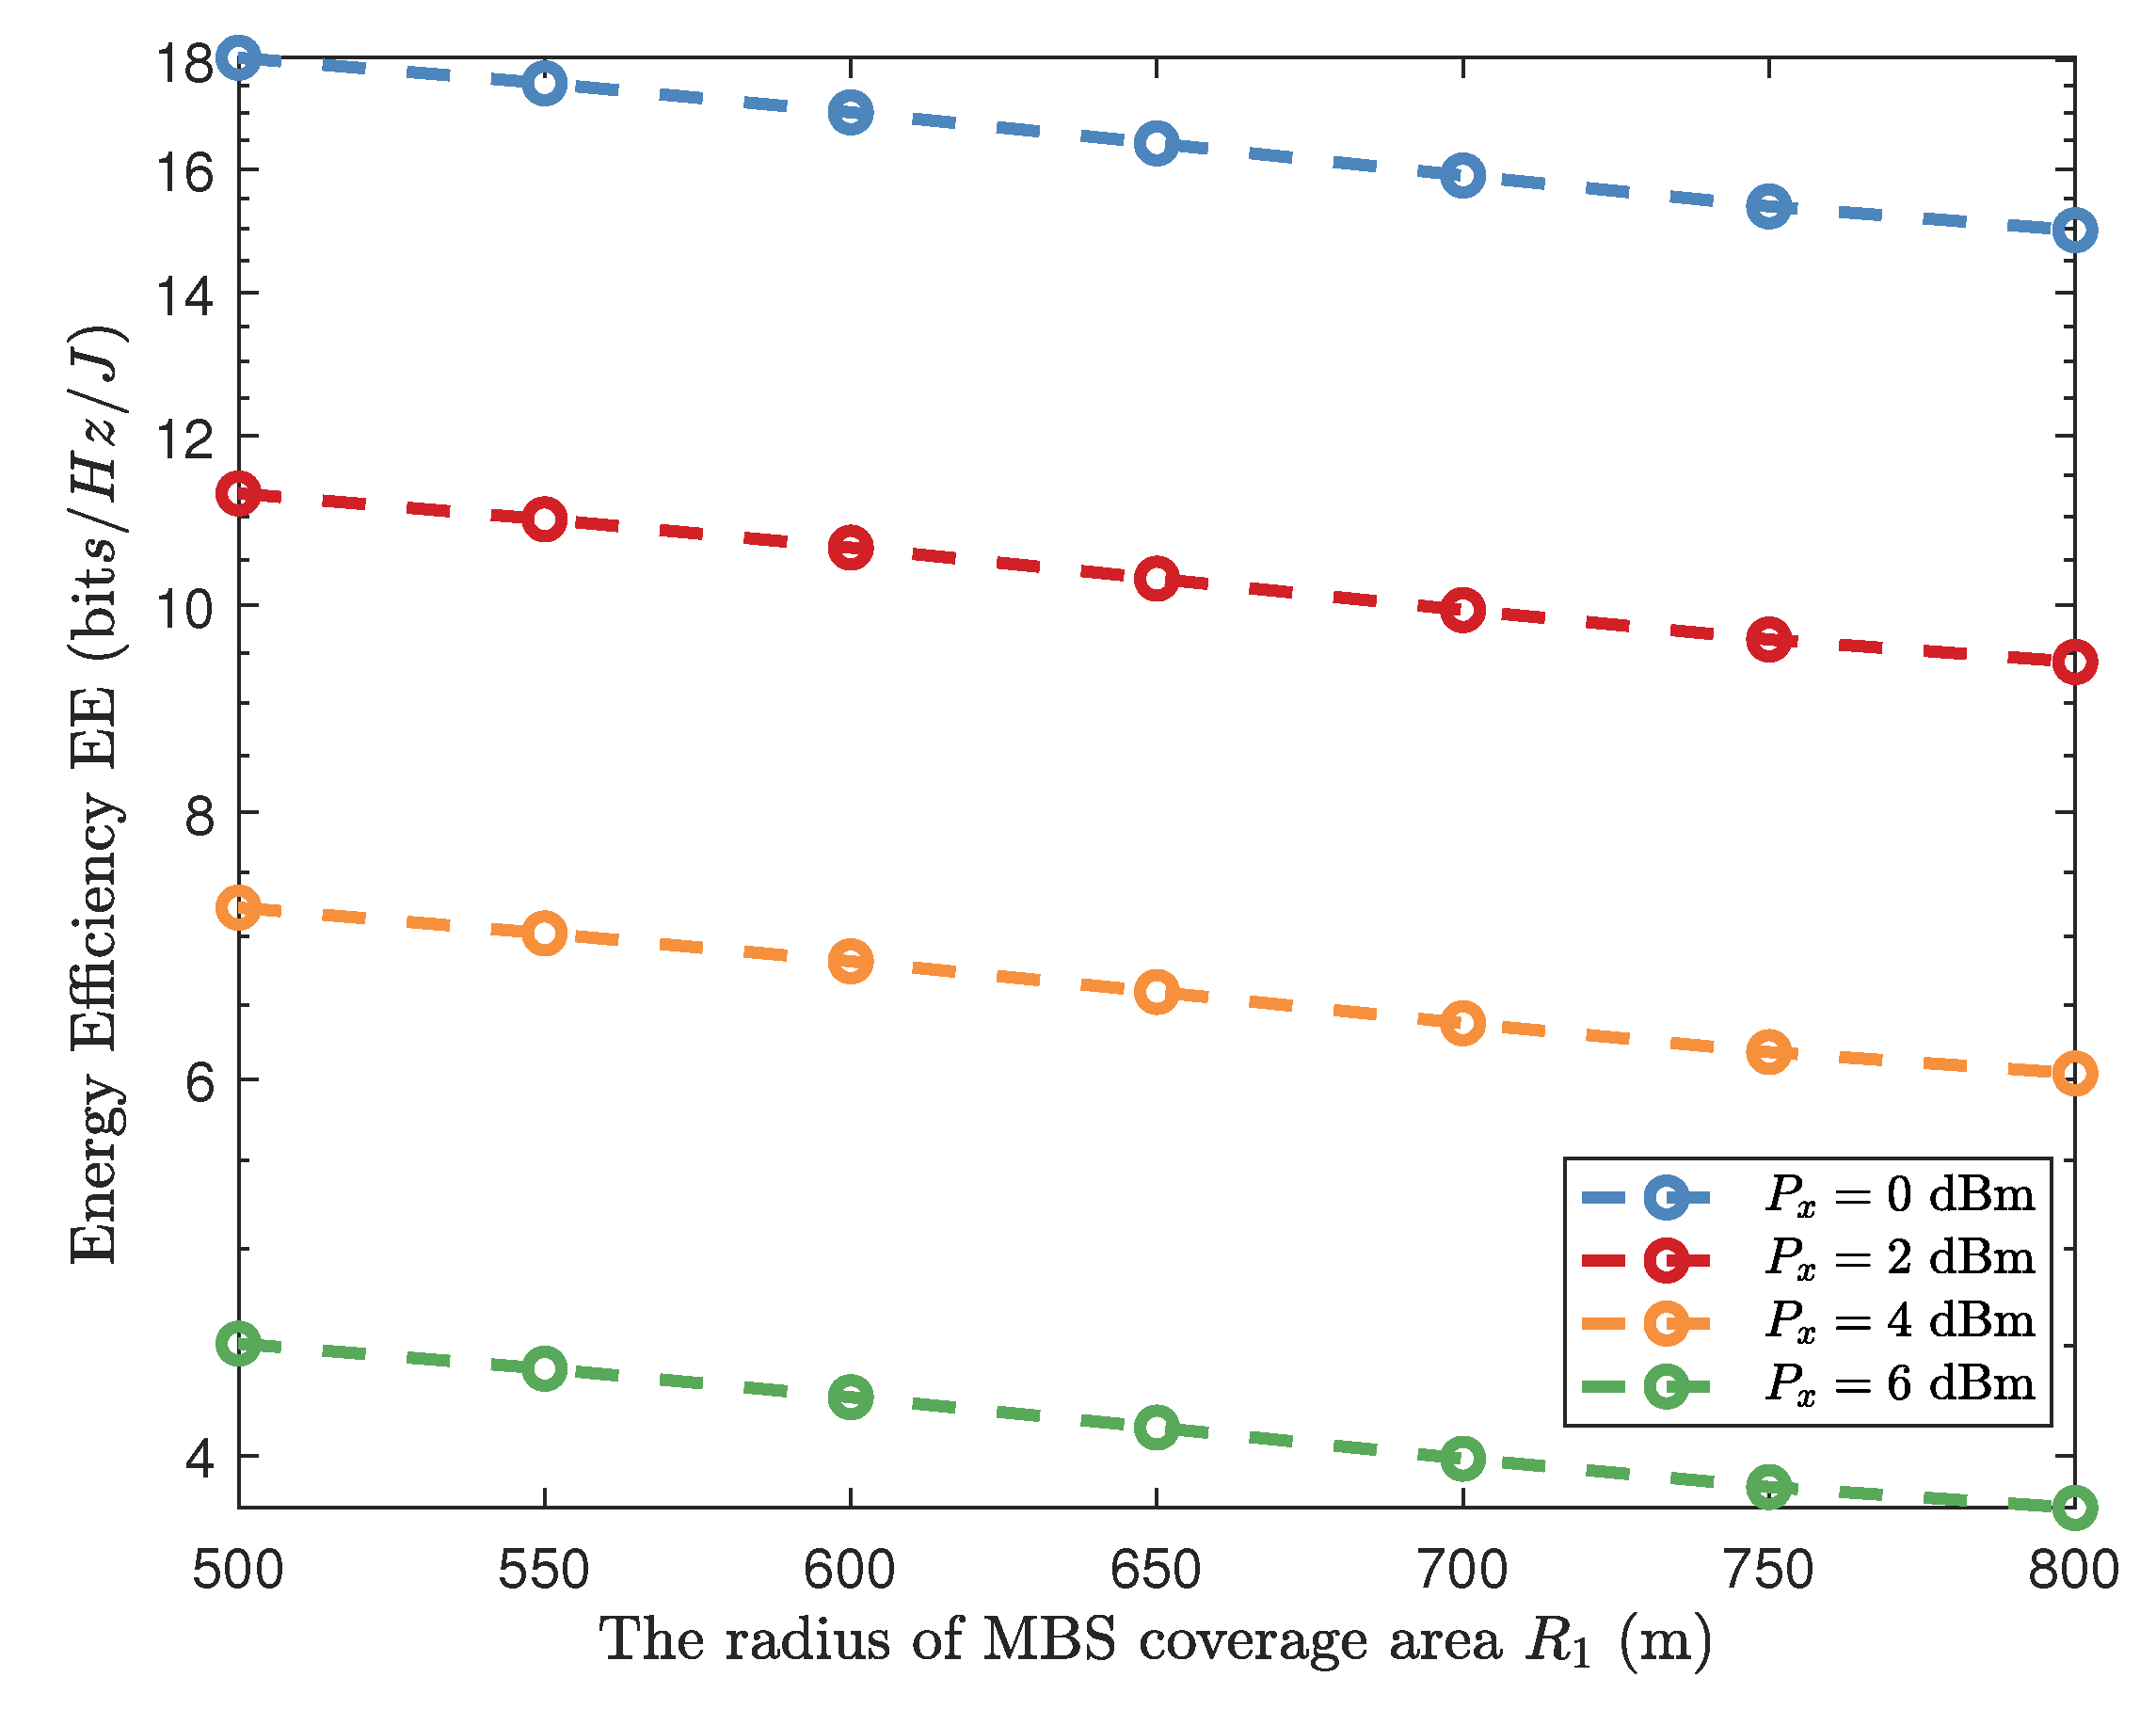
In Figure 7, the relations among the total energy efficiency of the network, the radius of the MBS coverage area , and users transmit power are shown. The figure shows that system energy efficiency is a monotonic decrement function of the radius of the MBS coverage area and the transmit power of users. This is mainly because when the radius of the MBS coverage increases, the coverage probability of the network decreases, which results in a drop in energy efficiency. Furthermore, when the transmit power of users increases, energy efficiency decreases. The interpretation of this behavior is that the large transmit power of users results in larger interference among users, UAVs, and the MBS; thus, the coverage probability of the network decreases, which in turn decreases energy efficiency. According to (35), the radius of MBS coverage area m means that the users in cell edge and cell center are all served by MBS. When the radius of the MBS coverage area is m, energy efficiency is increased 19% by deployed UAVs in cell edge.
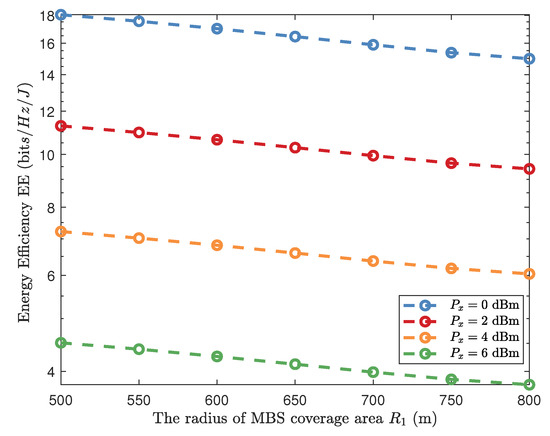
Figure 7.
Energy efficiency of the network versus the radius of MBS coverage area with different transmit power of users . The SINR threshold is −15 dB.
6. Conclusions
In this paper, the uplink communication in the UAV-assisted cellular network with MBS, UAVs, and cellular users has been studied. To ensure efficient coverage, UAVs were deployed at the cell edge to provide coverage for EUUs. The interference among EUUs, CCUs, and UAVs is considered. A PCDC strategy was proposed to avoid overlapping coverage. By applying stochastic geometry tools, the coverage probability and the area spectrum efficiency of UAVs and the MBS and the total energy efficiency of the network were analyzed. Theoretical analysis and simulation results have verified that network performance under the proposed PCDC strategy is better than that under PCP, and coverage probability is increased by 267%. Furthermore, the impact of the number of UAVs in each cluster and the radius of the cluster on network performance is analyzed, and an optimal number of EUUs in each cluster is found to maximize area spectrum efficiency. Moreover, by deploying UAVs, the energy efficiency of the system has been increased as much as 19%. The proposed scheme is more sensible in a realistic scenario and can provide useful insights and guidelines for Beyond 5G (B5G) UAV networking.
Author Contributions
Conceptualization, Y.Y. and Z.Z.; methodology, Y.W., X.Q. and X.Y.; validation, Y.W.; writing—original draft preparation, Y.W.; writing—review and editing, Y.Y. and Y.W. All authors have read and agreed to the published version of the manuscript.
Funding
This research was funded by Beijing Natural Science Foundation-Haidian Original Innovation Joint Fund under Grant L192022, Science and Technology Project of Beijing Municipal Education Commission under Grant KM202011232002, The National Natural Science Foundation of China under Grant 61801434, China Post-doctoral Science Foundation Project under Grant 2020M682345, HeNan Post-doctoral Foundation Project under Grant 202001015, and The National Key Research and Development Program of China under Grant 2019QY0302 and 2019YFB1803200, Key Laboratory of Universal Wireless Communications (BUPT), Ministry of Education KFKT-2020105.
Data Availability Statement
Not applicable.
Conflicts of Interest
The authors declare no conflict of interest.
References
- Bithas, P.S.; Nikolaidis, V.; Kanatas, A.G.; Karagiannidis, G.K. UAV-to-Ground Communications: Channel Modeling and UAV Selection. IEEE Wirel. Commun. 2020, 68, 5135–5144. [Google Scholar] [CrossRef]
- Akyildiz, I.F.; Kak, A.; Nie, S. 6G and Beyond: The Future of Wireless Communications Systems. IEEE Access 2020, 8, 133995–134030. [Google Scholar] [CrossRef]
- Andrews, J.G.; Buzzi, S.; Choi, W.; Hanly, S.V.; Lozano, A.; Soong, A.C.; Zhang, J.C. What Will 5G Be? IEEE J. Sel. Areas Commun. 2014, 32, 1065–1082. [Google Scholar] [CrossRef]
- Cui, Z.; Briso-Rodríguez, C.; Guan, K.; Güvenç, İ.; Zhong, Z. Wideband Air-to-Ground Channel Characterization for Multiple Propagation Environments. IEEE Antennas Wirel. Propag. Lett. 2020, 19, 1634–1638. [Google Scholar] [CrossRef]
- Zhao, N.; Lu, W.; Sheng, M.; Chen, Y.; Tang, J. UAV-Assisted Emergency Networks in Disasters. IEEE Wirel. Commun. 2019, 26, 45–51. [Google Scholar] [CrossRef] [Green Version]
- Gupta, L.; Jain, R.; Vaszkun, G. Survey of Important Issues in UAV Communication Networks. IEEE Commun. Surv. Tutor. 2016, 18, 1123–1152. [Google Scholar] [CrossRef] [Green Version]
- Zhou, X.; Durrani, S.; Guo, J.; Yanikomeroglu, H. Underlay Drone Cell for Temporary Events: Impact of Drone Height and Aerial Channel Environments. IEEE Internet Things J. 2019, 6, 1704–1718. [Google Scholar] [CrossRef] [Green Version]
- Kuru, K.; Ansell, D.; Khan, W.; Yetgin, H. Analysis and Optimization of Unmanned Aerial Vehicle Swarms in Logistics: An Intelligent Delivery Platform. IEEE Access 2019, 7, 15804–15831. [Google Scholar] [CrossRef]
- Lee, S.; Har, D.; Kum, D. Drone-Assisted Disaster Management: Finding Victims via Infrared Camera and Lidar Sensor Fusion. In Proceedings of the 2016 3rd Asia-Pacific World Congress on Computer Science and Engineering (APWC on CSE), Nadi, Fiji, 5–6 December 2016. [Google Scholar]
- Cui, Z.; Guan, K.; Zhang, J.; Zhong, Z. SNR Coverage Probability Analysis of RIS-Aided Communication Systems. IEEE Trans. Veh. Technol. 2021, 70, 3914–3919. [Google Scholar] [CrossRef]
- Cheng, J.; Guan, K.; Quitin, F. Direction-of-Arrival Estimation With Virtual Antenna Array: Observability Analysis, Local Oscillator Frequency Offset Compensation, and Experimental Results. IEEE Trans. Instrum. Meas. 2021, 70, 1–13. [Google Scholar] [CrossRef]
- Guo, H.; Liu, J. UAV-Enhanced Intelligent Offloading for Internet of Things at the Edge. IEEE Trans. Ind. Inform. 2020, 16, 2737–2746. [Google Scholar] [CrossRef]
- Zhou, Y.; Rao, B.; Wang, W. UAV Swarm Intelligence: Recent Advances and Future Trends. IEEE Access 2020, 8, 183856–183878. [Google Scholar] [CrossRef]
- Islambouli, R.; Sharafeddine, S. Autonomous 3D Deployment of Aerial Base Stations in Wireless Networks with User Mobility. In Proceedings of the 2019 IEEE Symposium on Computers and Communications (ISCC), Barcelona, Spain, 29 June–3 July 2019. [Google Scholar]
- Yaliniz, R.; El-Keyi, A.; Yanikomeroglu, H. Efficient 3-D Placement of an Aerial Base Station in Next Generation Cellular Networks. In Proceedings of the 2016 IEEE International Conference on Communications (ICC), Kuala Lumpur, Malaysia, 22–27 May 2016. [Google Scholar]
- Zhang, S.; Zeng, Y.; Zhang, R. Cellular-Enabled UAV Communication: A Connectivity-Constrained Trajectory Optimization Perspective. IEEE Trans. Wirel. Commun. 2019, 67, 2580–2604. [Google Scholar] [CrossRef] [Green Version]
- Azari, M.M.; Rosas, F.; Chiumento, A.; Pollin, S. Reshaping Cellular Networks for the Sky: Major Factors and Feasibility. In Proceedings of the 2018 IEEE International Conference on Communications (ICC), Kansas City, MO, USA, 20–24 May 2018. [Google Scholar]
- Na, Z.; Liu, Y.; Shi, J.; Liu, C.; Gao, Z. UAV-Supported Clustered NOMA for 6G-Enabled Internet of Things: Trajectory Planning and Resource Allocation. IEEE Internet Things J. 2021, 8, 15041–15048. [Google Scholar] [CrossRef]
- Rohde, S.; Wietfeld, C. Interference Aware Positioning of Aerial Relays for Cell Overload and Outage Compensation. In Proceedings of the 2012 IEEE Vehicular Technology Conference (VTC Fall), Quebec City, QC, Canada, 3–6 September 2012. [Google Scholar]
- Hayajneh, A.M.; Zaidi, S.A.R.; McLernon, D.C.; Ghogho, M. Drone Empowered Small Cellular Disaster Recovery Networks for Resilient Smart Cities. In Proceedings of the 2016 IEEE International Conference on Sensing, Communication and Networking (SECON Workshops), London, UK, 27 June 2016. [Google Scholar]
- Ji, L.; Chen, J.; Feng, Z. Spectrum allocation and performance analysis for backhauling of UAV assisted cellular network. China Commun. 2019, 16, 83–92. [Google Scholar] [CrossRef]
- Lakew, D.S.; Masood, A.; Cho, S. 3D UAV Placement and Trajectory Optimization in UAV Assisted Wireless Networks. In Proceedings of the 2020 International Conference on Information Networking (ICOIN), Barcelona, Spain, 7–10 January 2020. [Google Scholar]
- Yang, X.; Li, Z.; Ge, X. Deployment Optimization of Multiple UAVs in Multi-UAV Assisted Cellular Networks. In Proceedings of the 2019 11th International Conference on Wireless Communications and Signal Processing (WCSP), Xi’an, China, 23–25 October 2019. [Google Scholar]
- Shukla, S.; Thakur, R.; Agarwal, S. Particle Swarm Optimization Algorithms for Altitude and Transmit Power Adjustments in UAV-Assisted Cellular Networks. In Proceedings of the 2021 IEEE 93rd Vehicular Technology Conference (VTC2021-Spring), Helsinki, Finland, 25–28 April 2021. [Google Scholar]
- Khan, T.A.; Orlik, P.V.; Kim, K.J.; Heath, R.W.; Sawa, K. A Stochastic Geometry Analysis of Large-Scale Cooperative Wireless Networks Powered by Energy Harvesting. IEEE Trans. Wirel. Commun. 2017, 65, 3343–3358. [Google Scholar] [CrossRef]
- Chetlur Ravi, V.V.; Dhillon, H.S. Downlink coverage probability in a finite network of unmanned aerial vehicle (UAV) base stations. In Proceedings of the 2016 IEEE 17th International Workshop on Signal Processing Advances in Wireless Communications (SPAWC), Edinburgh, UK, 3–6 July 2016. [Google Scholar]
- Armeniakos, C.K.; Bithas, P.S.; Kanatas, A.G. SIR Analysis in 3D UAV Networks: A Stochastic Geometry Approach. IEEE Access 2020, 8, 204963–204973. [Google Scholar] [CrossRef]
- Qi, L.; Yan, S.; Peng, M. Modeling and Performance Analysis in UAV Assisted Ultra Dense Networks. In Proceedings of the 2018 IEEE International Conference on Communications Workshops (ICC Workshops), Kansas City, MO, USA, 20–24 May 2018. [Google Scholar]
- Chu, E.; Kim, J.M.; Jung, B.C. Interference Analysis of Directional UAV Networks: A Stochastic Geometry Approach. In Proceedings of the 2019 Eleventh International Conference on Ubiquitous and Future Networks (ICUFN), Zagreb, Croatia, 2–5 July 2019. [Google Scholar]
- Zhou, L.; Yang, Z.; Zhou, S.; Zhang, W. Coverage Probability Analysis of UAV Cellular Networks in Urban Environments. In Proceedings of the 2018 IEEE International Conference on Communications Workshops (ICC Workshops), Kansas City, MO, USA, 20–24 May 2018. [Google Scholar]
- Turgut, E.; Gursoy, M.C. Downlink Analysis in Unmanned Aerial Vehicle (UAV) Assisted Cellular Networks with Clustered Users. IEEE Access 2018, 6, 36313–36324. [Google Scholar] [CrossRef]
- Yi, W.; Liu, Y.; Deng, Y.; Nallanathan, A. Clustered UAV Networks With Millimeter Wave Communications: A Stochastic Geometry View. IEEE Trans. Commun. 2020, 68, 4342–4357. [Google Scholar] [CrossRef]
- Hernandez-Aquino, R.; Zaidi, S.A.R.; McLernon, D.; Ghogho, M. Modelling and performance evaluation of non-uniform two-tier cellular networks through Stienen model. In Proceedings of the 2016 IEEE International Conference on Communications (ICC), Kuala Lumpur, Malaysia, 22–27 May 2016. [Google Scholar]
- Guo, X.; Zhang, C.; Yu, F.; Chen, H. Coverage Analysis for UAV-Assisted MmWave Cellular Networks Using Poisson Hole Process. IEEE Trans. Veh. Technol. 2021. [Google Scholar] [CrossRef]
- Guo, J.; Durrani, S.; Zhou, X. Outage Probability in Arbitrarily-Shaped Finite Wireless Networks. IEEE Trans. Wirel. Commun. 2014, 62, 699–712. [Google Scholar] [CrossRef]
- Khalid, Z.; Durrani, S. Distance Distributions in Regular Polygons. IEEE Trans. Veh. Technol. 2013, 62, 2363–2368. [Google Scholar] [CrossRef] [Green Version]
Publisher’s Note: MDPI stays neutral with regard to jurisdictional claims in published maps and institutional affiliations. |
© 2022 by the authors. Licensee MDPI, Basel, Switzerland. This article is an open access article distributed under the terms and conditions of the Creative Commons Attribution (CC BY) license (https://creativecommons.org/licenses/by/4.0/).