1. Introduction
Using Energy Management Systems (EMS) is something common in the context of smart grids, enabling the management of electric loads and resources using centralized or decentralized techniques [
1]. Considering the context, it is possible to enable the efficient control of resources with these systems implemented in smart homes [
2]. One of the great advantages of these systems is that they can include artificial intelligence models, the most common being learning models, which learn with the user and the context while being able to provide intelligent control [
3].
By using EMS, demand-side management (DSM) becomes possible since end-users can control their energy usage. End-users can participate in demand response (DR) programs [
4] and energy transactions [
5]. However, there is a catch as, usually, end-users‘ data need to be shared and, therefore, end-users must agree with the share of data, raising privacy issues.
Consumers are exposed to more variable power prices as electricity markets liberalize, and they may decide to change the profile of their consumption to minimize their electricity expenses. End-users who participate in DR programs can expect to save money on their electricity bills by reducing their usage peak times. Although the benefits of DR programs are not confined to program members, some of them are available to the entire market. In general, DR programs have been deployed in the power markets with varying goals and priorities. Some of the most critical objectives of DR implementation are the following [
6]: a lower demand from expensive electricity generating units, avoiding or postponing the need for distribution and transmission infrastructure enforcement and upgrades, and lower price volatility in the spot market.
IoT devices inside the building are also essential for the better functioning of EMS because they provide a viable solution for remote monitoring and control [
7]. IoT devices can be seen as enablers of EMS, in the sense that they allow the implementation of energy models [
8].
Even though widespread use of IoT devices is feasible, combined with the data sharing necessary for end-user engagement, it raises concerns about data privacy and access rights [
9]. The European Parliament, through the General Data Protection Regulation (GDPR) [
10], has regulated the processing of personal data and the free movement of such data. As a result, EMS must manage data issues, starting from the premise that the data belong to the user, and they are private.
This paper proposes a trustworthy energy management system for members of Energy Communities (EC) to enable direct IoT devices’ participation in DR programs. This solution is composed of an IoT-based framework for building energy management, which will allow the implementation of an EMS supported by IoT devices and focus on user privacy. User privacy is one of the advantages and innovations concerning other systems that have already been developed [
11,
12], and the proposed framework, besides focusing on the participation of IoT devices in DR programs, also allows the user’s security to be maintained. Another innovation is to make participation in DR programs by an IoT device. This framework presents a data access mechanism that allows several levels of permissions based on the data owner’s preferences, being possible to visualize each IoT’s data in a web application. Furthermore, with the aid of unsupervised learning algorithms, this solution allows the forecasting of the EC energy consumption and generation. The forecasts will be used to launch DR events targeting IoT devices to balance the EC energy. The DR event planning is based on the ranking of IoT devices resulting from the combination of four different metrics, based on clustering algorithms. These metrics evaluate historical participation and available flexibility.
Following this initial introduction section, related works on the usage of IoT devices in EMS regarding participation in demand response programs will be presented in
Section 2. The proposed IoT-based framework for building energy management will be detailed in
Section 3, which will include the architecture, how IoT devices are integrated, the data access mechanism, and the RESTful API (application programming interface). In
Section 4, the proposed DR program for EC using IoT devices will be presented. In
Section 5, the use case and its findings will be provided. In
Section 6, the results and discussion will be presented, and, finally, in
Section 7, the work’s primary conclusions will be presented.
2. Related Works
The concept and market of the IoT have been undoubtedly growing exponentially over the years [
13]. IoT devices can be used in the energy domain, namely in EMS, to monitor and control electrical loads and resources [
14]. The concept of the IoT is considered a tool that can bring great opportunities to reduce energy consumption because they help to monitor and control a wide variety of energy-related agents. Control over loads and resources enables the application of DSM supported by IoT devices [
15].
Luis Gomes et al. (2019) propose an EMS supported by IoT devices [
16,
17,
18]. This solution allows the management of end-users‘ buildings, as well as their representation in the microgrid and smart grid. IoT devices allow energy management and enable the transaction of energy among end-users.
Active participation, demand-side management, and smart buildings can be very beneficial for end-users and the smart grid [
19]. This benefit can be achieved using IoT devices. Mashima et al. (2016) proposed the use of IoT devices to activate end-user participation in demand response programs using a novel mobile app that centralizes IoT devices [
20]. Correa-Florez et al. (2018) show how you can participate in the day-ahead energy market with smart homes [
11]. Erdinc et al. (2015) propose an EMS able to participate in a dynamic-pricing-based DR program [
12].
The IoT Energy Platform (IoTEP) is a platform that helps to monitor and control the energy loads of a building, which allows using functionalities to deal with power quality and support data analysis [
21]. This Platform pays attention to the lack of support for the domestic energy domain and provides support for data analytics. Gochhayat et al. (2019) proposed a context-aware architecture to give services to users [
22]. Mocnej et al. (2018) proposed a decentralized approach for resource optimization [
23].
IoT devices are key tools to enable EMS and DSM, but they also have problems. The main problem of IoT devices is related to data security and privacy due to web communications [
24]. The privacy issue is a reality, in the United States many smart meters were placed which put data privacy into question and raised problems, it was taken to court, and it was ruled out that energy data should remain private [
25]. It is mandatory to protect user data to prevent data leakage. IoT devices are growing and cannot be put aside when we want to make EMS solutions. The other problem is that IoT devices have a big integration problem, regarding third-party software [
26]. The main innovation of the proposed EMS solution will be on the data access and data privacy mechanisms, to protect the user data and to empower the user.
3. IoT-Based Framework for Building Energy Management
The proposed software architecture was designed to allow the implementation of an EMS focused on user privacy. This paper proposes a framework that uses IoT devices to monitor the energy consumption data of the building’s loads while maintaining the privacy of data. Some studies done previously only focus on monitoring using IoT devices and in their interoperability, and energy management [
17,
21], the innovation of this system compared to these studies is to allow the user to maintain the privacy of their data and thus increase security in these types of systems.
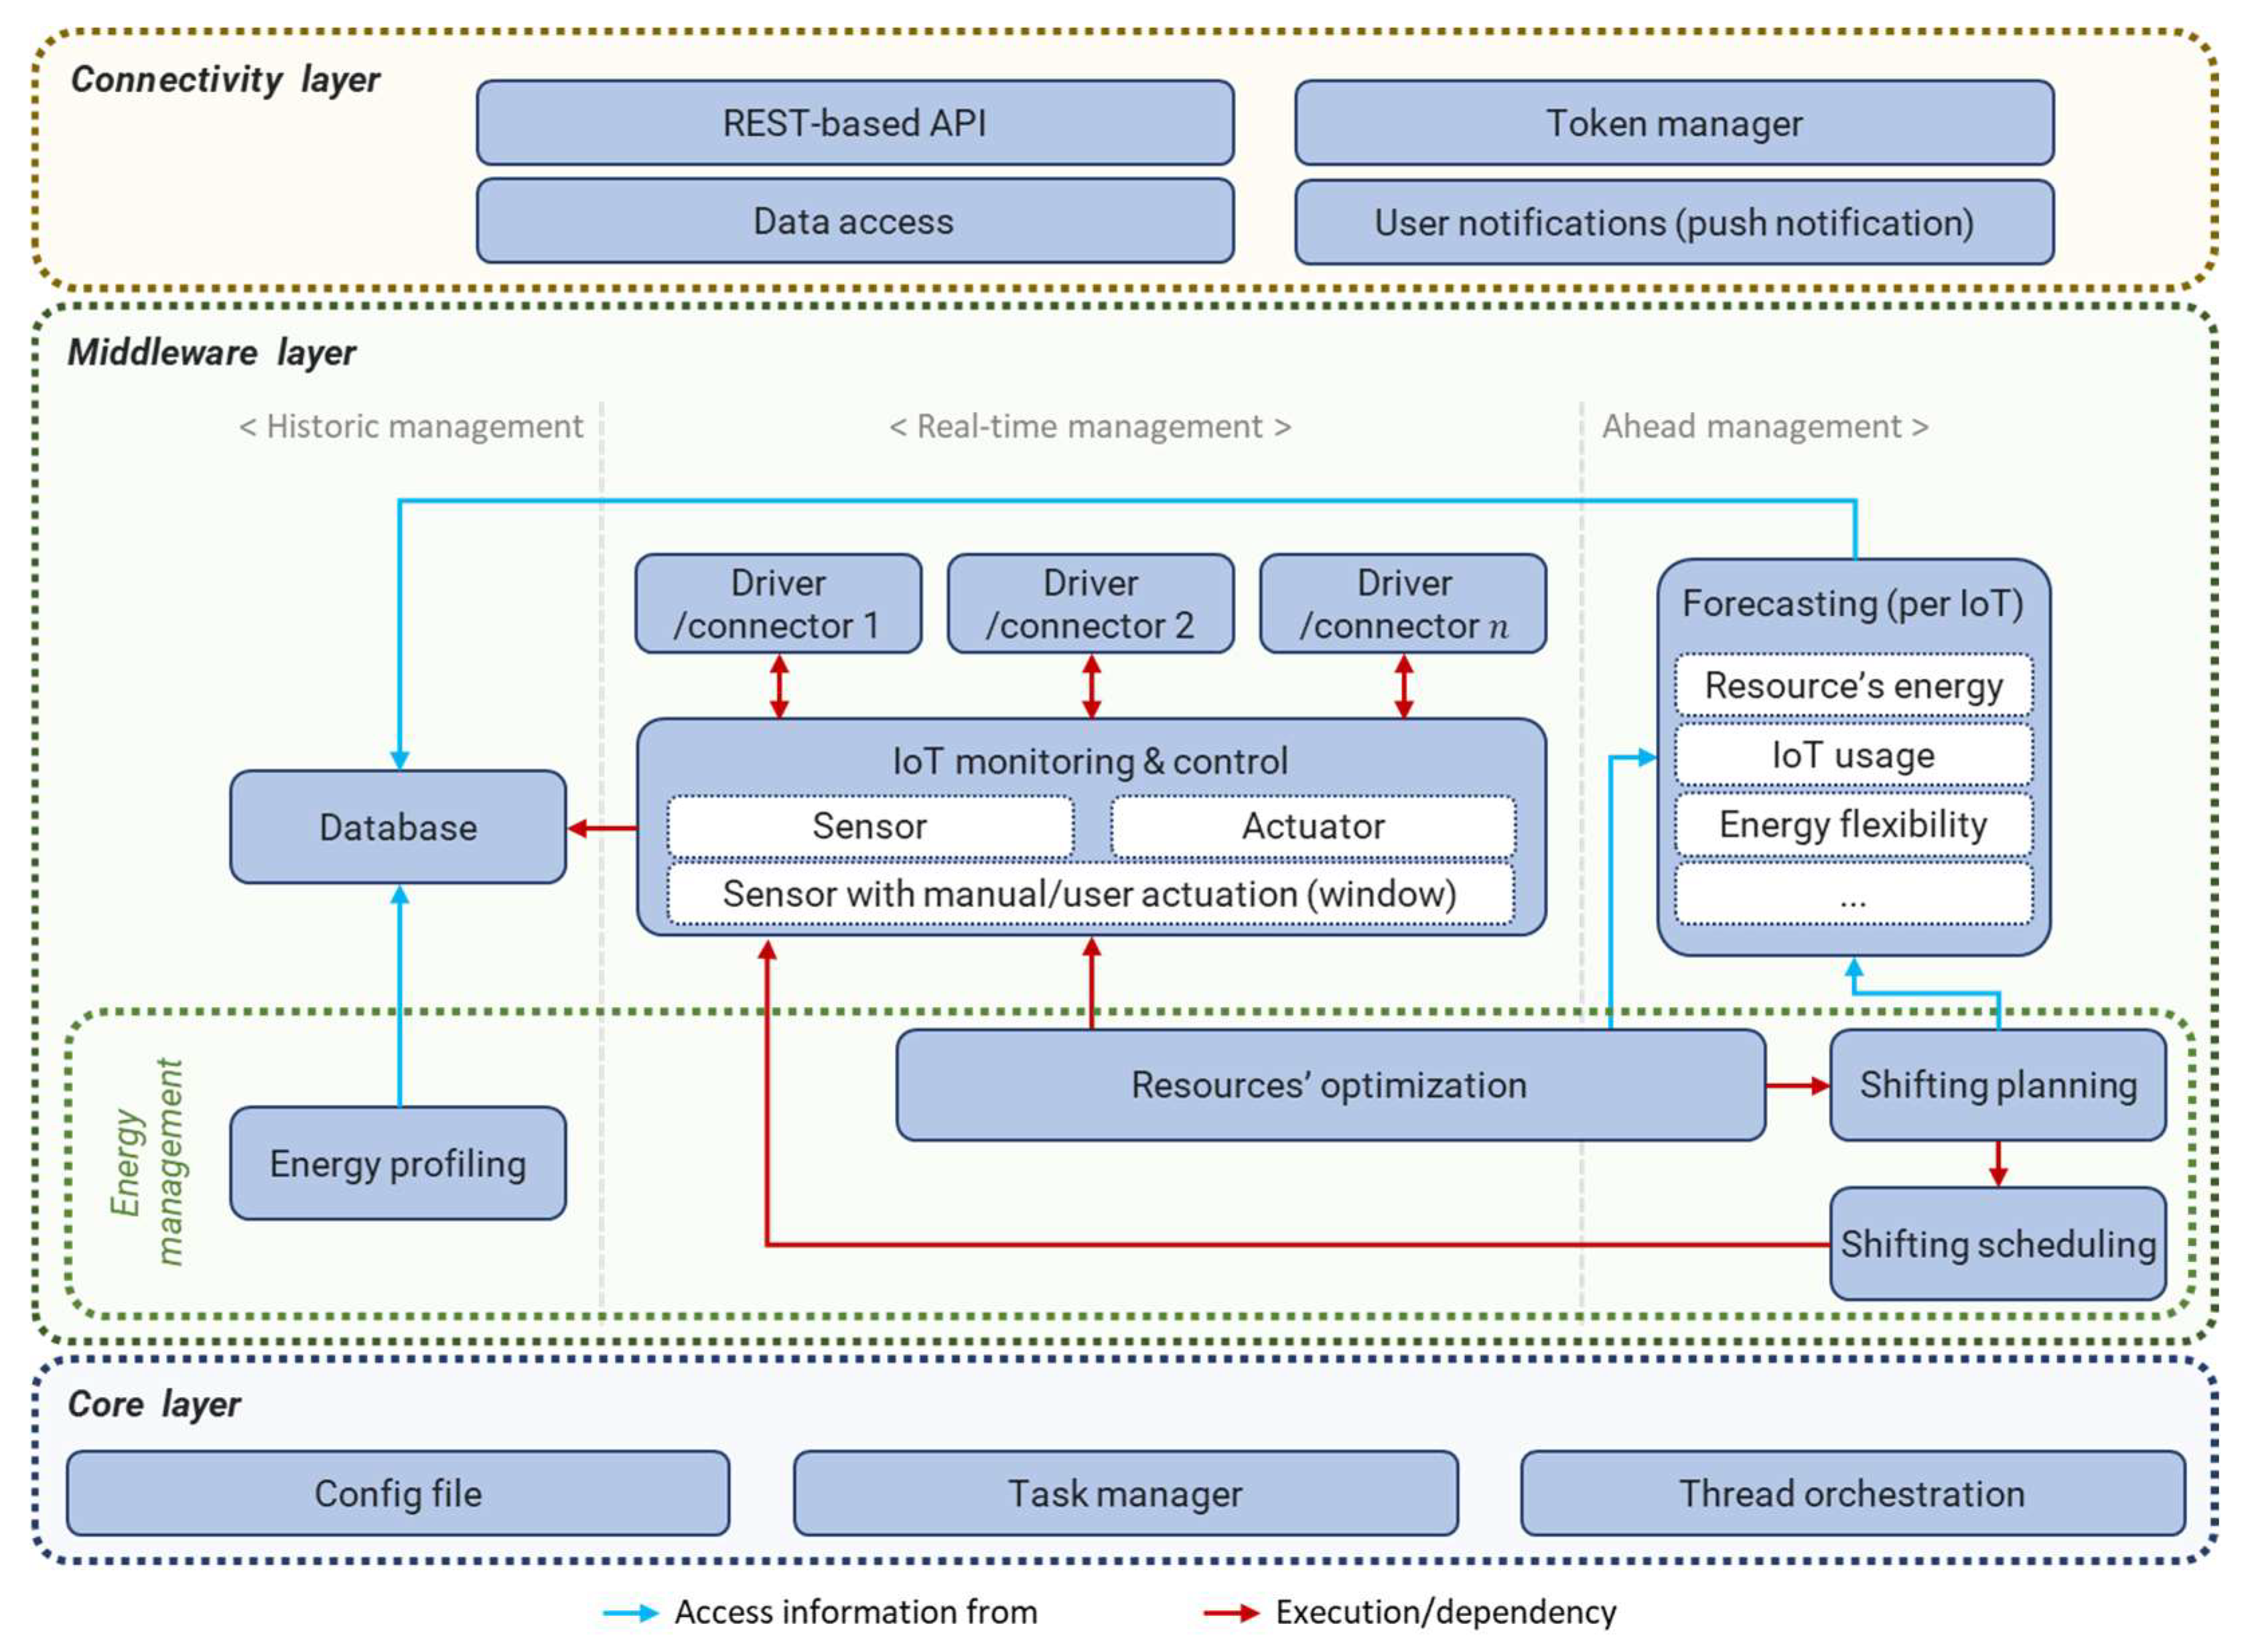
The software architecture is composed of different layers, as seen in
Figure 1, having the Connectivity Layer, which consists of the REST-based API, token manager, data access, and user notifications module.
The Middleware Layer is where the integration of drivers for sensors and actuators, energy forecasting by IoT devices, the storage of the consumption in a NoSQL database, and energy management are presented. The middleware layer is divided into three types of data management: historical management, real-time management, and ahead management. The historical management of the building is used to access data that have been recorded in the past, in this case, data previously stored in the database. Real-time management is used to monitor and visualize the data that are collected in real-time, and to provide real-time energy management. The ahead management is to provide energy management, data forecasts, and to allow the execution of forecast routines, which will serve to forecast future energy needs to achieve the balance of demand and supply. Finally, the Core Layer is composed of the essential components for the system to work, such as the configuration file, the task manager, and the thread orchestration, to enable the multi-threading of the solution.
The IoT monitoring and control module, located in the middleware layer, allows the collection and monitoring of energy loads and resources of the building. However, there is a common problem with the integration of heterogeneous IoT devices, that is, devices of different brands and manufacturers have different protocols, this will make the communication between IoT devices difficult, because they use multiple communication technologies with multiple protocols, and do not promote the interoperability and cooperation needed to deploy an EMS in buildings. The proposed solution can solve this problem by implementing multiple connection drivers where different IoT devices can be connected, where each driver can provide the integration of a different protocol.
3.1. Connectivity Layer
The Connectivity Layer is where data access is managed, always trying to maintain data privacy and security. In this layer, a RESTful API, the token manager, and the user notifications module are present. All these modules have the function of managing data access securely.
The REST API manages the requests made to the EMS and protects them using JSON Web Tokens (JWT). The token manager module verifies if the JWT is valid. The answers to the HTTP requests are created by the data access module to enable data filtering according to permissions and privacy.
The implemented routes appear described in
Table 1, only the token generation route does not need the sending of a valid JWT, but the remaining routes do since the response will depend on the token permissions. The HTTP method for the token generation route is POST and the requests for the remaining routes are GET requests.
The data access mechanism is based on JWT. JSON Web Tokens are an industry-standard RFC 7519 method for performing authentication between two parties using a signed token that authenticates a web request [
27]. This token is a code in Base64 that stores JSON objects with the data that allows for the authentication of the request. JWT is a good tool to exchange information, they are a good solution to transmit data securely because it can be signed. Signed tokens can verify the integrity of the statements they contain, while encrypted tokens hide those statements. Signed tokens have a secret key, which allows us to ensure that only the person who has access to this secret key is the one who signed the token. This mechanism allows us to be sure that who is making the request is who they say they are, and beyond the way the signature was calculated using the header and payload, it is possible to check if the information was tampered with.
The JWT generation route contains a form where information about the user is requested: requester’s name, resources to monitor, the type of data aggregation, the aggregation time, the embargo period, and the token validity time. The name of the requester is necessary to know to whom the token was assigned and who requested it. The list of resources allows us to know which resources we want to have access to visualize the consumptions of each chosen resource, for instance, if it is selected the air conditioning and the refrigerator, only the consumptions of these two resources will be shown. The data aggregation type will make the data appear aggregated, i.e., if the user wants to provide a token with aggregated data or with individual resources data. Whereby, if it is chosen individually, the consumption of each resource will be shown. Otherwise, the aggregated resources will be the sum of the consumption of all the resources. The aggregation time allows the user to choose which time interval they want to see the data, meaning that they can choose to see the data in real-time, every 5 min, every 15 min, or every 60 min. The embargo period is an important aspect of this token creation because it will allow the user to set a delay for the viewing of data that will allow maintaining user security, since through the consumptions it is possible to draw several conclusions about the user. What this embargo period does is give a delay to consumptions so that whoever is viewing the data cannot see the consumptions in real-time, thus increasing user security. Finally, the expiration date of the token is used to set a validity time of the token.
After submitting all this data, the JWT will be generated, and the user can use it to access the remaining routes and view the data according to what was filled in the form. In the route of /building/energy, it is possible to use the token generated previously to visualize the data in real-time of the different selected resources or the sum of the resources depending on what was selected in the form, in case of having an embargo period higher than 0, the values present in this route will not be the values in real-time.
The route /building/energy/historic can be used by the same token that was generated in the form, and it gives access to historical data of the resources that were selected, aggregated in the way selected when generating the token.
3.2. Middleware Layer
This solution integrates sensors and actuators. Sensors are devices that have the function of detecting and responding efficiently to some stimulus. There are several types of sensors that respond to different stimuli, such as heat, pressure, movement, and light. After the sensor receives the stimulus, its function is to emit a signal that can be converted and interpreted by other devices. Sensors with user actuation are devices that need human intervention to work such as, for example, a window; if the user opens the window, cold will come in and cause the room temperature to go down.
Actuators are devices that convert energy into movement. It can also be used to apply a force. An actuator is usually a mechanical device that takes energy and converts it into motion.
The combination between sensors and actuators is very common in IoT devices and systems, giving more contextual information related to a resource. To integrate the IoT devices, the proposed solution uses the concept of drivers, but this concept not only performs the integration of the IoT devices, but also enables an abstraction layer between the IoTs and the middleware layer. IoT devices are modeled according to their sensor and actuation capabilities. Therefore, according to this type of modeling, all devices are modeled in the same way, allowing the manipulation of multiple data sources without the need to rewrite code. This also allows new IoT devices to be added to the system without the need to update the code. The periodicity of reading can also be defined by the configuration of the IoT devices.
Another feature of the system is that it can transfer the data from the IoT devices to a database, where all the data will be stored, making it possible to make historical management of the data, allowing access to the data read previously.
The middleware layer is also responsible for the integration and execution of energy management models, such as energy forecasting, load management, and transactive energy participation.
The forecasting module enables the forecasting of the energy required to balance load supply and demand by aggregating each IoT device’s forecasted energy. This forecasting module can be implemented to forecast the energy for the next hour or hours. Furthermore, this module enables the forecast of IoT usage, which forecasts if the user uses a given resource at a given time, and enables the forecast of the IoT device’s energy flexibility, which can be used during the energy resources balancing.
Additionally present in the middleware layer is the energy management module, where it is possible to make the building’s energy profiling. In the resource optimization module, it is possible to manage the building’s energy loads and resources in real-time and for ahead periods. This energy management module also allows to schedule shifting actions, which consists of being able to schedule loads to other instances, for example, defining that a resource will turn on in a given time.
3.3. Core Layer
The Core Layer is composed of three modules that enable the proper functioning of the System. The config file works as a configuration file written in JSON, allowing the configuration of different IoT devices to be added without the need to change the fundamental code of the system, thus facilitating the interoperability of the IoT devices, as they are modeled within this configuration file.
The reading of the IoT devices is done using threads so that it is easier and faster to perform the monitoring of different IoT devices, since a thread is a form of a process that divides itself into several tasks, it is possible to be running other functionality of the system while the threads are running and monitoring the IoT devices.
The task manager allows the management of the tasks that are being executed by the system, such as starting the monitoring of IoT devices, starting the recording of data in the database, starting the execution of threads, and calculating the energy consumption of the set of different IoT devices.
4. Demand Response for Energy Communities Using IoT Devices
In the context of this work, DR is used to perform the balancing of energy resources of the EC through the participation of IoT devices. This section describes in detail how DR is planned, from identification to the invitation to the DR event. Other studies, such as [
4], already focus on a similar theme, where the presented DR methodology considers the participation of several devices to optimize the power consumption of a building. However, in this study, the classification of the devices is not considered. In this way, the proposed DR model, to facilitate the invitation process of the DR program, considers an IoT device classification to find the order in which the invitation will be done.
4.1. Demand Response Event Identification
The community manager identifies the DR event on the previous day before the event where, based on Equation (1) and the day-ahead forecasts of the EC energy resources, it identifies periods that need to be balanced. In this way, in a period
where the forecasted consumption (
) minus the forecasted flexibility (
) is less than or equal to the forecasted generation (
), it is considered a viable period to launch a DR event, where IoT devices are invited to make corrections to their consumption through reduction or shifting.
After the identification of the DR event, the community manager checks what flexibility the IoT devices of the EC can provide during the respective event. With this communication process, the possible IoT devices that can participate in the DR event are identified, as well as the amount and type of flexibility provided by them.
4.2. IoT Device Classification
A crucial process of the presented DR model is the identification of the DR event participants. This process is done by the community manager, where the latter, implementing unsupervised learning algorithms, classifies IoT devices through historical data and the total flexibility in a period of each IoT device. The historical data considered are the total number of times the IoT device participated in past DR events, the total number of requests made to IoT devices to participate in past DR events, the percentage of IoT device participation, and the total average flexibility provided by IoT devices during the DR events. Thus, it is possible to create different metrics that evaluate IoT devices with the aforementioned data. These metrics consist of implementing clustering algorithms to classify IoT devices according to different parameters. For each cluster, an evaluation parameter that will allow to compare the clusters and sort them in a descending order is defined. To determine the appropriate cluster number for each metric, the silhouette coefficient method is used.
For the proposed DR program, four metrics are used ( = 4):
Metric 1: this metric uses the percentage of participation and the average flexibility provided by the IoT device in past DR events, where the evaluation parameter is the percentage of participation;
Metric 2: considers the total number of times the end-user participated, and the average flexibility provided by the IoT device in past DR events, where the evaluation parameter, in this case, is the average flexibility;
Metric 3: this metric considers the reduction flexibility for period and the percentage of participation, with the respective flexibility being the evaluation parameter;
Metric 4: only considers the cost from the shifting distribution provided by the IoT device. The cost of this metric is obtained through a four-hourly tariff (based on the Portuguese tariffs), which has the following four-time periods: peak, flood, super empty, and normal empty. In this metric the consumptions shifted to peak periods will be penalized.
Metrics 1 and 2 focus on evaluating the IoT devices’ historical data regarding past DR events. In the case of Metric 3 and 4, these evaluate the flexibility of the IoT devices for period , where Metric 3 is only applied in IoT devices that can provide flexibility by reductions, while Metric 4 is only addressed to IoT devices that can provide flexibility by shifting.
After obtaining the different clusters of each metric , the following step consists of determining the score that each cluster has. To do this, first, the evaluation parameter is defined in each metric . That is, the centroid coordinate is chosen to which more emphasis will be placed in the evaluation.
In this way, after these, it is possible to apply a scoring system in the clusters of each metric . This scoring system ensures that the best cluster has a maximum score of 20 points, and the remaining clusters are scored according to their relevance to the best cluster. Thus, if we consider that an IoT device is always in the best cluster of metrics, its score is points. It is also important to highlight that each IoT device has the same score as the respective cluster in which it is integrated.
The first step of this scoring system is, for each metric
, calculating the distribution (
) of each cluster
, as shown in Equation (2):
where
vpi represents the value of the evaluation parameter of cluster
. To calculate the distribution of
vpi, it is divided by the total sum of all the evaluation parameter values of all the
clusters.
Subsequently, after obtaining the distributions of each cluster
, the next step is to determine their scores. This is done through Equation (3). Considering that the
clusters are ordered in a descending way accordingly to the evaluation parameter of the metric
, this equation calculates the score for each cluster
, where, in the end, the best cluster (
= 1) has 20 points. Thus, the final score of each cluster
is calculated as follows:
As seen in the equation, the final score of the best cluster ( = 1) will be equal to the distribution of cluster plus the distributions of each of the remaining clusters multiplying by 20. This process is the same for the remaining clusters (e.g., for = 2, the other clusters would be = {3, …, }), except for the last cluster ( = ). The final score for the last cluster is equal to his distribution multiplied by 20.
Finally, with Equation (4), the points of an IoT device,
, are calculated, where this equation considers the points of the clusters that IoT device
was integrated into each of the
metrics. In this way, the points of the IoT device
is determined as follows:
In this paper, the different metrics are run with the K-Means clustering algorithm, where two months of historical data from IoT devices are considered. As the shifting evaluation uses data regarding the DR event, this evaluation uses data that are retrieved by querying the IoT devices.
4.3. Invitation for the Demand Response Event
With the ranking of the IoT devices, the community manager can define the order to invite the respective IoT devices to participate in the DR event. Thus, to perform the correct balancing of energy resources during the DR event, the community manager considers as the main participants the best-ranked IoT devices that can provide the necessary flexibility to perform the correction. In contrast, the remaining IoT devices are held in reserve. After defining the order of participation of the IoT devices, the community manager sends invitations to the respective end-users.
The invitations to the DR event can be made on two occasions. One of them is always made at the end of the day before the day of the DR event, where it allows one to notify the respective participants in advance. The second occasion is when the invitation is sent during the monitoring of the DR event. This monitoring is done in a loop every 10 min, where it serves to check whether the balancing of energy resources is at the desired value, i.e., if the consumption of EC has been reduced to the same value as the photovoltaic (PV) generation. In this way, if the flexibility provided by the main participants is not sufficient to balance the energy resources, the intervention of the reserve IoT devices is necessary. According to the obtained IoT device ranking, these reserve IoT devices are invited in real-time to assist the DR event with their flexibility, enabling to correct the deviations detected in real-time monitoring.
5. Case Study
The case study of this paper consists of an EC of 50 buildings, where one of them is a public building and the others are residences. The public building, along with some residences, have PV panels installed. These buildings are constituted by IoT devices that allow the monitoring, in 15 min periods, of the PV generation and the consumption of several types of appliances. In this EC, the average number of appliances connected to IoT devices is 2 per building, where these appliances, during the DR events, can provide flexibility by reduction or shifting. The appliances that provide flexibility by reduction are limited to reducing the entire consumption (i.e., only discrete loads are considered). In the case of appliances that provide flexibility by shifting, if they participate in the DR event they must indicate, in advance, the periods, and the amount of energy to which they will shift their consumption.
From the obtained day-ahead forecast of the EC energy resources, it is verified that three periods can be corrected. This paper will focus on just one of them, which is considered the period when more appliances are available to provide flexibility. The appliances used in this case study are listed below, where the type of appliance, the respective type of flexibility that it can provide, the total quantity of the respective appliance in the EC, and the quantity of the appliances that can provide flexibility during the DR event are highlighted:
Air Conditioner (Flexibility: Shifting; Total Quantity: 16; DR event Quantity: 9);
Dishwasher (Flexibility: Shifting; Total Quantity: 11; DR event Quantity: 6);
Dryer (Flexibility: Shifting; Total Quantity: 11; DR event Quantity: 3);
Lighting (Flexibility: Reduction; Total Quantity: 10; DR event Quantity: 10);
Refrigerator (Flexibility: Shifting; Total Quantity: 13; DR event Quantity: 13);
Washing Machine (Flexibility: Shifting; Total Quantity: 14; DR event Quantity: 9);
Water Heater (Flexibility: Shifting; Total Quantity: 25; DR event Quantity: 9).
Regarding data access, this is done through the IoT-based framework for building energy management presented in
Section 3.1. Each data access token is associated with an IoT device and the data from each IoT device are presented in a JSON document.
Figure 2 shows a response to the requested data in JSON that shows how the data are sent from the end-user/IoT device that contains the forecasted flexibility for the DR event, the forecasted reduction, the forecasted shifting, and the different shifting distributions.
In the displayed JSON document (
Figure 2) we can see the dishwasher data of end-user 2. For a better understanding of the shifting distribution data,
Figure 3 shows the shifting distributions of the different IoT devices of end-user 2.
The graph of
Figure 3 shows the shifting planning of IoT devices referring to end-user 2 that have flexibility during the event. However, the end-user owns more IoT devices, but not all of them are represented in the graph since they have no flexibility during the DR event.
The respective period where the DR event is applied is the 11:00 a.m. period, where a reduction in the EC consumption by around 1.55 kWh is necessary. Regarding the ranking of the IoT devices to participate in the DR event, this paper considers the four metrics mentioned in
Section 4.2.
6. Results and Discussion
After the implementation of the methodology presented in
Section 4, the ranking of the IoT devices is obtained, as can be seen in the example illustrated in
Table 2. This table shows the score of the top 10 ranked IoT devices for each metric, described in
Section 4.2, and on the total. The IoT devices are represented by “D[e].[d]”, where
e represents the ID of the end-user and
d represents the ID of the IoT device in the residence of the end-user. Metrics 1 and 2 assess, respectively, the IoT device’s participation and flexibility regarding past DR events. While Metric 3 and 4 assess the flexibility of the IoT devices for period
. As mentioned before, Metric 3 is only applied in IoT devices that can provide flexibility by reduction and Metric 4 in IoT devices that can provide flexibility by shifting. Therefore, these metrics cannot be applied to the same IoT devices. Since, in this particular case, the illustrated top 10 IoT devices are only made up of appliances that provide shifting flexibility, the score of Metric 3 is always zero.
The collection and monitoring of energy loads and resources in the building are done through the implementation of multiple connection drivers where all IoT devices are connected. Data collection is done through HTTP requests and all the data collected are stored in a MongoDB database. The data are monitored using 1-s intervals and are stored in the database using 5-s intervals—the storage of values uses the average or sum of the monitored values, depending on the parameters.
Figure 4 illustrates the performed real-time monitoring, in a 10-min loop, during the DR event that occurred at 11:00 a.m. On the one hand, according to the vertical axis on the right, this figure illustrates the total EC consumption and generation in areas. On the other hand, the Aggregated Balance without corrections (ABWC) and Corrections 1 and 2 are illustrated in lines with the vertical axis on the left. It is important to highlight that the illustrated consumption already accounts for the flexibility of the main IoT devices invited to the DR event.
Regarding the ABWC, this represents the aggregation of the EC energy balance during the DR event. This balance consists of the consumption minus the generation minus the flexibility provided by the main IoT devices that participated in the DR event.
Corrections 1 and 2 (green and red lines) represent the corrections implemented during the DR event, according to the description in
Section 4.3, in the periods where the ABWC (blue line) becomes positive. These corrections imply the invitation of
reserve IoT devices to provide their flexibility to reduce the aggregated balance of the EC. The additional
IoT devices are determined accordingly to their ranking positions, where the sum of the flexibility of the
reserve IoT devices must be enough to suppress the needed energy to reduce in the respective period. In other words, these corrections represent the aggregated balance minus the flexibility of the additional invited IoT devices. Furthermore, the respective corrections are planned according to the forecasted flexibilities of the IoT devices obtained in the previous day where, when applied, they are implemented in the respective period and the following ones. If the first correction was not enough, an additional correction is made, inviting new
reserve IoT devices to provide flexibility. During the monitoring of the DR event, the provided flexibility by the IoT devices differs from their forecasted flexibility, where these results from the forecast errors and IoT device participation deviates. In the end, for this DR event to be successful, the ABWC or, if they exist, the respective corrections (which represent the ABWC with the flexibility of the additional reserve IoT devices) must be close to zero, meaning that the energy was balanced within the DR event.
Considering that it is necessary to reduce 1.55 kWh of the EC consumption in the period of 11:00 a.m. and also the information illustrated in
Table 2, it is possible to verify that the first four ranked IoT devices can provide the needed flexibility where the total is 1.581 kWh. In this way, these four IoT devices were invited as the main participants, and their flexibility was considered throughout the DR event.
Analyzing what happened during the DR event through
Figure 4, it is possible to verify that in the first 20 min, the EC consumption (which already includes the flexibility of the four IoT devices) was lower than the PV generation, making the ABWC (blue line) negative. Nevertheless, after 20 min, the EC consumption exceeds the PV generation. During the interval, between the 30 and 40 min, the ABWC becomes positive where, at 40 min, it was registered with a value equal to 2.5 kWh. In response, at 40 min Correction 1 (green line) was applied. This correction, based on the forecasted flexibilities of the IoT devices, considers the flexibility of the next 12 ranked IoT devices, where it is estimated that these IoT devices can provide 2.9 kWh of flexibility. As shown in
Figure 4, Correction 1 (which represents the ABWC with the flexibility of the additional 12 IoT devices) was significantly lower than the value of the ABWC. However, it was not enough, as the value of the Correction 1 at 50 min was 2.6 kWh. Therefore, Correction 2 was applied at 50 min, where it considered the flexibility of the next 13 ranked IoT devices, which corresponded to a 2.7 kWh. With Correction 2 (which represents Correction 1 with the flexibility of the additional 13 IoT devices), it was verified that at 60 min, the reached value was below zero.
At the end of the DR event, it is possible to verify that the flexibility of the four main invited IoT devices was not enough to mitigate the consumption excess of the EC since the ABWC is still above zero. In this way, the monitoring of the DR event was crucial to support the balancing of the energy resources of the EC, where this was possible, through the combination of Corrections 1 and 2. In short, in this DR event, 29 IoT devices of 23 end-users were invited, where these provided, in a one-hour event, about 2 kWh of flexibility.
To further evaluate the presented methodology, the different scenarios illustrated in
Table 3 were considered. This table presents, for each scenario, the energy cost and the energy balance in the EC grid for the discussed DR event. These costs were calculated through a dynamic tariff. In the case where the energy balance is negative, it is considered that energy is sold at half of the dynamic tariff value. The Independent scenario represents the case where there is no EC and DR event. In other words, in this scenario, there is no share of the PV generation between the end-users, where each end-user has to pay their energy consumption or sell their generation excess. The All Flexibility scenario consists of the case where all flexibility provided by the IoT devices is used. This scenario makes it possible to obtain the maximum reduction. The business as usual (BAU) represents the case where the EC exists, but the proposed methodology is not implemented. Correction 0 represents the ABWC mentioned in
Figure 4, where is highlighted the impact of the contribution of the main invited IoT devices. Correction 1 and 2 represent the contributions of the reserve IoT devices invited during the DR event 10-min monitoring.
It is important to highlight that the energy values of
Table 3 are the real EC data for the considered hour of the event DR and were different from the forecasted values.
Regarding the respective corrections, it is verified that with Correction 0, there was a reduction of approximately 0.5 kWh. This means that one or more IoT devices could not participate in the DR event. With Correction 1, a significant reduction in the EC energy consumption was verified, remaining approximately 0.759 kWh. Finally, with Correction 2, the EC energy resources were balanced, where the EC consumption was reduced to a slightly lower value than the PV generation.
With this table, it is possible to compare different scenarios. Concerning the comparison between the Independent and BAU scenarios, it is possible to verify the economic benefits that exist by only considering the concept of the EC in just one hour, wherein, in this case, the EC itself can reduce approximately 1.49 EUR. Considering the All Flexibility and BAU scenarios, the economic profits in one DR event is about 1 EUR, where, at the end of the end, it was necessary to sell the excess energy of 15.048 kWh. Finally, regarding the BAU and Correction 2 scenarios, it can be seen that, in this one-hour DR event, the EC consumption was reduced by approximately 2.8 kWh, balancing the EC energy resources in a manner that the PV generation was used to its max.
7. Conclusions and Future Work
In this paper, a trustworthy energy management solution is proposed to enable direct IoT devices’ participation in demand response programs. The proposed approach protects against data leakage due to untrustworthy third parties. With the increasing need for data, our technology provides the necessary data while protecting the privacy of individual data. This not only increases the value of the data but also reduces privacy concerns. The uses of JSON web tokens allowed the proposed systems to share data while respecting the users’ rights and wishes, allowing the user to make the final decision. In the proposed system, the user can generate the tokens for the IoT devices that she/he wants to have available for demand response participation. This is a critical issue in smart grids, where data flow without regard to privacy concerns. With this added value, it is possible to have a safe and effective energy management system that can be used by anyone without compromising privacy.
Furthermore, this approach proposes the use of unsupervised learning algorithms to plan future demand response events to balance the energy community consumption and photovoltaic generation. The proposed demand response program considers the flexibility of the IoT devices accordingly to their ranking. This ranking is done through four metrics that evaluate different types of IoT device data.
Based on real customer data, this approach was tested based on the simulation of an energy community with 50 buildings and photovoltaic generation. The presented results demonstrated that the planned demand response event was a success, where the community energy resources were balanced through the participation of IoT devices that reduced approximately 2.8 kWh.
A future improvement in this approach would be the development of a 10-min-ahead forecast algorithm for consumption, photovoltaic generation, and flexibility. These algorithms could be used during the demand response event monitoring to improve the invitation of new participants according to the near real-time data. Thus, the respective corrections could be forecasted in advance, increasing the efficiency of the demand response event.


