PM2.5 Concentration Measurement Based on Image Perception
Abstract
:1. Introduction
2. Proposed Method
2.1. Natural Scene Statistical Prior for the Color Saturation Loss
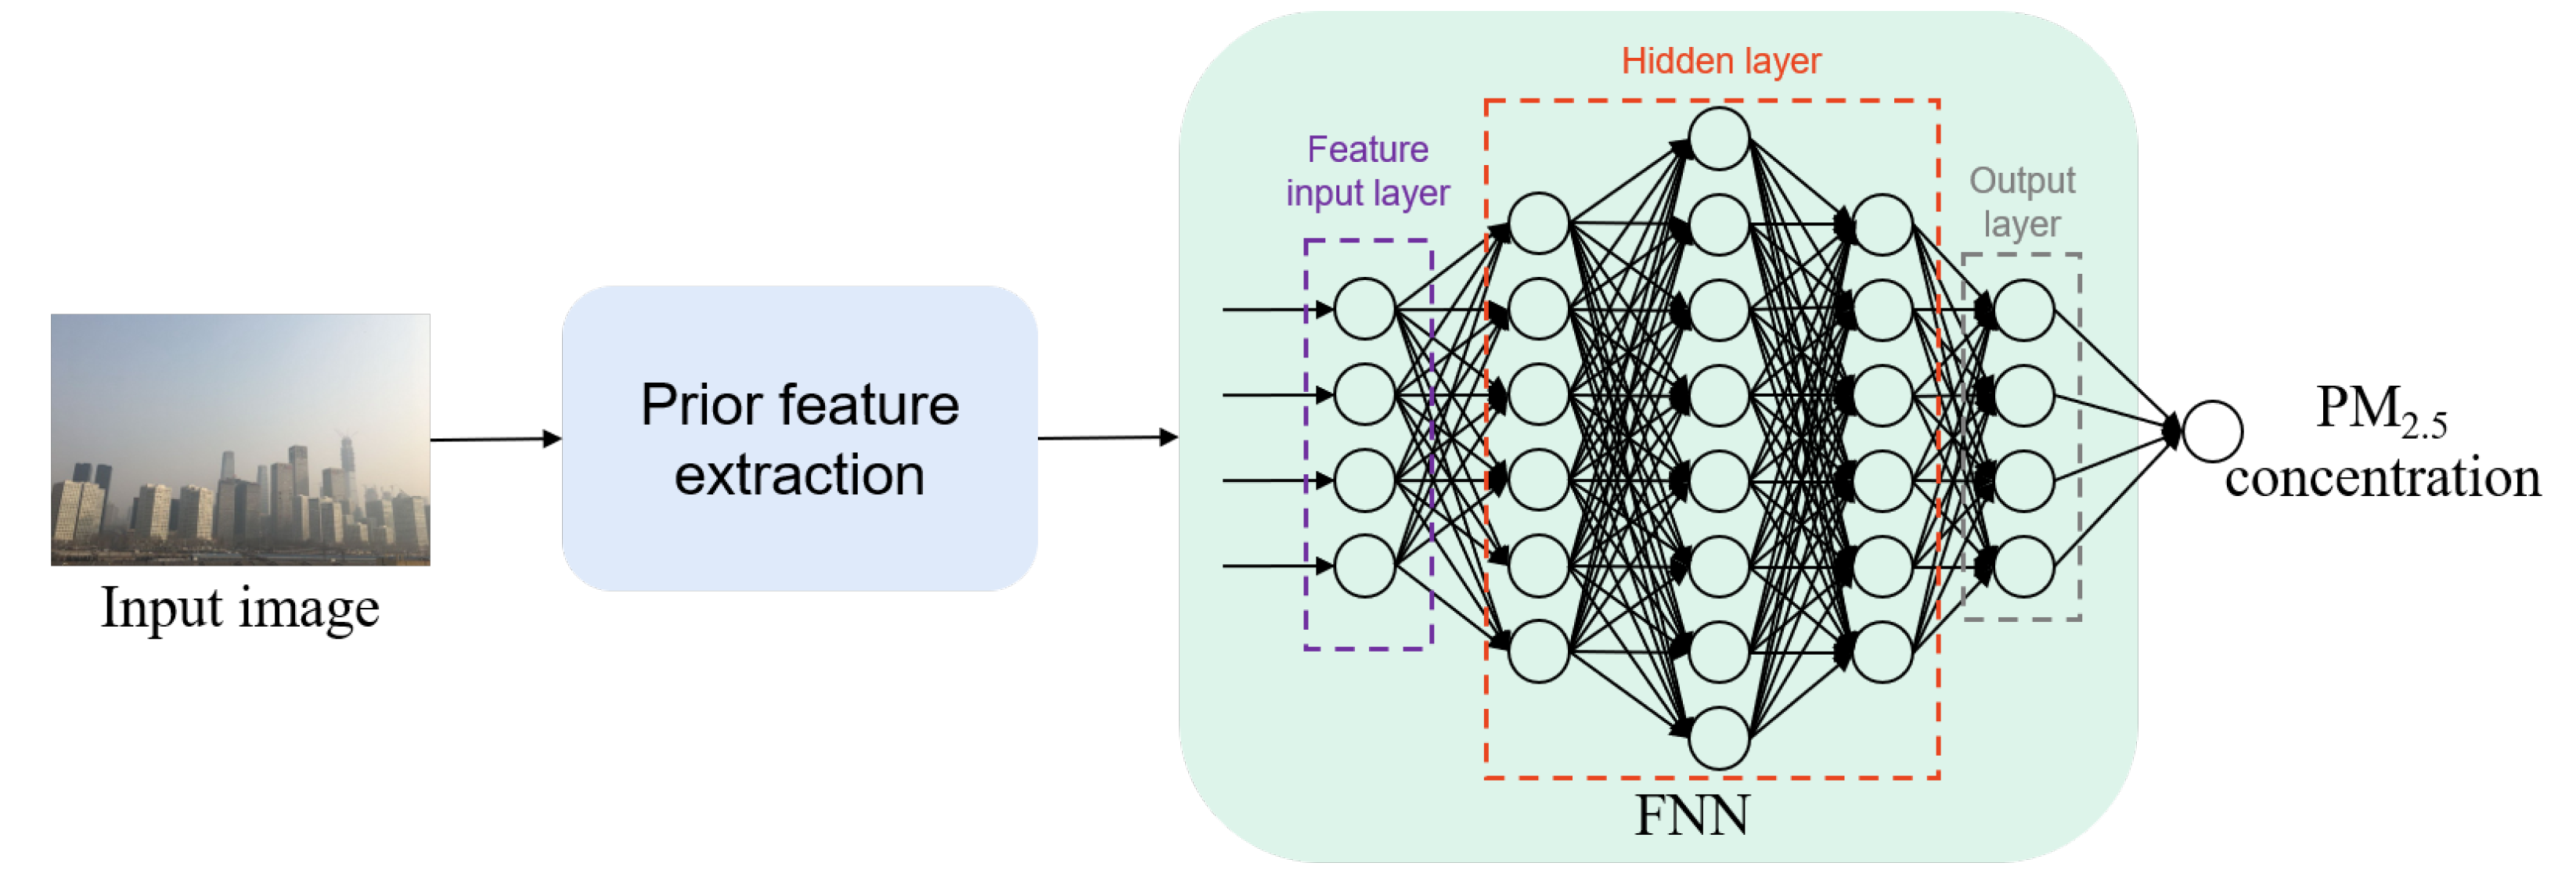
2.2. Proposed FNN-Based PM2.5 Concentration Measurement Model
3. Results
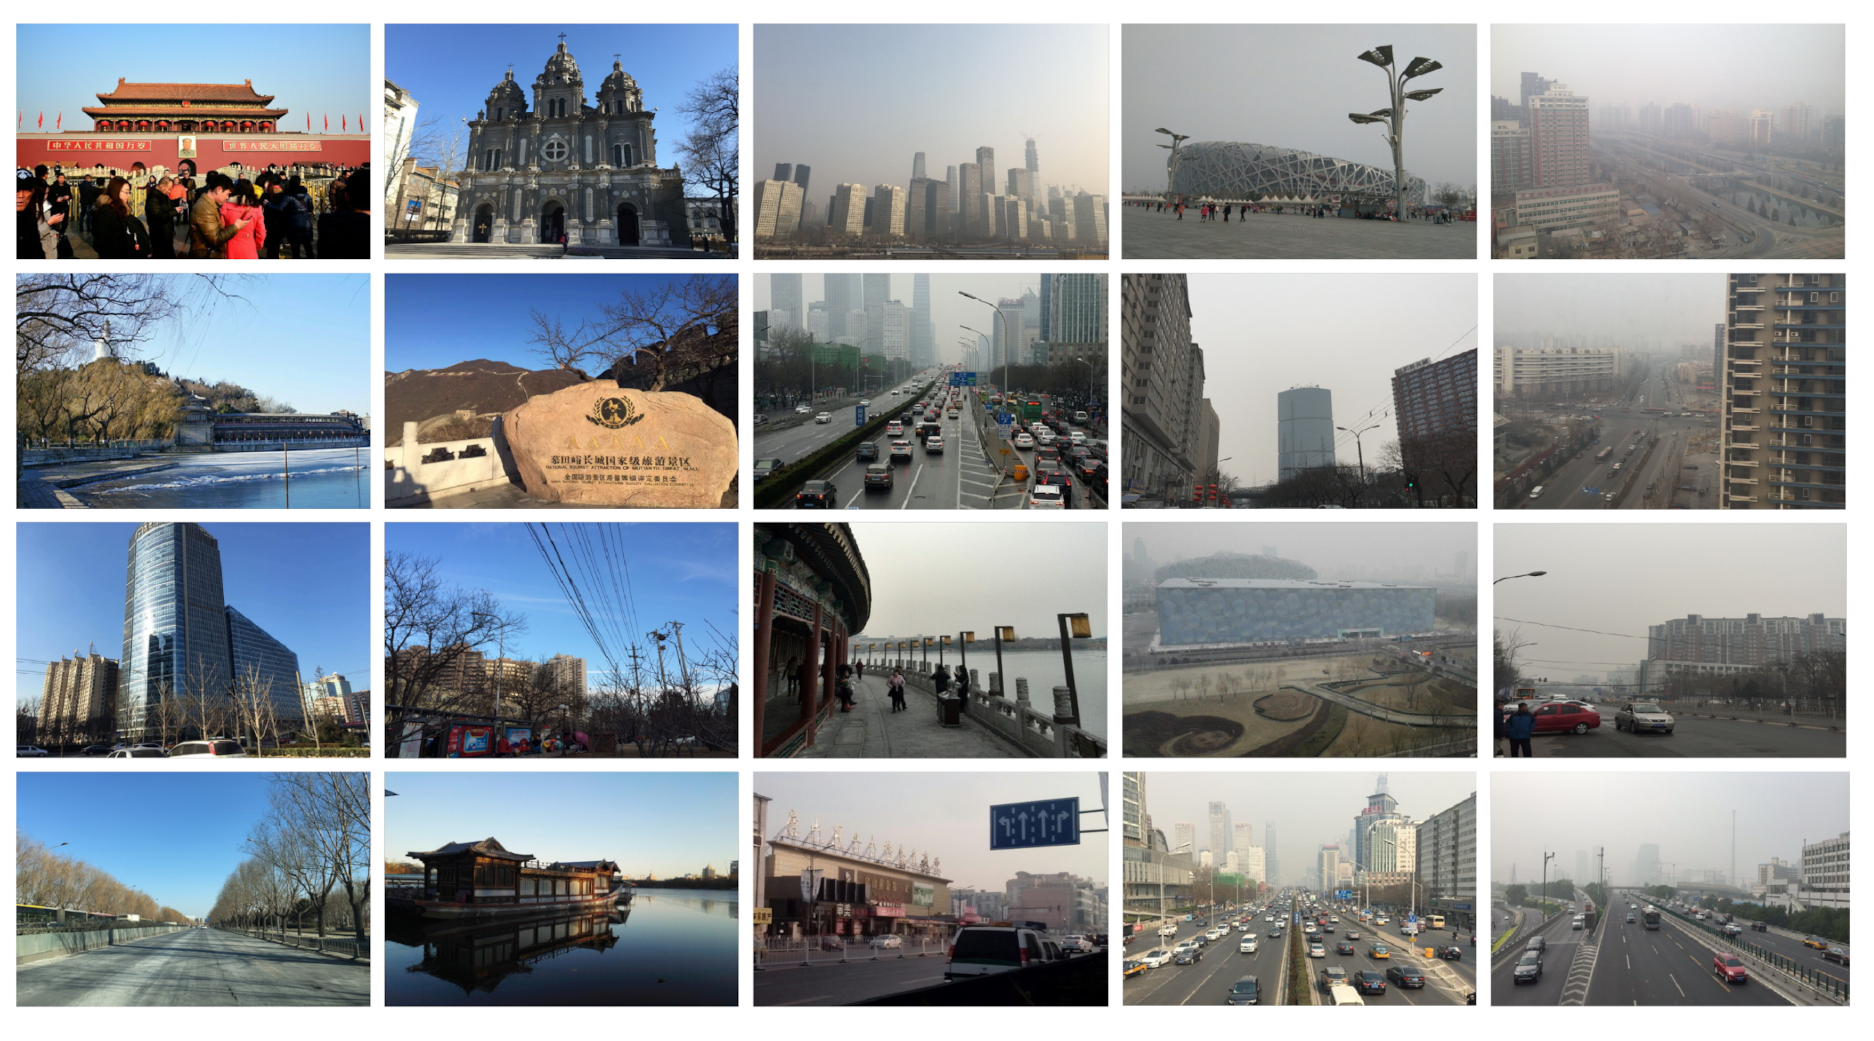
3.1. Testing Dataset
3.2. Evaluation Criteria
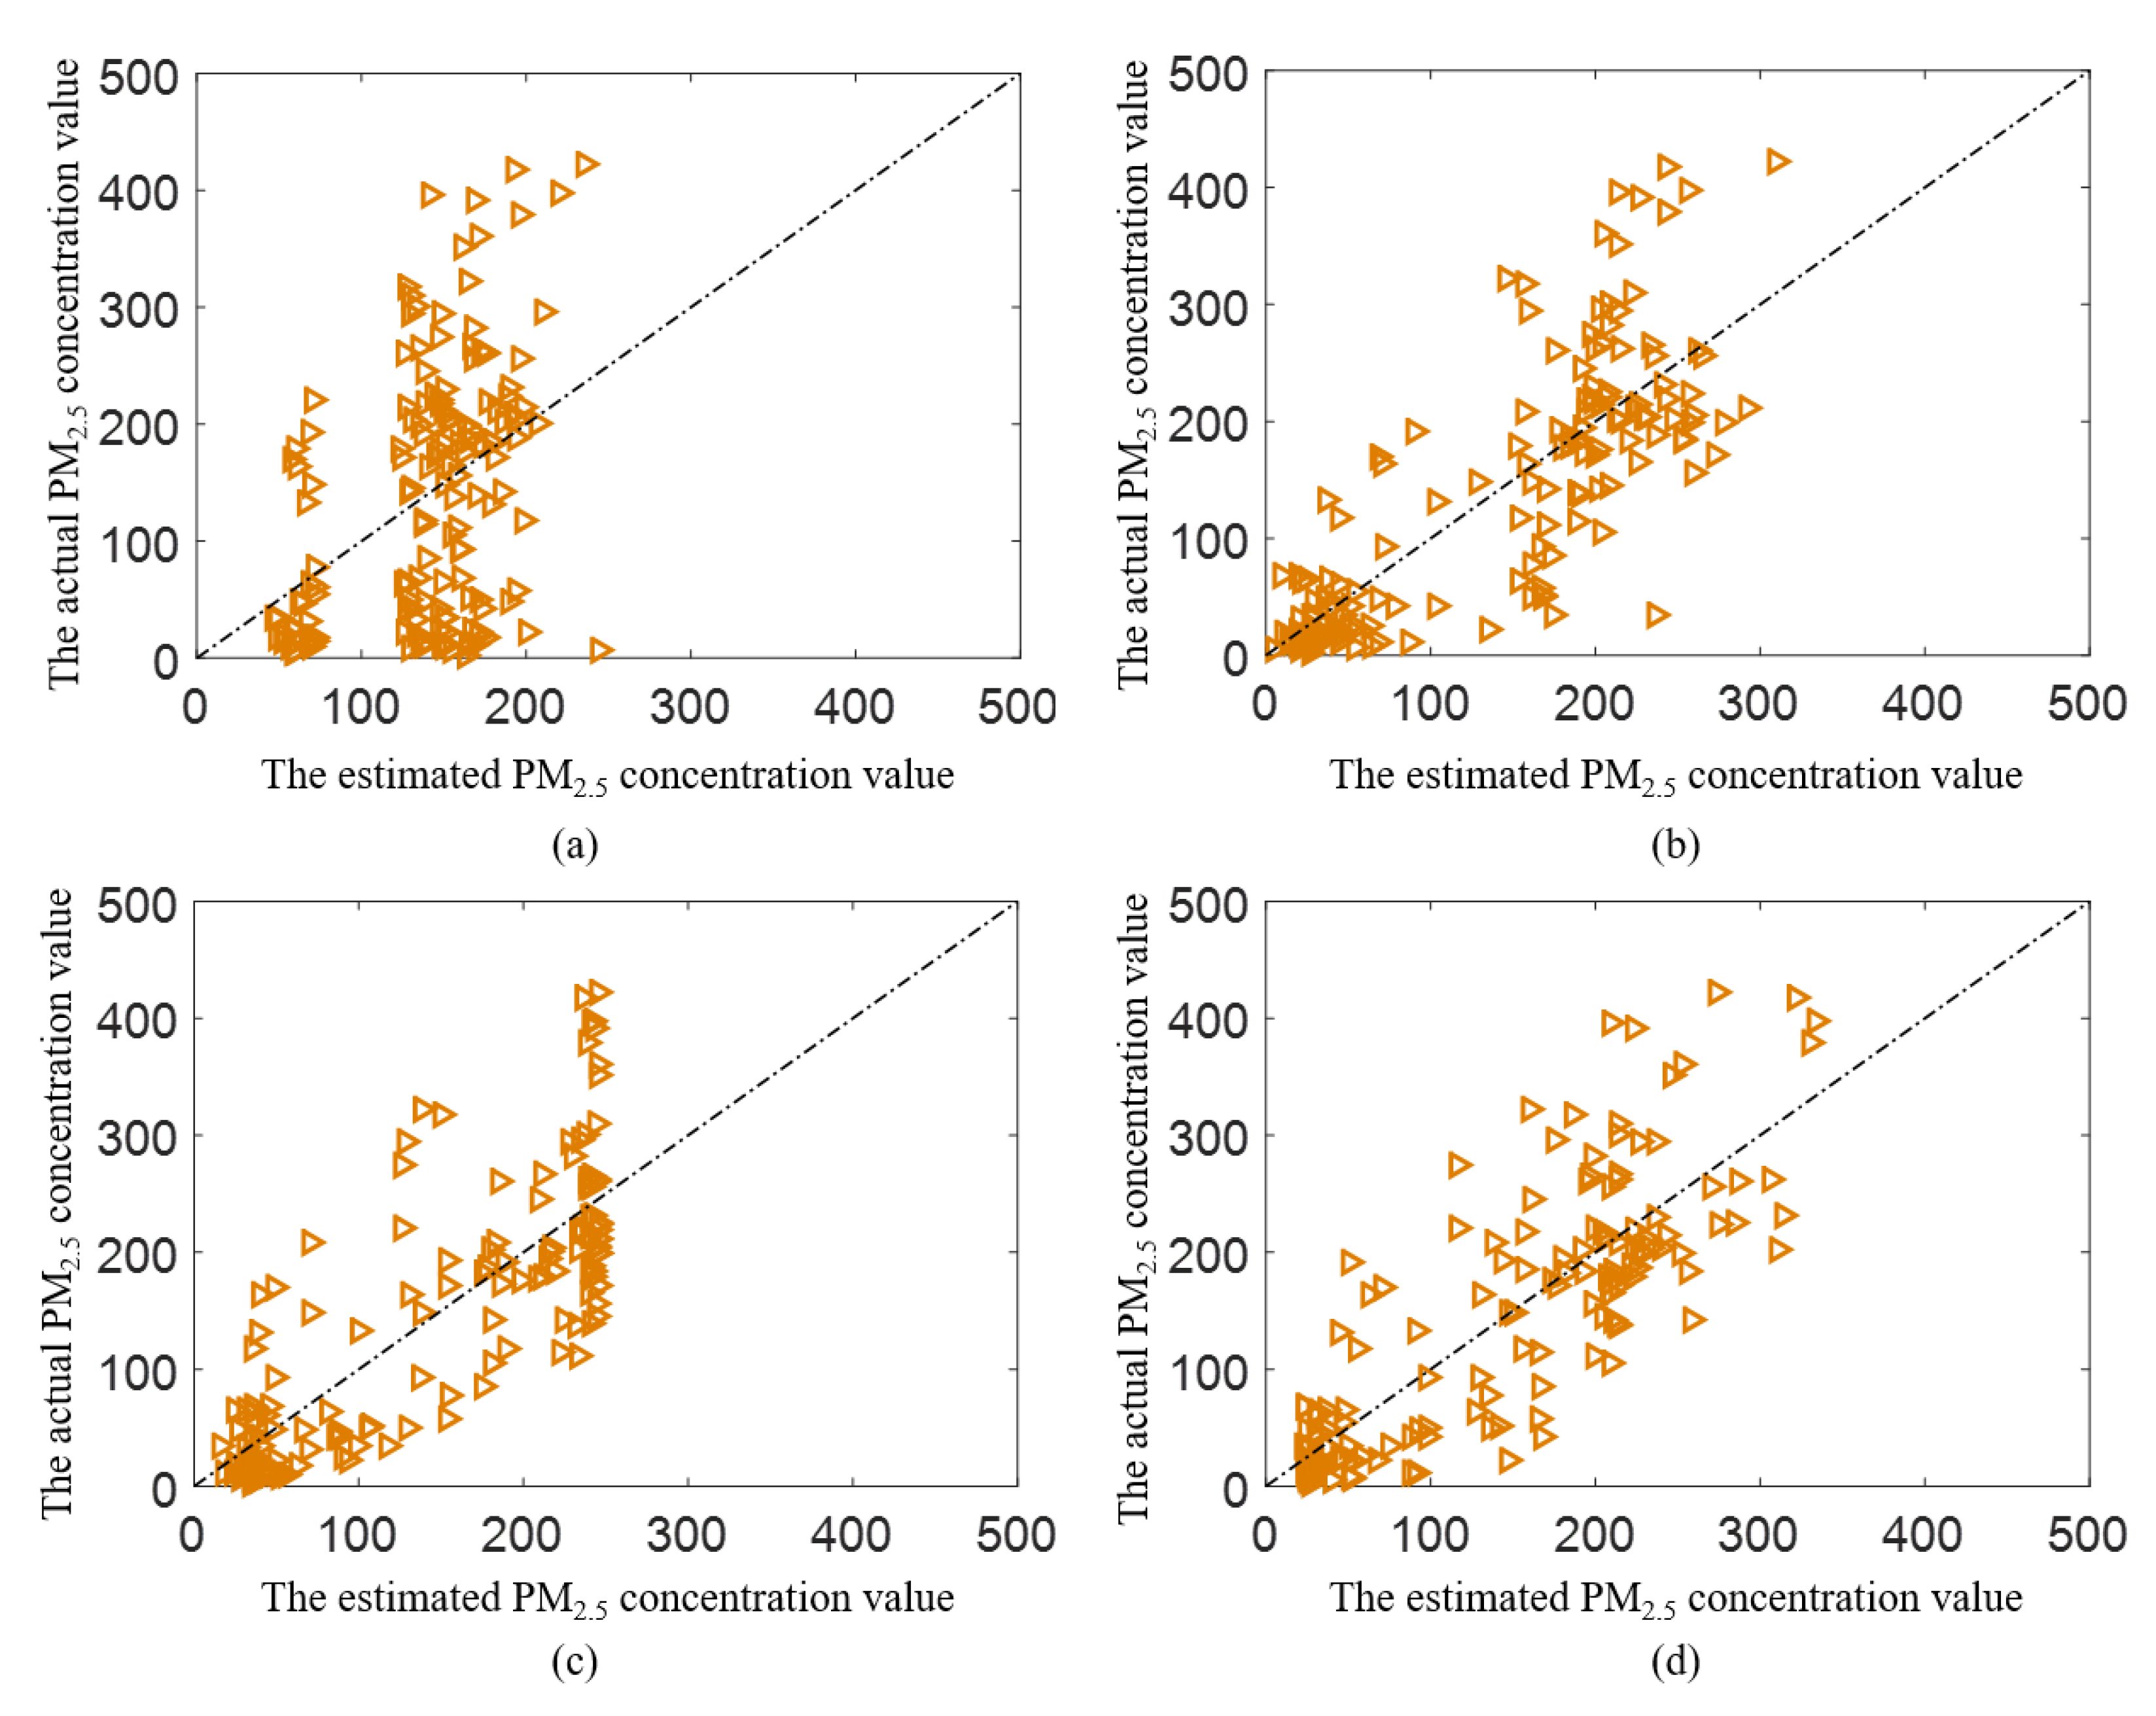
3.3. Ablation Study on the Regression Models
3.4. Performance Comparison with the Benchmark Algorithms
4. Conclusions
Author Contributions
Funding
Data Availability Statement
Acknowledgments
Conflicts of Interest
References
- Pope, C.; Burnett, R.; Thun, M.; Calle, E.; Krewski, D.; Ito, K.; Thurston, G. Lung cancer, cardiopulmonary mortality, and long-term exposure to fine particulate air pollution. JAMA-J. Am. Med. Assoc. 2002, 287, 1132–1141. [Google Scholar] [CrossRef] [Green Version]
- Andria, G.; Cavone, G.; Di Lecce, V.; Lanzolla, A. Model characterization in measurements of environmental pollutants via data correlation of sensor outputs. IEEE Trans. Instrum. Meas. 2005, 54, 1061–1066. [Google Scholar] [CrossRef]
- Gu, K.; Qiao, J.; Lin, W. Recurrent Air Quality Predictor Based on Meteorology- and Pollution-Related Factors. IEEE Trans. Ind. Inform. 2018, 14, 3946–3955. [Google Scholar] [CrossRef]
- Song, Z.; Tang, C.; Ji, J.; Todo, Y.; Tang, Z. A Simple Dendritic Neural Network Model-Based Approach for Daily PM2.5 Concentration Prediction. Electronics 2021, 10, 373. [Google Scholar] [CrossRef]
- Saffari, A.; Daher, N.; Shafer, M.M.; Schauer, J.J.; Sioutas, C. Global Perspective on the Oxidative Potential of Airborne Particulate Matter: A Synthesis of Research Findings. Environ. Sci. Technol. 2014, 48, 7576–7583. [Google Scholar] [CrossRef]
- Guo, Y.; Tong, S.; Zhang, Y.; Barnett, A.G.; Jia, Y.; Pan, X. The relationship between particulate air pollution and emergency hospital visits for hypertension in Beijing, China. Sci. Total Environ. 2010, 408, 4446–4450. [Google Scholar] [CrossRef] [Green Version]
- Wang, G.; Jiang, R.; Zhao, Z.; Song, W. Effects of ozone and fine particulate matter (PM2.5) on rat system inflammation and cardiac function. Toxicol. Lett. 2013, 217, 23–33. [Google Scholar] [CrossRef]
- Davel, A.P.; Lemos, M.; Pastro, L.M.; Pedro, S.C.; de Andre, P.A.; Hebeda, C.; Farsky, S.H.; Saldiva, P.H.; Rossoni, L.V. Endothelial dysfunction in the pulmonary artery induced by concentrated fine particulate matter exposure is associated with local but not systemic inflammation. Toxicology 2012, 295, 39–46. [Google Scholar] [CrossRef]
- Gent, J.; Triche, E.; Holford, T.; Belanger, K.; Bracken, M.; Beckett, W.; Leaderer, B. Association of low-level ozone and fine particles with respiratory symptoms in children with asthma. JAMA-J. Am. Med. Assoc. 2003, 290, 1859–1867. [Google Scholar] [CrossRef] [Green Version]
- Yorifuji, T.; Kashima, S.; Doi, H. Associations of acute exposure to fine and coarse particulate matter and mortality among older people in Tokyo, Japan. Sci. Total Environ. 2016, 542, 354–359. [Google Scholar] [CrossRef]
- Prihatno, A.T.; Nurcahyanto, H.; Ahmed, M.F.; Rahman, M.H.; Alam, M.M.; Jang, Y.M. Forecasting PM2.5 Concentration Using a Single-Dense Layer BiLSTM Method. Electronics 2021, 10, 1808. [Google Scholar] [CrossRef]
- Carnevale, C.; Turrini, E.; Zeziola, R.; De Angelis, E.; Volta, M. A Wavenet-Based Virtual Sensor for PM10 Monitoring. Electronics 2021, 10, 2111. [Google Scholar] [CrossRef]
- Mumtaz, R.; Zaidi, S.M.H.; Shakir, M.Z.; Shafi, U.; Malik, M.M.; Haque, A.; Mumtaz, S.; Zaidi, S.A.R. Internet of Things (IoT) Based Indoor Air Quality Sensing and Predictive Analytic—A COVID-19 Perspective. Electronics 2021, 10, 184. [Google Scholar] [CrossRef]
- Zheng, H.; Zhong, X.; Huang, W.; Jiang, K.; Liu, W.; Wang, Z. Visible-Infrared Person Re-Identification: A Comprehensive Survey and a New Setting. Electronics 2022, 11, 454. [Google Scholar] [CrossRef]
- Wang, Z.; Jiang, J.; Wu, Y.; Ye, M.; Bai, X.; Satoh, S. Learning Sparse and Identity-Preserved Hidden Attributes for Person Re-Identification. IEEE Trans. Image Process. 2020, 29, 2013–2025. [Google Scholar] [CrossRef]
- Wang, Z.; Jiang, J.; Yu, Y.; Satoh, S. Incremental Re-Identification by Cross-Direction and Cross-Ranking Adaption. IEEE Trans. Multimed. 2019, 21, 2376–2386. [Google Scholar] [CrossRef]
- Jiang, K.; Wang, Z.; Yi, P.; Chen, C.; Wang, G.; Han, Z.; Jiang, J.; Xiong, Z. Multi-Scale Hybrid Fusion Network for Single Image Deraining. IEEE Trans. Neural Netw. Learn. Syst. 2021, 1–15. [Google Scholar] [CrossRef]
- Jiang, K.; Wang, Z.; Yi, P.; Chen, C.; Wang, Z.; Wang, X.; Jiang, J.; Lin, C.W. Rain-Free and Residue Hand-in-Hand: A Progressive Coupled Network for Real-Time Image Deraining. IEEE Trans. Image Process. 2021, 30, 7404–7418. [Google Scholar] [CrossRef]
- Liu, C.; Tsow, F.; Zou, Y.; Tao, N. Particle Pollution Estimation Based on Image Analysis. PLoS ONE 2016, 11, e0145955. [Google Scholar] [CrossRef]
- Gu, K.; Qiao, J.; Li, X. Highly Efficient Picture-Based Prediction of PM2.5 Concentration. IEEE Trans. Ind. Electron. 2019, 66, 3176–3184. [Google Scholar] [CrossRef]
- Zhang, H.; Peng, D.; Chen, W.; Xu, X. Extremely efficient PM2.5 estimator based on analysis of saliency and statistics. Electron. Lett. 2019, 55, 30–31. [Google Scholar] [CrossRef]
- Yue, G.; Gu, K.; Qiao, J. Effective and Efficient Photo-Based PM2.5 Concentration Estimation. IEEE Trans. Instrum. Meas. 2019, 68, 3962–3971. [Google Scholar] [CrossRef]
- Sun, K.; Tang, L.; Qian, J.; Wang, G.; Lou, C. A deep learning-based PM2.5 concentration estimator. Displays 2021, 69, 102072. [Google Scholar] [CrossRef]
- Mittal, A.; Moorthy, A.K.; Bovik, A.C. No-Reference Image Quality Assessment in the Spatial Domain. IEEE Trans. Image Process. 2012, 21, 4695–4708. [Google Scholar] [CrossRef]
- Mittal, A.; Soundararajan, R.; Bovik, A.C. Making a “Completely Blind” Image Quality Analyzer. IEEE Signal Process. Lett. 2013, 20, 209–212. [Google Scholar] [CrossRef]
- Chen, Z.; Zhou, W.; Li, W. Blind Stereoscopic Video Quality Assessment: From Depth Perception to Overall Experience. IEEE Trans. Image Process. 2018, 27, 721–734. [Google Scholar] [CrossRef]
- Zhou, W.; Xu, J.; Jiang, Q.; Chen, Z. No-Reference Quality Assessment for 360-degree Images by Analysis of Multifrequency Information and Local-global Naturalness. IEEE Trans. Circuits Syst. Video Technol. 2021, 32, 1778–1791. [Google Scholar] [CrossRef]
- Shi, L.; Zhou, W.; Chen, Z.; Zhang, J. No-Reference Light Field Image Quality Assessment Based on Spatial-Angular Measurement. IEEE Trans. Circuits Syst. Video Technol. 2020, 30, 4114–4128. [Google Scholar] [CrossRef] [Green Version]
- Zhou, W.; Shi, L.; Chen, Z.; Zhang, J. Tensor Oriented No-Reference Light Field Image Quality Assessment. IEEE Trans. Image Process. 2020, 29, 4070–4084. [Google Scholar] [CrossRef]
- Sharifi, K.; Leon-Garcia, A. Estimation of shape parameter for generalized Gaussian distributions in subband decompositions of video. IEEE Trans. Circuits Syst. Video Technol. 1995, 5, 52–56. [Google Scholar] [CrossRef]
- Xia, Z. A robust photo-based PM2.5 monitoring method by combining linear and non-linear learning. IET Image Process. 2022, 16, 1000–1007. [Google Scholar] [CrossRef]
- Wang, G.; Shi, Q.; Wang, H.; Sun, K.; Lu, Y.; Di, K. Multi-modal image feature fusion-based PM2.5 concentration estimation. Atmos. Pollut. Res. 2022, 13, 101345. [Google Scholar] [CrossRef]
- Sun, K.; Tang, L.; Huang, S.; Qian, J. A photo-based quality assessment model for the estimation of PM2.5 concentrations. IET Image Process. 2022, 16, 1008–1016. [Google Scholar] [CrossRef]
- Wang, G.; Wang, Z.; Gu, K.; Jiang, K.; He, Z. Reference-Free DIBR-Synthesized Video Quality Metric in Spatial and Temporal Domains. IEEE Trans. Circuits Syst. Video Technol. 2022, 32, 1119–1132. [Google Scholar] [CrossRef]
- Gu, K.; Lin, W.; Zhai, G.; Yang, X.; Zhang, W.; Chen, C.W. No-Reference Quality Metric of Contrast-Distorted Images Based on Information Maximization. IEEE Trans. Cybern. 2017, 47, 4559–4565. [Google Scholar] [CrossRef] [PubMed]
- Gu, K.; Tao, D.; Qiao, J.F.; Lin, W. Learning a No-Reference Quality Assessment Model of Enhanced Images With Big Data. IEEE Trans. Neural Networks Learn. Syst. 2018, 29, 1301–1313. [Google Scholar] [CrossRef] [Green Version]
- Vu, P.V.; Chandler, D.M. A fast wavelet-based algorithm for global and local image sharpness estimation. IEEE Signal Process. Lett. 2012, 19, 423–426. [Google Scholar] [CrossRef]
- Gu, K.; Zhai, G.; Lin, W.; Yang, X.; Zhang, W. No-Reference Image Sharpness Assessment in Autoregressive Parameter Space. IEEE Trans. Image Process. 2015, 24, 3218–3231. [Google Scholar]
- Li, L.; Lin, W.; Wang, X.; Yang, G.; Bahrami, K.; Kot, A.C. No-Reference Image Blur Assessment Based on Discrete Orthogonal Moments. IEEE Trans. Cybern. 2016, 46, 39–50. [Google Scholar] [CrossRef]


| Model | |||
|---|---|---|---|
| SVR | 0.8411 | 0.8039 | 0.5883 |
| RF | 0.8385 | 0.7995 | 0.5717 |
| FNN | 0.8228 | 0.8241 | 0.6100 |
| Num. | Num. | ||||||
|---|---|---|---|---|---|---|---|
| 1 | 0 | NAN | NAN | 16 | 0.7932 | 0.7806 | 0.5594 |
| 2 | 0 | NAN | NAN | 17 | 0.1015 | 0.6048 | 0.4316 |
| 3 | NAN | NAN | NAN | 18 | 0.7953 | 0.7954 | 0.5869 |
| 4 | 0.1227 | 0.1799 | 0.1478 | 19 | 0.1293 | 0.6598 | 0.4590 |
| 5 | 0.1145 | 0.4200 | 0.3280 | 20 | −0.1206 | −0.3824 | −0.2900 |
| 6 | 0.8009 | 0.7962 | 0.5840 | 21 | 0.8070 | 0.8093 | 0.6006 |
| 7 | 0.1778 | 0.3257 | 0.2484 | 22 | 0.8012 | 0.7991 | 0.5897 |
| 8 | 0.0710 | 0.3443 | 0.2446 | 23 | 0.7883 | 0.8030 | 0.5984 |
| 9 | 0.0672 | 0.4975 | 0.3718 | 24 | 0.8035 | 0.8001 | 0.5890 |
| 10 | −0.1265 | −0.3282 | −0.2587 | 25 | 0.7821 | 0.7770 | 0.5587 |
| 11 | 0.7981 | 0.7926 | 0.5796 | 26 | 0.8290 | 0.8202 | 0.6027 |
| 12 | −0.1573 | −0.6926 | −0.5092 | 27 | 0.8112 | 0.7931 | 0.5688 |
| 13 | 0.3125 | 0.3008 | 0.2037 | 28 | 0.8228 | 0.8241 | 0.6100 |
| 14 | 0.7909 | 0.7867 | 0.5760 | 29 | 0.7999 | 0.7958 | 0.5897 |
| 15 | 0.7764 | 0.7817 | 0.5746 | 30 | 0.8130 | 0.7950 | 0.5767 |
| Method | Type | |||
|---|---|---|---|---|
| NIQMC | Contrast | 0.4229 | 0.4427 | 0.2966 |
| BIQME | Contrast | 0.5441 | 0.5375 | 0.3719 |
| FISH | Sharpness | 0.4687 | 0.4106 | 0.2784 |
| ARISM | Sharpness | 0.2990 | 0.2192 | 0.1472 |
| BIBLE | Sharpness | 0.1250 | 0.0802 | 0.0537 |
| PPPC | PM2.5 | 0.8115 | 0.8189 | 0.6078 |
| Ref. [22] | PM2.5 | — | 0.7823 * | 0.5809 * |
| Ref. [21] | PM2.5 | 0.8011 * | — | 0.6102 * |
| Ref. [33] | PM2.5 | 0.8082 | 0.8177 | 0.6115 |
| MSCN-Gray | PM2.5 | 0.3537 | 0.3840 | 0.2597 |
| Pro. (MSCN-Sat) | PM2.5 | 0.8228 | 0.8241 | 0.6100 |
Publisher’s Note: MDPI stays neutral with regard to jurisdictional claims in published maps and institutional affiliations. |
© 2022 by the authors. Licensee MDPI, Basel, Switzerland. This article is an open access article distributed under the terms and conditions of the Creative Commons Attribution (CC BY) license (https://creativecommons.org/licenses/by/4.0/).
Share and Cite
Wang, G.; Shi, Q.; Jiang, K. PM2.5 Concentration Measurement Based on Image Perception. Electronics 2022, 11, 1298. https://doi.org/10.3390/electronics11091298
Wang G, Shi Q, Jiang K. PM2.5 Concentration Measurement Based on Image Perception. Electronics. 2022; 11(9):1298. https://doi.org/10.3390/electronics11091298
Chicago/Turabian StyleWang, Guangcheng, Quan Shi, and Kui Jiang. 2022. "PM2.5 Concentration Measurement Based on Image Perception" Electronics 11, no. 9: 1298. https://doi.org/10.3390/electronics11091298
APA StyleWang, G., Shi, Q., & Jiang, K. (2022). PM2.5 Concentration Measurement Based on Image Perception. Electronics, 11(9), 1298. https://doi.org/10.3390/electronics11091298


