Article

Stability Analysis for Single-Lane Traffic with a Relay Controller in a Closed Loop

by
Monica Patrascu
1,2,3,* and
Vlad Constantinescu
1,4
1
Complex Systems Laboratory, Department of Automatic Control and Systems Engineering, University Politehnica of Bucharest, 060042 Bucharest, Romania
2
Centre for Elderly and Nursing Home Medicine, Department of Global Public Health and Primary Care, University of Bergen, 5009 Bergen, Norway
3
Neuro-SysMed Center, Department of Global Public Health and Primary Care, University of Bergen, 5009 Bergen, Norway
4
Institute of Space Science, 077125 Magurele, Romania
*
Author to whom correspondence should be addressed.
Electronics 2023, 12(1), 5; https://doi.org/10.3390/electronics12010005
Submission received: 27 November 2022 / Revised: 13 December 2022 / Accepted: 15 December 2022 / Published: 20 December 2022
(This article belongs to the Collection Predictive and Learning Control in Engineering Applications)

Abstract

:
Rule-based relay controllers are common in single-lane urban traffic control systems and introduce significant nonlinearity. In this paper, we analyze the closed-loop stability for a traffic process with a relay controller and negative feedback, with respect to several time delays present in the plant. First, we derive models for the road segment and the controller. Second, we investigate the system stability based on describing the function analysis. Finally, we present the numerical results.

1. Introduction

Transportation systems, and in particular urban traffic systems, are still attracting interest [1]. Advanced traffic management systems aim to improve traffic [2] by reducing congestion and thus avoid traffic-related delays. An urban traffic network is highly irregular but not random, and it has a nontrivial topology. Due to its nature, decentralized approaches can offer good traffic monitoring and management [3]. While open-loop implementations that make use of preset sequences of traffic lights are standard, real-world closed-loop implementations in urban areas have not been as popular.
To optimize traffic flow, adaptive traffic signal control algorithms make use of sensor data to actively adapt traffic light signals to the variations in vehicle flow. The Sydney Coordinated Adaptive Traffic (SCAT) system [4] was implemented in 1979 in Sydney and reduced the travel time, number of accidents, fuel consumption and air pollution. The split, cycle and offset optimization technique (SCOOT) [5] was implemented in Glasgow and Coventry, and its introduction lead to a reduction in vehicle travel times. The Real-Time, Hierarchical, Optimized, Distributed, and Effective System (RHODES) framework for traffic control [6] presents the design of a hierarchical control architecture able to respond to changes in traffic behavior. The hierarchical nature of RHODES allows it to control traffic from the network level down to single intersections. The ACS-Lite architecture [7] aims to apply adaptive control algorithms to closed-loop traffic control systems, thus extending the possibilities of existing traffic-responsive systems. Optimization Policies for Adaptive Control (OPAC) [8] is a demand-responsive traffic control system at the intersection level which employs dynamic programming algorithms to optimize the traffic flow through an intersection based on the queue length on the roads entering it. In Japan, the Universal Traffic Management System (UTMS) [9] has three main subsystems: traffic signal control, traffic information service, and traffic data acquisition. To maintain a small implementation budget, the system uses low-cost infrared detectors that can provide information about the number of vehicles and lane occupancy. Parts of the system (e.g., integrated traffic control systems (ITCSs), advanced mobile information systems (AMISs), and the Help system for Emergency Life saving and Public safety (HELP)) have already been implemented in all prefectures of Japan, and they help reduce traffic accidents and pollution as well as fuel consumption [10].
Platoon-level research investigates configurations [11] and robust control [12] but does not account for the nonlinearities introduced by traffic lights. Optimization of traffic light configurations [13] has been studied, focusing on the optimization of traffic control periods. Recently, an increase in traffic research dealt with freeways and highways [14,15,16], but the traffic models for freeways and urban roads are not interchangeable. Further modeling attempts [17] showed promising opportunities for more formal control approaches in the near future. The stability of macroscopic traffic flow models was addressed in [18], with a focus on the propagation of traffic flow perturbations and shock waves. The authors of [19] studied the effects of perturbations on the stability of traffic flow. However, closed-loop stability and its associated robustness have yet to be discussed for road segments of crowded urban areas with respect to the nonlinear components, mainly relay controllers and traffic light actuator behavior. In [20], a stability analysis was carried out for a particular type of macroscopic traffic model with the purpose of designing an optimal controller. Analysis of rule-based or on-off control laws in a closed loop at the mesoscopic level is still elusive.
In [21], we performed a stability analysis in open and closed loops (with a predictor-based controller) for a single-lane road segment using the Hurwitz criterion. The multiple time delays present in the traffic process show high sensitivity to loop stability. However, the Hurwitz method applies to continuous, linear controllers, while on-off control laws (green-red phase switching) require approaches suitable for nonlinear systems. We base this paper on the preliminary arguments we made in [22]. The main contributions of this paper are a model for the single-lane road segment on which a platoon of vehicles travels, models for a relay controller and a traffic light with green-red phases, and stability analysis (and subsequent conditions for stability) of a single-lane road segment with a relay controller that is situated in a fully decentralized control system for urban traffic. As opposed to adaptive control schemes [23], in which the focus are intersections (nodes in the complex traffic network), we analyze individual road segments (edges). Thus, we consider a modified actuator control [23] with variable-time traffic light phases.
This paper is organized as follows. In Section 2, we present the control system configuration, including plant and controller models. In Section 3, we describe the stability conditions for the single-lane control system. Section 4 includes an example, while Section 5 is dedicated to discussion. The paper ends in Section 6 with the conclusions and remarks for further study.

2. Control System Configuration

2.1. Context: The Decentralized Traffic Network

As a complex system, the global objective of the traffic network (i.e., maintain traffic fluidity) can be achieved through emergence from autonomous local control of network components. We demonstrated this effect in [24], where traffic lights switched based on the maximum load on all input edges of each node (local control objective asked to maintain smallest relative load on each lane). There, we performed a preliminary performance analysis using an agent-based simulation model (as a generative experiment [25]) and determined that not only were the local control loops sensitive to variations in priority thresholds, but the network was also sensitive to variations in the traffic light phase. Under certain conditions, the network reached equilibrium in a stable state.
Consider a road network N comprising intersections I j ( j = 1 : p ) as nodes and road lanes S i ( i = 1 : q ) as edges. In this study, we define a single-lane road segment as the portion of an urban road comprising one lane delimited by two intersections (the start and end). Moreover, consider the controllers as relay laws switching traffic light signals between red and green with predefined phase durations. For this network, fully decentralized control represents a non-cooperative problem, in which a set of relay controllers R i ( i = 1 : q ) is assigned one to one for each lane. Figure 1 illustrates the structure of the decentralized traffic network with relay controllers.
The local objective of each loop is to avoid congesting its own road segment. This is not a problem of balancing the node load but balancing the edge load. In this paper, we focus on the performance of local edge controllers in a closed loop. In particular, we look at the local stability, which we have shown in [26] affects the steady state of the complex network.

2.2. Dynamics of Vehicles as a String of Traffic Participants

One widely used model of vehicle interaction in traffic is the platoon dispersion model [27], which describes vehicles traveling in a row and the way their independent movement causes the stretching or contraction of the string they form (Figure 2). The platoon dispersion model manages to integrate the decisional autonomy of each driver while on the road. In this context, the platoon model serves to study the movement of a string of vehicles as it passes through a road segment and the delays and dynamics introduced by driver reaction to traffic changes. Moreover, the model can provide a natural frequency domain representation that makes it usable in the design and analysis of traffic control systems.
The platoon behavior [27] is given by the following discrete form (with notations from [21]):
q t = F q t τ m + ( 1 F ) q t Δ t ,
where the model input q t τ m is the vehicle flow of the initial platoon as it passes the first observation point (i.e., the upstream traffic signal at the beginning of a road segment) at time t τ m , the output q t is the vehicle flow of the platoon after time t as it passes the second observation point (i.e., the downstream traffic signal at the end of the road segment), Δ t is the sampling time, and τ m is the minimum time for a vehicle to travel the length of the segment. In [27], F is a smoothing factor ( F = 1 / ( 1 + 0.5 τ m ) ) and τ m = 0.8 T a , where T a is the average journey duration over a predetermined distance. In later research [28], the parameters of the model were studied for generalization, obtaining τ m = β T m e a n and F = 1 / ( 1 + α τ m ) , where T m e a n is the average travel time between two observation points and α and β are calibration constants.
We can now extract a model of the vehicle flow over one lane of a road segment with input X i n ( s ) representing the entering vehicle flow and output X o u t ( s ) representing the exiting vehicle flow, by converting Equation (1) to the continuous domain and then applying a Laplace transform (with the notation T = 1 / F ):
G ( s ) = X o u t ( s ) X i n ( s ) = e τ m s T s + 1 .

2.3. Road Segment Model

The input flow X i n ( s ) of the single-lane road segment is formed by composing all vehicle flows incoming from the other road segments connected to the start intersection. The output flow X o u t ( s ) feeds into the end intersection (and other segments from there).
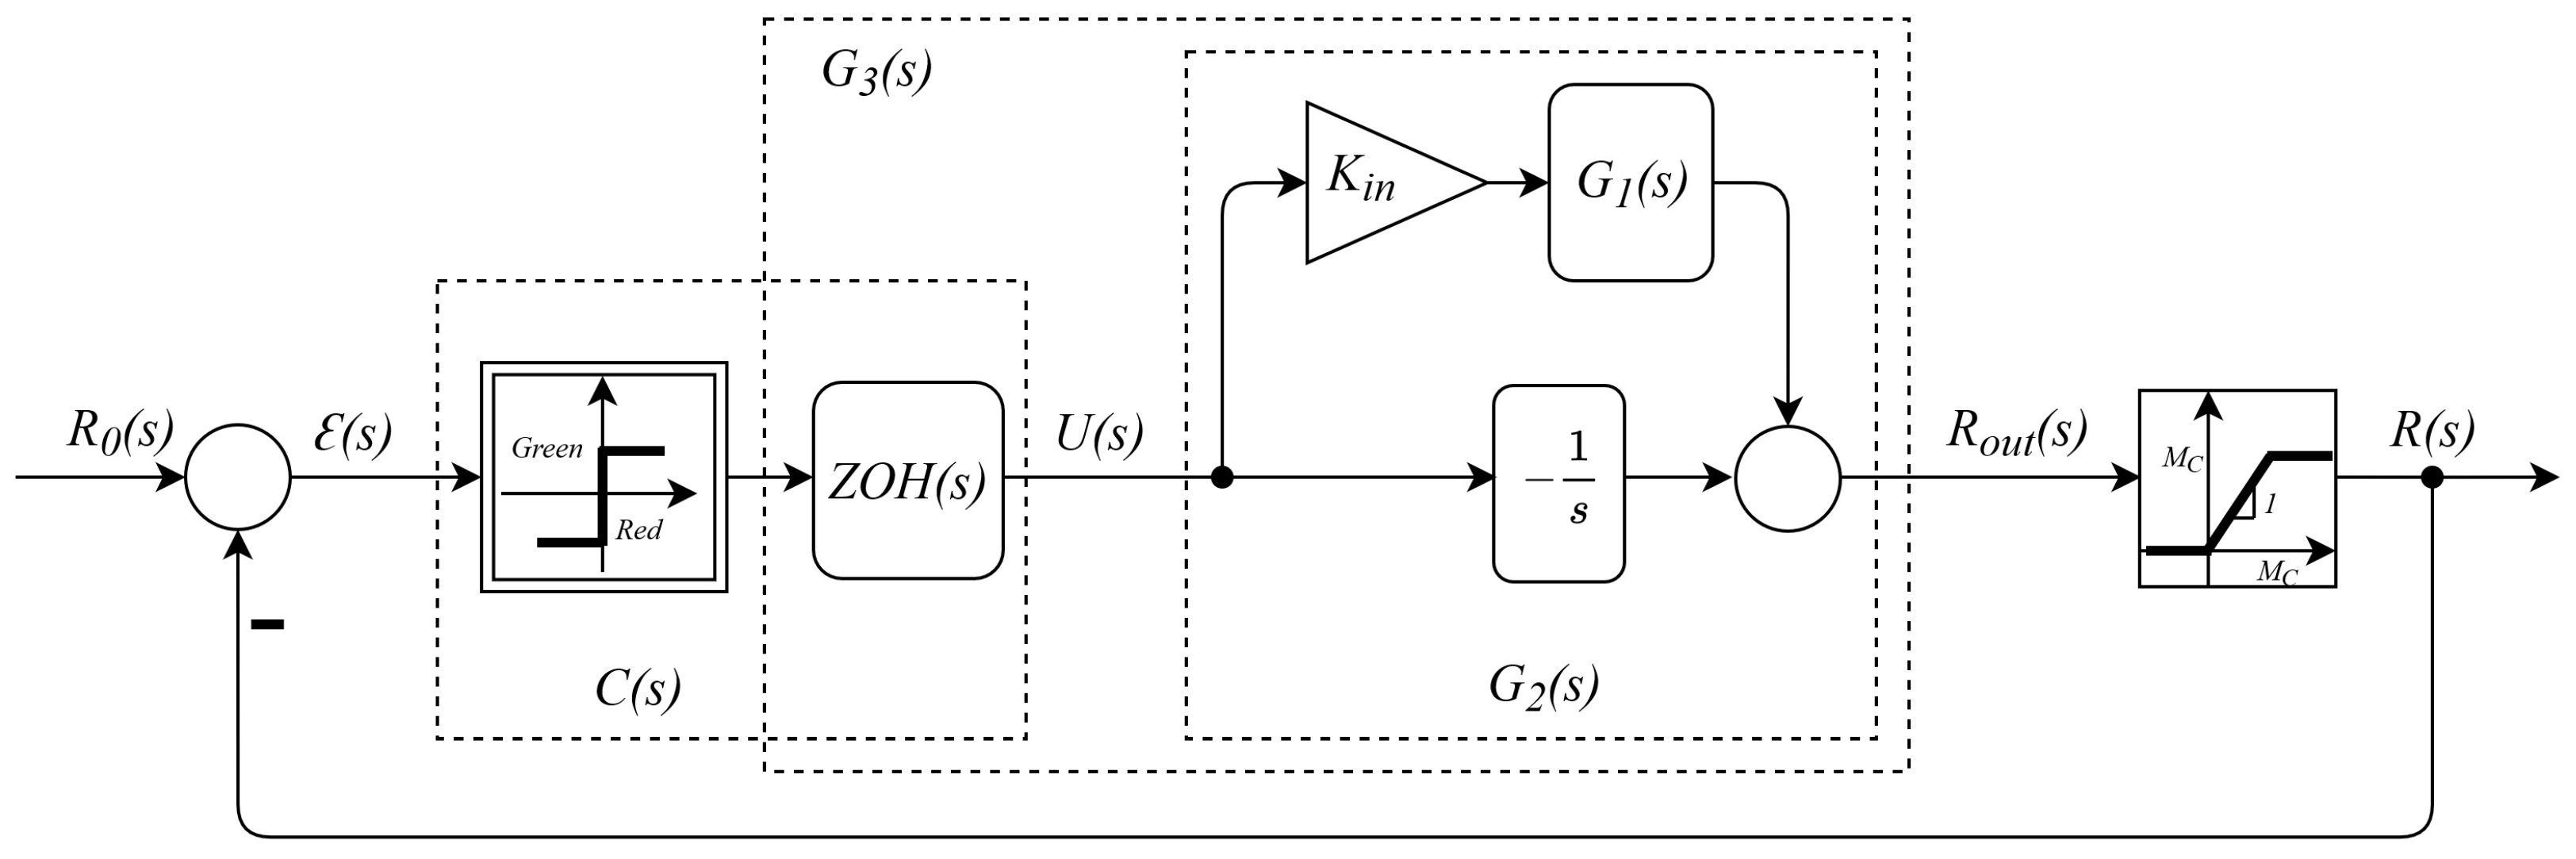
The purpose of the control system discussed in this paper is to maintain a prescribed vehicle load on a road segment in a traffic network. To reflect this, we need to expand the dispersion model (which is concerned only with the movement of the vehicles). Figure 3 illustrates the proposed model, with the output R ( s ) being the vehicle load (i.e., the difference between the number of entering and exiting vehicles). Let R o u t ( s ) = X i n ( s ) / s X o u t ( s ) / s . We can determine that
G 1 ( s ) = R o u t ( s ) X i n ( s ) = 1 G ( s ) s = T s + 1 e τ m s s ( T s + 1 )
where τ m is the minimum travel time for the segment and T = 1 + α β T m e a n is dependent on the mean travel time per segment, with α = 0.5 and β = 0.8 [27].
The model requires the inclusion of a saturation element to illustrate that the segment is finite, where M C is the maximum number of vehicles that can fit on the segment, obtained from the road segment length over the average vehicle length.

2.4. Closed-Loop Structure for the Single-Lane Road Segment

The plant is a single-lane road segment with a moving platoon of a variable length. The plant inputs are the traffic light signals as commands and the incoming vehicle flow as the disturbance, while the controlled plant output is the vehicle load.
Consider a road segment as in Figure 2, where the platoon moves from west to east. The input flow of vehicles X i n ( s ) comprises all incoming flows from the road segments connected to the start of the intersection. The output flow X o u t ( s ) comprises the vehicles leaving the segment. The sensor S is installed at the beginning of the road segment and counts vehicles, assigning them priorities based on type (regular participants or emergency vehicles). The actuator TL is a traffic light mounted at the end of the road segment and has two states: red for no exit and green for exit.
The controller is a relay element providing two command values for each state of the TL: red or green. The TL phase τ c is the amount of time the traffic light maintains its color and is determined by the average time required by a vehicle or a set of vehicles to exit the road segment (i.e., to pass through the end intersection). This delay is necessary because vehicles do not move instantaneously through the world. This introduces a zero-order hold (ZOH) element in the control loop, with the hold duration equal to the minimum TL phase τ c :
Z O H ( s ) = 1 e τ c s s τ c .
The control system structure is illustrated in Figure 4, where R 0 is the prescribed number of vehicles on the road segment (i.e., desired load). The control loop is not standard due to the specificities of the controlled plant and the locations of the sensing and actuating elements.
The input flow X i n ( s ) is measured in vehicles per unit of time. Here, the unit of time is τ , which is the time necessary for one vehicle to enter the road segment. In this case, it is equivalent to the average duration for one vehicle to pass through an urban intersection (e.g., 5 s). Of course, τ c τ .
The segment outputs one vehicle per τ but receives K i n = n / τ vehicles. In an ideal, fully synchronized network with non-empty segments, n is equal to the number of incoming flows (i.e., the segment would receive vehicles during the green phase). In the anti-synchronized case, the segment receives vehicles while releasing none. Figure 5 shows an example of this behavior, in which we can see the rapid filling of the segment during red lights. In reality, the phases of different segments overlap, and for unsynchronized input flows, n takes fractional values.
Thus, the plant model comprises G 2 ( s ) and the saturation element, where
G 2 ( s ) = R o u t ( s ) U ( s ) = K i n G 1 ( s ) 1 s = ( T s + 1 ) ( K i n 1 ) K i n e τ m s s ( T s + 1 ) .
We also integrate a priority system into the analysis. Let the emergency vehicle priority be E P 0 . Thus, regular vehicles each add one to the signal R ( t ) , while an emergency vehicle adds E P to the signal R ( t ) .

2.5. Controller Model

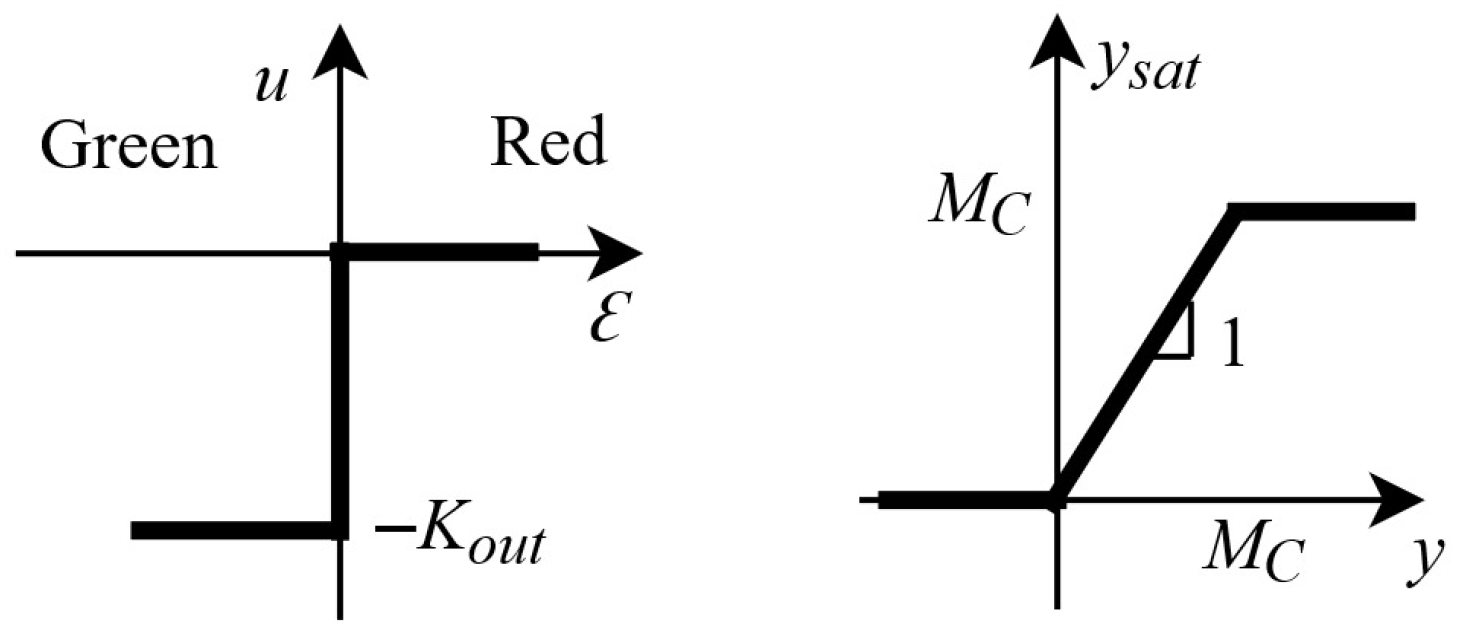
Let ε ( t ) = R 0 ( t ) R ( t ) be the control deviation (with R 0 as the setpoint and R as the plant output, as in Figure 4) and u ( t ) be the command. We begin with modeling the two command values that switch between the traffic light states. Let the green command be u ( ε ) = 1 (one vehicle is released), and let the red command be u ( ε ) = 0 (no vehicle is released). The relay rule dictates that (Figure 5)
if ε ( t ) < 0 , then u ( ε ) = 1 else u ( ε ) = 0 ,
Next, we integrate the TL phase duration into the controller (i.e., duration of green or red lights) using the ZOH behavior, during which the command value is maintained for τ c [s]. The TL phase τ c must allow for at least one vehicle to leave the segment, and therefore τ c belongs to a discrete natural set. When the TL phase increases, it needs to allow an integer for the number of vehicles to pass through, as the segment cannot release fractions of vehicles. We can thus obtain a generalization of the controller model, given that the number of vehicles released during a green light is proportional to the TL phase duration. For K o u t = τ c / τ , the controller relay rule becomes
if ε ( t ) < 0 , then u ( ε , τ c ) = K o u t else u ( ε , τ c ) = 0 ,
This contraction lets us move the delay caused by the ZOH element to the linear part of the loop and gives us a controller for which a critical (law-regulated) variable (the TL phase) is integrated into the nonlinearity.
The linear component becomes G 3 ( s ) = Z O H ( s ) · G 2 ( s ) .
Since the TL phase is not a parameter that varies with the controller (it is chosen a priori or is only modified twice a day depending on traffic peak hours), the time dependency is eliminated, and the nonlinearity can be considered static.

3. Stability Analysis

For a single-lane road segment with on-off control and traffic light with two phases (green and red), we derive the stability conditions using the describing function method for nonlinear control systems:
Theorem 1. 
Single-Lane Relay Control Stability Conditions. Let a closed-loop control system for a single-lane road segment with a relay controller and a green-red traffic light, described by Equation (7) and G 3 ( s ) , have n input flows, a gain margin G m , and a phase margin P m . Let τ c > 0 be the minimum traffic light phase and τ > 0 be the average travel time of a vehicle through an intersection. Let E P 0 be the priority of emergency vehicles on the road segment and R 0 [ 0 , M C ] be the desired number of vehicles on the segment with a maximum capacity M C . The stability conditions for the closed loop are
G m R 0 τ + τ c ( n + E P ) > 8 π τ c G m > 1 and P m > 0 .
Proof. 
The closed-loop system comprises linear and nonlinear elements (Figure 6) with delays. To determine the closed-loop stability conditions, we analyze the limit cycles of the system using a Nyquist plot (for the linear components) and the describing function (for the elementary nonlinearities).
The sinusoidal-input describing function (DF) is, in this case, a frequency response linearization of the nonlinear element [29] for inputs e ( t ) = A sin ( ω t + θ ) , where A and ω are the amplitude and frequency, respectively, with a phase θ [ 0 , 2 π ] .
For a memoryless (non-hysteretic) static nonlinearity φ ( e ) and A , ω > 0 , the DFs (symmetric and asymmetric) are
N s y m ( A ) = 2 π A π / 2 π / 2 φ ( A , sin θ ) sin θ d θ N a s y m ( A ) = 4 π A 0 π / 2 φ ( A , sin θ ) sin θ d θ .
The two nonlinearities are N C ( A ) , as described by Equation (10), for the symmetric controller u ( ε ) (with τ c constant), and N S ( A ) , as described by Equation (11), for the asymmetric saturation y s a t ( y ) (with a slope of 1 and M C being constant):
N C ( A ) = 4 K o u t π A ,
N S ( A ) = 4 π A arcsin M C A + M C A 1 M C A 2 .
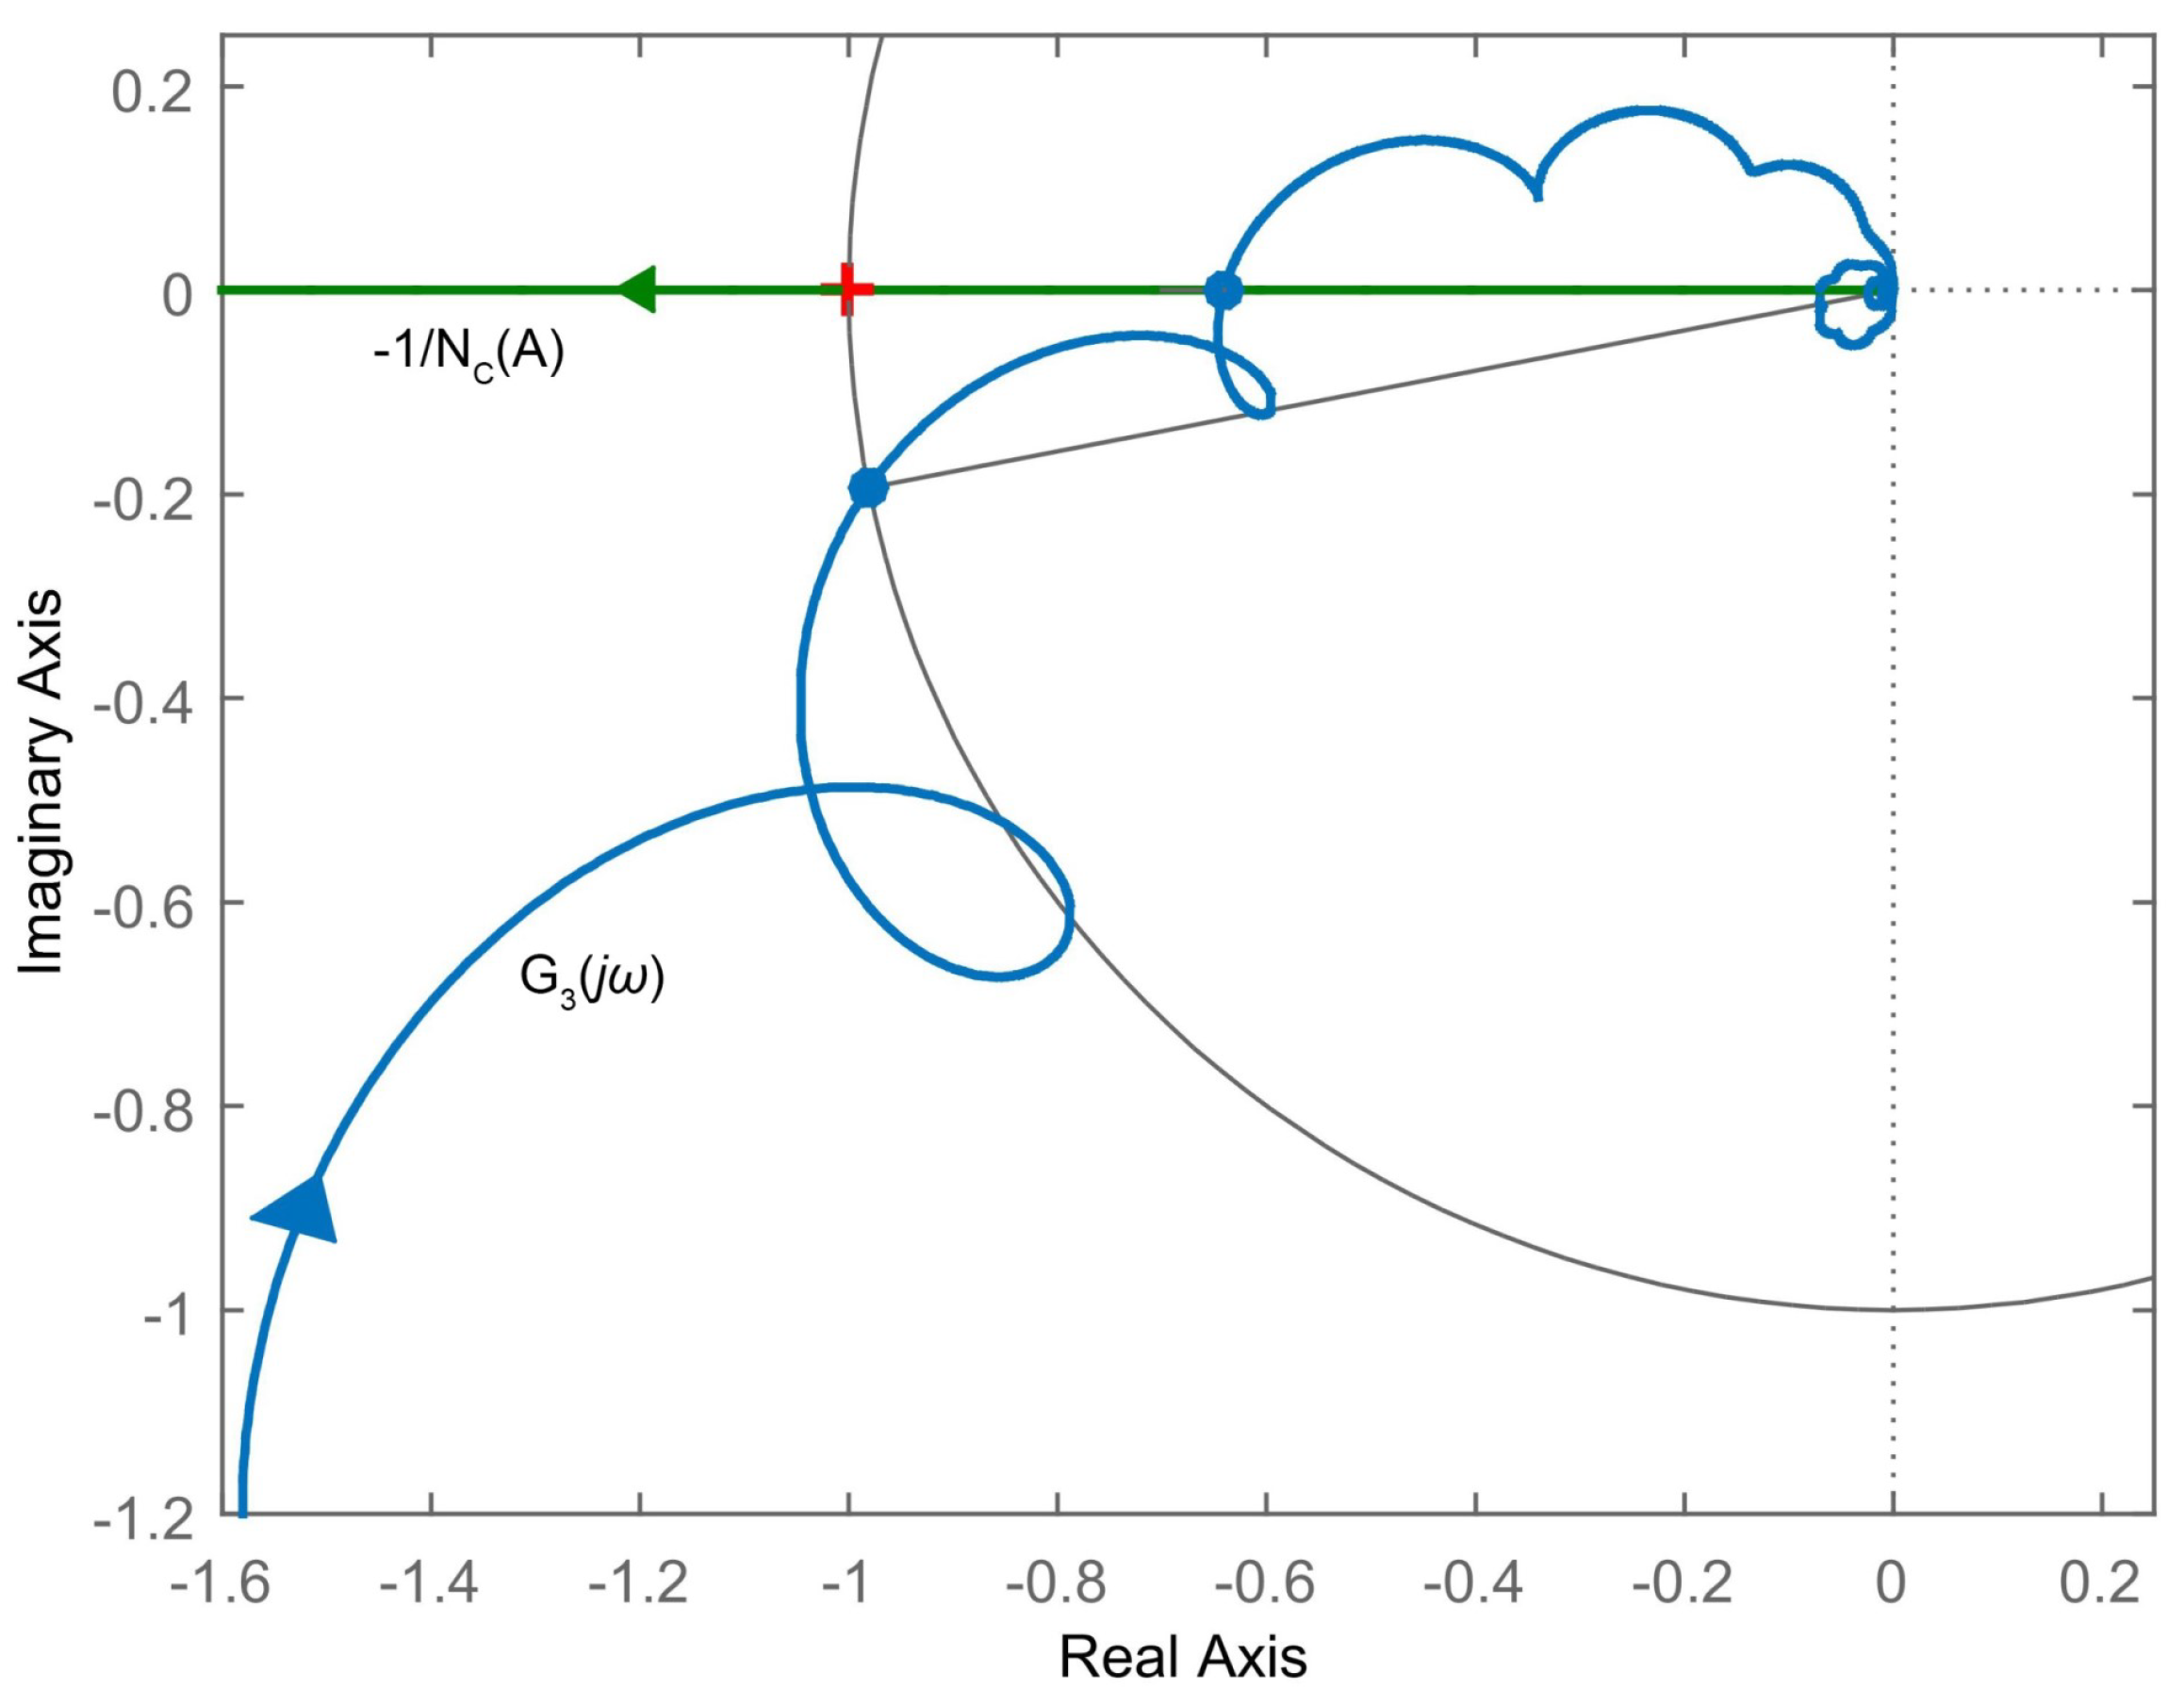
The frequency response of the linear component G 3 ( s ) is given by G 3 ( j ω ) , with a Nyquist plot similar to the one depicted in Figure 7. The minimum stability conditions for the linear component require that the gain and phase margins ( G m and P m , respectively) are positive ( G m > 1 if not in decibels). Of special interest is G m = 1 / | G 3 ( j ω π ) | with ( G 3 ( j ω π ) ) = 0 .
Graphical limit cycle analysis determines the stability of a closed-loop system comprising both linear and elementary nonlinear parts by placing a Nyquist plot and a DF on the same plane [30]. The limit cycles describe periodic oscillations of the closed-loop system around various static operating points, defined by the solutions of the balance equation (for static and memoryless nonlinearities)
1 + H ( j ω ) N ( A ) = 0 ,
for a linear component H and a describing function N. Thus, the intersection between H ( j ω ) and 1 / N ( A ) can indicate the presence of a limit cycle.
In this study, the stability criterion using DF that extends the Nyquist criterion assumes the following: (1) there is one nonlinearity (the controller, since we disregard the saturation, as explained below), (2) the nonlinear element is static, odd, and memoryless, and (3) the linear components dampen high frequencies. Some remarks can be extracted from graphical limit cycle stability analysis in practice [29,30,31]:
Remark 1. 
A limit cycle on 1 / N ( A ) is stable if it is situated to the left of H ( j ω ) and if the Nyquist plot of H ( j ω ) is situated to the right of the critical point ( 1 , j 0 ) .
Remark 2. 
A closed-loop control system is stable for all limit cycles on 1 / N ( A ) to the left of H ( j ω ) .
Remark 3. 
A limit cycle with an amplitude A 0 is stable if the 1 / N ( A ) amplitude decreases for input amplitudes A > A 0 and the amplitude increases for input amplitudes A < A 0 . In other words, the stable limit cycles are the ones on 1 / N ( A ) that are not encircled by the Nyquist curve.
For the particular case of the closed-loop traffic control system, 1 / N S ( A ) is overlaid onto the real negative axis starting at ( 1 , j 0 ) , and even when combined with the relay, it will not intersect G 3 ( j ω ) due to the stability conditions of the linear component. Since we must avoid saturating the segment, we analyze the system below the saturation limit.
The DF of the controller, however, is overlaid onto the entire real negative axis. 1 / N C ( A ) intersects G 3 ( j ω ) as many times as G 3 ( j ω ) intersects the real negative axis. Given the minimum Nyquist stability conditions for the linear system as well as Remarks 2 and 3, we must look at the leftmost intersection between 1 / N C ( A ) and G 3 ( j ω ) (Figure 7) in | G 3 ( j ω π ) | = 1 / G m , which leads to: A 0 = 4 K o u t / ( π G m ) .
According to Remark 2, the closed-loop control system is stable for all nonlinearity input amplitudes A that satisfy
A > 4 K o u t π G m ,
The controller input is the deviation | ε | = | R 0 R | and is directly affected by the variations in the plant output R. The plant output R’s oscillations are given during a traffic light phase τ c by the incoming vehicles K i n = n / τ minus the outgoing vehicles K o u t = τ c / τ plus the priority addition of emergency vehicles E P 0 :
R = n τ + E P τ τ c τ .
The amplitude of the input oscillations becomes
A = 1 2 τ R 0 τ n E P + τ c ,
which leads to Equation (8). □

4. Case Study

For the case study in this section, we considered the following numerical values: length of segment L = 500 m, average space occupied by vehicle in the platoon (including the legal minimum distance between vehicles) v L = 6 m; minimum vehicle speed v m i n = 5 km/h, and maximum vehicle speed v m a x = 50 km/h. For these values, we computed the following: the maximum number of vehicles on segment M C was 83 vehicles, the mean travel time T m e a n was 162 s, giving T 7.5 s, and the minimum travel time for the segment τ m was 36 s.

4.1. Time Response

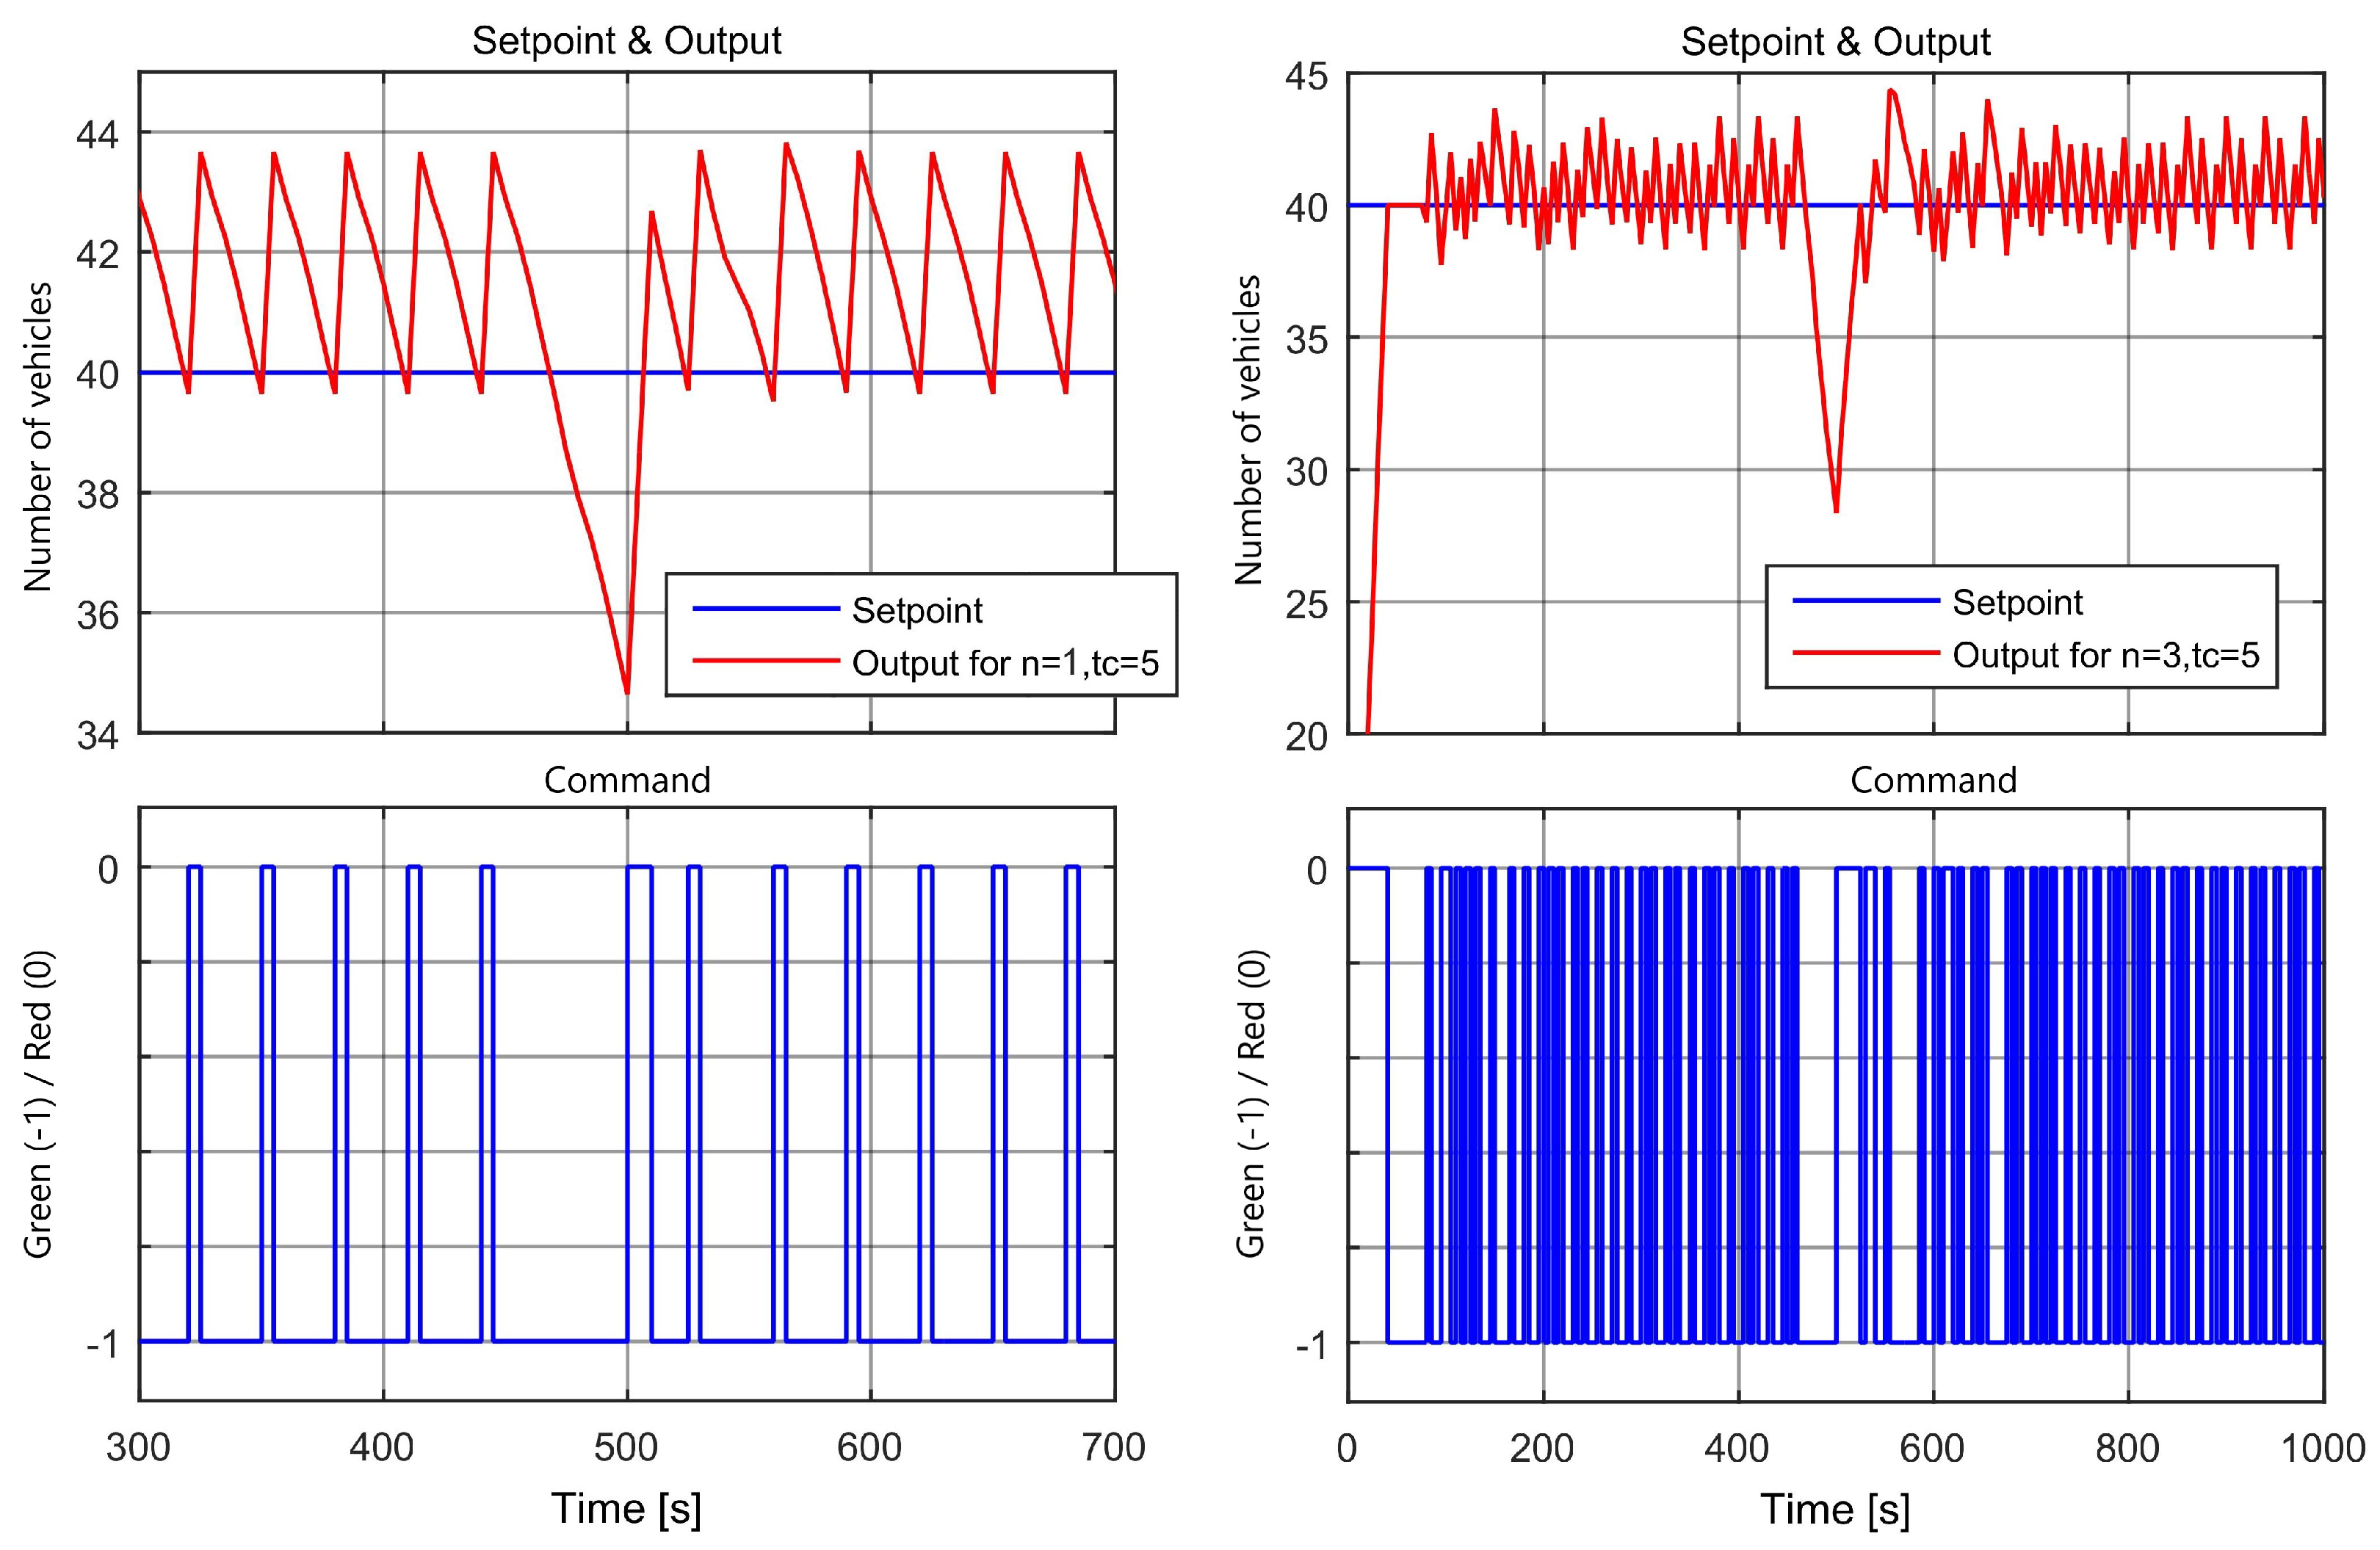
Figure 8 presents the relevant sections from the outputs of two scenarios simulated over a period of 1000 s, with n = 1 and n = 3 input segments. The TL phase was τ c = 5 s, the desired road occupancy was R 0 = 40 vehicles, and the emergency vehicle priority was very high at E P = 50. An emergency vehicle appears at the moment at 460 s. The behavior of the closed-loop system presented oscillations. For the n = 3 case, the traffic light phases switched frequently, which implies that a Zeno-like phenomenon [32] could be hiding in the traffic control network at a time scale congruous to the time unit of the traffic system.
Table 1 presents a selected set of results for various values of n, τ c , desired occupancies R 0 , and emergency vehicle priorities E P . The effect of an emergency vehicle is considerable because the controller interprets its presence as a sudden addition of E P vehicles, which can cause a longer green duration, and thus the segment empties and remains empty for a while. The risk here is that the vehicles moving out could cause congestion in one of the neighboring road segments.
The values of n > 3 simulate a situation where the input flow of vehicles is performed with a different green phase, such as when the controller of the road segment spilling into the start intersection is working and maintaining a longer green phase than the controller of the loop being analyzed. The system is sensitive to the combinations of parameters K i n = n / τ and E P .

4.2. Frequency Response and Stability Conditions

We studied the road segment for varying the n and τ c values. Table 2 presents a series of gain, phase, and delay margins and the check of the stability condition selected from a few hundred simulations. The values for the integer n depict synchronized traffic flow, while the fractional values emulate unsynchronized releases of vehicles into the start intersection by the surrounding control loops. Figure 9 illustrates a selection of Nyquist plots for G 3 ( s ) , corresponding to the marked lines in Table 2, with three stable cases and three unstable cases.
The gain margin was rather small overall, decreasing for large traffic light phase durations and large intersections. In the closed loop, the stable cases were those with high E P values, while the behavior without disturbance could become closed loop stable for certain values of the setpoint R 0 > 0 .

4.3. Network Example

We analyzed the responses of four single-lane segments connected in a network configuration as in Figure 10. Segment A had the properties described at the beginning of Section 4, while for the other segments, the following parameters differed. For B, τ m = 72 s and τ c = 10 s, while for C, τ m = 54 s, and for D, τ m = 18 s. For the setpoints, R 0 = 40 for A, B, and C, and R 0 = 20 for D. Two emergency vehicles with E P = 50 appeared on segments A and C at the moments at 460 s and 260 s, respectively. Figure 10 shows the time responses of the four segments.

5. Discussion

In this paper, we derived stability conditions for a single-lane road segment in a closed loop with a green-red traffic light actuator.
The setpoint R 0 had only positive values between 0 and M C , and its variation affected the control deviation | ε | = | R 0 R | . In Equation (8), this value adds to the left-hand side of the first condition. Larger setpoints increased the oscillation amplitudes of the controller input, while smaller setpoints did not contribute significantly. A balanced oscillation of the output (road occupancy) within the saturation limits was most likely to occur at around a 50% setpoint occupancy.
One stability robustness measure that holds particular interest is the delay margin. Considering the case in which τ c = τ (i.e., the TL phase is the smallest realistically possible), it is useful to know how much more delay the system can take before it becomes unstable [33]. For the plant analyzed here, extra delays were caused by variations in the time necessary for a vehicle to pass through the segment and by increasing the traffic light phase or reaction time (duration necessary for a vehicle to exit the end intersection). Thus far, we have been using the average measures for these delays, but they are variable with each vehicle. When considering G ˜ 3 ( s ) as the linearized version of G 3 ( s ) for which τ c = τ , the delay margin D m at the stability limit is
G ˜ 3 ( j ω c ) e j ω c D m = 1 | G ˜ 3 ( j ω c ) | = 1 .
This measure can be added to the conditions in Equation (8) to analyze the possible effects variations in human behavior can have in traffic, answering questions such as the following: (a) Are slow drivers affecting waiting times, or (b) would the current segment be affected by having to wait for an emergency vehicle to pass through the end intersection of a different segment? In case (a), the variable τ increases, and the platoon dynamics change, while in case (b), it is τ c which is affected, since the red light duration increases due to a disturbance on another segment.
For the case study in Section 4, the delay margin does not generally allow for a lot of uncertainty. There are no combinations of incoming traffic and TL phase durations that can provide stability with a large delay margin. This means that the system is not robust to driver reaction delays. The movement of the platoon is paramount for fluidity in the traffic network, and a relay controller gives little leeway when it comes to compensating human-introduced delays. For this, we suggest predictor-based controllers, the first of which we designed in [21].
The time response performance analysis presented in Section 4 revealed that the closed loop control system could be sensitive to variations in τ , but it responded relatively well to the presence of emergency vehicles. The former was expected, but the latter signifies that we must carefully choose the degree of occupancy we want to maintain on the road segments of the traffic network. A value of R 0 that is too small causes flickering of the traffic lights such that only one vehicle is able to exit at a time. Furthermore, a larger R 0 value may lead to congestion. Both situations cause inconvenience for the traffic participants and are undesirable. Since the road segments are interconnected, the desired occupancy R 0 must take into account spillage from neighboring intersections. For various input flows vs. TL phase configurations, the system can become unstable. However, as long as we limit the output oscillations, we can make sure the closed-loop system is stable. On the one hand, it is clear that quick switches between green and red lights are damaging to the control system, which implies a Zeno-like phenomenon [32] might be hiding at a time scale congruous to the time unit of the traffic system.
Concerning the performance of single-lane road segments in a network (Figure 10), as long as the local loops are stable, disturbances are mitigated and do not affect subsequent segments. It is therefore of interest to pursue further investigation into the network stability and performance as a whole.
Overall, these indicators can help with the design of more robust control systems. While the current type of traffic control system behaves at least adequately in an open loop, its stability is fragile in a closed loop. Further attention should be dedicated to improving the design of closed loop controllers for this peculiar plant.
Closed-loop systems for single-lane road segments with relay controllers are sensitive to variations in traffic and driver behavior, as well as reactions to emergency vehicles. The analysis we performed in this paper revealed a sort of frailty in the stability of these systems. The graphical analysis method based on describing functions has some limitations regarding the precision of limit cycle discovery, but we can find an incipient assessment of the areas in which the closed-loop system is most likely to be stable, and with the use of additional robustness measures, such as the delay margin, we can determine within a degree of confidence the chances of instability occurring.

6. Conclusions

In this study, we developed a set of models for the plant and a controller of a control system for a single-lane road segment, and we used these abstractions to analyze the closed-loop stability. A series of minimum stability conditions were extracted using limit cycle analysis under various working conditions.
For future work, of concern are hysteretic controllers, the analysis of the road network itself to discover dependencies and inter-influences between local loops (i.e., the multi-variable approach), and of course the effect of platoon interactions between multiple lanes per segment. Down the road, heterogeneity in types of controllers will come into play, which would ultimately allow for a more precise definition of nonlinearity boundaries so that the Popov criterion can be applied.

Author Contributions

All authors contributed equally to this work. Conceptualization, methodology, validation, formal analysis, visualization, writing—review and editing, M.P., V.C. All authors have read and agreed to the published version of the manuscript.

Funding

This research received no external funding.

Acknowledgments

The authors would like to thank Cristian Oară and Tudor C. Ionescu for their valuable feedback.

Conflicts of Interest

The authors declare no conflict of interest.

References

  1. Figueiredo, L.; Jesus, I.; Machado, J.T.; Ferreira, J.R.; De Carvalho, J.M. Towards the development of intelligent transportation systems. In Proceedings of the 2001 IEEE Intelligent Transportation Systems Proceedings, Oakland, CA, USA, 25–29 August 2001; pp. 1206–1211. [Google Scholar]
  2. Psaraki, V.; Pagoni, I.; Schafer, A. Techno-economic assessment of the potential of intelligent transport systems to reduce CO2 emissions. IET Intell. Transp. Syst. 2012, 6, 355–363. [Google Scholar] [CrossRef]
  3. Ferreira, E.D.; Subrahmanian, E.; Manstetten, D. Intelligent agents in decentralized traffic control. In Proceedings of the 2001 IEEE Intelligent Transportation Systems Proceedings, Oakland, CA, USA, 25–29 August 2001; pp. 705–709. [Google Scholar]
  4. Sims, A.G.; Dobinson, K.W. The Sydney coordinated adaptive traffic (SCAT) system philosophy and benefits. IEEE Trans. Veh. Technol. 1980, 29, 130–137. [Google Scholar] [CrossRef]
  5. Hunt, P.; Robertson, D.; Bretherton, R.; Winton, R. SCOOT—A Traffic Responsive Method of Coordinating Signals; Transport and Road Research Laboratory: Wokingham, UK, 1981. [Google Scholar]
  6. Head, K.L.; Mirchandani, P.B.; Sheppard, D. Hierarchical Framework for Real-Time Traffic Control; Number 1360; Transportation Research Board: Washington, DC, USA, 1992. [Google Scholar]
  7. Luyanda, F.; Gettman, D.; Head, L.; Shelby, S.; Bullock, D.; Mirchandani, P. ACS-Lite algorithmic architecture: Applying adaptive control system technology to closed-loop traffic signal control systems. Transp. Res. Rec. 2003, 1856, 175–184. [Google Scholar] [CrossRef]
  8. Gartner, N.H. OPAC: A Demand-Responsive Strategy for Traffic Signal Control; Number 906; Transportation Research Record: Washington, DC, USA, 1983. [Google Scholar]
  9. Aoyama, K.I. Universal traffic management system (UTMS) in Japan. In Proceedings of the VNIS’94-1994 Vehicle Navigation and Information Systems Conference, Yokohama, Japan, 31 August–2 September 1994; pp. 619–622. [Google Scholar]
  10. UTMS Socitey of Japan. Available online: https://utms.or.jp/english/ (accessed on 25 November 2022).
  11. Madeleine, E.Z.; Dafflon, B.; Gechter, F.; Contet, J.M. Vehicle platoon control with multi-configuration ability. Procedia Comput. Sci. 2012, 9, 1503–1512. [Google Scholar]
  12. Chen, D.; Zhao, M.; Sun, D.; Zheng, L.; Jin, S.; Chen, J. Robust H control of cooperative driving system with external disturbances and communication delays in the vicinity of traffic signals. Phys. A Stat. Mech. Its Appl. 2020, 542, 123385. [Google Scholar] [CrossRef]
  13. Hao, W.; Ma, C.; Moghimi, B.; Fan, Y.; Gao, Z. Robust optimization of signal control parameters for unsaturated intersection based on tabu search-artificial bee colony algorithm. IEEE Access 2018, 6, 32015–32022. [Google Scholar] [CrossRef]
  14. Jin, L.; Amin, S. Analysis of a stochastic switching model of freeway traffic incidents. IEEE Trans. Autom. Control 2018, 64, 1093–1108. [Google Scholar] [CrossRef]
  15. Cenedese, C.; Cucuzzella, M.; Scherpen, J.; Grammatico, S.; Cao, M. Highway Traffic Control via Smart e-Mobility—Part I: Theory. arXiv 2021, arXiv:2102.09354. [Google Scholar]
  16. Yu, H.; Diagne, M.; Zhang, L.; Krstic, M. Bilateral boundary control of moving shockwave in LWR model of congested traffic. IEEE Trans. Autom. Control 2020, 66, 1429–1436. [Google Scholar] [CrossRef]
  17. Reveliotis, S.; Masopust, T. Efficient liveness assessment for traffic states in open, irreversible, dynamically routed, zone-controlled guidepath-based transport systems. IEEE Trans. Autom. Control 2019, 65, 2883–2898. [Google Scholar] [CrossRef] [Green Version]
  18. Yi, J.; Lin, H.; Alvarez, L.; Horowitz, R. Stability of macroscopic traffic flow modeling through wavefront expansion. Transp. Res. Part B Methodol. 2003, 37, 661–679. [Google Scholar] [CrossRef] [Green Version]
  19. Tang, T.Q.; Huang, H.J.; Zhang, Y.; Xu, X.Y. Stability analysis for traffic flow with perturbations. Int. J. Mod. Phys. C 2008, 19, 1367–1375. [Google Scholar] [CrossRef]
  20. Haddad, J.; Geroliminis, N. Stability analysis of traffic control in two-region urban cities. In Proceedings of the Swiss Transportation Research Conference (STRC), Ascona, Switzerland, 11–13 May 2011; pp. 1–29. [Google Scholar]
  21. Viscotel, l.A.; Patrascu, M. Design of Stabilizing Predictor-based Controller for Closed Loop Traffic Control with Real-Coded Genetic Algorithms. In Proceedings of the 2021 20th European Control Conference (ECC), Delft, The Netherlands, 29 June–2 July 2021. [Google Scholar]
  22. Constantinescu, V. Contributions to Modelling and Control in Urban Intelligent Transportation Systems. Ph.D. Thesis, University Politehnica of Bucharest, Bucharest, Romania, 2019. [Google Scholar]
  23. Chedjou, J.C.; Kyamakya, K. A review of traffic light control systems and introduction of a control concept based on coupled nonlinear oscillators. In Recent Advances in Nonlinear Dynamics and Synchronization; Springer: Cham, Switzerland, 2018; pp. 113–149. [Google Scholar] [CrossRef]
  24. Ion, A.; Constantinescu, V.; Patrascu, M. Agent based simulation applied to the design of control systems for emergency vehicles access. In Proceedings of the 14th International Conference on ITS Telecommunications, Copenhagen, Denmark, 2–4 December 2015; pp. 50–54. [Google Scholar]
  25. Bertolotti, T. Generative and Demonstrative Experiments. In Model-Based Reasoning in Science and Technology; Springer: Berlin/Heidelberg, Germany, 2014; pp. 479–498. [Google Scholar]
  26. Berceanu, C.; Patrascu, M. Initial Conditions Sensitivity Analysis of a Two-Species Butterfly-Effect Agent-Based Model. In Multi-Agent Systems EUMAS 2022; Lecture Notes in Computer Science; Baumeister, D., Rothe, J., Eds.; Springer: Cham, Switzerland, 2022; Volume 13442, pp. 60–78. [Google Scholar]
  27. Robertson, D.I. Transyt: A Traffic Network Study Tool; Road Reserch Laboratory, Ministry of Transport: Crowthorne, UK, 1969.
  28. Axhausen, K.W.; Korling, H.G. Some measurements of Robertson’s platoon dispersion factor. Transp. Res. Rec. 1987, 1112, 71–77. [Google Scholar]
  29. Vander Velde, W.E. Multiple-Input Describing Functions and Nonlinear System Design; McGraw Hill: New York, NY, USA, 1968. [Google Scholar]
  30. Fendrich, O. Describing functions and limit cycles. IEEE Trans. Autom. Control 1992, 37, 486–487. [Google Scholar] [CrossRef]
  31. Usai, E. Describing Function Analysis of Nonlinear Systems; University of Cagliari, Italy: Cagliari, Italy, 2008. [Google Scholar]
  32. Dashkovskiy, S.; Feketa, P. Zeno phenomenon in hybrid dynamical systems. PAMM 2017, 17, 789–790. [Google Scholar] [CrossRef]
  33. Åström, K.J.; Murray, R.M. Feedback Systems: An Introduction for Scientists and Engineers; Princeton University Press: Princeton, NJ, USA, 2021. [Google Scholar]
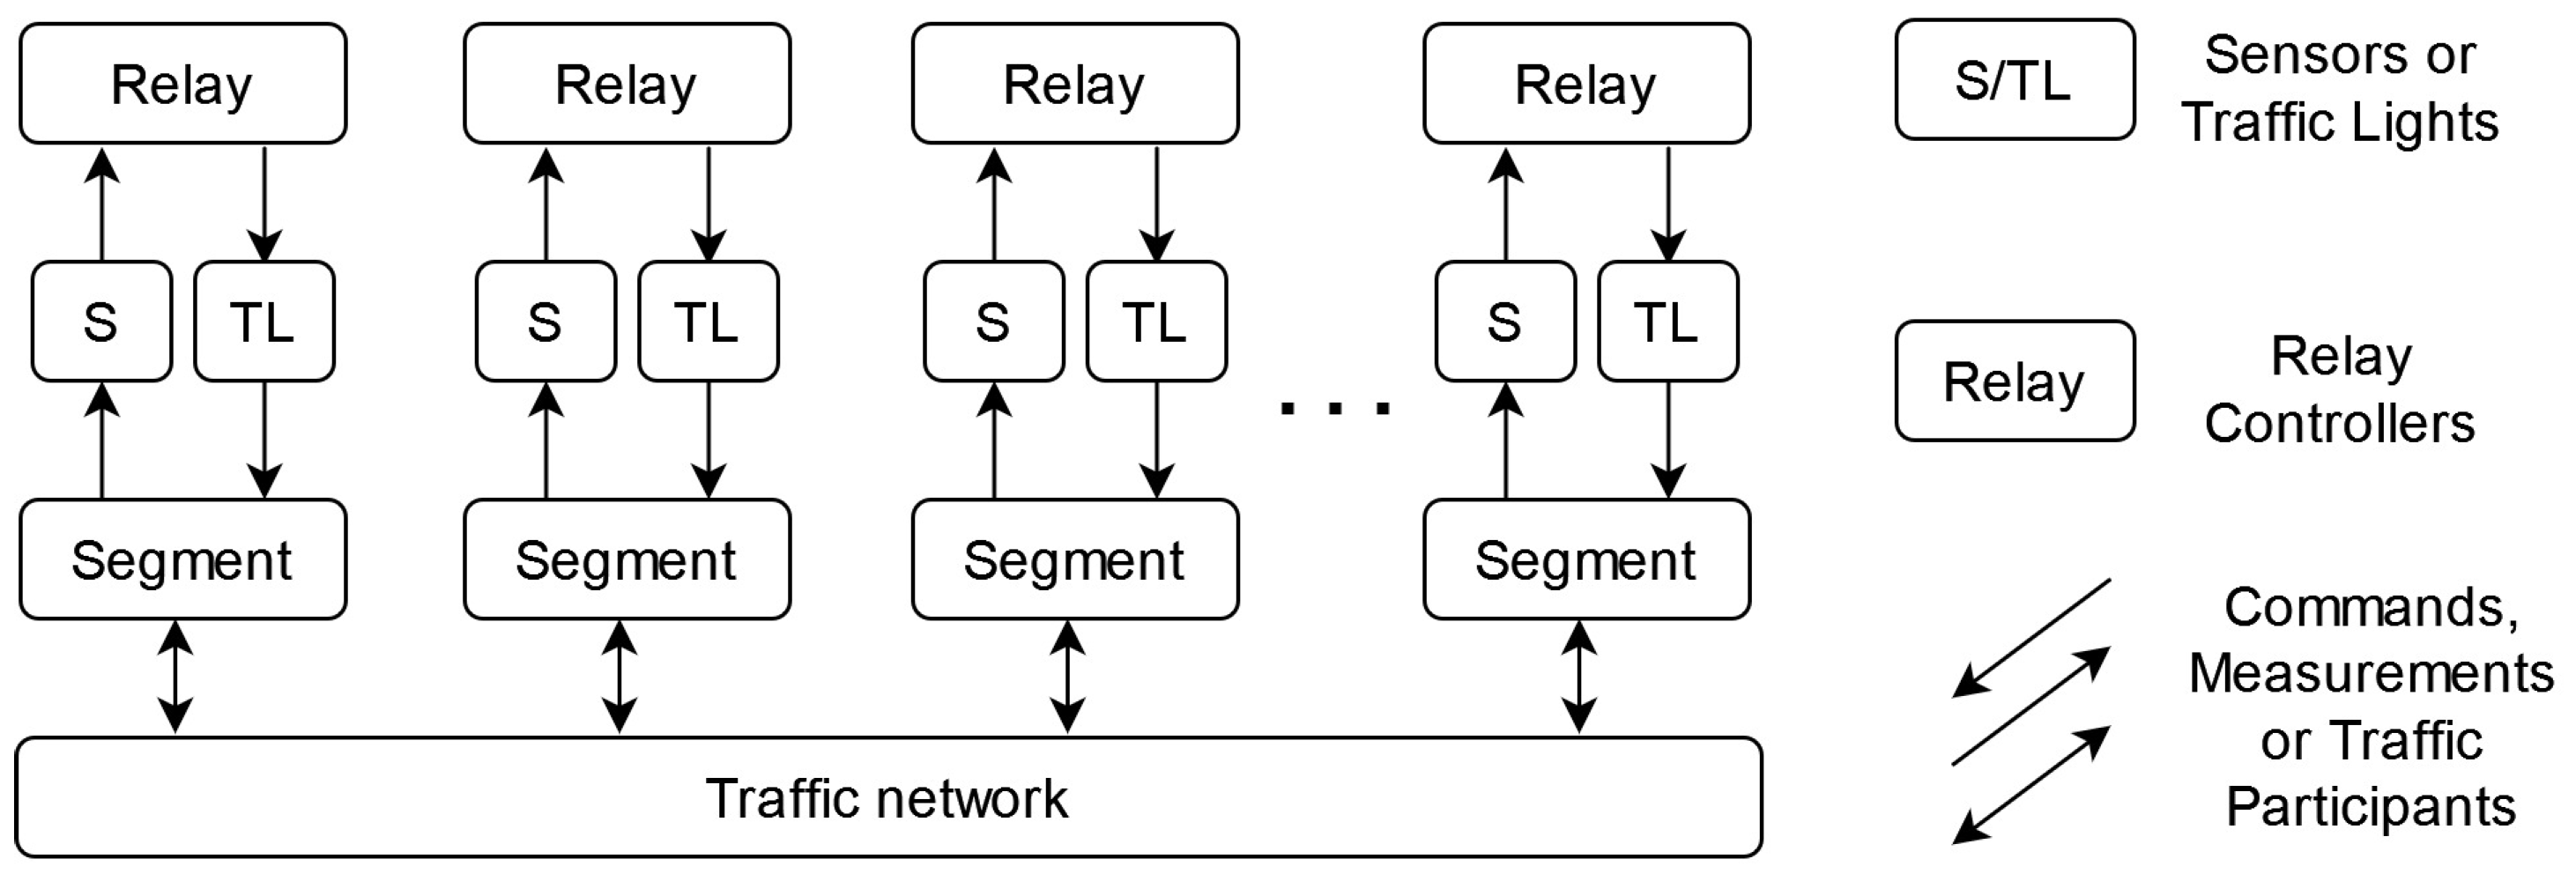
Figure 1. Structure of the decentralized control system for the traffic network.
Electronics 12 00005 g001
Figure 2. Road segment representation.
Electronics 12 00005 g002
Figure 3. Model structure for vehicle load on a single-lane road segment.
Electronics 12 00005 g003
Figure 4. Traffic control system structure for a single-lane road segment.
Electronics 12 00005 g004
Figure 5. Response of the traffic control system for a single-lane road segment: setpoint R 0 ( t ) = 10 (vehicles, blue), output R ( t ) (vehicles, red), and command U ( t ) = 1 for green phase (vehicles are released) or U ( t ) = 0 for red phase (vehicles are received).
Electronics 12 00005 g005
Figure 6. Nonlinear components.
Electronics 12 00005 g006
Figure 7. Limit cycle stability.
Electronics 12 00005 g007
Figure 8. Behavior for setpoint 40 vehicles, where n = 1 , n = 3 , and τ c = 5 s.
Electronics 12 00005 g008
Figure 9. Frequency response of the linear component: stable for ( n , τ c ) { ( 1 , 5 ) , ( 1.5 , 5 ) , ( 2 , 5 ) } and unstable for ( n , τ c ) { ( 1 , 60 ) , ( 4 , 30 ) , ( 5 , 40 ) } .
Electronics 12 00005 g009
Figure 10. Single-lane road segments in a network, showing structure and time responses.
Electronics 12 00005 g010
Table 1. Time response simulation results.
R 0 n τ c E P Max.Max. GreenClosed Loop Stable?
(Vehicles) (Sec)(Vehicles)Vehicles(Sec)Other Remarks
5…101…4.55…80…59…1715…65Yes
5…101…4.55…8509…1415…55Yes, however the segment stays empty with green light in some cases.
401…350…504415…55Yes
11…350525Yes
11…355…50540Yes, however the segment stays empty with green light in some cases.
10…701…35…200…5014…8325…100Often stable. Saturation in some cases.
10550…5054Always greenOutput is permanently saturated to constant value.
10650…5054Mostly greenWide oscillations, high waiting times.
Table 2. Frequency analysis results ( R 0 = 40 ). The frequency responses of the linear components for the rows marked with * are presented in Figure 9.
n τ c G m P m D m 8 τ c π | R 0 τ + τ c ( n + E P ) | CL
Stable?
E P = 0 E P = 1 E P = 50
0.151.010.480.0130.060.060.08Y
0.551.14.950.1450.060.060.08Y
151.248.580.270.060.060.08Y *
1150.34−35190.170.170.23N
1300.24−64300.330.330.42N
1600.08−589.470.580.590.73N *
1.551.49.20.30.060.060.08Y *
251.5612.70.440.060.060.08Y *
2600.05−309.60.590.590.73N
2.251.64140.480.060.060.08Y
350.128.850.560.060.060.08N
3.5450.04−10520.470.470.59N
3.6500.0420.63.460.510.510.64N
4300.04−76300.330.330.43N *
5400.026−16.445.60.430.430.55N *
5600.02332.93.90.590.600.74N
Disclaimer/Publisher’s Note: The statements, opinions and data contained in all publications are solely those of the individual author(s) and contributor(s) and not of MDPI and/or the editor(s). MDPI and/or the editor(s) disclaim responsibility for any injury to people or property resulting from any ideas, methods, instructions or products referred to in the content.