Article

Mechanism Analysis of Multiple Disturbance Factors and Study of Suppression Strategies of DFIG Grid-Side Converters Caused by Sub-Synchronous Oscillation

School of Electrical and Electronic Engineering, Harbin University of Science and Technology, Harbin 150080, China
*
Author to whom correspondence should be addressed.
Electronics 2023, 12(10), 2293; https://doi.org/10.3390/electronics12102293
Submission received: 10 April 2023 / Revised: 6 May 2023 / Accepted: 11 May 2023 / Published: 18 May 2023

Abstract

:
With the increasing utilization of electronic equipment in the power system, sub-synchronous oscillation (SSO) has occurred many times and caused off-grid accidents because of power oscillation. SSO has become one of the main problems that restrict the development of new energy. In this paper, power oscillation in grid-side converters (GSCs) in doubly-fed induction generators (DFIGs) under SSO is studied. Firstly, the influence mechanism of SSO on GSC multipath disturbance is studied. Secondly, the problem of coupling oscillation caused by PLL output errors after coordinate transformation is studied, and the mathematical model of GSC output power considering SSO multipath disturbance is established. By analyzing the oscillation suppression ability of the quasi-resonant controller under variable SSO states, the key influencing factors of SSO for GSC power oscillation suppression strategies are determined. Furthermore, based on the above theoretical analysis and research, an improved PLL is designed to eliminate the influence of its output errors on the disturbance of GSC. At the same time, a DFIG-GSC power oscillation suppression strategy using an adaptive quasi-resonant controller is designed to eliminate the influence of SSO on the multi-path disturbance of GSC. Finally, the effectiveness of the proposed suppression strategy is verified using simulation and experimental results.

1. Introduction

In recent years, with the determination of the "double carbon" target, new energy systems represented by wind power have developed rapidly [1,2,3]. The doubly-fed induction generator (DFIG) is the main body of the wind turbine and has the advantages of low cost, variable frequency, and constant speed control [4]. However, because of the reverse distribution characteristics of wind power resources and load centers in China, the large-scale consumption and utilization of wind power resources require long-distance transmission [5,6]. In the process of long-distance power transmission, a large number of DC converters, series compensation capacitors, and static var compensators are connected to the power grid, resulting in sub-synchronous oscillation (SSO) problems [7,8,9] and off-grid accidents. At present, there have been many sub-synchronous oscillation accidents in China. Since 2011, several SSO accidents with oscillation frequencies of 3–10 Hz have occurred at wind farms in Guyuan, Hebei Province [10,11,12]. In 2014, an SSO accident occurred in Hami, Xinjiang, which caused the torsional vibration protection of the thermal power unit to cut off 300 km away [13,14,15,16], seriously affecting the safe operation of the power grid and the grid-connected control of the wind turbine.
According to the accident analysis, SSO has a complex generation mechanism, fuzzy transient model, various types, variable oscillation frequencies, and wide-area propagation characteristics [17]. Ref. [18] classified the generation mechanism of SSO and introduced the main analysis methods of SSO. In Ref. [19], the evolution process of SSO in the power grid and the classification of existing forms were introduced, and a large number of new SSO problems characterized by the interaction between converters and power grids that have emerged in recent years were studied. The research shows that no matter what causes the SSO which is input into the wind turbine, the fault form is the output power oscillation caused by voltage oscillation. When SSO occurs, the stator-side and grid-side converters (GSC) of the DFIG will transmit oscillating power to the grid. The existing suppression strategies mainly focus on the rotor-side converter (RSC), but the oscillation power transmitted by the GSC to the grid will increase with the deterioration of grid SSO at super-synchronous speed. Therefore, designing an effective power oscillation suppression strategy for the GSC system is of great significance to the stable operation of the DFIG unit and the grid.
Ref. [20] proposed an oscillation suppression strategy by adding an additional dampening controller to the GSC control system. Through simulation analysis, it was found that adding a dampening controller to the current inner loop can achieve the best oscillation suppression effect. Ref. [21] optimized phase-locked loop parameters by simplifying the phase-locked loop (PLL) and considering the system short-circuit ratio, but this has a high degree of dependence on the actual operating conditions of the wind turbine, and when SSO occurs under multiple operating conditions, such as frequency offset, its suppression strategy cannot provide effective control. Ref. [22] used a linear extended state observer to improve the traditional static reactive compensator, realize the estimation and compensation of sub-synchronous components, and then suppress the external sub-synchronous disturbance components. In summary, the existing research on SSO suppression has made less consideration of multi-condition problems such as oscillation frequency changes. However, existing accidents have shown that the frequency and mode of SSO are very likely to exhibit migratory characteristics because of the variability of the structure and operating state of the power grid [23,24]. Therefore, the existing control strategies have the problems of parameter solidification and low self-adaptability, which cannot meet the suppression requirements if the characteristics of SSO are changed. At the same time, according to the analysis in this paper, the disturbance of SSO to GSCs includes the influence of SSO voltage on the output value of the phase-locked loop (PLL), as well as the influence on the GSC control link, and the disturbance path is not unique. The forms of different disturbance paths are different, and corresponding oscillation suppression strategies should be adopted for each disturbance path.
This paper studies the suppression of oscillating power flowing through the GSC in the SSO state of the power grid. The main work is as follows:
(1)
The power oscillation problem of grid SSO in DFIG grid-connected systems is discussed, and the disturbance path of grid SSO in a GSC control system is analyzed.
(2)
The influence of grid SSO on PLL is analyzed, and the GSC power function equation considering the influence of PLL in an SSO state is established. At the same time, the influence of variable SSO characteristics on the suppression strategy for GSC power oscillation is analyzed so as to design an effective suppression strategy for GSC power oscillation.
(3)
An improved PLL using a resonant controller is designed to improve the accuracy of PLL output. At the same time, the control strategy of GSC is improved based on the adaptive quasi-resonant controller to suppress the oscillation power of the GSC if the grid SSO frequency is changed.
(4)
We build a DFIG-system oscillation suppression simulation model and experimental platform to verify the effectiveness of the oscillation suppression strategy proposed in this paper.
This paper will be organized as follows. Section 2 analyzes the mathematical model of multiple disturbance factors, which explains the main impact of SSO on the GSC. Then, an improved PLL is proposed to eliminate the disturbance caused by the PLL output phase error in Section 3. In Section 4, a frequency-adaptive quasi-resonant controller is proposed; furthermore, suppression with an adaptive quasi-resonant controller and an improved PLL is established to improve the power oscillation of the GSC under grid SSO. Simulation and experimental validations are provided in Section 5. The conclusions are summarized in Section 6.

2. Mechanism Analysis of Multiple Disturbance Factors of Grid SSO to the GSC

2.1. Analysis of Multiple Disturbance Factors of Grid SSO in GSC

A multi-disturbance factor diagram of GSC system under grid SSO is shown in Figure 1.
In Figure 1, C is the DC bus capacitance; Vdc represents the DC bus voltage; iload represents the load current; uga0, ugb0, and ugc0 and iga0, igb0, and igc0 represent the three-phase voltage and current of the power grid, respectively; ugasso, ugbsso, and ugcsso and igasso, igbsso, and igcsso, respectively, represent the sub-synchronous voltage and sub-synchronous current components of the grid; R and L represent filter inductance and resistance, respectively; θ1 is the phase of the grid fundamental voltage; and θerror is the error phase of the PLL output.
Figure 1 indicates that power-grid SSO influences the workstation of the GSC with the input characteristics of multiple disturbance factors, including an error phase generated by a PLL and current disturbances in actual converters. Disturbance ① is caused by the error phase, and disturbance ② is caused by current disturbances. Additionally, the coupling of the error phase and current disturbances produces disturbance ③. Furthermore, three colored arrows indicate that the combined influence of the error phase and current disturbances (which can be seen as the combined influence of all three disturbances) makes the GSC output power oscillation. Specific analysis is as follows:
Disturbance ① is the output error of the PLL in the SSO state of the grid, where the phase signal with the error has an impact on the coordinate transformation process of the GSC control system.
Disturbance ② is the current disturbances in the actual converter, which are expressed as igasso, igbsso, and igcsso. The current oscillation on the grid side will cause the DC component and the DC bus voltage to oscillate in the d-q coordinate system.
Disturbance ③ is the grid-side current disturbance generated by the coupling of the PLL output error signal and converter current oscillation, which is superimposed with the grid-side oscillation current caused by grid SSO, thus aggravating the output power oscillation of the GSC.
Therefore, the PLL will be improved later in this paper to ensure the accuracy of its output phase, voltage amplitude, and frequency estimates. By improving the control strategy of the GSC, the output power stability of the system is improved.

2.2. Analysis of the Impact of Grid SSO on GSC without Considering the PLL Phase Error

Since the linearization modeling of GSC systems is quite mature [25,26,27], this paper will not elaborate on it.
In the case of ignoring the PLL phase error, if the frequency of the SSO is wsso, the power grid voltage in the d-q coordinates can be expressed in Formula (1).
{ u gd = u gd 0 + u gdsso = U g + U sso cos [ ( ω 1 ω sso ) t + ϕ usso ] u gq = u gq 0 + u gqsub = 0 + U sso sin [ ( ω 1 ω sso ) t + ϕ usso ]
In Formula (1), Ug is the amplitude of the grid’s fundamental voltage vector; Usso is the amplitude of grid SSO voltage; ω1 is the angular velocity of the fundamental voltage of the grid; Φusso is the initial phase angle of the grid SSO voltage transformed into d-q coordinates.
Similarly, the current on the network side can be expressed in the d-q coordinate system as
{ i gd = i gd 0 + i gdsso = I g + I sso cos [ ( ω 1 ω sso ) t + ϕ isso ] i gq = i gq 0 + i gqsso = 0 + I sso sin [ ( ω 1 ω sso ) t + ϕ isso ]
In Formula (2), Ig is the amplitude of the current vector under the condition of ideal grid voltage. Isso is the amplitude of the SSO current vector; Φisso is the initial phase angle of the SSO current transformed in the d-q coordinate system.
Setting the positive direction of grid-side current, iga, igb, and igc are flowing from the grid side to the GSC, and employing constant amplitude coordinate transformation, the power of the GSC system can be expressed as
{ P g = 3 2 Re [ u gdq × i ¯ gdq ] Q g = 3 2 Im [ u gdq × i ¯ gdq ]
In Formula (3), Pg and Qg are the active and reactive power of the GSC system, respectively; ugdq is the grid-side voltage in the d-q coordinate system; and i ¯ gdq is the conjugate of the grid-side current in the d-q coordinate system.
By substituting Formulas (1) and (2) into Formula (3), the expression of the active power of the GSC system can be obtained as shown in Formula (4):
P g = 3 2 ( u gd × i gd + u gq × i gq ) = 3 2 [ ( u gd 0 + u gdsso ) × ( i gd 0 + i gdsso ) + u gqsso × i gqsso ] = 3 2 ( U g I g + U sso I sso cos ( ϕ usso ϕ isso ) + U sso I g cos [ ( ω 1 ω sso ) t + ϕ usso ] + U g I sso cos [ ( ω 1 ω sso ) t + ϕ isso ] )
Similarly, the expression of the reactive power of the GSC system is shown in Formula (5):
Q g = 3 2 ( u gq × i gd u gd × i gq ) = 3 2 [ u gqsso × ( i gd 0 + i gdsso ) ( u gd 0 + u gdsso ) × i gqsso ] = 3 2 ( U sso I sso sin ( ϕ usso ϕ isso ) + U sso I g sin [ ( ω 1 ω sso ) t + ϕ usso ] U g I sso sin [ ( ω 1 ω sso ) t + ϕ isso ] )
Formulas (4) and (5) are the expressions of the GSC system’s active and reactive power without considering the influence of the PLL output error. However, in the actual GSC system, the calculation of power will be affected by the PLL output error, so it is necessary to establish a more accurate GSC power mathematical model where the impact of the PLL output error is taken into account.

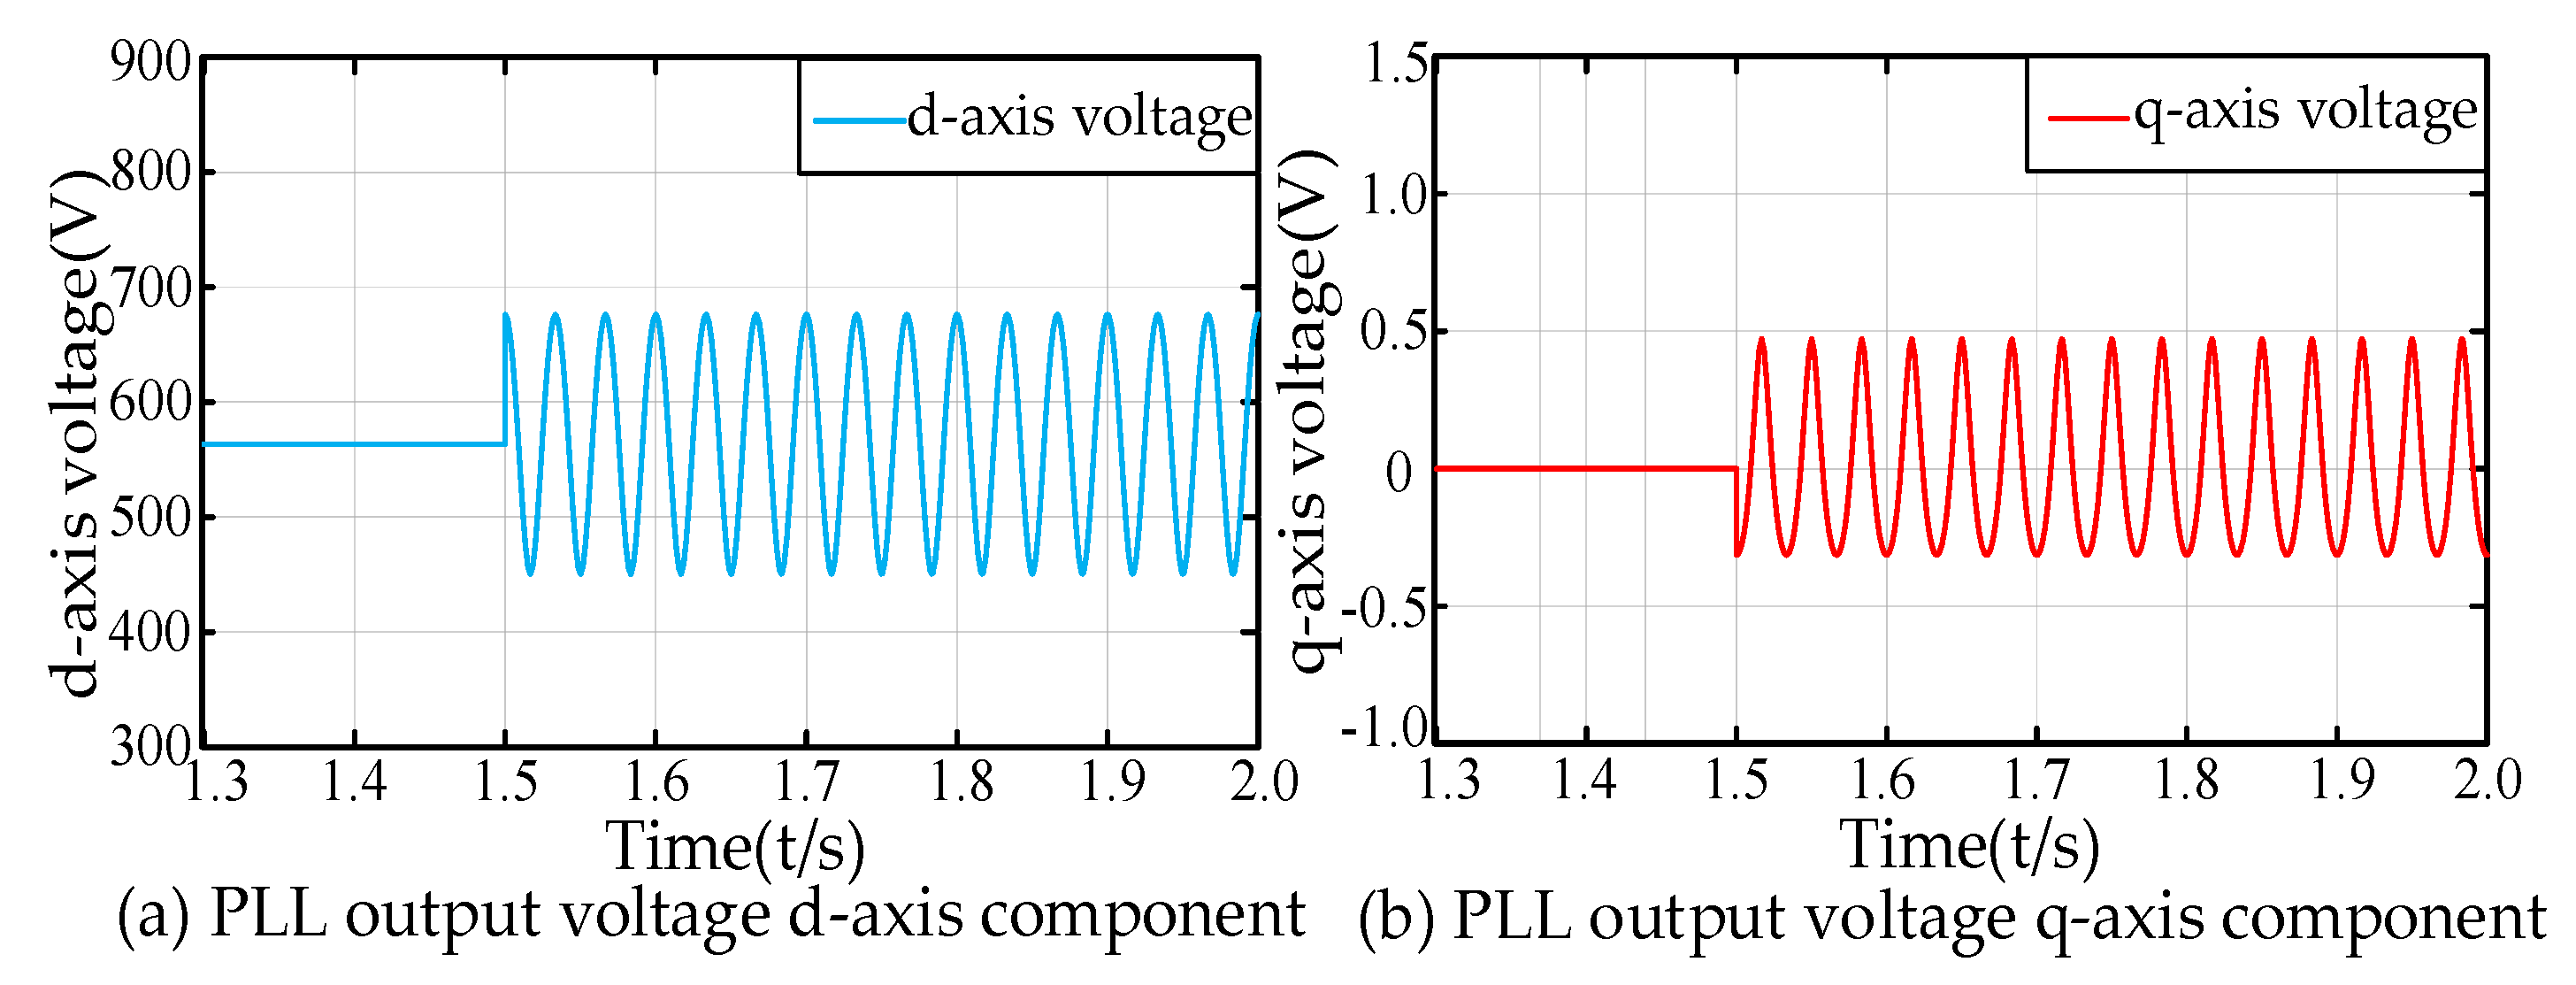
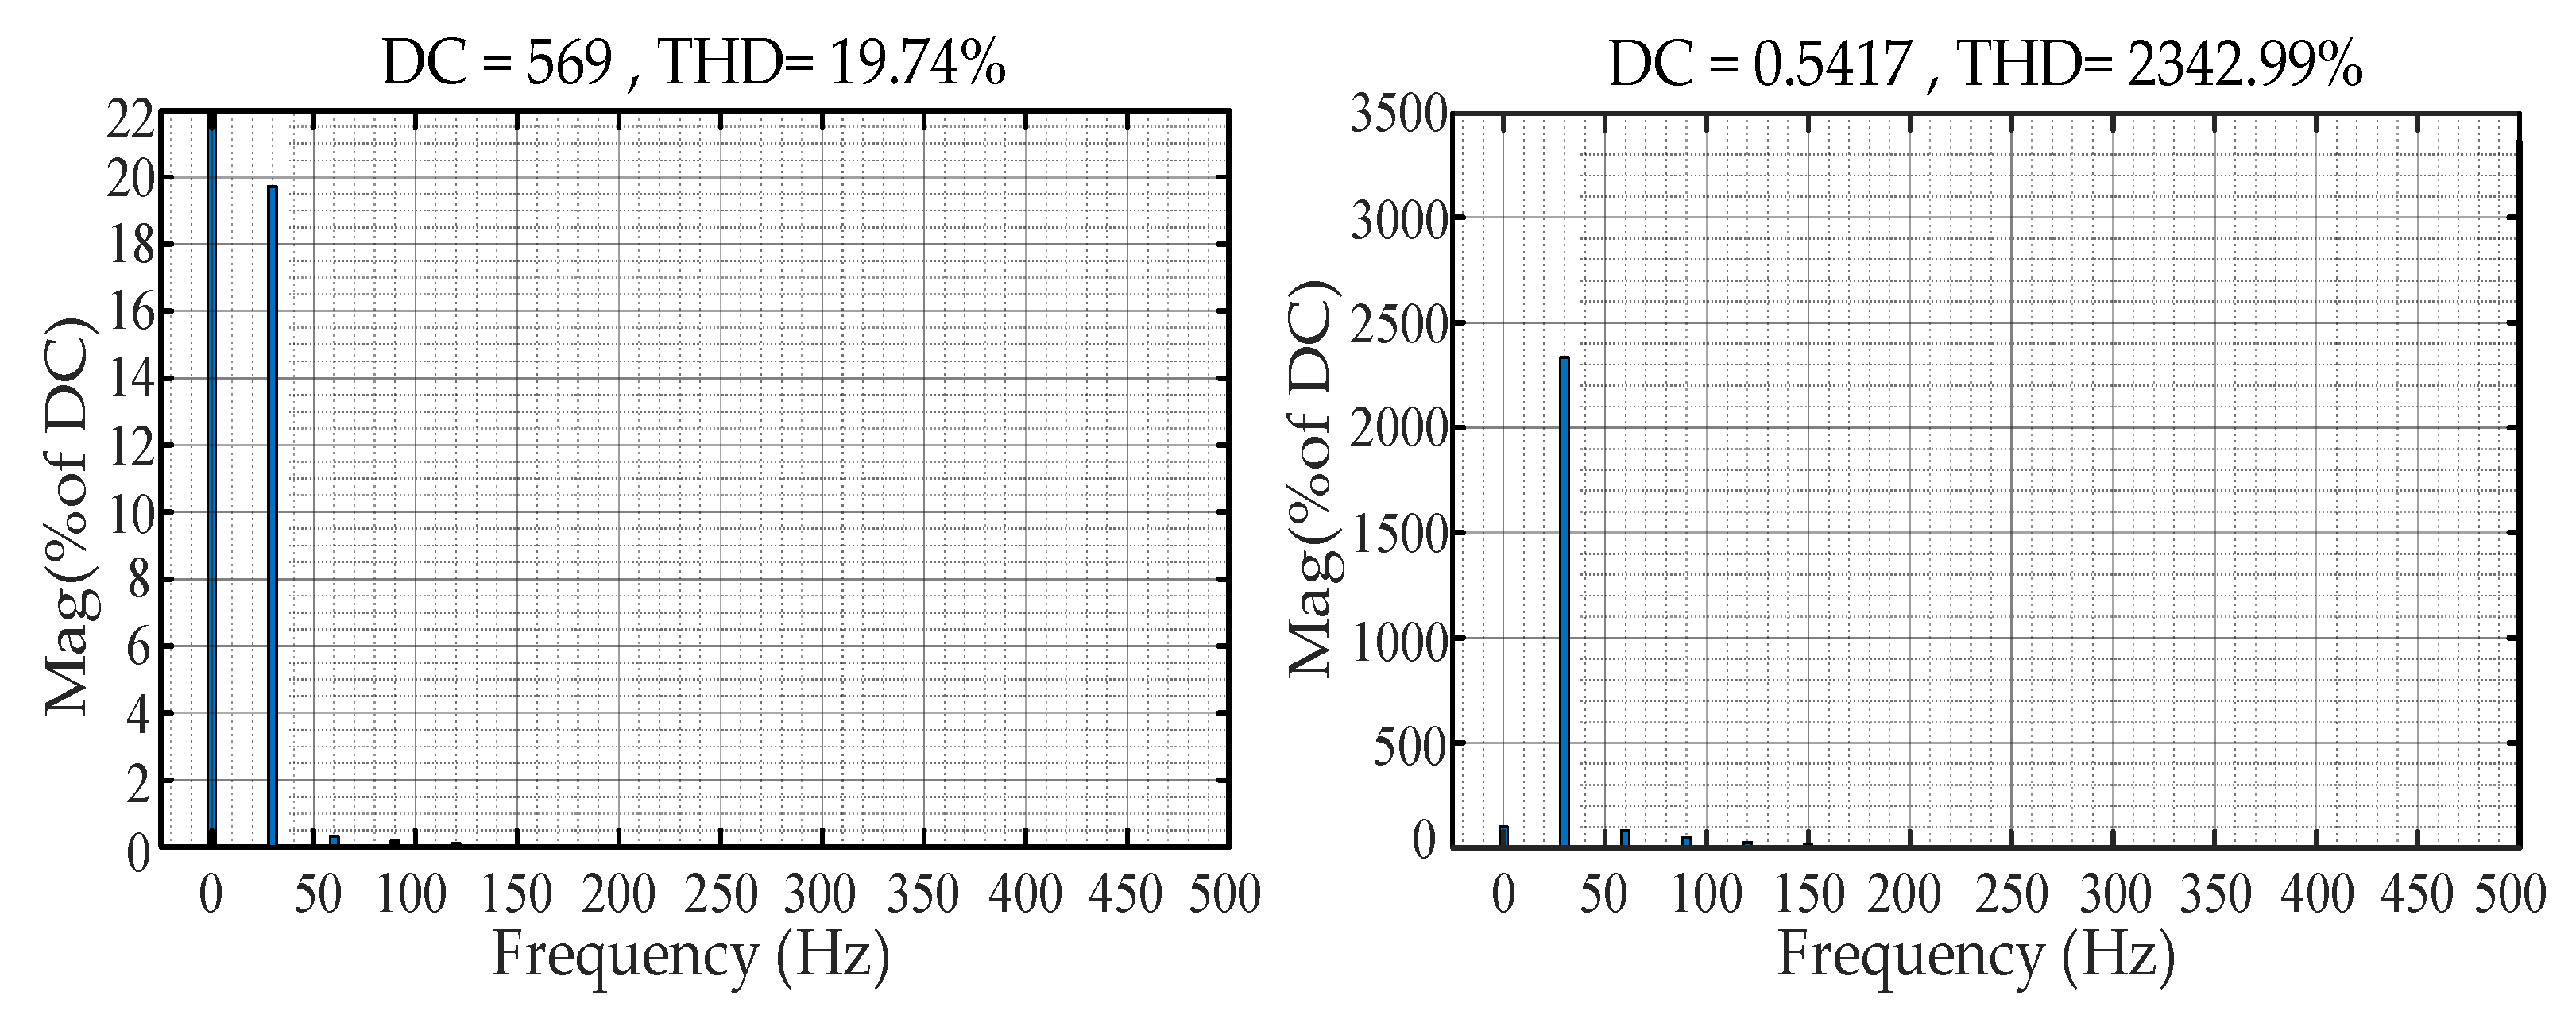
2.3. Analysis of the Impact of Grid SSO on the GSC Considering the PLL Output Error

In the SSO state of the grid, the control effect of the PLL will be disturbed, affecting the control strategy of the GSC system and the calculation process of GSC power. The GSC system control strategy considering PLL disturbance is shown in Figure 2 (see Appendix A for specific variable names).
As shown in Figure 2, the influence of SSO on the PLL is mainly on the electrical angular velocity and phase estimation in its closed-loop control process. In order to explore the influence of grid SSO on PLL output angular velocity and phase estimation, relevant simulation analysis is carried out. The amplitude of the fundamental voltage of the power grid is 690 V; the frequency is 50 Hz; the amplitude of the SSO voltage is 138 V (20% of the fundamental voltage); and the frequency, ωsso, is 20 Hz. The DFIG rotor speed is set to 1400 r/min during simulation, and the specific simulation parameters are shown in Appendix A Table A1.
Figure 3a shows the estimated value, ω 1 , of the PLL output electric angular velocity under the power grid SSO state, including the oscillation component with a frequency of w1-wsso. Figure 3b shows the estimated PLL output phase, θPLL, under the SSO state of the grid. As can be seen from the figure, there is also an error disturbance in the phase estimation, which affects the stability of the GSC control strategy.
An error will exist in the output phase of the PLL when grid SSO happens. Therefore, the output phase of the PLL can be expressed as
θ PLL = θ 1 + θ error
In Formula (6), θ1 is the phase of the grid fundamental voltage; θerror is the error phase of PLL output; and θPLL is disturbance ①, analyzed in Section 2.1.
Then, the Park transformation matrix can be expressed as
T 3 s / 2 r ( θ PLL ) = 2 3 [ cos θ PLL cos ( θ PLL 2 π 3 ) cos ( θ PLL + 2 π 3 ) sin θ PLL sin ( θ PLL 2 π 3 ) sin ( θ PLL + 2 π 3 ) ]
Substitute Formula (6) into Formula (7), and consider that the value of θerror is small:
cos θ PLL cos θ 1 θ error × sin θ 1 sin θ PLL sin θ 1 + θ error × cos θ 1
Substituting Formula (8) into Formula (7), the simplified Park transformation matrix is
T 3 s / 2 r ( θ PLL ) [ 1 θ error θ error 1 ] T 3 s / 2 r ( θ 1 ) = T 3 s / 2 r ( θ error ) T 3 s / 2 r ( θ 1 )
In Formula (9), T 3 s / 2 r ( θ 1 ) = 2 3 [ cos ( θ 1 ) cos ( θ 1 2 π 3 ) cos ( θ 1 + 2 π 3 ) sin ( θ 1 ) sin ( θ 1 2 π 3 ) sin ( θ 1 + 2 π 3 ) ] .
In Figure 2, ugd1, ugd2, ugd3, ugq1, ugq2, and ugq3 are used for feedforward compensation. Therefore, the expression of grid-side voltage under the d-q axis, considering the influence of SSO on the PLL, can be rewritten from Formula (1) to be
{ u gd = u gd 0 + u gd 1 + u gd 2 + u gd 3 u gq = u gq 0 + u gq 1 + u gq 2 + u gq 3
In Formula (10), [ u gd 0 u gq 0 ] = T 3 s / 2 r ( θ 1 ) V abc , [ u gd 1 u gq 1 ] = T 3 s / 2 r ( θ error ) V abc , [ u gd 2 u gq 2 ] = T 3 s / 2 r ( θ 1 ) V abc _ sso , [ u gd 3 u gq 3 ] = T 3 s / 2 r ( θ error ) V abc _ sso . Vabc and Vabc_sso are the grid fundamental voltage and the grid SSO voltage matrix.
According to Formula (9) and combined with Formula (1), the grid voltage expression (10) considering the PLL output error phase can be simplified as follows:
{ u gd = U g + U sso cos [ ( ω 1 ω sso ) t + ϕ usso ] + θ error U sso sin [ ( ω 1 ω sso ) t + ϕ usso ] = U g + 1 + θ error 2 U sso sin [ ( ω 1 ω sso ) t + ϕ usso + arctan 1 θ error ] u gq = θ error U g + U sso sin [ ( ω 1 ω sso ) t + ϕ usso ] θ error U sso cos [ ( ω 1 ω sso ) t + ϕ usso ] = θ error U g + 1 + θ error 2 U sso sin [ ( ω 1 ω sso ) t + ϕ usso arctan θ error ]
Figure 4 shows the voltage amplitude estimation result of PLL output under the SSO state of the grid. According to the simulation results, there is an oscillation component with a frequency of ω 1 ω sso in the voltage amplitude estimation results of the PLL under the SSO state of the grid, which further verifies the accuracy of Formula (11).
Based on the DC component, further FFT spectrum analysis is performed on the PLL output voltage under SSO, and the specific results are shown in Figure 5. It can be seen from Figure 5 that, when the grid voltage is converted to the d-q coordinate system, except for the fundamental component, the frequency of components with the highest content are w1wsso. As shown in Equation (11), Figure 5 proves that the PLL output d-q axis voltage has a higher sub-synchronous component under SSO.
According to Figure 2, the current disturbances, igd1, igd2, and igd3 and igq1, igq2, and igq3, act on the current feedback and feedforward decoupling processes, respectively. Similarly, in the SSO state of the grid, the expression of the grid-side current in the d-q coordinate system can be rewritten from Equation (2) as follows:
{ i gd = i gd 0 + i gd 1 + i gd 2 + i gd 3 i gq = i gq 0 + i gq 1 + i gq 2 + i gq 3
In Formula (14), [ i gd 0 i gq 0 ] = T 3 s / 2 r ( θ 1 ) I abc , [ i gd 1 i gq 1 ] = T 3 s / 2 r ( θ error ) I abc , [ i gd 2 i gq 2 ] = T 3 s / 2 r ( θ 1 ) I abc _ sso , [ i gd 3 i gq 3 ] = T 3 s / 2 r ( θ error ) I abc _ sso . Iabc and Iabc_sso are the grid fundamental current and the grid SSO current matrix.
Similarly, Formula (12) can be further simplified as
{ i gd = I g + I sso cos [ ( ω 1 ω sso ) t + ϕ isso ] + θ error I sso sin [ ( ω 1 ω sso ) t + ϕ isso ] = I g + 1 + θ error 2 I sso sin [ ( ω 1 ω sso ) t + ϕ isso + arctan 1 θ error ] i gq = θ error I g + I sso sin [ ( ω 1 ω sso ) t + ϕ isso ] θ error I sso cos [ ( ω 1 ω sso ) t + ϕ isso ] = θ error I g + 1 + θ error 2 I sso sin [ ( ω 1 ω sso ) t + ϕ isso arctan θ error ]
In addition, the term containing θerror in Formula (13) is disturbance ③.
According to Formula (3), the expression of power on the grid side under the influence of PLL is
P g = 3 2 ( u gd × i gd + u gq × i gq ) = 3 2 [ ( u gd 0 + u gd 1 + u gd 2 + u gd 3 ) × ( i gd 0 + i gd 1 + i gd 2 + i gd 3 ) + ( u gq 0 + u gq 1 + u gq 2 + u gq 3 ) × ( i gq 0 + i gq 1 + i gq 2 + i gq 3 ) ] 3 2 ( U g I g + θ error 2 U g I g + ( 1 + θ error 2 ) U sso I sso + A sin [ ( ω 1 ω sso ) t + ϕ usso arctan θ error ] )
In Formula (14), A = 1 + θ error 2 ( 1 θ error ) ( U g I sso + U sso I g ) .
Q g = 3 2 ( u gq × i gd u gd × i gq ) = 3 2 [ ( u gq 0 + u gq 1 + u gq 2 + u gq 3 ) × ( i gd 0 + i gd 1 + i gd 2 + i gd 3 ) ( u gd 0 + u gd 1 + u gd 2 + u gd 3 ) × ( i gq 0 + i gq 1 + i gq 2 + i gq 3 ) ] 0
According to Formula (14), the SSO component of the grid acts on the GSC system, making the active power generate the AC component, whose frequency is w1wsso, and the oscillation mode of the active power, Pg, becomes more complex. Active power oscillation component Pgsso is affected by many factors such as sub-synchronous voltage amplitude, frequency, and phase angle. Therefore, when designing an oscillation power suppression strategy, it is necessary to enable a suppression strategy to effectively suppress the oscillation power when the above three factors change.

2.4. Analysis of Quasi-Resonant Control Effect under Grid SSO Changes

The transfer function of the classical quasi-resonant controller is shown in Equation (16) [28,29]:
G ( s ) = 2 K R ω c s s 2 + 2 ω c s + ω 0 2
In Formula (16), ωc denotes the cutoff frequency.
In order to further verify the characteristics of the quasi-resonant controller shown in Formula (16), the Bode diagram is used to verify and analyze it. Let ω0 be 50 Hz, and change KR and ωc; the control performance of the quasi-resonant controller is shown in Figure 6.
In Figure 6a, ωc is set to 10 rad/s. Because of the existence of ωc, the control bandwidth of the quasi-resonant controller is larger than that of the resonant controller, and the controller gain is positively correlated with the KR. It can be seen from Figure 6b that, when KR is a fixed value, the amplitude and phase gain of the quasi-resonant controller tend to be flat with the increase in ωc. At the same time, the maximum gain point of the quasi-resonant controller is still at the resonant frequency ω0, so it is feasible to use the quasi-resonant controller to control the AC power oscillation component.
The quasi-resonant controller designed based on Formula (16) filters the DC component and controls only the AC signal of a specific frequency. However, when the input signal frequency deviates from the resonant frequency, ω0, the quasi-resonant controller may have difficulty providing sufficient control gain and cannot effectively control the AC signal.
According to the calculation results of the grid-side power in Formula (14), the changes in grid SSO amplitude, frequency, and phase angle have different effects on the active power, Pg, of the GSC, so the changes in the above factors need to be considered when designing SSO suppression strategies. In order to verify the influence on the SSO suppression strategy based on the quasi-resonant controller when the SSO amplitude, frequency, and phase angle change, according to [30], the resonant frequency of the quasi-resonant controller should be set to 40 Hz (that is, a frequency corresponding to a grid SSO frequency of 10 Hz). The GSC power oscillation suppression strategy based on the quasi-resonant controller is simulated and analyzed at a sub-synchronous speed of 1400 r/min and a super-synchronous speed of 1800 r/min. The motor and line parameters used in the simulation are shown in Table A1 in the Appendix. The SSO voltage is added when the simulation runs to 3 s, the quasi-resonant suppressor is put into operation when the simulation runs to 3.2 s, and the SSO characteristics change when the simulation runs to 3.5 s. The simulation results are shown in Figure 7 and Figure 8.
In the simulations of Figure 7 and Figure 8, the SSO voltage is put into the GSC system during the T1 period, the quasi-resonant controller is used to suppress the power oscillation of the GSC system during the T2 period, and the SSO voltage of the grid changes during the T3 period. By observing the simulations in Figure 7 and Figure 8, it can be seen that the oscillation component of the active power is significantly reduced during the T2 period.
In Figure 7b and Figure 8b, the amplitude of grid SSO during the T3 period changes from 5% of the fundamental voltage to 20%, and the amplitude of Pg oscillation increases instantaneously. However, the quasi-resonant controller is still effective; Pg gradually converges to the expected value within 0.1s. In Figure 7c and Figure 8c, the SSO frequency of the power grid during the T3 period changes from 10 Hz to 30 Hz, and the Pg oscillates at 20 Hz. Since the SSO frequency has seriously deviated from the resonant frequency of the quasi-resonant controller, the suppression strategy fails, and Pg will continue to oscillate. In Figure 7d and Figure 8d, the SSO phase angle of the power grid increases by 90° during the T3 period. According to the simulation results, after the SSO phase angle mutation, the quasi-resonant controller can still effectively suppress the oscillation component in the Pg, and the influence of the SSO phase angle change on the quasi-resonant control is very weak.

3. Research on the Suppression Method of PLL Estimation Error under the Influence of Grid SSO

3.1. Sub-Synchronous Oscillation Suppressor Based on Resonant Controller

According to the analysis in Section 2.3, when there is SSO voltage with a frequency of wsso in the power grid, the performance of PLL is disturbed, which affects the stability of the GSC control strategy, and the Pg of the GSC will generate an oscillation component with a frequency of w1wsso. Therefore, it is necessary to design corresponding suppression strategies to ensure the accuracy of the PLL operation and design corresponding GSC power oscillation suppression strategies to ensure the stability of the Pg.
A PIR controller is often used to control the AC component. Therefore, this paper considers introducing a resonant controller to suppress the oscillation voltage, which is input into the PLL. The transfer function of a traditional resonance controller is [31]
G 1 ( s ) = K R s s 2 + ω 0 2
In Formula (17), KR is the resonance control gain coefficient; w0 represents the resonant frequency.
In order to further verify the working characteristics of Formula (17), a Bode diagram is used to analyze it. The set resonance frequency which is named w0 is 50 Hz, and the change in amplitude–frequency and phase–frequency characteristics when changing KR is shown in Figure 9.
It can be seen from Figure 9a that the resonant controller only has a very high gain at the resonant frequency, and its gain is positively correlated with the resonant control gain coefficient, KR; since the resonant controller only controls the signal with the same resonant frequency, it can be used to filter out the sub-synchronous components, which is input into the PLL.

3.2. Research on the Control Strategy of Improved PLL for SSO States

According to the analysis in Section 2.3, above, when the power grid voltage contains SSO components, there are errors in the output of the PLL such as grid voltage amplitude, electric angular velocity, and the grid voltage phase. The errors make it difficult for the PLL to meet the requirements of vector control in terms of phase-locking accuracy, so it is necessary to improve the PLL.
Based on the working characteristics of the resonant controller, a resonant controller with a resonant frequency of 50 Hz which is in the red dotted box. is connected in series at the input end of the PLL. When the power grid SSO occurs, the resonance controller can filter out the sub-synchronous component in the grid voltage and only allow the fundamental frequency signal to enter the PLL, thus improving the working performance of the PLL under the grid SSO state. The improved PLL control structure is shown in Figure 10.
Figure 11 shows the comparative analysis of the performance of the improved PLL and traditional PLL under the SSO state of the power grid. In the simulation process, the grid voltage is 690 V, and the frequency is 50 Hz. At 1.5 s, the SSO voltage with a 20% amplitude of fundamental voltage and 20 Hz frequency is added.
According to Figure 11a,b, compared with the traditional PLL, the output voltage fluctuation amplitude of the improved PLL with the proposed series-resonant controller in the d-q coordinate system is significantly reduced. The simulation results in Figure 11 show that the improved PLL proposed in this paper can accurately lock the fundamental wave signal of the power grid, thus suppressing the influence of a PLL error on the system control.
At the same time, FFT spectrum analysis is further carried out on the output-estimated voltage of the improved PLL under the grid SSO in Figure 11, and the specific results are shown in Figure 12. It can be seen from Figure 12 that the content of the sub-synchronous component in the d-axis voltage output by the improved PLL is only 0.3%, and the content of the sub-synchronous component in the q-axis voltage is 180%. In Figure 12 b, the 40 Hz harmonic of the grid q-axis voltage output by the improved PLL accounts for 180.17% of the fundamental wave. The reason for the larger value is that a grid voltage d-axis orientation is adopted in this paper. In the ideal state, the q-axis voltage value should be around zero. Although the amplitude of the 40 Hz harmonic of the q-axis voltage output by the improved PLL is small, the harmonic content will be very large because the fundamental wave amplitude is almost zero.
It can be seen from Figure 12 that the harmonic content of the improved PLL is significantly reduced under the SSO state of the power grid, which proves that the improved PLL has accurate working performance under the SSO state of the power grid.

4. Research on a DFIG-GSC Power Oscillation Suppression Strategy Based on an Adaptive Quasi-Resonant Controller

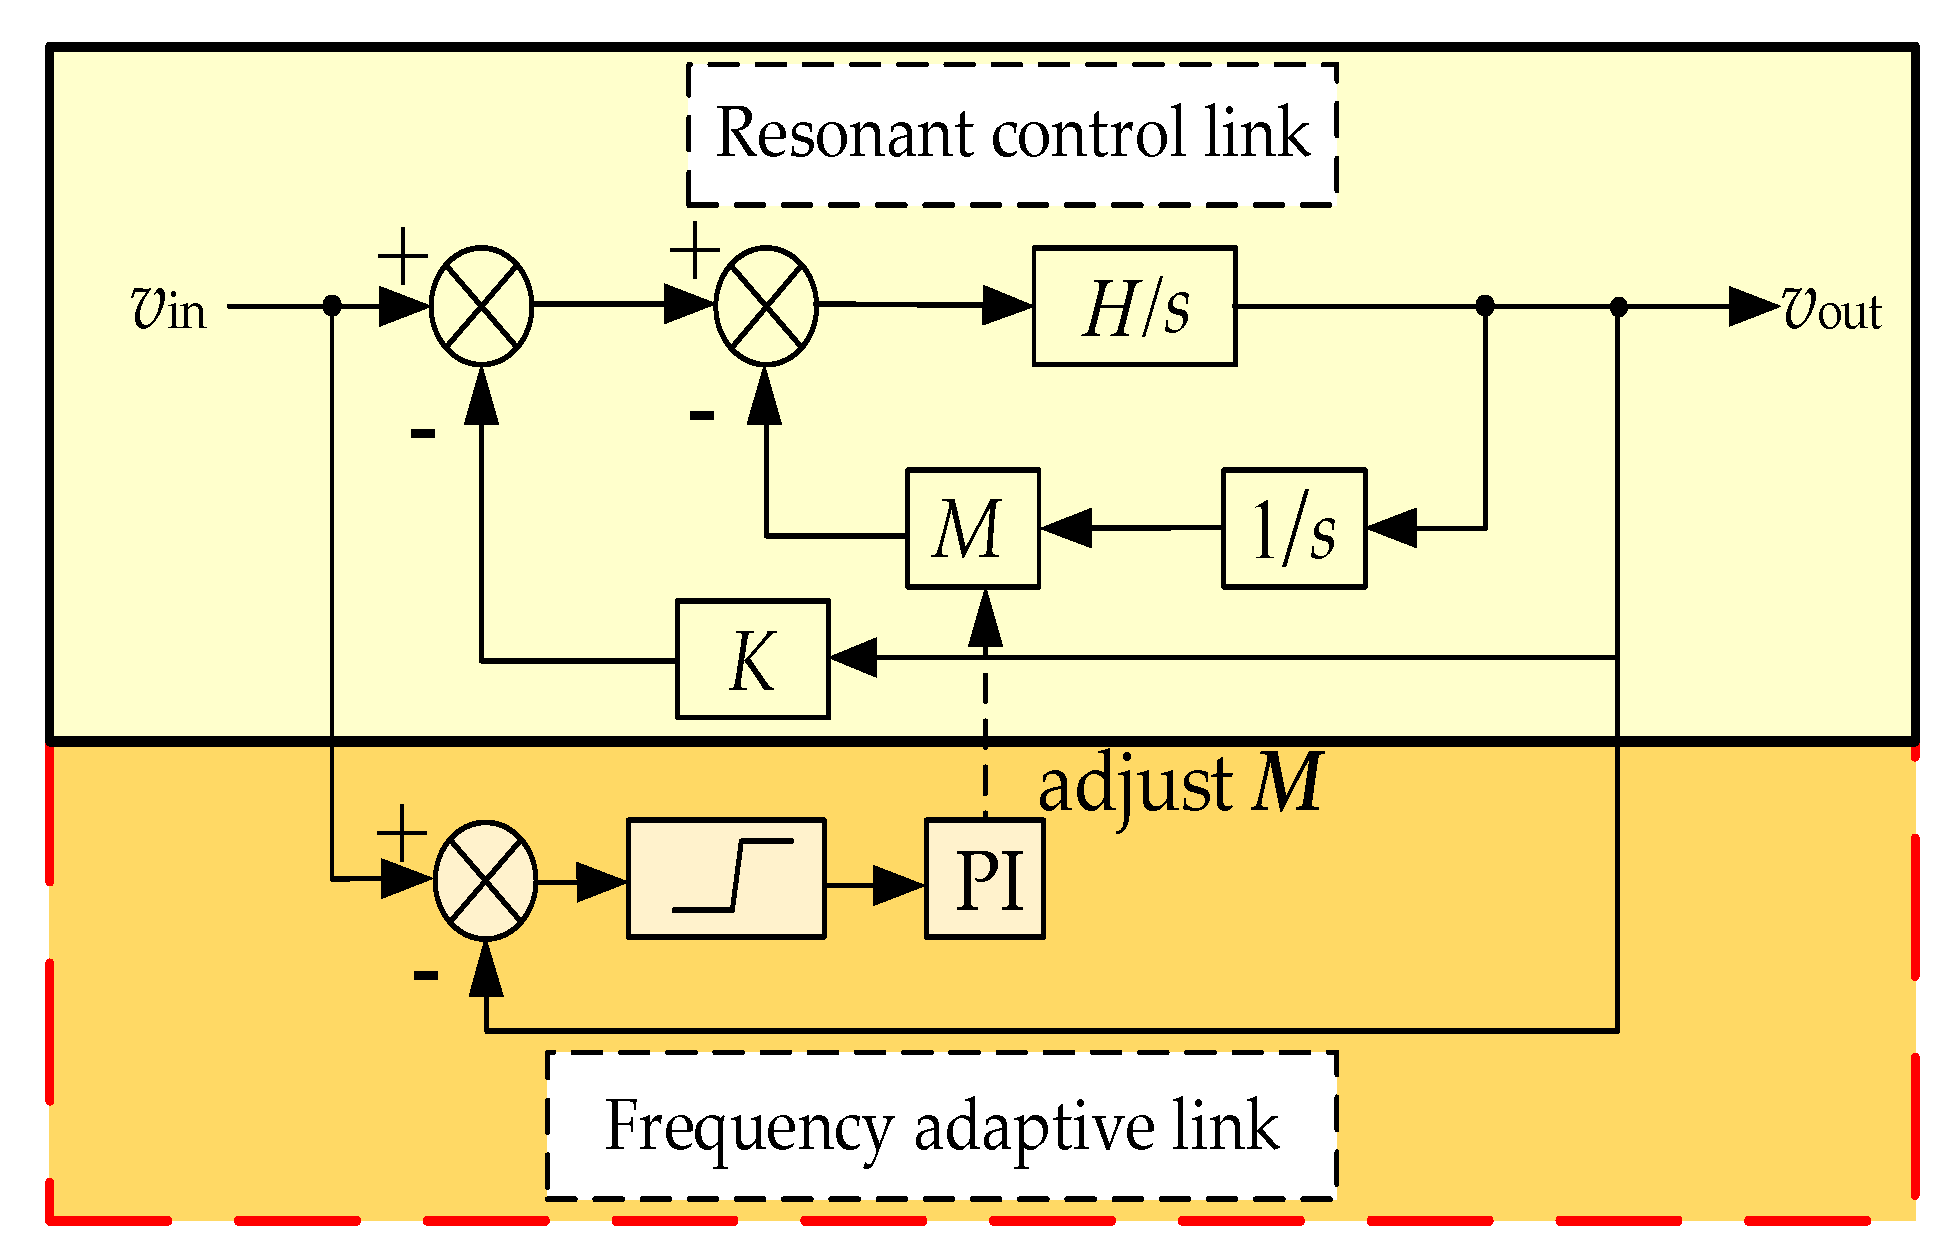
4.1. Design of Sub-Synchronous Oscillation Suppressor Based on an Adaptive Quasi-Resonant Controller

Based on the analysis of the suppression effect of the quasi-resonant controller under the variable SSO characteristics in Section 2.4, it can be seen that the SSO frequency change has the most obvious impact on the oscillation suppression strategy. Therefore, this paper uses the adaptive quasi-resonant controller to suppress the power oscillation of the GSC system.
The transfer function of a classical quasi-resonant controller is shown in Formula (18):
G 2 ( s ) = 2 K R ω c s s 2 + 2 ω c s + ω 0 2
In Formula (17), wc is the cutoff frequency.
Transform Formula (18) into
G 3 ( s ) = H s s 2 + H K s + M H
In Formula (19), H = 2KRwc, K = 1 K R , and M = ω 0 2 2 K R ω c .
It can be seen from Formula (19) that the resonant frequency is directly related to the value of parameter M, so it is necessary to design an adaptive algorithm to realize the real-time adjustment of parameter M and then realize the adaptation of the resonant frequency. An adaptive quasi-resonant controller designed based on Formula (19) is shown in Figure 13.
In Figure 13, the input signal of the adaptive quasi-resonant controller is set as vin = Asin(w0t). In order to realize the frequency tracking of vin, in accordance with Formula (18), the output, vout, of the adaptive quasi-resonant controller is expressed as
v out = A | G ( j ω ) | sin ( ω 0 t + G ( j ω ) )
In Formula (20), { G ( j ω ) = π 2 arctan H K ω 0 M H ω 0 2 | G ( j ω ) | = H ω 0 ( M H ω 0 2 ) 2 + ( H K ω 0 ) 2 .
According to Figure 13 and Equation (20), when w0 in the resonance controller is a fixed value and the input signal frequency is w0, the output signal can be expressed as vout = (A/K)sin(w0t). Let K = 1; then, the input signal and output signal are in the same frequency and phase. When the frequency of vin is changed, the input signal can be expressed as vin = Asin((w0 + δ)t), and the relationship between vin and vout can be approximately linear in a small range centered on the zero crossing of vout. The error signals of vin and vout indicate the adjusting direction of the resonant frequency, ω0, of the resonance controller, that is, frequency control parameter M. Therefore, M can be adjusted in real time by the error signals of vin and vout so as to correct the resonant frequency from w0 to (w0 + δ) and meet the requirements of the adaptive resonant frequency of the quasi-resonant controller.
According to Figure 13, We can build the simulation of the adaptive quasi-resonant controller by setting K = 1 and H = 100. The control effect of the adaptive quasi-resonant controller is shown in Figure 14 when the amplitude, frequency, and phase of the input signal are changed and the DC flow is included.
Figure 14 shows the tracking effect of the adaptive quasi-resonant controller when the input signal frequency, amplitude, and phase are changed and the DC component is included. The simulation results in Figure 14a–c show that when the amplitude, frequency, and phase of the input voltage are suddenly changed at 0.3 s, the output signal of the adaptive quasi-resonant controller will change with the input signal to realize the real-time adjustment of the output signal amplitude, frequency, and phase. Figure 14d shows the tracking effect of the adaptive quasi-resonant controller on the AC signal when the input signal contains a DC component. In Figure 14d, the initial signal amplitude is 3 V, and the frequency is 20 Hz. We then add a DC component with an amplitude of 2 V at 0.3 s. At this time, the input voltage waveform shifts upward as a whole, but the output of the adaptive quasi-resonant controller remains unchanged, which proves that the output of the adaptive quasi-resonant controller is not affected by the DC component.

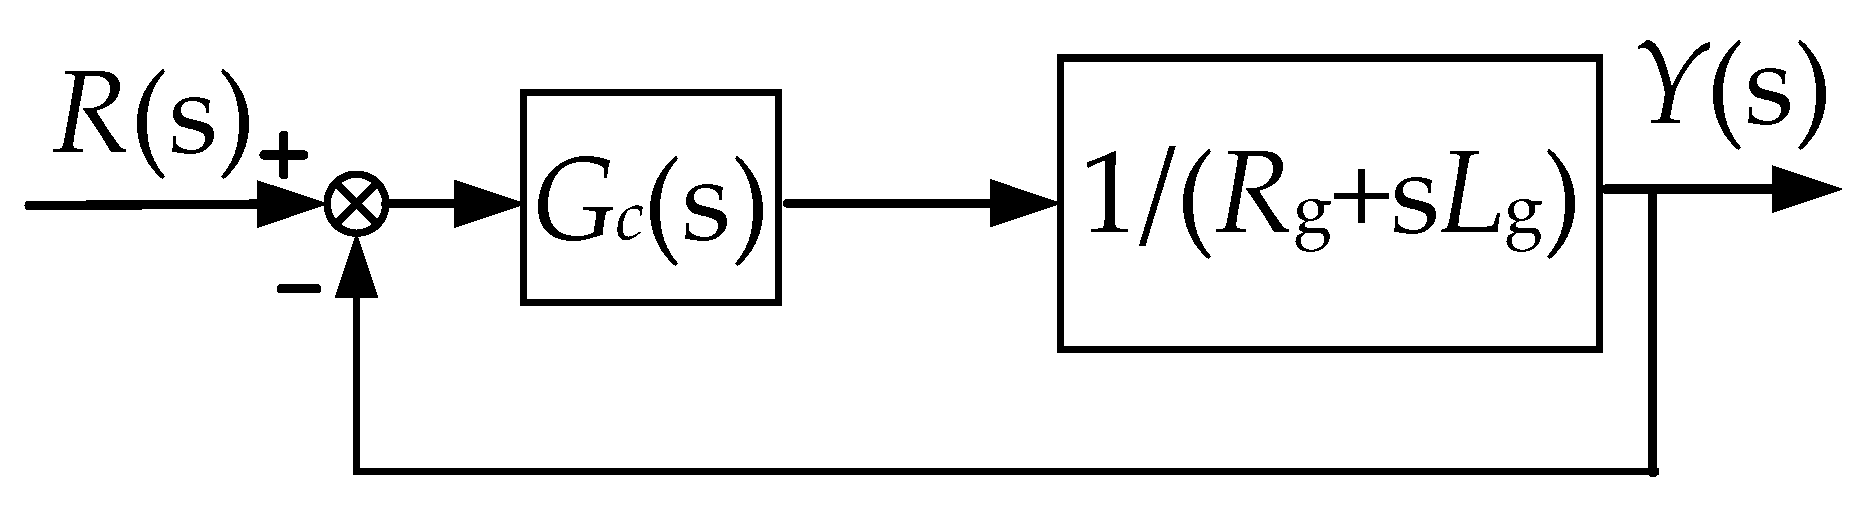
4.2. GSC Power Oscillation Suppression Strategy under SSO Considering PLL Influence

By taking into account the impact of grid SSO on GSC under the PLL disturbance in Section 2.3, it can be seen that the active power, Pg, of the GSC contains sub-synchronous components. The DFIG-GSC power suppression strategy proposed in this paper is shown in Figure 15.
In Figure 15, ① is the improved PLL with a series-resonant controller; ② is the main circuit topology of the GSC; ③ is the power calculation unit of the GSC circuit; and ④ is the DFIG-GSC power oscillation suppression strategy based on adaptive quasi-resonant control.
If the d-q axis coupling term is ignored, the GSC control object can be regarded as a resistive–inductive load. In the frequency domain, it can be expressed as
G g ( s ) = 1 R g + s L g
Therefore, the closed-loop control block diagram of the control system shown in Figure 15 can be simplified into the form of Figure 15.
In Figure 16, G(s) is the equivalent transfer function of the GSC control system.
The closed-loop transfer function and error function of the system can be obtained from Figure 16
Φ ( s ) = Y ( s ) R ( s ) = G c ( s ) G g ( s ) 1 + G c ( s ) G g ( s )
E ( s ) = R ( s ) Y ( s ) R ( s ) = 1 1 + G c ( s ) G g ( s )
It can be seen from Equations (22) and (23) that, when the gain of Gc(s) is infinite, the steady-state final value of the closed-loop transfer function is one, and the steady-state error is zero. The analysis in Section 2.4 shows that the quasi-resonant controller can provide a large gain at the resonant frequency, which just meets the requirements. Therefore, when designing the parameters of the adaptive quasi-resonant controller, the transfer function of the GSC control system should be able to meet the requirement of infinite gain.
According to Figure 15, after providing the improved PLL with a series-resonant controller, the phase required by the coordinate transformation unit in the GSC control strategy is the phase of the ideal voltage; at the same time, the oscillation of voltage amplitude estimation and electrical angular velocity estimation in the feedforward decoupling of the GSC control strategy is significantly reduced.
For the sub-synchronous component of the GSC control system, the synergy between the PI and the adaptive quasi-resonant controller is used to suppress it. The control process is as follows:
When the power grid operates stably, there is no oscillation component in the GSC system. The control objectives of GSC are to maintain the constant DC bus voltage, Vdc, and the converter power factor at one (the reactive power on the grid side is 0 var). At this time, the active power flowing through the GSC is the fundamental wave. It can be seen from Figure 14d that the adaptive quasi-resonant controller has no control effect on the DC component; that is, at this time, the output, vd2, of the adaptive quasi-resonant controller is zero, and only the PI controller can achieve the above objectives.
When there is SSO in the grid, the voltage and current on the grid side contain sub-synchronous components. According to Formula (14), the grid-side active power, Pg, flowing through the GSC will generate corresponding oscillation. Because the oscillation is AC flow and the amplitude of oscillation is high, the tracking control of the sub-synchronous component cannot be realized only by the PI controller.
In this paper, an adaptive quasi-resonant controller is used to suppress the oscillation component of the GSC system. The error between the reference value, P gsso * , of the GSC’s active power oscillation and the actual value of Pg is used as the input signal of the adaptive quasi-resonant controller to realize the tracking of the oscillation component without static error so as to meet the goal of GSC power oscillation suppression. The Pgsso with oscillation is input into the adaptive quasi-resonant controller for control, and the frequency of the input sub-synchronous component is tracked in real time through the adaptive algorithm. The resonance control voltage, vd2, output by the adaptive quasi-resonant controller is an AC signal that has the same amplitude, frequency, and phase as the sub-synchronous component in the input signal. As the control voltage suppresses the sub-synchronous component in Pg, vd2 is combined with the control voltage, vd1, generated by the PI controller to regulate the opening and closing of the GSC switch by the SVPWM, and finally, the oscillation component in the GSC active power Pg is suppressed by the current control.
In the above process, a PI controller is used to adjust the fundamental component in the Pg, and an adaptive quasi-resonant controller is used to suppress the sub-synchronous component, Pgsso. The cooperative control of the PI and the adaptive quasi-resonant controller effectively suppresses the oscillation power of the GSC when power grid SSO occurs, enhancing the stability of the GSC system.

5. Simulation Analysis and Experimental Verification

5.1. Simulation Analysis

In this paper, a DFIG-GSC power oscillation suppression strategy based on an adaptive quasi-resonant controller is proposed. The effect of the quasi-resonant controller and the adaptive quasi-resonant controller on GSC power oscillation suppression is verified at a sub-synchronous speed of 1400 r/min and a super-synchronous speed of 1800 r/min. The simulation results of the sub-synchronous speed are shown in Figure 17 and Figure 18, and the simulation results of the super-synchronous speed are shown in Figure 19 and Figure 20.
The simulation condition is that the quasi-resonant controller and adaptive quasi-resonant controller are put into operation when the power grid is in an SSO state. The resonance frequency, w0, of the quasi-resonant controller is 40 Hz, and the SSO voltage amplitude is 20% of the fundamental voltage amplitude. Observe the Pg of the GSC system when the SSO frequency is 10 Hz and 30 Hz and the quasi-resonant controller and adaptive quasi-resonant controller are used.
It can be seen in Figure 17, Figure 18, Figure 19 and Figure 20 that, when SSO occurs in the grid, the DFIG operates at a sub-synchronous or super-synchronous speed, and the Pg flowing through the GSC generates oscillation components. The simulation results in Figure 17, Figure 18, Figure 19 and Figure 20 show that the quasi-resonant controller can significantly suppress the Pg of the GSC system when the power grid SSO frequency is 10 Hz, and the speed has no effect on the oscillation suppression strategy. When the SSO frequency of the power grid changes to 30 Hz, the oscillation frequency of the Pg in the GSC system is 20 Hz. Because the resonance frequency of the quasi-resonant controller, w0, is fixed at 40 Hz, the Pg oscillation frequency exceeds the control range of the quasi-resonant controller and cannot provide sufficient gain required for control. Therefore, the sub-synchronous component in Pg cannot be suppressed by the quasi-resonant controller. The simulation results in Figure 17, Figure 18, Figure 19 and Figure 20 show that the adaptive quasi-resonant controller can effectively suppress the oscillation of the Pg in the GSC system when the SSO frequency of the power grid is 10 Hz and 30 Hz, and the change in SSO frequency has no effect on the suppression effect of the adaptive quasi-resonant controller. The above simulation results confirm the effectiveness of the proposed suppression strategy.

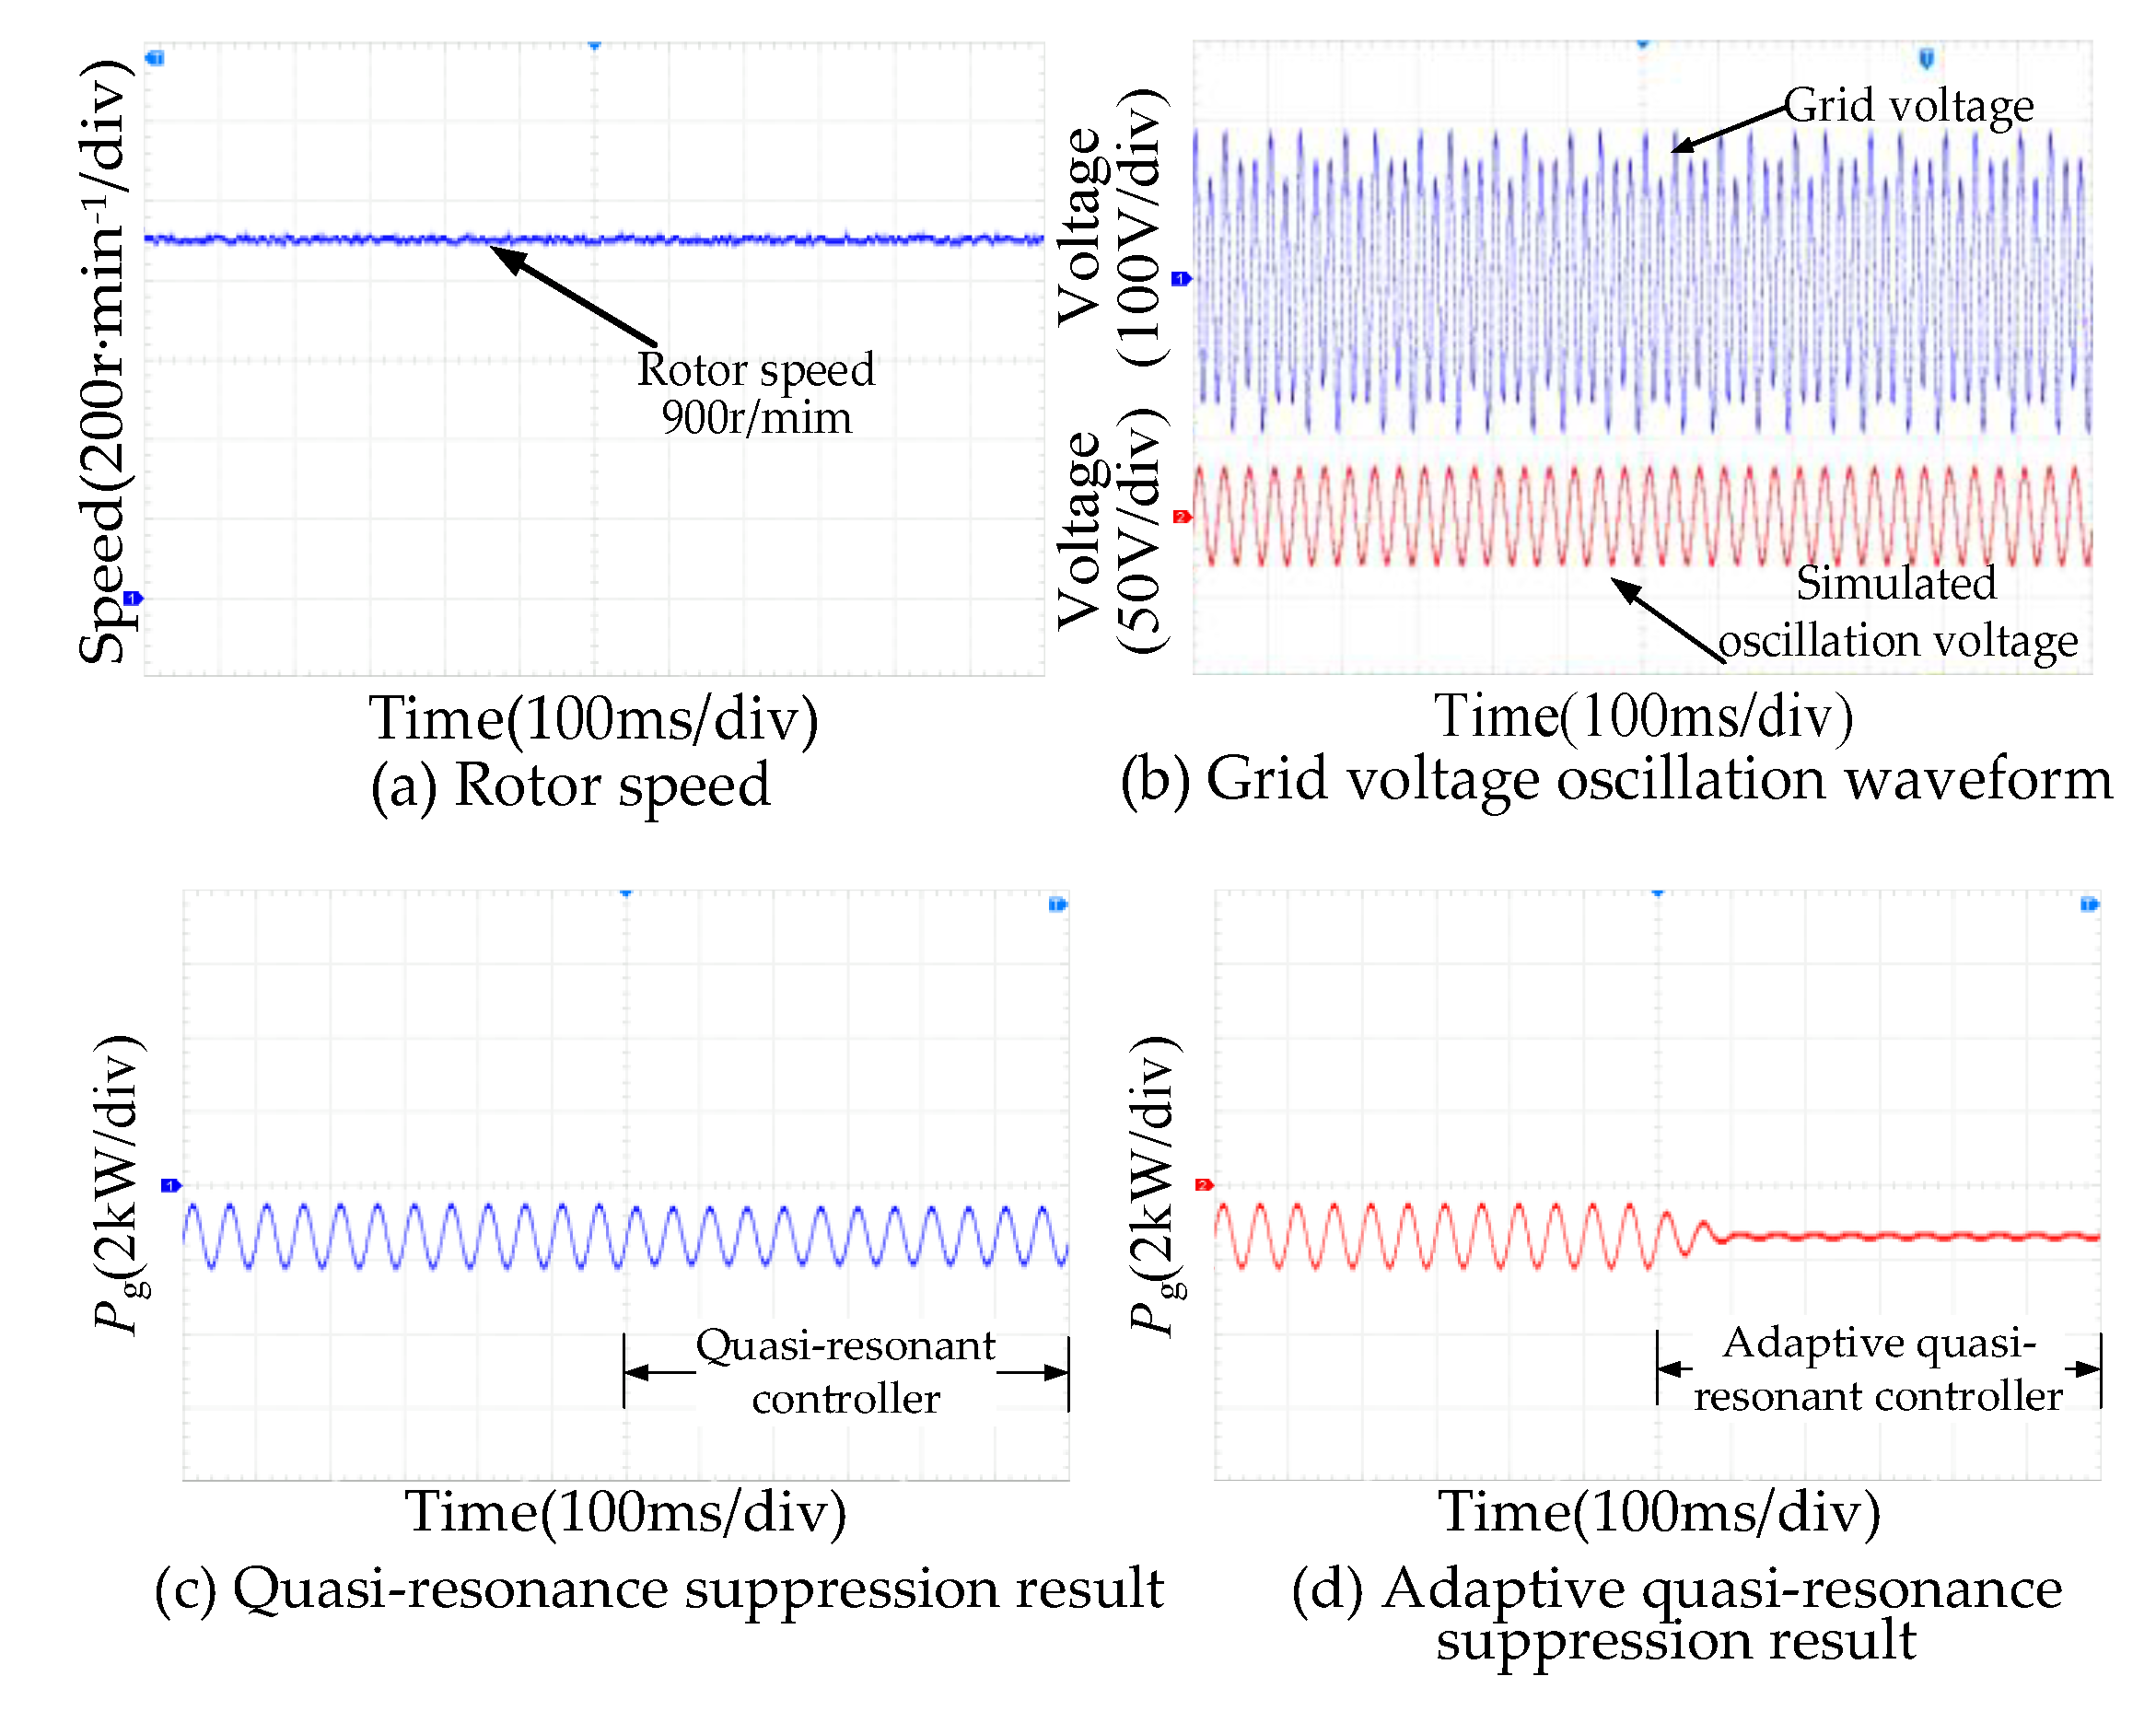
5.2. Experimental Verification

In this paper, a 15 kW doubly-fed wind power system experimental platform is built to verify the effectiveness of the proposed suppression strategy. The hardware implementation diagram is shown in Figure 21. The parameters of the experimental platform are shown in Table A2 in the Appendix A.
In Figure 21, The DFIG experimental platform is composed of a simulated wind turbine-DFIG system, a simulated grid, a GSC control system, an RSC control system, an SSO simulation system, a variable resistance load, and a related sampling circuit.
The analog fan-DFIG system is generated by the asynchronous motor driven by the frequency converter. The input port of the frequency converter is connected to the ideal three-phase power grid, and the output port of the frequency converter is connected to the asynchronous motor. The required speed is obtained by adjusting the frequency converter, and then, the DFIG rotor is driven to rotate; the simulated power grid is generated by the synchronous motor; both the GSC and RSC use DSPF28335 as the control chip; the SSO simulation system is generated by another synchronous motor; and the frequency of the output voltage of the synchronous motor is adjusted by the frequency converter so that the SSO of the power grid at any frequency can be simulated. The programs of the quasi-resonant control and adaptive quasi-resonant control are written into the GSC control board to realize the adjustment of the GSC.
Before the test, it is necessary to verify whether the DFIG meets the grid connection requirements. The waveforms of the DFIG stator phase A voltage and the analog grid phase A voltage before the grid connection are shown in Figure 22. In Figure 22, the DFIG stator voltage is the same as the grid voltage amplitude, frequency, phase, and phase sequence, so the DFIG system meets the grid connection requirements.
After the grid connection conditions are met, it is necessary to verify whether the SSO analog motor has been successfully put into the simulated power grid. Figure 23 shows that the SSO voltage is put into operation at T1 when the simulated power grid operates stably. The experimental results show that, when the SSO voltage is applied at T1, the simulated grid voltage will oscillate accordingly.
In the SSO suppression experiment of the GSC system, the DFIG stator output power is set to 5 kW, the SSO voltage amplitude is 20% of the simulated grid voltage amplitude with frequencies of 10 Hz and 30 Hz, and the resonant frequency of the quasi-resonant controller is 40 Hz. The experiment is carried out at a sub-synchronous speed of 900 r/min and a super-synchronous speed of 1200 r/min in DFIG. The rotor speed, grid voltage waveform, analog oscillation voltage waveform, and GSC active power, Pg, waveform before and after oscillation suppression are obtained through the sampling circuit.
(1)
The experimental results of the SSO oscillation suppression at sub-synchronous speeds are shown in Figure 24 and Figure 25.
(2)
The experimental results of the SSO oscillation suppression at super-synchronous speeds are shown in Figure 26 and Figure 27.
The experimental results in Figure 24, Figure 25, Figure 26 and Figure 27 show that the adaptive quasi-resonant controller can effectively suppress the oscillation of active power, Pg, at different frequencies in the GSC system at any DFIG speed. However, the quasi-resonant controller can only suppress the oscillation power with the same resonant frequency.
Finally, the effect of suppressing the oscillation power, Pgsso, of the GSC system is verified under the condition that the SSO frequency mutates. The experimental results are shown in Figure 28.
In Figure 28a, the SSO voltage oscillation amplitude is 20% of the simulated grid voltage amplitude, and the initial frequency is 10 Hz. Figure 28b shows the comparison results of the Pg oscillation amplitude before and after oscillation suppression. The adaptive quasi-resonant controller is put into operation at T1 for control. By observing the Pg waveform in Figure 28c,d, the oscillation component in Pg is significantly weakened after the adaptive quasi-resonant controller is put into operation. Therefore, the adaptive quasi-resonant controller can suppress an SSO of 10 Hz at different speeds. At T2, the SSO frequency of the power grid suddenly changes to 25 Hz. The adaptive quasi-resonant controller can control the Pg after the SSO frequency changes. After the SSO frequency changes for about 90ms, the oscillation component in the Pg is suppressed. The experiment proves that the oscillation suppression strategy designed in this paper can suppress the oscillation component in Pg when the SSO frequency changes.

6. Conclusions

In this paper, the multiple disturbance factors of power grid SSO to GSC are studied. Considering the interference of the PLL to the GSC control system and the influence of the SSO frequency change on the power oscillation suppression strategy, a comprehensive strategy for suppressing GSC power oscillation is proposed. resonance controller is added to the PLL to improve the accuracy of the PLL output phase. At the same time, an adaptive quasi-resonant controller is proposed to suppress the active power oscillation of the GSC system. The conclusions of this paper are as follows:
(1)
The improved PLL with a series-resonant controller can accurately lock the amplitude, electrical angular velocity, and phase of the fundamental voltage of the power grid, thus eliminating the current disturbance caused by the grid-side oscillating current and phase-locked error, effectively reducing the oscillation component of the current inner loop feedback and feedforward decoupling compensation link.
(2)
The research shows that the change in SSO frequency has a great influence on the suppression effect of the resonance controller. Aiming at this problem, this paper proposes an adaptive quasi-resonant controller to suppress the oscillation component of the GSC active power, which can suppress the oscillation of the active power in the GSC system under all operating conditions.
(3)
Through simulation and experimental verification, the suppression strategy proposed in this paper can effectively suppress the oscillation component of active power in the GSC system and can quickly suppress the oscillation of power in the case of SSO frequency changes so as to ensure the stability of active power in the GSC system.
In a future study, we will focus on simplifying the control algorithm and developing low-cost control systems, such as specialized chips and a low-cost digital control system. We will also consider the development direction of new energy power generation systems from the perspective of economics and put forward valuable research for the development of a low-carbon economy [32].

Author Contributions

Conceptualization, D.-Y.S. and Z.-J.Q.; methodology, W.-Q.S.; software, W.-Q.S.; validation, Z.-J.Q. and W.-Q.S.; formal analysis, D.-Y.S.; investigation, K.Z.; resources, D.-Y.S.; data curation, Q.-G.C.; writing—original draft preparation, W.-Q.S. and Z.-J.Q.; writing—review and editing, Z.-J.Q.; visualization, W.-Q.S.; supervision, Z.-J.Q. and N.-Z.J.; project administration, D.-Y.S.; funding acquisition, D.-Y.S. All authors have read and agreed to the published version of the manuscript.

Funding

This research received no external funding.

Data Availability Statement

Due to privacy restrictions, research data in manuscripts cannot be disclosed.

Conflicts of Interest

The authors declare no conflict of interest.

Appendix A

In Figure 2, ugd0, ugq0, igd0, and igq0 are the voltage and current values of the grid’s fundamental wave voltage and current in the d-q coordinate system at coordinate transformation angle θ1; ugd1, ugq1, igd1, and igq1 are the effects of the error phase on the fundamental voltage and current in the d-q coordinate system; ugd2, ugq2, igd2, and igq2 are the voltage and current values of the grid SSO voltage and current in the d-q coordinate system at coordinate transformation angle θ1; ugd3, ugq3, igd3, and igq3 are the effects of the error phase on the SSO voltage and current in the d-q coordinate system; and ωerror is the error value of electrical angular velocity under the SSO state of the power grid.
Table A1. Simulation-related parameters.
ParametersValueParametersValue
Rated power2 MWStator resistance2.6 × 10−3 Ω
Stator voltage690 VStator leakage8.7 × 10−5 H
Rated frequency50 HzRotor resistance2.61 × 10−2 Ω
Motor pole pairs2Rotor leakage7.83 × 10−4 H
Incoming inductance2 × 10−4 HMutual inductance2.5 × 10−3 H
DC bus capacitance2.88 × 10−2 FDC side voltage1500 V
Table A2. DFIG experimental-platform-related parameters.
ParametersValueParametersValue
Rated power15 kWStator resistance3.79 × 10−1 Ω
Stator voltage200 VStator leakage1.1 × 10−3 H
Rated frequency50 HzRotor resistance3.14 × 10−1 Ω
Motor pole pairs3Rotor leakage2.2 × 10−3 H
Incoming inductance5 × 10−3 HMutual Inductance4.27 × 10−2 H
DC bus capacitance2.2 × 10−3 FDC side voltage400 V
Voltage outer loop KP0.7Voltage outer loop Ki4
Current inner loop KP3Current inner loop KI15
KR in PR controller40wc in PR controller2 rad/s

References

  1. Perera, U.; Oo, A.M.T.; Zamora, R. Sub Synchronous Oscillations under High Penetration of Renewables—A Review of Existing Monitoring and Damping Methods, Challenges, and Research Prospects. Energies 2022, 15, 8477. [Google Scholar] [CrossRef]
  2. Sun, D.; Meng, F.; Shen, W. Study on Suppression Strategy for Broadband Sub-Synchronous Oscillation in Doubly-Fed Wind Power Generation System. Appl. Sci. 2022, 12, 8344. [Google Scholar] [CrossRef]
  3. Mohale, V.; Chelliah, T.R. Impact of Fixed/Variable Speed Hydro, Wind, and Photovoltaic on Sub-Synchronous Torsional Oscillation—A Review. Sustainability 2023, 15, 113. [Google Scholar] [CrossRef]
  4. Puchalapalli, S.; Singh, B. A novel control scheme forwind turbine driven DFIG interfaced to utility grid. IEEE Trans. Ind. Appl. 2020, 56, 2925–2937. [Google Scholar] [CrossRef]
  5. Chen, G.; Li, M.; Xu, T.; Zhang, J.; Wang, C. Practice and Challenge of Renewable Energy Development Based on Interconnected Power Grids. Power Syst. Technol. 2017, 41, 3095–3103. [Google Scholar]
  6. Wang, Y.; Wu, L.; Chen, S. A Simplified Model of the HVDC Transmission System for Sub-Synchronous Oscillations. Sustainability 2023, 15, 7444. [Google Scholar] [CrossRef]
  7. Li, H.; Chen, Y.; Li, Y.; Liu, S.; Yang, D.; Liang, Y.; Lan, Y. Impact of DFIG-based wind farms interconnected to power grid on subsynchronous oscillation of turbogenerator. Electr. Mach. Control 2015, 19, 47–54. [Google Scholar]
  8. Liu, Y.; Guo, G.; Wang, X.; Wang, H.; Wang, L. Sub-Synchronous Oscillation Suppression Strategy Based on Impedance Modeling by Attaching Virtual Resistance Controllers for Doubly-Fed Induction Generator. Electronics 2022, 11, 2272. [Google Scholar] [CrossRef]
  9. Peng, X.; Chen, R.; Zhou, J.; Qin, S.; Bi, R.; Sun, H. Research on Mechanism and Damping Control Strategy of DFIG-Based Wind Farm Grid-Connected System SSR Based on the Complex Torque Method. Electronics 2021, 10, 1640. [Google Scholar] [CrossRef]
  10. Xue, A.; Wu, Y.; Wang, Z.; Li, J.; Bi, T. Analysis of frequency response of DFIG system under subsynchronous disturbance. Power Syst. Technol. 2018, 42, 1804–1810. [Google Scholar]
  11. Velichko, A. A Method for Evaluating Chimeric Synchronization of Coupled Oscillators and Its Application for Creating a Neural Network Information Converter. Electronics 2019, 8, 756. [Google Scholar] [CrossRef]
  12. Xue, F.; Wu, J.; Cui, X.; Feng, J.; Xu, J.; Xu, H. Sub-synchronous oscillation control strategy based on impedance identification for Guyuan wind power grid-connected system. Autom. Electr. Power Syst. 2023, 47, 200–207. [Google Scholar]
  13. Yan, X.; Chang, W.; Cui, S.; Rasool, A.; Jia, J.; Sun, Y. Recurrence of Sub-Synchronous Oscillation Accident of Hornsea Wind Farm in UK and Its Suppression Strategy. Energies 2021, 14, 7685. [Google Scholar] [CrossRef]
  14. Xiang, S.; Su, P.; Wu, X.; Yang, H.; Wang, C. Comparative Study and Optimal Design of Subsynchronous Damping Controller in Doubly Fed Induction Generator. Sustainability 2022, 14, 13095. [Google Scholar] [CrossRef]
  15. Wang, Y.; Wu, L.; Chen, S. Study on the Mode and Characteristics of SSOs in Hybrid AC–DC Transmission Systems via Multitype Power Supply. Sustainability 2023, 15, 6763. [Google Scholar] [CrossRef]
  16. Jiang, Q.; Wang, Y. Overview of the Analysis and Mitigation Methods of Electromagnetic Oscillations in Power Systems With High Proportion of Power Electronic Equipment. Proc. CSEE 2020, 40, 7185–7201. [Google Scholar]
  17. Xiao, X.; Luo, C.; Liao, K. Review of the Research on Subsynchronous Oscillation Issues in Electric Power System with Renewable Energy Sources. Trans. China Electrotech. Soc. 2017, 32, 85–97. [Google Scholar]
  18. Wang, W.; Zhang, C.; He, G.; Li, G.; Zhang, J.; Wang, H. Overview of research on subsynchronous oscillations in large-scale wind farm integrated system. Power Syst. Technol. 2017, 41, 1050–1060. [Google Scholar]
  19. Xie, X.; Wang, L.; He, J.; Liu, H.; Wang, C.; Zhan, Y. Analysis of subsynchronous resonance/oscillation types in power systems. Power Syst. Technol. 2017, 41, 1043–1049. [Google Scholar]
  20. Mohammadpour, H.A.; Santi, E. Optimal adaptive sub-synchronous resonance damping controller for a series-compensated doubly-fed induction generator-based wind farm. IET Renew. Power Gener. 2015, 9, 669–681. [Google Scholar] [CrossRef]
  21. Zhang, C.; Wang, W.; He, G.; Li, G.; Wang, H.; Tian, Y. Analysis of Sub-Synchronous Oscillation of Full-converter Wind Farm Based on Sequence Impedance and An Optimized Design Method for PLL Parameters. Proc. CSEE 2017, 37, 6757–6767. [Google Scholar]
  22. Yan, X.; Chang, W.; Cui, S.; Xun, Y.; Jia, J. Sub-synchronous oscillation suppression strategy of weak AC wind power system with static var compensator based on linear active disturbance rejection control. Trans. China Electrotech. Soc. 2022, 37, 2825–2836. [Google Scholar]
  23. Gao, B.; Hu, Y.; Li, R.; Yao, L.; Zhao, S. Research on subsynchronous control interaction mitigation strategy based on active disturbance rejection control for doubly-fed induction generator. Power Syst. Technol. 2019, 43, 655–664. [Google Scholar]
  24. Wu, X.; Wang, M.; Shahidehpour, M.; Feng, S.; Chen, X. Model-free adaptive control of STATCOM for SSO mitigation in DFIG-Based wind farm. IEEE Trans. Power Syst. 2021, 36, 5282–5293. [Google Scholar] [CrossRef]
  25. Zhao, R. Investigation of the AC-Excited Power Supply of a Variable-Speed Constant-Frequency Wind Energy Generation System with Doubly-Fed Induction Generator. Ph.D. Thesis, Zhejiang University, Hangzhou, China, 2005. [Google Scholar]
  26. Ren, H. Subsynchronous Oscillation Suppression of Grid-Connected Doubly-Fed Wind Power Generation System. Master’s Thesis, Harbin Institute of Technology, Harbin, China, 2019. [Google Scholar]
  27. Zhang, X. Double-Fed Wind Power Generation and Its Subsynchronous Oscillation Analysis and Suppression. Master’s Thesis, Harbin Institute of Technology, Harbin, China, 2018. [Google Scholar]
  28. Hou, P.; Song, R.; Li, G. Subsynchronous oscillation mitigation method for wind turbines based on additional proportional resonance control. Proc. CSEE 2021, 41, 3797–3807. [Google Scholar]
  29. Chuan, H.; Fazeli, S.M.; Wu, Z. Mitigating the torque ripple in electric traction using proportional integral resonant controller. IEEE Trans. Veh. Technol. 2020, 69, 10820–10831. [Google Scholar] [CrossRef]
  30. Meng, F.; Sun, D.; Zhou, K.; Wu, J.; Zhao, F.; Sun, L. A sub-synchronous oscillation suppression strategy for doubly fed wind power generation system. IEEE Access 2021, 9, 83482–83498. [Google Scholar] [CrossRef]
  31. Wang, Z.; Pan, Z.; Xu, Z. Control strategy of island effect of double-fed wind turbine with nonlinear loads. Acta Energ. Sol. Sin. 2015, 36, 1791–1798. [Google Scholar]
  32. Elkhan, R.S. Resource rents, savings behavior, and scenarios of economic development. Resour. Policy 2023, 81, 103258. [Google Scholar]
Figure 1. Diagram of multi-disturbance factors in a GSC system of a power grid in an SSO state.
Electronics 12 02293 g001
Figure 2. The schematic diagram of grid SSO disturbance to the GSC control strategy considering PLL disturbance.
Electronics 12 02293 g002
Figure 3. Estimated value of PLL angular velocity and phase in the grid SSO state.
Electronics 12 02293 g003
Figure 4. Estimated PLL output voltage in the SSO state of the grid.
Electronics 12 02293 g004
Figure 5. Voltage spectrum analysis in the d-q coordinate system under SSO.
Electronics 12 02293 g005
Figure 6. Bode diagram of a quasi-resonant controller.
Electronics 12 02293 g006
Figure 7. Quasi-resonant control effect of SSO variation on sub-synchronization speed.
Electronics 12 02293 g007
Figure 8. Quasi-resonant control effect of SSO variation on super-synchronization speed.
Electronics 12 02293 g008
Figure 9. Bode diagram of the resonant controller.
Electronics 12 02293 g009
Figure 10. Improved PLL structure diagram of the series-resonant controller.
Electronics 12 02293 g010
Figure 11. The simulation results of the improved PLL.
Electronics 12 02293 g011
Figure 12. Voltage spectrum analysis of improved PLL in d-q coordinate system in an SSO state of the power grid.
Electronics 12 02293 g012
Figure 13. Adaptive quasi-resonant controller control block diagram.
Electronics 12 02293 g013
Figure 14. Output characteristic diagram of the adaptive quasi-resonant controller.
Electronics 12 02293 g014aElectronics 12 02293 g014b
Figure 15. DFIG-GSC power oscillation suppression strategy.
Electronics 12 02293 g015
Figure 16. Grid-side converter closed-loop control block diagram.
Electronics 12 02293 g016
Figure 17. Oscillation suppression waveform diagram showing a sub-synchronous grid SSO frequency of 10 Hz.
Electronics 12 02293 g017
Figure 18. Oscillation suppression waveform when the SSO frequency of the sub-synchronous grid is 30 Hz.
Electronics 12 02293 g018
Figure 19. Oscillation suppression waveform when SSO the frequency of the super-synchronous power grid is 10 Hz.
Electronics 12 02293 g019
Figure 20. Oscillation suppression waveform when the SSO frequency of the super-synchronous power grid is 30 Hz.
Electronics 12 02293 g020
Figure 21. DFIG system experimental platform hardware implementation diagram.
Electronics 12 02293 g021
Figure 22. Output voltage between the grid and DFIG before grid connection.
Electronics 12 02293 g022
Figure 23. Grid voltage waveform under SSO.
Electronics 12 02293 g023
Figure 24. Oscillation suppression contrast waveform at an SSO frequency of 10 Hz at a sub-synchronous speed.
Electronics 12 02293 g024
Figure 25. Oscillation suppression contrast waveform at an SSO frequency of 30 Hz at a sub-synchronous speed.
Electronics 12 02293 g025
Figure 26. Oscillation suppression contrast waveform at an SSO frequency of 10 Hz at a super-synchronous speed.
Electronics 12 02293 g026
Figure 27. Oscillation suppression contrast waveform at an SSO frequency of 30 Hz at a super-synchronous speed.
Electronics 12 02293 g027aElectronics 12 02293 g027b
Figure 28. The suppression effect of the adaptive quasi-resonant controller when the SSO frequency changes.
Electronics 12 02293 g028
Disclaimer/Publisher’s Note: The statements, opinions and data contained in all publications are solely those of the individual author(s) and contributor(s) and not of MDPI and/or the editor(s). MDPI and/or the editor(s) disclaim responsibility for any injury to people or property resulting from any ideas, methods, instructions or products referred to in the content.

