
An Extended Approach to the Evaluation of Energy Storage Systems: A Case Study of Li-Ion Batteries

Abstract
:1. Introduction
- Providing an extended methodology applied to Li-ion batteries that includes environmental, economic and supply risk features; the latter ones are investigated for the manufacturing and the use phase of the batteries.
- Exploiting the methodology to assess the variability of these features according to the service provided by Li-ion batteries.
- Section 2 presents the metrics deployed for the proposed assessment, as well as the case study.
- Section 3 shows the quantitative estimation of the analysis, sub-divided for each deployed metric; furthermore, a sensitivity analysis and a discussion of the overall results are carried out.
- Section 4 presents the main achievements of this work, the concluding remarks and the possible future applications.
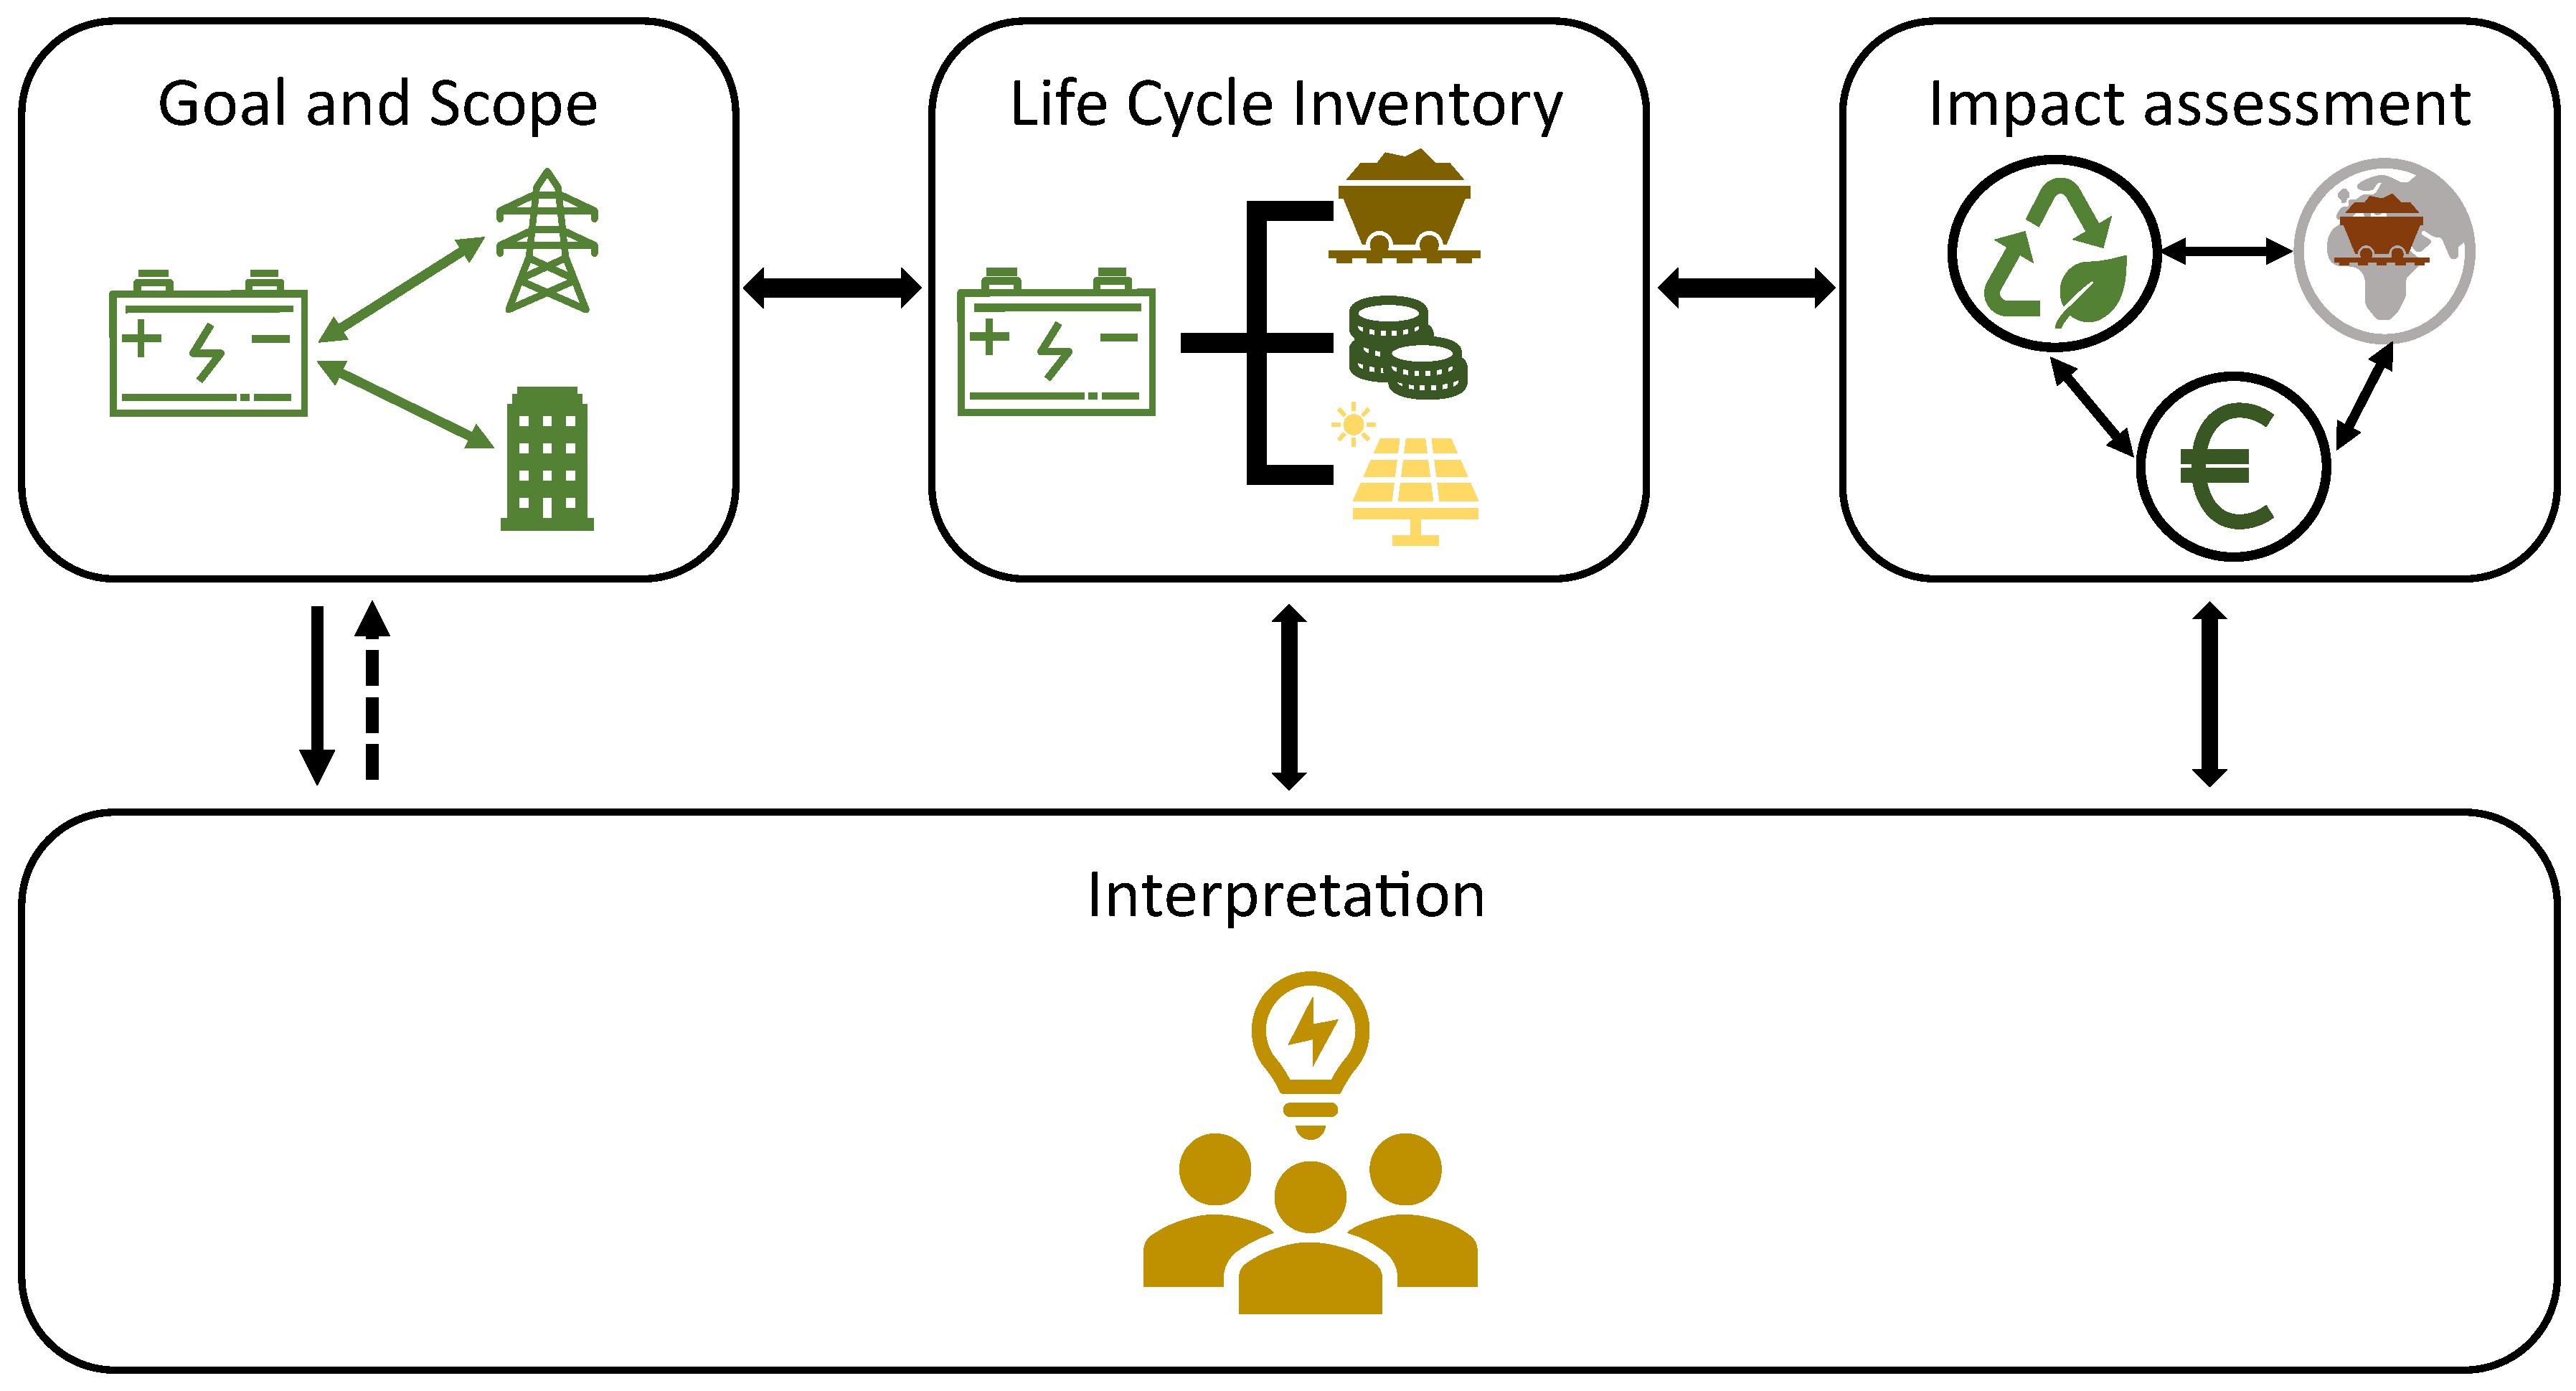
2. Materials and Methods
2.1. Characterization of the Energy Storage Use: Overview of the Electrical Services
2.2. Domains of the Analysis
2.2.1. Economic Domain: Life Cycle Costing (LCC)
2.2.2. Environmental Domain: Environmental Life Cycle Assessment (eLCA)
2.2.3. Geopolitical Domain: Geopolitical Risk of Materials (GRMs)
- Lithium Iron Phospate Oxide ();
- Natural Graphite;
- Copper;
- Aluminium.
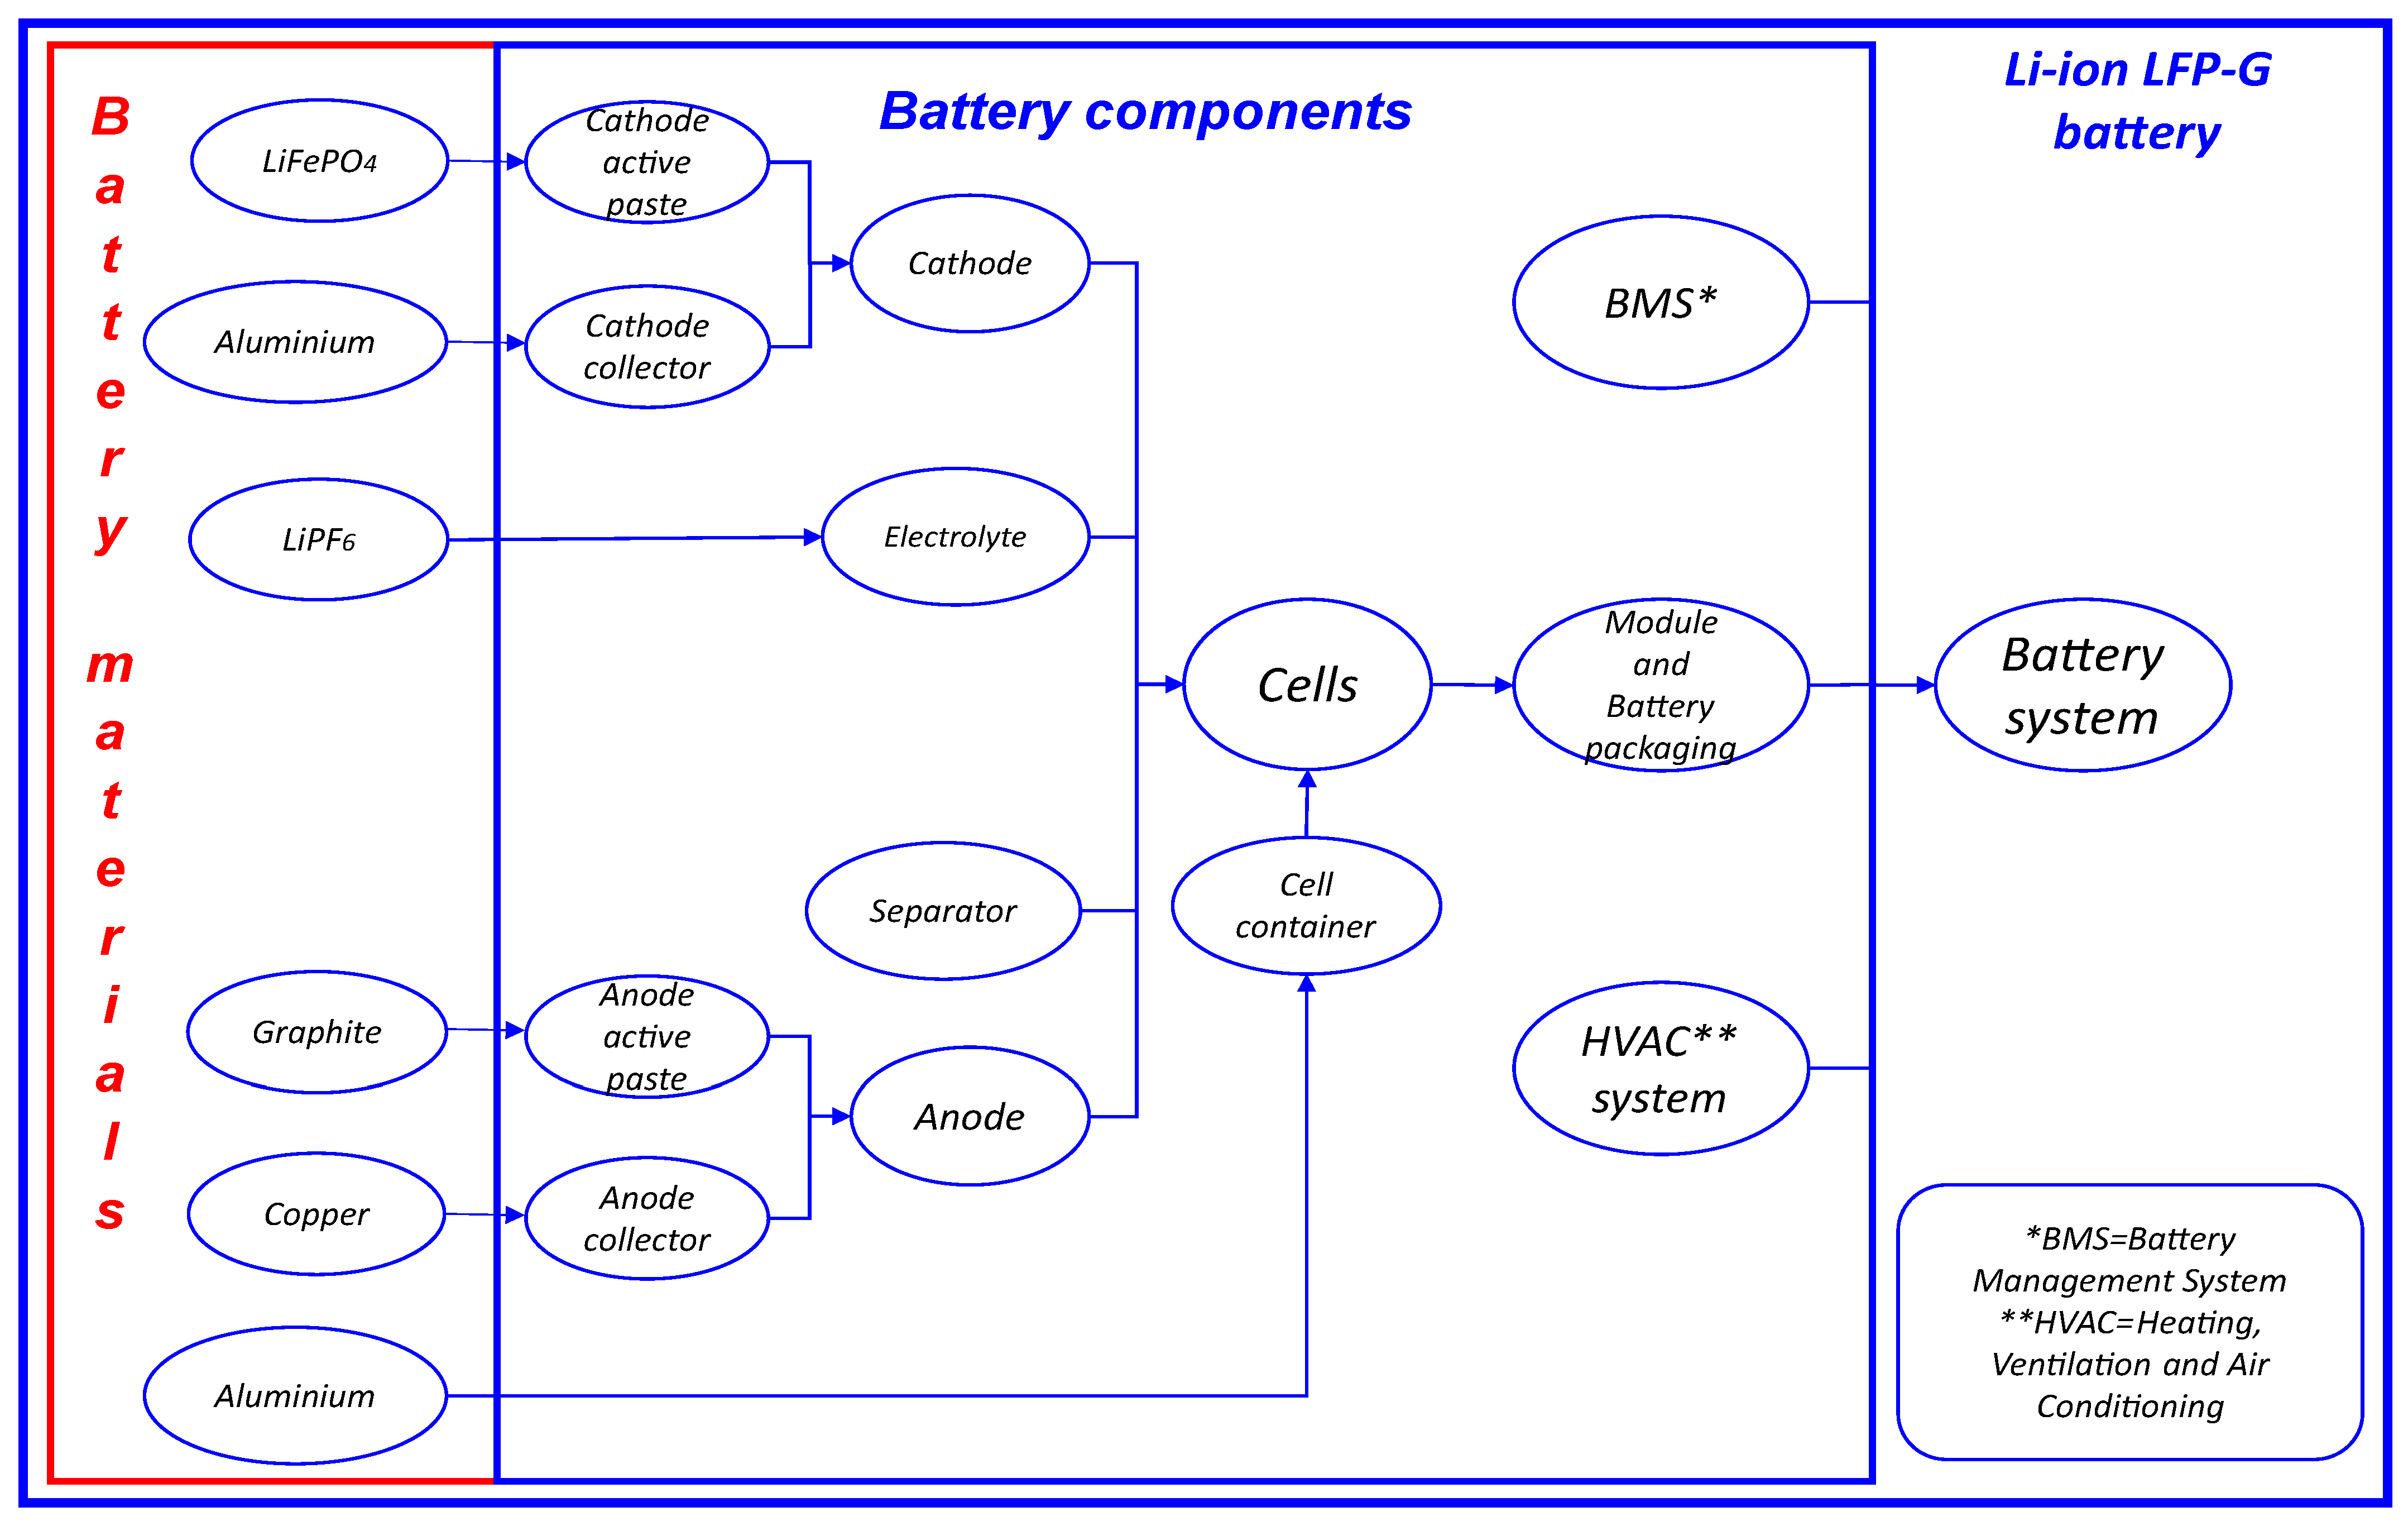
2.3. Case Study
2.3.1. Features of the Batteries under Investigation
2.3.2. Scenarios
2.3.3. Economic Data
3. Results and Discussion
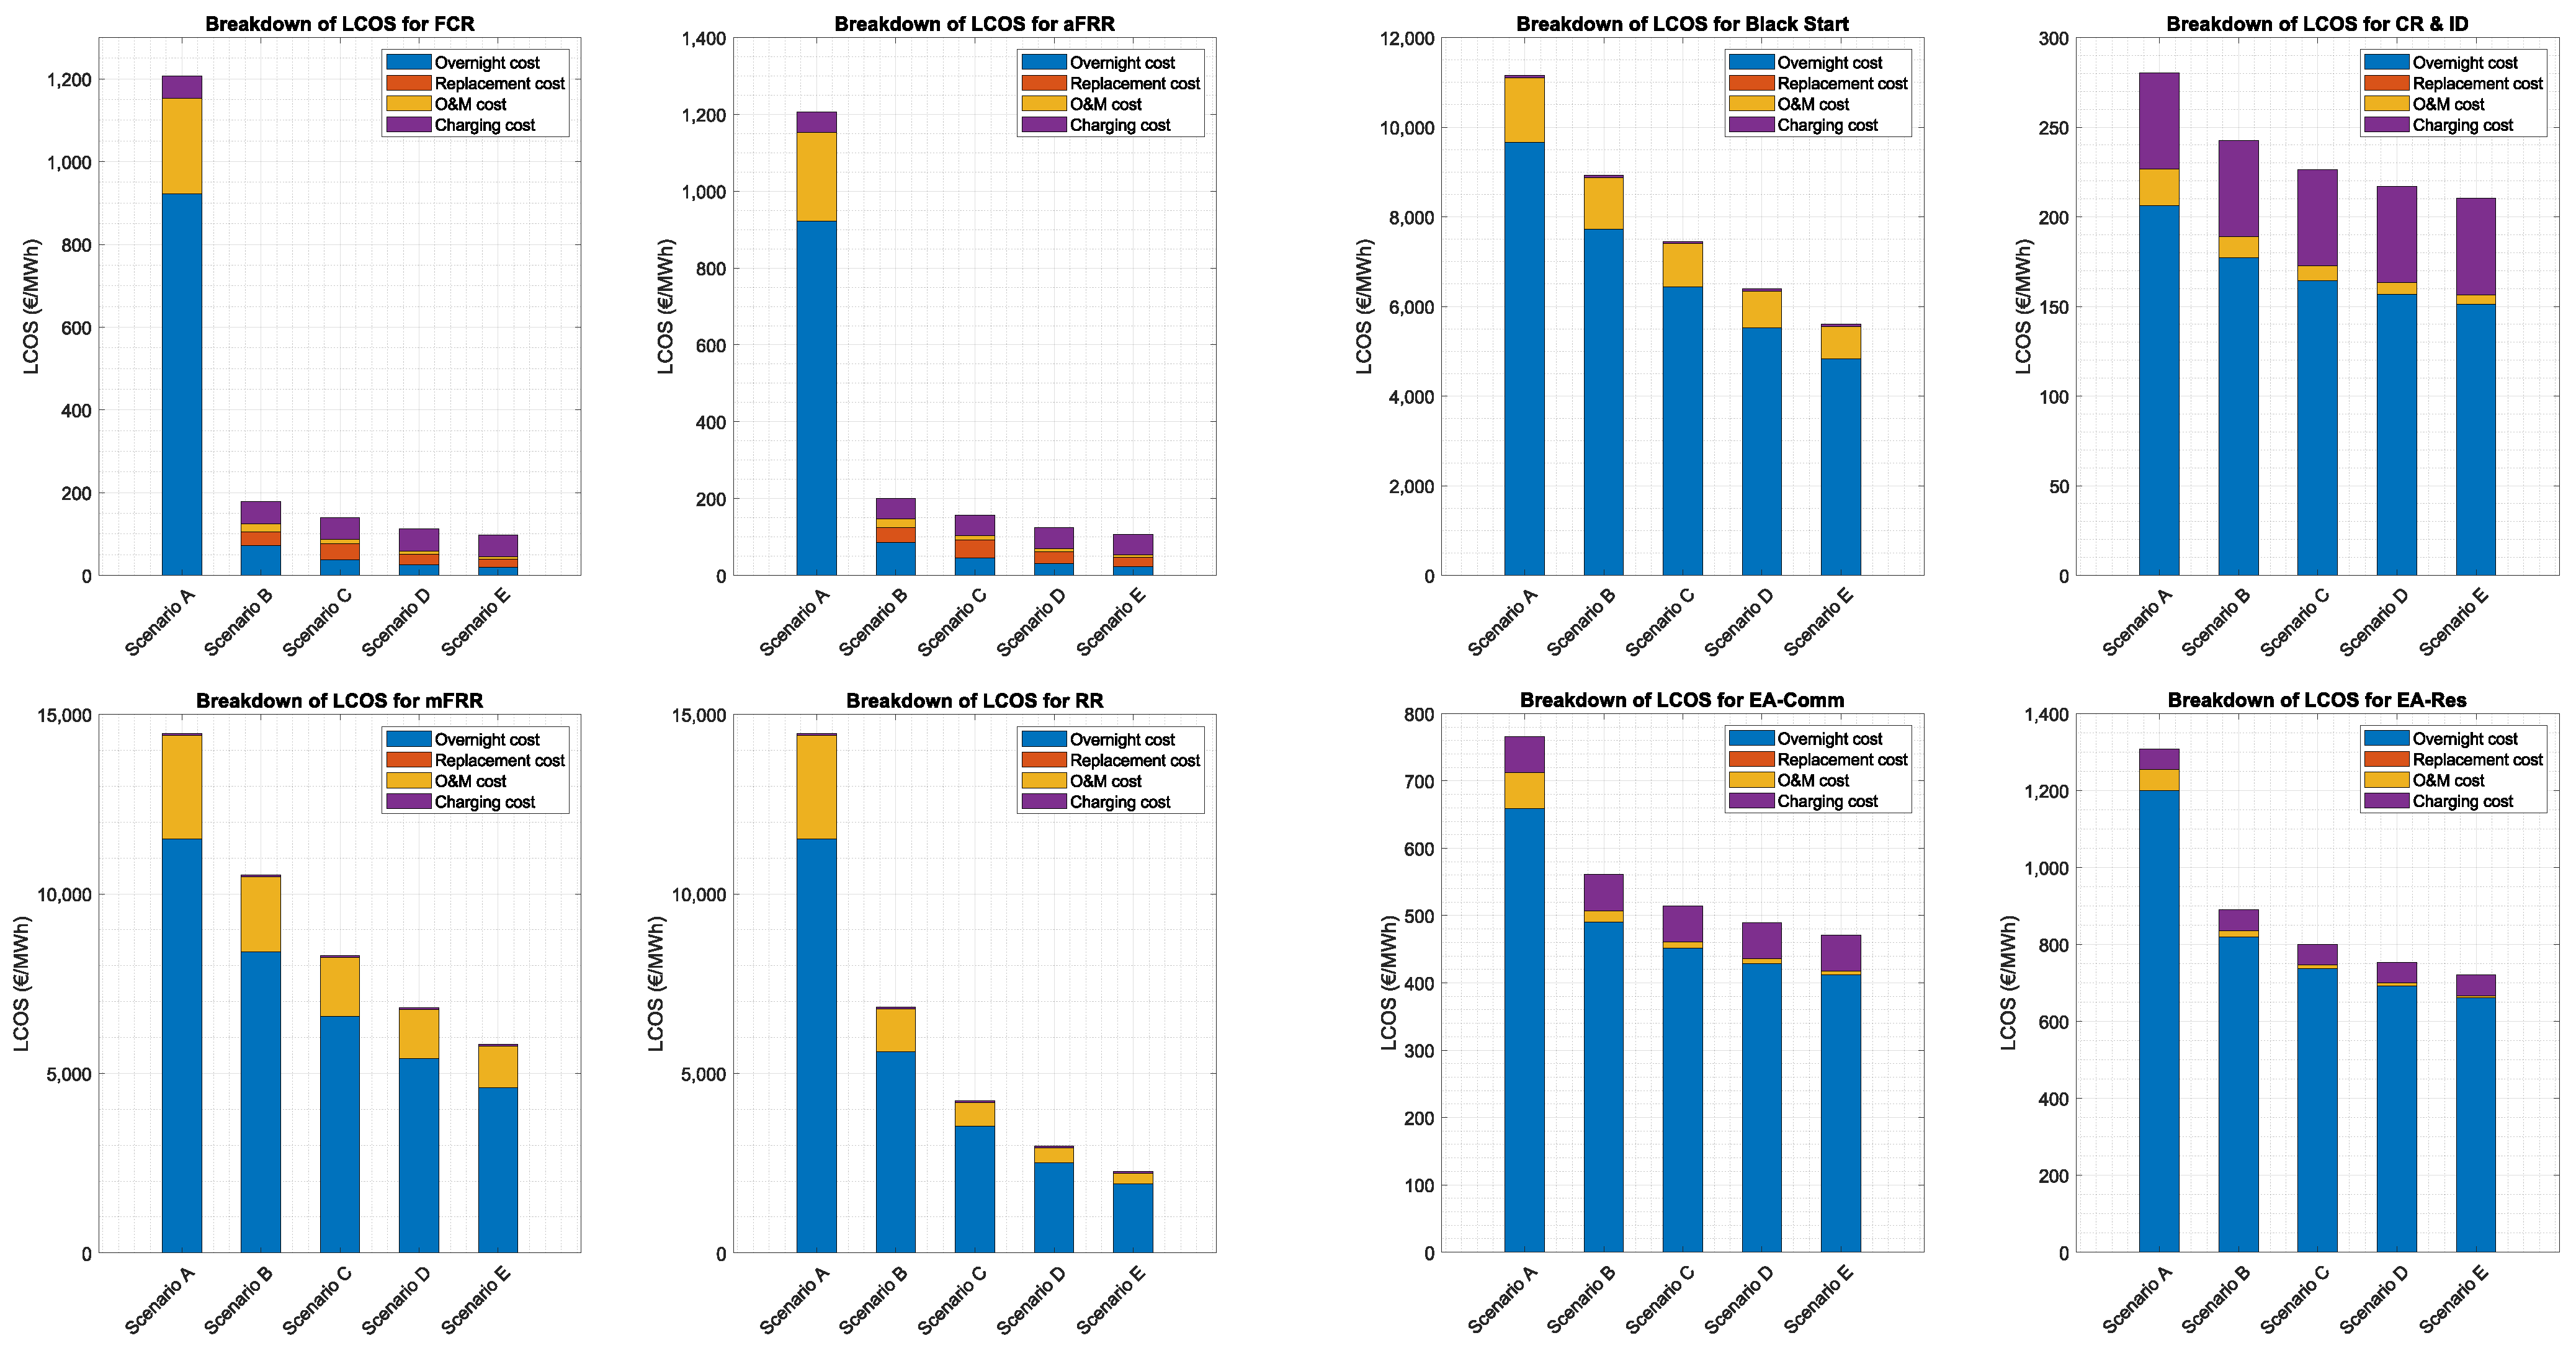
3.1. Economic Domain: LCC Results
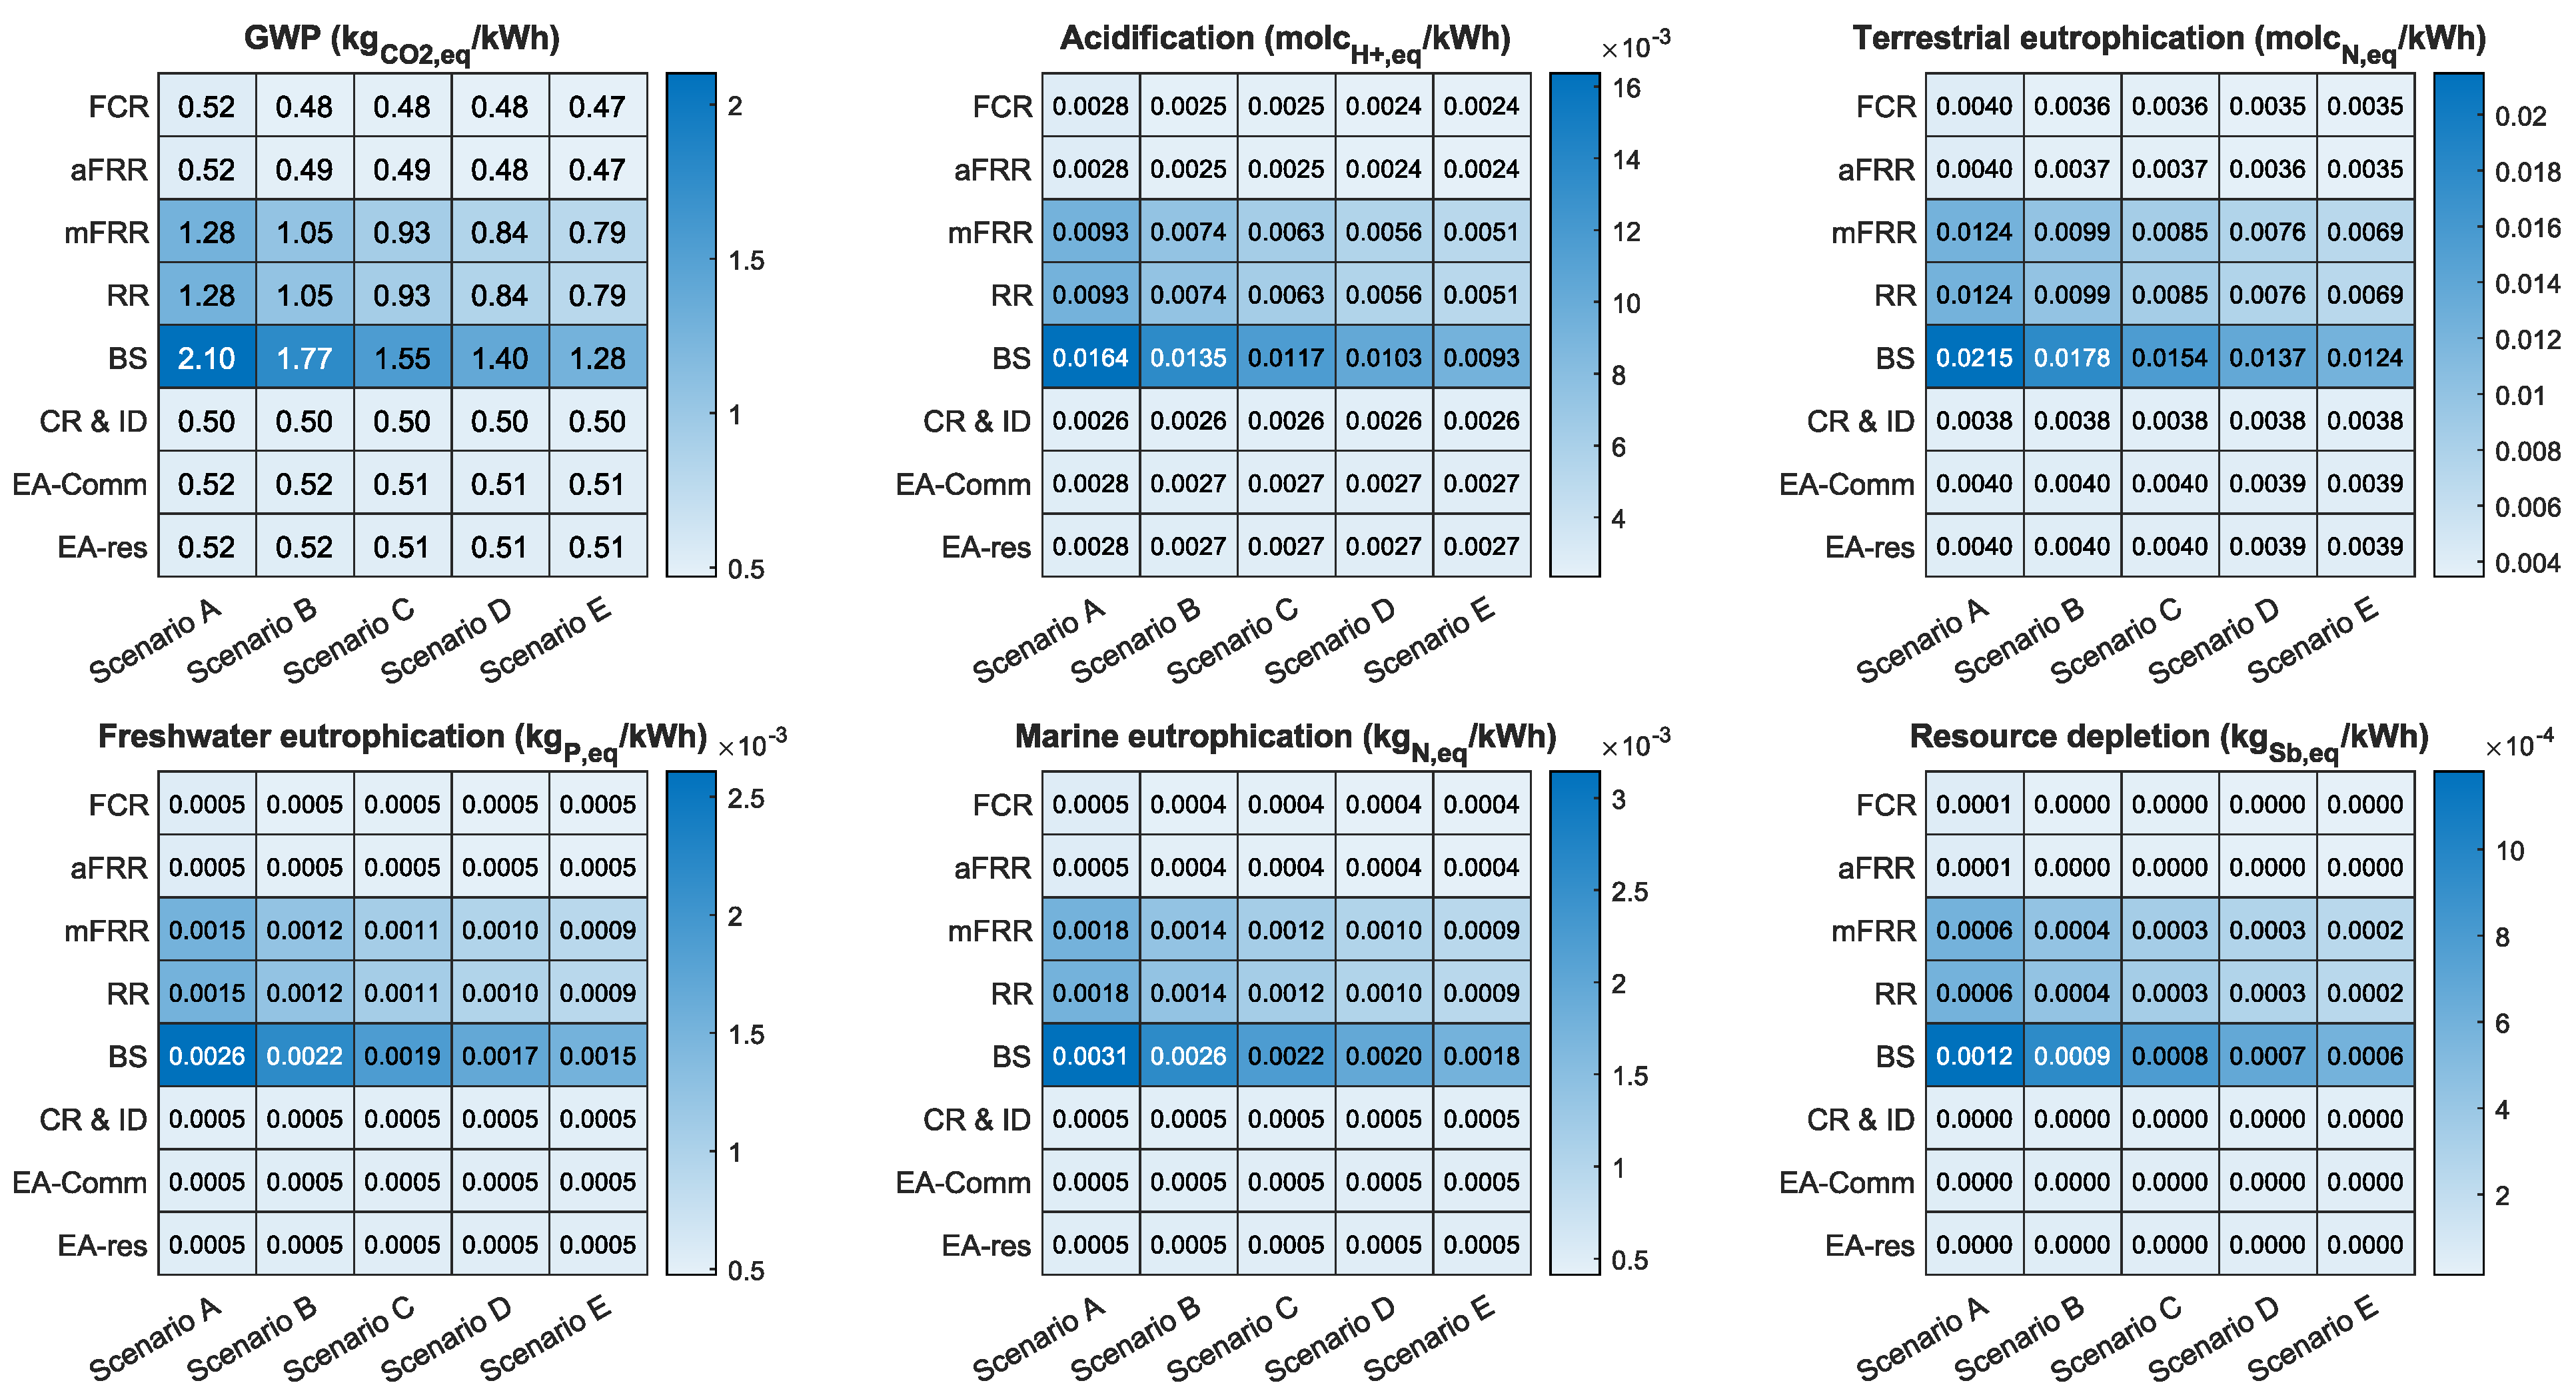
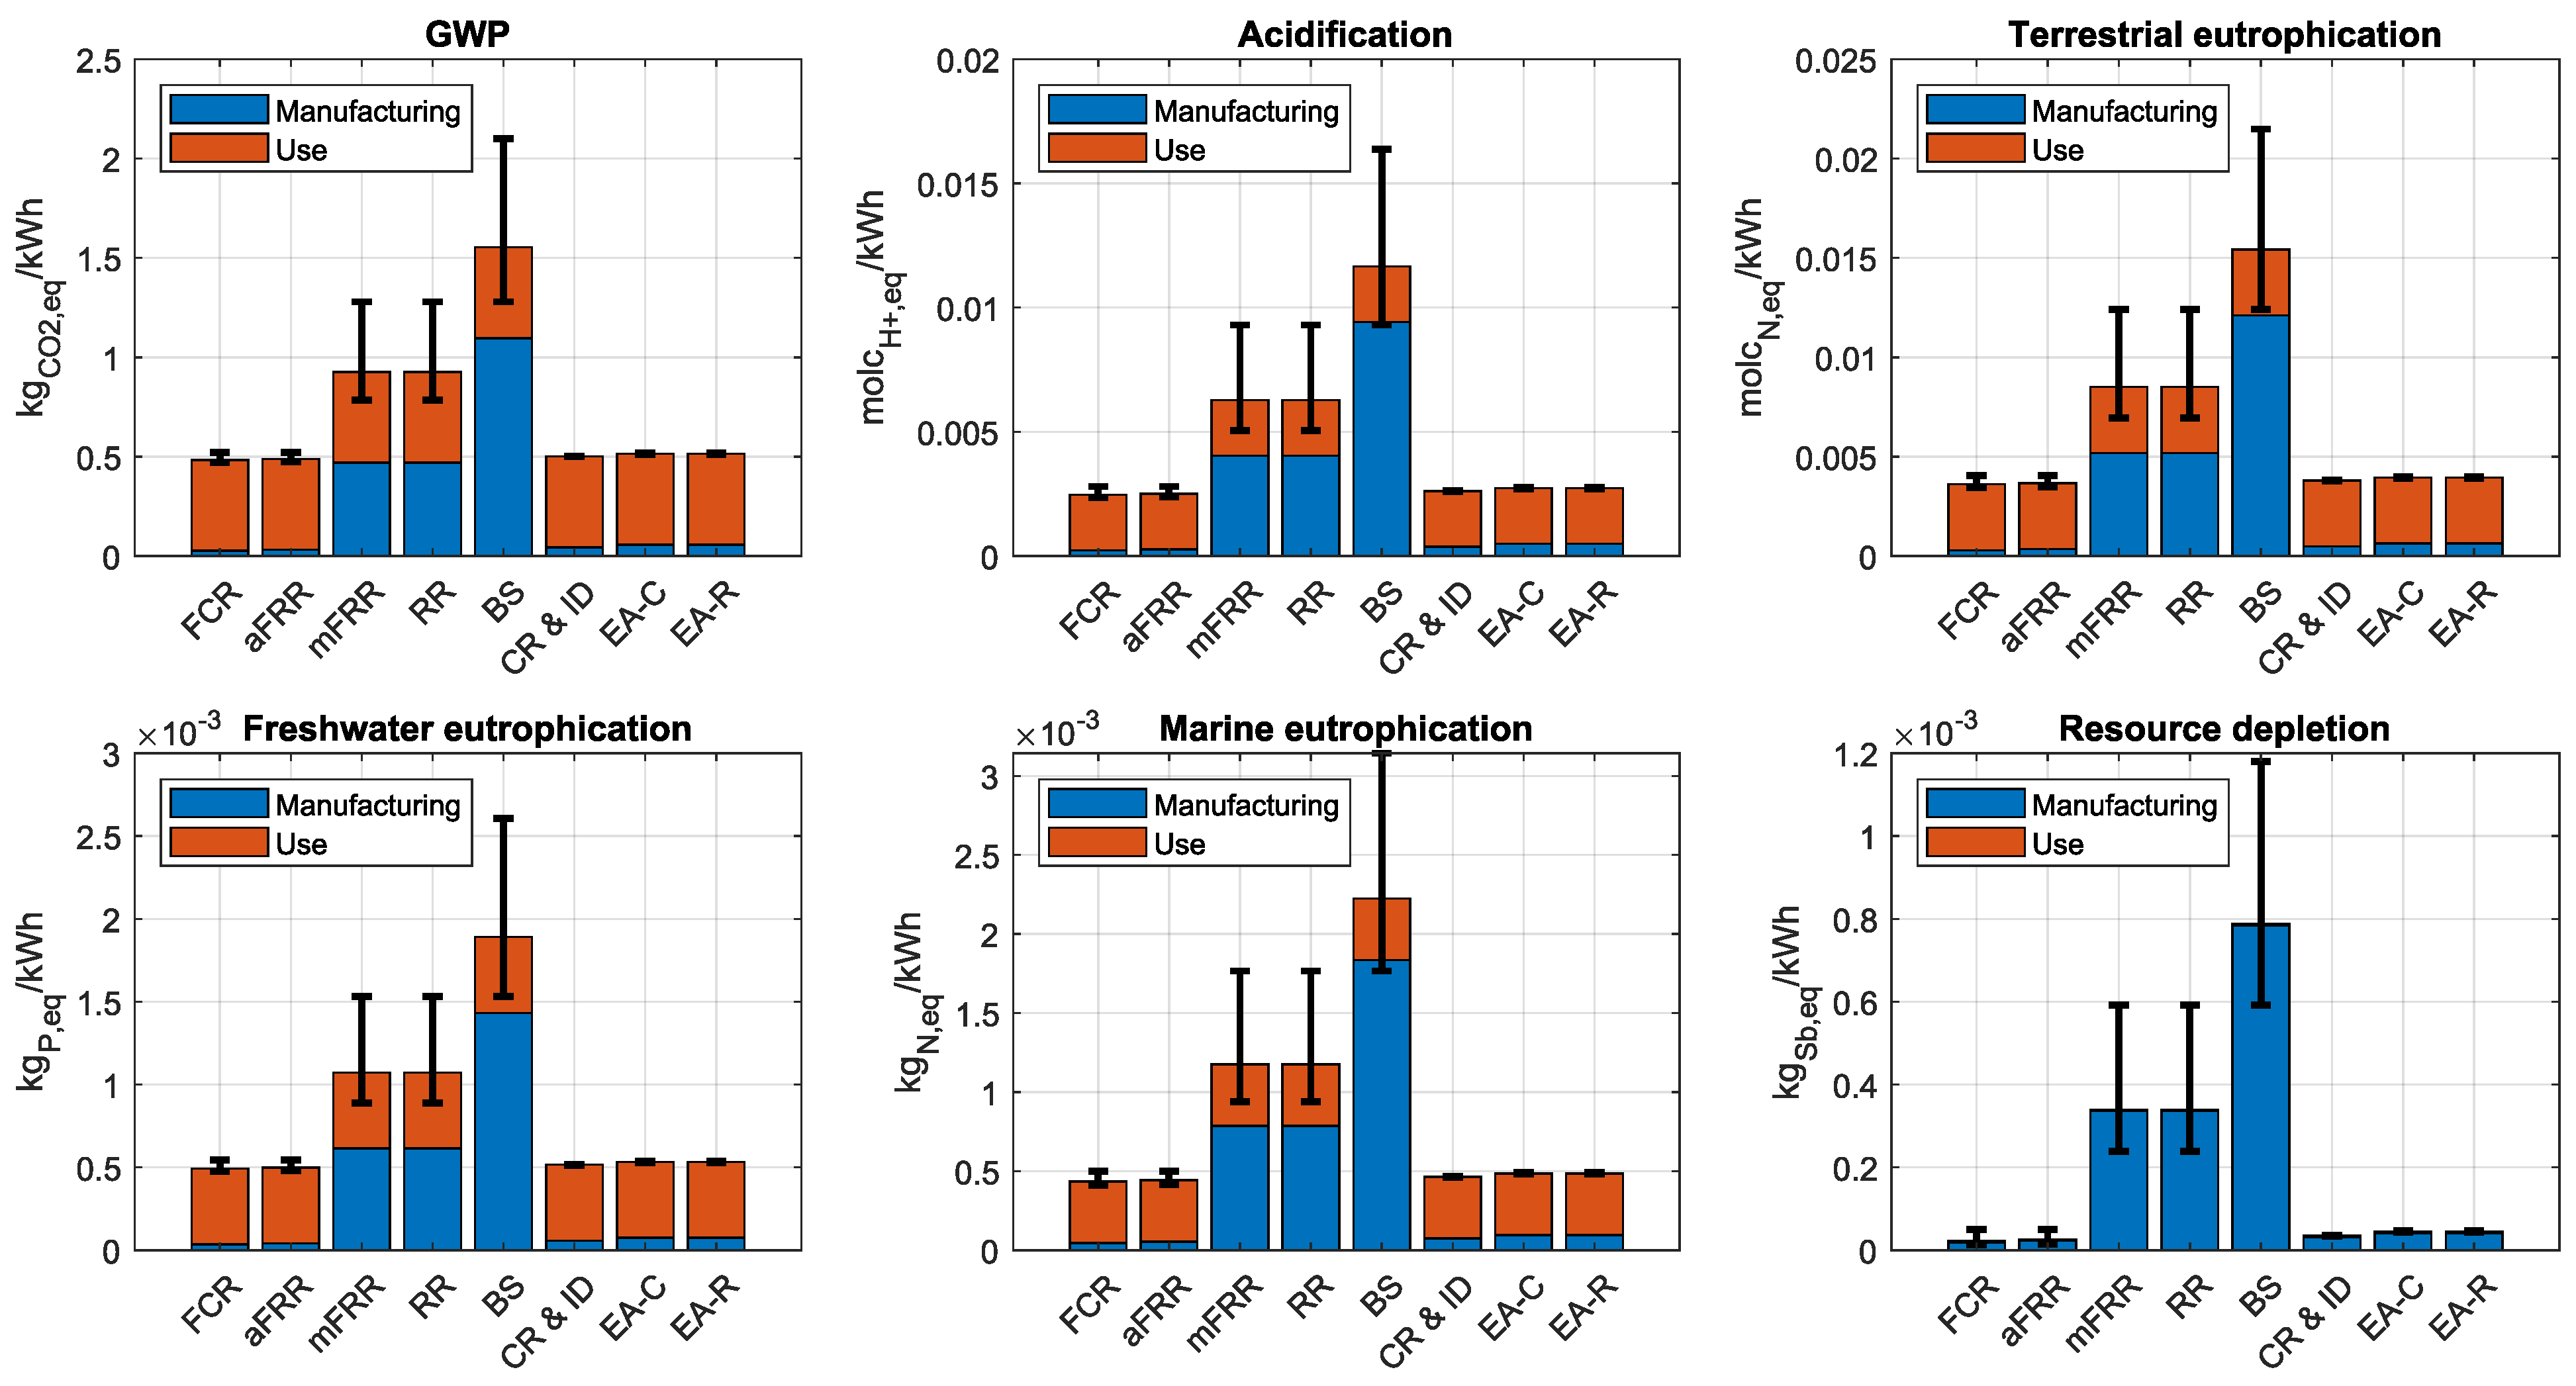
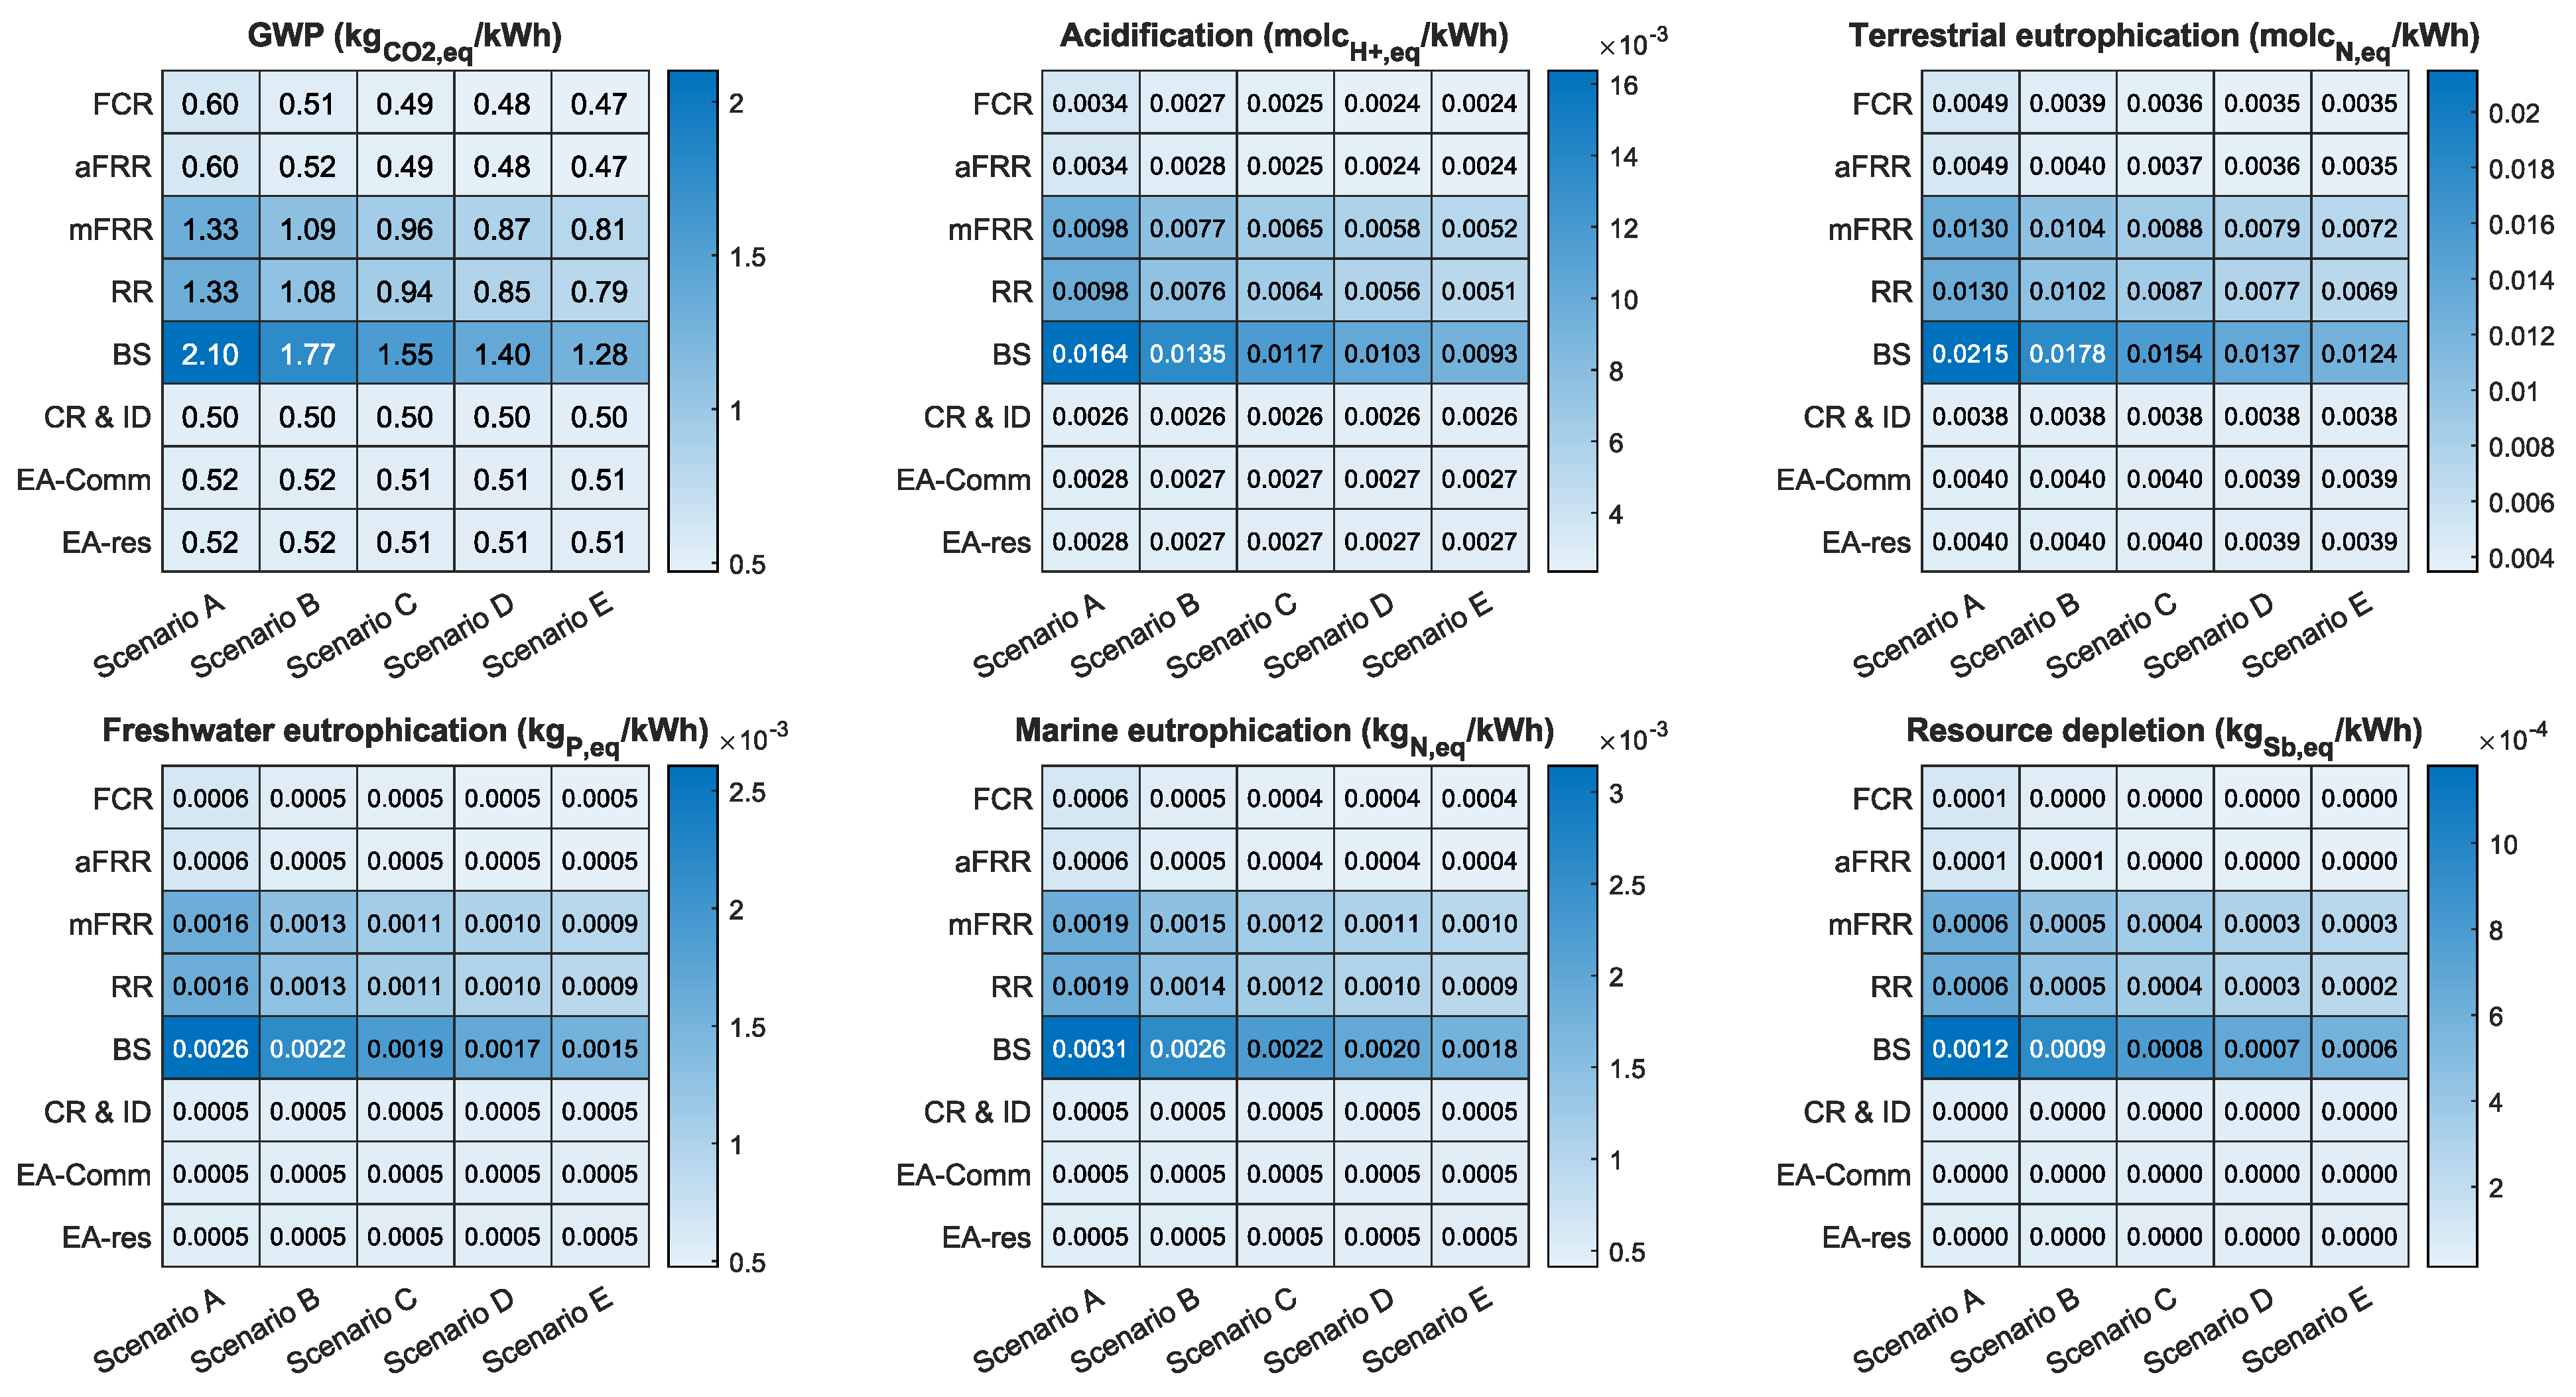
3.2. Environmental Domain: eLCA Results
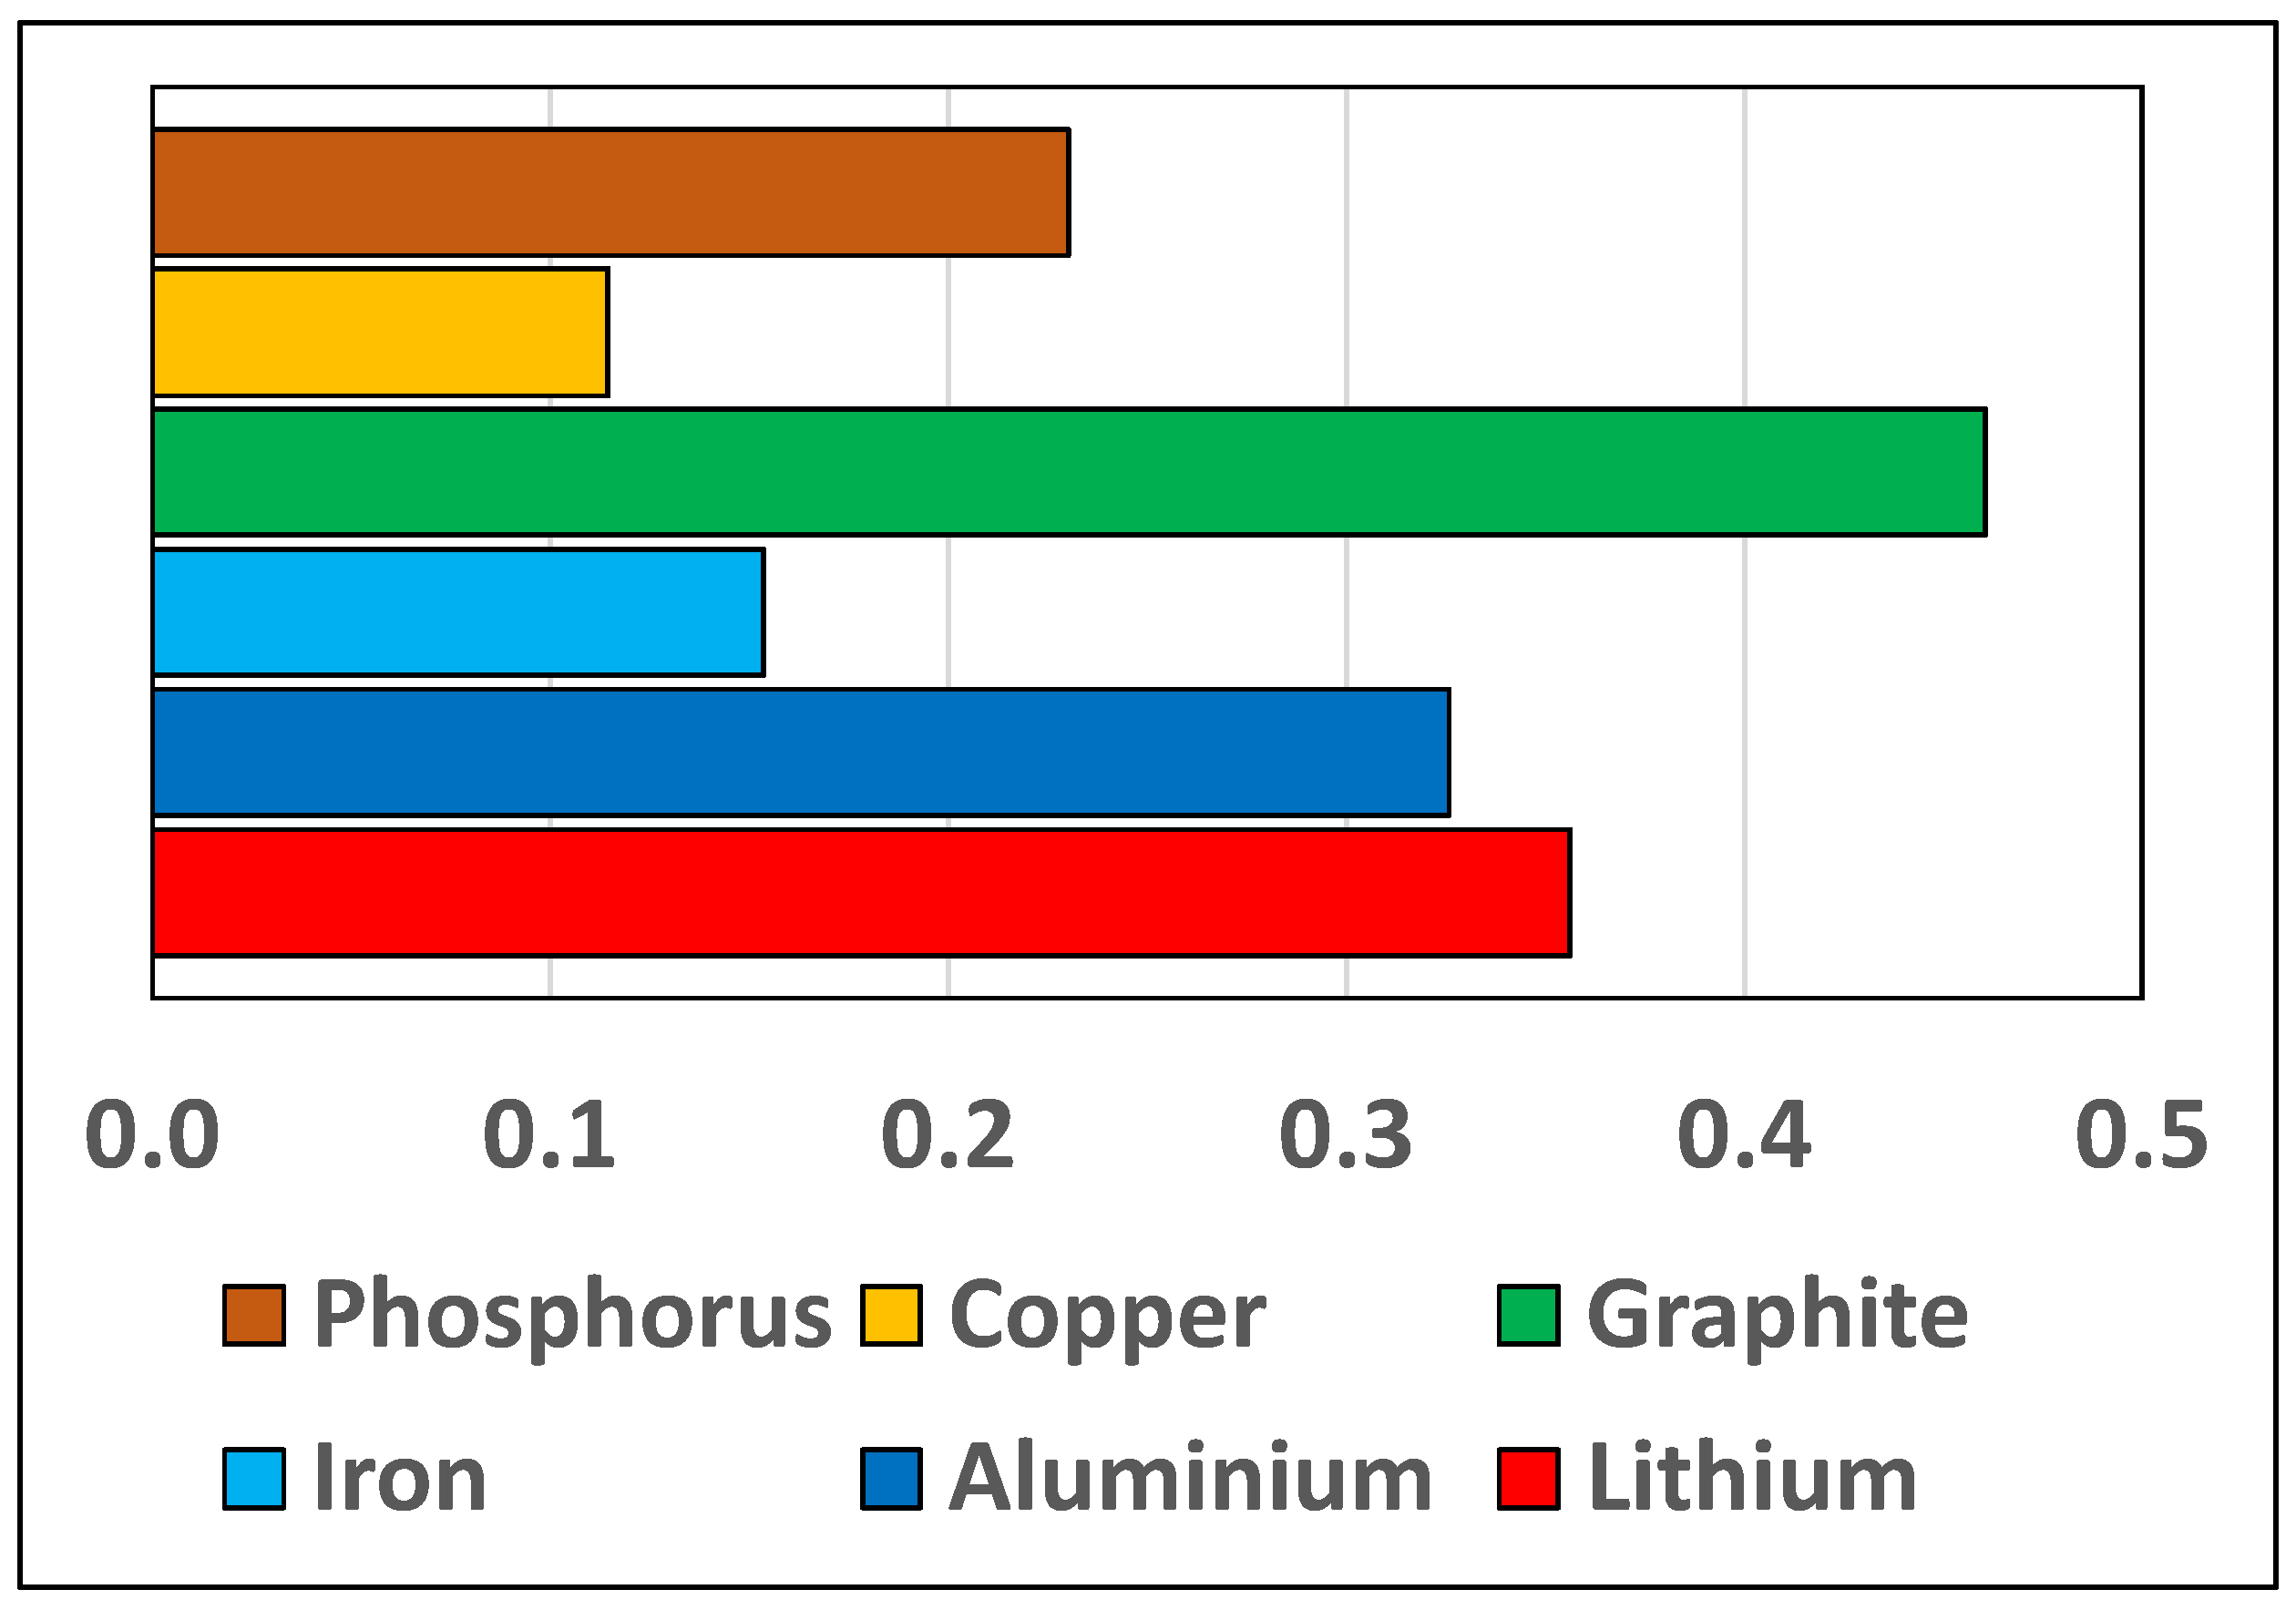
3.3. Geopolitical Domain: GRMs Analysis Results
3.4. Sensitivity Analysis
3.5. Discussion
4. Conclusions
Author Contributions
Funding
Data Availability Statement
Conflicts of Interest
Abbreviations
| ACD | Acidification |
| aFRR | authomatic Frequency Restoration Reserve |
| BMS | Battery Management System |
| BS | Black Start |
| CD & ID | Congestion Relief and Investment Deferral |
| EA | Energy Arbitrage |
| eLCA | environmental Life Cycle Assessment |
| EoL-RIR | End of Life Recycling Input Rate |
| EST | Energy Storage Technology |
| FCR | Frequency Containment Reserve |
| FE | Freshwater Eutrophication |
| GWP | Global Warming Potential |
| HHI | Herfindahl–Hirschman Index |
| LCOS | Levelised Cost of Storage |
| LFP Li-ion | lithium iron phosphate lithium-ion battery type |
| ME | Marine Eutrophication |
| mFRR | manual Frequency Restoration Reserve |
| O&M | Operation and Maintenance |
| RR | Replacement Reserve |
| NIR | Net Import Reliance |
| TE | Terrestrial Eutrophication |
| TLCC | Total Life Cycle Cost |
| WACC | Weighted Average Cost of Capital |
References
- UNFCCC. The Paris Agreement. 2015. Available online: https://unfccc.int/process-and-meetings/the-paris-agreement/the-paris-agreement (accessed on 29 January 2023).
- European Commission. EU-27 2030 Climate & Energy Framework. Available online: https://climate.ec.europa.eu/eu-action/climate-strategies-targets/2030-climate-energy-framework_en (accessed on 29 January 2023).
- European Environment Agency (EEA). Greenhouse Gas Emissions (GHG) by Sector: EU-27; Technical Report; European Environment Agency (EEA): Copenhagen, Denmark, 2022. [Google Scholar]
- United Nations Economic Commission for Europe (UNECE). Life Cycle Assessment of Electricity Generation Options; Technical Report; United Nations Economic Commission for Europe (UNECE): Geneva, Switzerland, 2021. [Google Scholar]
- Eurostat. SHARES (Renewables); Eurostat: Luxembourg, 2021. [Google Scholar]
- Guerra, K.; Haro, P.; Gutiérrez, R.; Gómez-Barea, A. Facing the high share of variable renewable energy in the power system: Flexibility and stability requirements. Appl. Energy 2022, 310, 118561. [Google Scholar] [CrossRef]
- Babatunde, O.; Munda, J.; Hamam, Y. Power system flexibility: A review. Energy Rep. 2020, 6, 101–106. [Google Scholar] [CrossRef]
- Kebede, A.A.; Kalogiannis, T.; Van Mierlo, J.; Berecibar, M. A comprehensive review of stationary energy storage devices for large scale renewable energy sources grid integration. Renew. Sustain. Energy Rev. 2022, 159, 112213. [Google Scholar] [CrossRef]
- European Commission; Tarvydas, D.; Tsiropoulos, I.; Lebedeva, N. Li-Ion Batteries for Mobility and Stationary Storage Applications: Scenarios for Costs and Market Growth; Publications Office of the European Union: Luxembourg, 2018. [Google Scholar] [CrossRef]
- European Battery Alliance. Available online: https://single-market-economy.ec.europa.eu/industry/strategy/industrial-alliances/european-battery-alliance_en (accessed on 29 January 2023).
- European Commission. State of the Energy Union 2022; Technical Report; European Commission: Brussels, Belgium, 2022. [Google Scholar]
- European Commission. Progress on Competitiveness of Clean Energy Technologies; Technical Report; European Commission: Brussels, Belgium, 2022. [Google Scholar]
- Huisman, J.; Ciuta, T.; Mathieux, F.; Bobba, S.; Georgitzikis, K.; Pennington, D. RMIS—Raw Materials in the Battery Value Chain; Technical Report; Publications Office of the European Union: Luxembourg, 2020. [Google Scholar] [CrossRef]
- Mancini, L.; Benini, L.; Sala, S. Characterization of raw materials based on supply risk indicators for Europe. Int. J. Life Cycle Assess 2018, 23, 726–738. [Google Scholar] [CrossRef]
- British Geological Survey. An Update to the Supply Risk Index for Elements and Element Groups That Are of Economic Value; Technical Report; British Geological Survey: Nottingham, UK, 2015. [Google Scholar]
- European Commission. Annexes to the Report on Critical Raw Materials for the EU: Report of the Ad Hoc Working Group on Defining Critical Raw Materials; Technical Report; European Commission: Brussels, Belgium, 2010. [Google Scholar]
- European Commission. Annexes to the Report on Critical Raw Materials for the EU: Report of the Ad Hoc Working Group on Defining Critical Raw Materials; Technical Report; European Commission: Brussels, Belgium, 2014. [Google Scholar]
- Blengini, G.A.; Blagoeva, D.; Dewulf, J.; Torres de Matos, C.; Nita, V.; Vidal-Legaz, B.; Latunussa, C.; Kayam, Y.; Talens Peirò, L.; Baranzelli, C.; et al. Assessment of the Methodology for Establishing the EU List of Critical Raw Materials: Background Report; JRC Technical Reports; Publications Office of the European Union: Luxembourg, 2017. [Google Scholar] [CrossRef]
- European Commission. Critical Raw Materials Resilience: Charting a Path towards Greater Security and Sustainability; Technical Report; European Commission: Brussels, Belgium, 2020. [Google Scholar]
- National Research Council. Minerals, Critical Minerals, and the U.S. Economy; The National Academies Press: Washington, DC, USA, 2008. [Google Scholar] [CrossRef]
- Graedel, T.E.; Harper, E.M.; Nassar, N.T.; Nuss, P.; Reck, B.K. Criticality of metals and metalloids. Proc. Natl. Acad. Sci. USA 2015, 112, 4257–4262. [Google Scholar] [CrossRef]
- Helbig, C.; Bradshaw, A.M.; Kolotzek, C.; Thorenz, A.; Tuma, A. Supply risks associated with CdTe and CIGS thin-film photovoltaics. Appl. Energy 2016, 178, 422–433. [Google Scholar] [CrossRef]
- Helbig, C.; Bradshaw, A.M.; Wietschel, L.; Thorenz, A.; Tuma, A. Supply risks associated with lithium-ion battery materials. J. Clean. Prod. 2018, 172, 274–286. [Google Scholar] [CrossRef]
- Cimprich, A.; Karim, K.S.; Young, S.B. Extending the geopolitical supply risk method: Material “substitutability” indicators applied to electric vehicles and dental X-ray equipment. Int. J. Life Cycle Assess. 2018, 23, 2024–2042. [Google Scholar] [CrossRef]
- Gemechu, E.D.; Sonnemann, G.; Young, S.B. Geopolitical-related supply risk assessment as a complement to environmental impact assessment: The case of electric vehicles. Int. J. Life Cycle Assess. 2017, 22, 31–39. [Google Scholar] [CrossRef]
- Gemechu, E.D.; Helbig, C.; Sonnemann, G.; Thorenz, A.; Tuma, A. Import-based Indicator for the Geopolitical Supply Risk of Raw Materials in Life Cycle Sustainability Assessments. J. Ind. Ecol. 2016, 20, 154–165. [Google Scholar] [CrossRef]
- Santillán-Saldivar, J.; Cimprich, A.; Shaikh, N.; Laratte, B.; Young, S.B.; Sonnemann, G. How recycling mitigates supply risks of critical raw materials: Extension of the geopolitical supply risk methodology applied to information and communication technologies in the European Union. Resour. Conserv. Recycl. 2021, 164, 105108. [Google Scholar] [CrossRef]
- Helbig, C.; Gemechu, E.D.; Pillain, B.; Young, S.B.; Thorenz, A.; Tuma, A.; Sonnemann, G. Extending the geopolitical supply risk indicator: Application of life cycle sustainability assessment to the petrochemical supply chain of polyacrylonitrile-based carbon fibers. J. Clean. Prod. 2016, 137, 1170–1178. [Google Scholar] [CrossRef]
- European Commission; Joint Research Centre; Institute for Environment and Sustainability. International Reference Life Cycle Data System (ILCD) Handbook: Framework and Requirements for Life Cycle Impact Assessment Models and Indicators; Technical Report; Publications Office of the European Union: Luxembourg, 2010. [Google Scholar] [CrossRef]
- Raw material criticality in the context of classical risk assessment. Resour. Policy 2015, 44, 35–46. [CrossRef]
- Chowdhury, J.I.; Balta-Ozkan, N.; Goglio, P.; Hu, Y.; Varga, L.; McCabe, L. Techno-environmental analysis of battery storage for grid level energy services. Renew. Sustain. Energy Rev. 2020, 131, 110018. [Google Scholar] [CrossRef]
- Stenzel, P.; Koj, J.C.; Schreiber, A.; Hennings, W.; Zapp, P. Primary control provided by large-scale battery energy storage systems or fossil power plants in Germany and related environmental impacts. J. Energy Storage 2016, 8, 300–310. [Google Scholar] [CrossRef]
- Koj, J.C.; Stenzel, P.; Schreiber, A.; Hennings, W.; Zapp, P.; Wrede, G.; Hahndorf, I. Life Cycle Assessment of Primary Control Provision by Battery Storage Systems and Fossil Power Plants. Energy Procedia 2015, 73, 69–78. [Google Scholar] [CrossRef]
- Le Varlet, T.; Schmidt, O.; Gambhir, A.; Few, S.; Staffell, I. Comparative life cycle assessment of lithium-ion battery chemistries for residential storage. J. Energy Storage 2020, 28, 101230. [Google Scholar] [CrossRef]
- Lamperti Tornaghi, M.; Loli, A.; Negro, P. Balanced Evaluation of Structural and Environmental Performances in Building Design. Buildings 2018, 8, 52. [Google Scholar] [CrossRef]
- Diaz-Londono, C.; Enescu, D.; Ruiz, F.; Mazza, A. Experimental modeling and aggregation strategy for thermoelectric refrigeration units as flexible loads. Appl. Energy 2020, 272, 115065. [Google Scholar] [CrossRef]
- Argyrou, M.C.; Christodoulides, P.; Kalogirou, S.A. Energy storage for electricity generation and related processes: Technologies appraisal and grid scale applications. Renew. Sustain. Energy Rev. 2018, 94, 804–821. [Google Scholar] [CrossRef]
- International Electrotechnical Commission (IEC). IEC 60050, Definition of Prosumer. 2017. Available online: https://electropedia.org/iev/iev.nsf/display?openform&ievref=617-02-16 (accessed on 12 May 2023).
- Palizban, O.; Kauhaniemi, K. Energy storage systems in modern grids—Matrix of technologies and applications. J. Energy Storage 2016, 6, 248–259. [Google Scholar] [CrossRef]
- Asian Development Bank. Handbook on Battery Energy Storage System; Technical Report; Asian Development Bank: Mandaluyong, Philippines, 2018. [Google Scholar] [CrossRef]
- International Renewable Energy Agency (IRENA). Electricity Storage and Renewables: Costs and Markets to 2030; Technical Report; International Renewable Energy Agency (IRENA): Masdar City, United Arab Emirates, 2017. [Google Scholar]
- Laca, A.; Herrero, M.; Díaz, M. 2.60—Life Cycle Assessment in Biotechnology. In Comprehensive Biotechnology, 2nd ed.; Moo-Young, M., Ed.; Academic Press: Burlington, MA, USA, 2011; pp. 839–851. [Google Scholar] [CrossRef]
- Sala, S.; Wolf, M.A.; Pant, R. Characterisation Factors of the ILCD Recommended Life Cycle Impact Assessment Methods. Database and Supporting Information; European Commission: Brussels, Belgium, 2012. [Google Scholar] [CrossRef]
- Song, J.; Yan, W.; Cao, H.; Song, Q.; Ding, H.; Lv, Z.; Zhang, Y.; Sun, Z. Material flow analysis on critical raw materials of lithium-ion batteries in China. J. Clean. Prod. 2019, 215, 570–581. [Google Scholar] [CrossRef]
- Kaufmann, D.; Kraay, A.; Mastruzzi, M. The Worldwide Governance Indicators: Methodology and Analytical Issues; Policy Research Working Paper Series 5430; The World Bank: Washington, DC, USA, 2010. [Google Scholar]
- Majeau-Bettez, G.; Hawkins, T.R.; Strømman, A.H. Life Cycle Environmental Assessment of Lithium-Ion and Nickel Metal Hydride Batteries for Plug-In Hybrid and Battery Electric Vehicles. Environ. Sci. Technol. 2011, 45, 4548–4554. [Google Scholar] [CrossRef] [PubMed]
- Carvalho, M.L.; Temporelli, A.; Girardi, P. Life Cycle Assessment of Stationary Storage Systems within the Italian Electric Network. Energies 2021, 14, 2047. [Google Scholar] [CrossRef]
- Peters, J.F.; Baumann, M.; Zimmermann, B.; Braun, J.; Weil, M. The environmental impact of Li-Ion batteries and the role of key parameters—A review. Renew. Sustain. Energy Rev. 2017, 67, 491–506. [Google Scholar] [CrossRef]
- Ameli, M.T.; Ameli, A. Chapter 12—Electric vehicles as means of energy storage: Participation in ancillary services markets. In Energy Storage in Energy Markets; Mohammadi-Ivatloo, B., Mohammadpour Shotorbani, A., Anvari-Moghaddam, A., Eds.; Academic Press: Cambridge, MA, USA, 2021; pp. 235–249. [Google Scholar] [CrossRef]
- Waag, W.; Sauer, D. SECONDARY BATTERIES—LEAD—ACID SYSTEMS|State-of-Charge/Health. In Encyclopedia of Electrochemical Power Sources; Garche, J., Ed.; Elsevier: Amsterdam, The Netherlands, 2009; pp. 793–804. [Google Scholar] [CrossRef]
- Spiers, D. Chapter IIB-2—Batteries in PV Systems. In Practical Handbook of Photovoltaics, 2nd ed.; McEvoy, A., Markvart, T., Castañer, L., Eds.; Academic Press: Boston, MA, USA, 2012; pp. 721–776. [Google Scholar] [CrossRef]
- Jasper, F.B.; Späthe, J.; Baumann, M.; Peters, J.F.; Ruhland, J.; Weil, M. Life cycle assessment (LCA) of a battery home storage system based on primary data. J. Clean. Prod. 2022, 366, 132899. [Google Scholar] [CrossRef]
- Preger, Y.; Barkholtz, H.M.; Fresquez, A.; Campbell, D.L.; Juba, B.W.; Romàn-Kustas, J.; Ferreira, S.R.; Chalamala, B. Degradation of Commercial Lithium-Ion Cells as a Function of Chemistry and Cycling Conditions. J. Electrochem. Soc. 2020, 167, 120532. [Google Scholar] [CrossRef]
- Akhil, A.A.; Huff, G.; Currier, A.B.; Hernandez, J.; Bender, D.A.; Kaun, B.C.; Rastler, D.M.; Chen, S.B.; Cotter, A.L.; Bradshaw, D.T.; et al. DOE/EPRI Electricity Storage Handbook in Collaboration with NRECA; U.S. Department of Energy: Washington, DC, USA, 2016. [CrossRef]
- Luo, X.; Wang, J.; Dooner, M.; Clarke, J. Overview of current development in electrical energy storage technologies and the application potential in power system operation. Appl. Energy 2015, 137, 511–536. [Google Scholar] [CrossRef]
- Augustine, C.; Blair, N. Energy Storage Futures Study: Storage Technology Modeling Input Data Report; NREL/TP-5700-78694; National Renewable Energy Laboratory: Golden, CO, USA, 2021.
- Mongird, K.; Viswanathan, V.; Balducci, P.; Alam, J.; Fotedar, V.; Koritarov, V.; Hadjerioua, B. An Evaluation of Energy Storage Cost and Performance Characteristics. Energies 2020, 13, 3307. [Google Scholar] [CrossRef]
- Quintel. Energy Transition Model. Available online: https://docs.energytransitionmodel.com/main/cost-wacc/ (accessed on 12 May 2023).
- Renewable Power Generation Costs in 2020; International Renewable Energy Agency: Abu Dhabi, United Arab Emirates, 2021.
- Reichl, C.; Schatz, M. World Mining Data 2022; Austrian Federal Ministry of Finance (BMF): Vienna, Austria, 2022.
- European Commission and Directorate-General for Internal Market, Industry, Entrepreneurship and SMEs. Study on the Review of the List of Critical Raw Materials: Final Report; Publications Office: Luxembourg, 2017. [Google Scholar] [CrossRef]
- Graedel, T.; Harper, E.; Nassar, N.; Reck, B. On the materials basis of modern society. Proc. Natl. Acad. Sci. USA 2015, 112, 6295–6300. [Google Scholar] [CrossRef]
- Tercero Espinoza, L.A. Critical appraisal of recycling indicators used in European criticality exercises and circularity monitoring. Resour. Policy 2021, 73, 102208. [Google Scholar] [CrossRef]


| Service | Response Time | Discharge Duration | Yearly Cycles | Type |
|---|---|---|---|---|
| FCR | 2–3 s | 0.25 h | 250–12,000 | Grid |
| aFRR | 1–5 s | 0.25 h | 250–10,000 | Grid |
| mFRR | >5 min | 0.25 h | 20–50 | Grid |
| RR | >15 min | 0.25–1 h | 20–50 | Grid |
| Black Start | 10 min | 1 h | 10–20 | Grid |
| CR & ID | min | 2–8 h | 360–380 | Grid |
| Arbitrage | min | 1–10 h | 270–300 | Customer |
| Seasonal | min | 5–336 h | 1–5 | - |
| Impact Category | Indicator | Unit of Measure | Brief Description |
|---|---|---|---|
| Climate Change | GWP100 | kg | Global Warming Potential of Atmospheric emissions of Greenhouse Gases in a 100-year time horizon |
| Acidification | ACD | molc | Release of H+ ions caused by air emissions of SO, NO and NH |
| Terrestrial eutrophication | TE | molc | Atmospheric nitrogen compounds deposition (NO, NH) |
| Freshwater eutrophication | FE | molc | Soil and water phosphorous compounds deposition |
| Marine eutrophication | ME | kg | Emissions of nitrogen compounds in marine ecosystems |
| Resource depletion | RD | kg | Exploitation of natural resources for the life cycle of the product, compared to the “Reserve Base” of these resources |
| Typology | Size (kW) |
|---|---|
| Utility-scale | 60 |
| Commercial/industrial | 300 |
| Residential | 6 |
| Parameter | Symbol | Value |
|---|---|---|
| Max depth of discharge (%) | 80% | |
| Cycle life expectancy at <70% | 5000 | |
| Battery charge efficiency (%) | 98% | |
| Battery discharge efficiency (%) | 98% | |
| Inverter efficiency (%) | 95% | |
| Round-trip efficiency (%) | 87% |
| Service | Parameter | Scenario A | Scenario B | Scenario C | Scenario D | Scenario E |
|---|---|---|---|---|---|---|
| FCR | Yearly cycles | 250 | 3188 | 6125 | 9063 | 12,000 |
| Discharge duration (h) | 0.25 | |||||
| aFRR | Yearly cycles | 250 | 2688 | 5125 | 7563 | 10,000 |
| Discharge duration (h) | 0.25 | |||||
| mFRR | Yearly cycles | 20 | 28 | 35 | 43 | 50 |
| Discharge duration (h) | 0.25 | |||||
| RR | Yearly cycles | 20 | 28 | 35 | 43 | 50 |
| Discharge duration (h) | 0.25 | 0.44 | 0.63 | 0.81 | 1 | |
| Black start | Yearly cycles | 10 | 13 | 15 | 18 | 20 |
| Discharge duration (h) | 1 | |||||
| CR & ID | Yearly cycles | 360 | 365 | 370 | 375 | 380 |
| Discharge duration (h) | 2 | 3.50 | 5 | 6.50 | 8 | |
| Arbitrage- Residential | Yearly cycles | 270 | 278 | 285 | 293 | 300 |
| Discharge duration (h) | 1 | 3.25 | 5.50 | 7.75 | 10 | |
| Arbitrage- Commercial | Yearly cycles | 270 | 278 | 285 | 293 | 300 |
| Discharge duration (h) | 1 | 3.25 | 5.50 | 7.75 | 10 | |
| Typology | Battery (EUR/kWh) | Balance of System (EUR/kW) | Installation Costs (EUR/kWh) | Fixed O&M (EUR/kW-yr) | Variable O&M (EUR/MWh) |
|---|---|---|---|---|---|
| Utility | 180 | 239 | 98 | 10 | 0.5 |
| Commercial | 191 | 322 | 439 | 10 | 0.5 |
| Residential | 237 | 747 | 751 | 10 | 0.5 |
| Item | Symbol | Brief Description | Sub-Items |
|---|---|---|---|
| Battery | Purchase of the batteries | Modules, racks, BMS | |
| Balance of system | Purchase of the BOS | Inverters, cables, EMS, switchgear, monitor controls, wiring, conduit, foundation, battery containers and inverter house | |
| Installing costs | Installation of the battery plant | Installation labour and equipment, other soft costs | |
| Replacement costs | Replacement of the batteries, after they reached their cycle life | Same as battery sub-items | |
| Fixed O&M | Fixed operating expenses | Planned Maintenance, labor | |
| Variable O&M | Variable operating expenses | Other non-fuel operating expenses |
| Service | Scenario A | Scenario B | Scenario C | Scenario D | Scenario E |
|---|---|---|---|---|---|
| FCR | 1206.8 | 177.9 | 140.3 | 112.4 | 98.1 |
| aFRR | 1206.8 | 200.9 | 157.1 | 123.9 | 106.9 |
| mFRR | 14,461.9 | 10,532.5 | 8287.2 | 6834.3 | 5817.3 |
| RR | 14,461.9 | 6851.0 | 4237.5 | 2986.2 | 2273.8 |
| Black start | 11,152.1 | 8932.5 | 7452.8 | 6395.9 | 5603.2 |
| CR & ID | 280.5 | 242.7 | 226.5 | 216.9 | 210.3 |
| Arbitrage- Commercial | 766.1 | 560.9 | 514.6 | 489.4 | 471.3 |
| Arbitrage- Residential | 1307.8 | 889.8 | 799.9 | 753.0 | 720.6 |
| Element | NIR (%) | EOL (%) | SI (%) |
|---|---|---|---|
| Aluminium | 59 | 12.3 | 80 |
| Copper | 44 | 16.9 | 90 |
| Graphite | 98 | 3 | 100 |
| Iron | 72 | 31.5 | 90 |
| Lithium | 100 | ≈0 | 90 |
| Phosphorus | 100 | 0 | 100 |
| Element | Supply Risk CF (-) | Quantity (kg/kWh) | Risk (kg/kWh) | Risk Contribution (%) |
|---|---|---|---|---|
| Aluminium | 0.06 | 0.82 | 0.05 | 8 |
| Copper | 0.03 | 0.91 | 0.03 | 4 |
| Graphite | 0.23 | 1.36 | 0.23 | 50 |
| Iron | 0.05 | 0.91 | 0.05 | 7 |
| Lithium | 0.16 | 0.12 | 0.02 | 3 |
| Phosphorus | 0.35 | 0.51 | 0.18 | 28 |
| Total | - | 4.63 | 0.63 | 100 |
| Service | Scenario A | Scenario B | Scenario C | Scenario D | Scenario E |
|---|---|---|---|---|---|
| FCR | |||||
| aFRR | |||||
| mFRR | |||||
| RR | |||||
| Black Start | |||||
| CR & ID | |||||
| Arbitrage- Commercial | |||||
| Arbitrage- Residential |
| Parameter | Scenario A | Scenario B | Scenario C | Scenario D | Scenario E |
|---|---|---|---|---|---|
| 2500 | 3125 | 3750 | 4375 | 5000 | |
| 92% | 93.5% | 95% | 96.5% | 98% |
| Service | Scenario A | Scenario B | Scenario C | Scenario D | Scenario E |
|---|---|---|---|---|---|
| FCR | 1373.4 | 233.9 | 149.4 | 119.7 | 104.5 |
| aFRR | 1373.4 | 266.6 | 167.3 | 132 | 113.9 |
| mFRR | 15,405.1 | 11,219.4 | 8827.6 | 7280 | 6196.6 |
| RR | 15,405.1 | 7180.7 | 4371.3 | 3032.6 | 2273.8 |
| Black start | 11,152.1 | 8932.5 | 7452.8 | 6395.9 | 5603.2 |
| CR and ID | 280.5 | 242.7 | 226.5 | 216.9 | 210.3 |
| Arbitrage- Commercial | 766.1 | 560.9 | 514.6 | 489.4 | 471.3 |
| Arbitrage- Residential | 1307.8 | 889.8 | 799.9 | 753.0 | 720.6 |
| Service | Scenario A | Scenario B | Scenario C | Scenario D | Scenario E |
|---|---|---|---|---|---|
| FCR | |||||
| aFRR | |||||
| mFRR | |||||
| RR | |||||
| Black Start | |||||
| CR & ID | |||||
| Arbitrage- Commercial | |||||
| Arbitrage- Residential |
| Domain | Scenario A | Scenario B | Scenario C | Scenario D | Scenario E |
|---|---|---|---|---|---|
| Economic | CR & ID | FCR | FCR | FCR | FCR |
| Environmental | CR & ID | CR & ID | FCR | FCR | FCR |
| Geopolitical | CR & ID | CR & ID | FCR | FCR | FCR |
Disclaimer/Publisher’s Note: The statements, opinions and data contained in all publications are solely those of the individual author(s) and contributor(s) and not of MDPI and/or the editor(s). MDPI and/or the editor(s) disclaim responsibility for any injury to people or property resulting from any ideas, methods, instructions or products referred to in the content. |
© 2023 by the authors. Licensee MDPI, Basel, Switzerland. This article is an open access article distributed under the terms and conditions of the Creative Commons Attribution (CC BY) license (https://creativecommons.org/licenses/by/4.0/).
Share and Cite
Cellura, S.; Mazza, A.; Bompard, E.; Corgnati, S. An Extended Approach to the Evaluation of Energy Storage Systems: A Case Study of Li-Ion Batteries. Electronics 2023, 12, 2391. https://doi.org/10.3390/electronics12112391
Cellura S, Mazza A, Bompard E, Corgnati S. An Extended Approach to the Evaluation of Energy Storage Systems: A Case Study of Li-Ion Batteries. Electronics. 2023; 12(11):2391. https://doi.org/10.3390/electronics12112391
Chicago/Turabian StyleCellura, Salvatore, Andrea Mazza, Ettore Bompard, and Stefano Corgnati. 2023. "An Extended Approach to the Evaluation of Energy Storage Systems: A Case Study of Li-Ion Batteries" Electronics 12, no. 11: 2391. https://doi.org/10.3390/electronics12112391