Abstract
In the context of the rapid development of the Internet and the Internet of Things technology, services based on location information have received more and more attention, and people gradually have higher expectations for the quality and experience of positioning services. At present, outdoor positioning technology is becoming mature, but different from empty outdoor areas, there is a highly complex indoor environment with many interference factors, so it is difficult to receive effective satellite signals. To realize the smooth transition of whole-field positioning, it is necessary to study an economical and efficient indoor positioning technology. The existing indoor positioning technologies have some problems, so this paper comprehensively uses the resource-rich Wi-Fi signal, Frequency Modulation (FM) signal and Digital Terrestrial Multimedia Broadcast (DTMB) signal as the positioning data sources, and proposes a fingerprint fusion positioning method based on the wireless signal distribution characteristic. Experiments show that the proposed method improves localization accuracy by 30% compared to localization with Wi-Fi alone.
1. Introduction
Modern social services show a trend of diversification and high quality, among which location services have become indispensable parts of many industrial fields [1]. To further adapt to the application needs of daily life and special scenarios, it is necessary to obtain more accurate location information. According to statistics, people living in indoor areas in daily life account for more than 70% of the total [2]. However, the signal of indoor satellites is weak [3], and there are a large number of signal interference factors, so more accurate and efficient indoor positioning technology has become a research hotspot in recent years.
The fingerprint fusion positioning system based on the wireless signal distribution characteristic is divided into three important links. Firstly, to improve the accuracy of the Bayesian positioning algorithm, it is necessary to calculate the distribution characteristic of different signals, obtain indexes according to regional information and time information, access the designated fingerprint library, realize the multi-level fingerprint structure, and use multi-source data for the final localization according to the relationship between different positioning results.
According to the differences in positioning principles, positioning methods can be divided into track calculation, triangulation, multilateral positioning, proximity detection, fingerprint positioning, etc. Using the wireless signal for indoor positioning will inevitably face the signal transmission problem under non-visual distance conditions, as there are obstacles between the signal transmitter and the signal receiving end which affect the wireless signal and cause reflection, refraction, diffraction, scattering, and other phenomena, resulting in multipath interference [4]. Therefore, for the indoor conditions of a complex environment, fingerprint positioning technology is mostly adopted.
With the deepening of research, the accuracy and stability of positioning with a single data source have difficult meeting the higher requirements, and a more effective method is to integrate [5] with multiple positioning technologies. Fusion location technology usually needs to consider three aspects, including data source, positioning algorithm, and fusion weight. Data source refers to the signal data source used to provide information characteristic, which needs to determine the selection of data sources; positioning algorithm, including data characteristic matching algorithm and information decision fusion algorithm, is the core content of the whole fusion positioning system; fusion weight is the fusion mode of the positioning system, repeatedly debugging the system parameters to achieve the optimal positioning result. In recent years, many scholars have been engaged in the research of indoor fusion positioning. The literature [6] proposes a hybrid positioning technology based on the combination of radio waves and geomagnetic fingerprint technology, which can realize the real-time monitoring and tracking of the location information of medical staff in the hospital by installing a series of magnetic field sensors inside the hospital [6]. The geomagnetic induction technology may be disturbed in specific environments, thus affecting the accuracy of positioning. In addition, the technique may also be influenced by interference factors such as metal objects. The literature [7] presents a technique that combines OFDM (orthogonal frequency division multiplexing) and particle filtering techniques for indoor positioning [7]. Although it has certain advantages and application prospects, there are also some shortcomings. For example, because the algorithm relies on the user’s voice data to obtain location information, it may be affected by environmental noise, signal occlusion, and other factors in practical application, resulting in insufficient positioning accuracy. The paper [5] proposes an indoor localization method based on WiFi (wireless LAN) and PDR (pulse differential localization) technology, which uses the propagation characteristics of WiFi signal and the accuracy of PDR technology [8]. Although this method improves the accuracy and reliability of positioning, there are still problems concerning limited signal penetration ability. For example, the signal in this method will weaken after passing through obstacles (such as walls, furniture, etc.), which affects the accuracy of positioning. Therefore, the method may be applicable to open spaces and has limited effect for confined spaces or complex environments. There are many problems in indoor fusion localization technology. On the basis of improving the above problems [5], this paper proposes a fingerprint fusion localization method based on wireless signal distribution characteristics, which assigns different distribution models for different signals to improve the accuracy of the Bayesian positioning algorithm, introduces a multi-level fingerprint structure to index the index, and adjusts the fusion weight to optimize the system positioning performance.
2. Materials and Methods
Research manuscripts reporting large datasets that are deposited in a publicly available database should specify where the data have been deposited and provide the relevant accession numbers. If the accession numbers have not yet been obtained at the time of submission, please state that they will be provided during review. They must be provided prior to publication. The fingerprint fusion positioning system based on the wireless signal distribution characteristic was divided into three important links. Firstly, to improve the accuracy of the Bayesian positioning algorithm, it is necessary to calculate the distribution characteristic of different signals, obtain indexes according to regional information and time information, access the designated fingerprint library, realize the multi-level fingerprint structure, and use multi-source data for the final localization [9] according to the relationship between different positioning results.
2.1. Distribution Properties of the Signal
The Bayesian positioning algorithm based on the signal distribution characteristic needs to collect the received signal data of each reference point successively and establish a fingerprint library before positioning. During the online positioning, the probability of the target being located at each reference point was calculated according to the signal received in real-time, based on which the estimated coordinate [10] of the target position is obtained. When establishing the fingerprint model and calculating the probability, it is necessary to use the signal distribution model. The traditional Bayesian algorithm usually uses the Gaussian distribution model for calculation, but there are many possibilities for the actual distribution of the signals. If the distribution model is not selected properly, the positioning effect will also be seriously affected.
In this paper, a large number of statistics were made on the RSSI of Wi-Fi, FM, and DTMB signals, respectively. To reduce the influence of different factors on the statistical results, the receiving position and signal characteristic were fixed during the observation process, respectively. Here, the signal characteristic refers to different AP or signal frequencies. According to the observations, the three signal distribution models mentioned above are final.
Figure 1 shows the partial statistical results of the Wi-Fi signal.
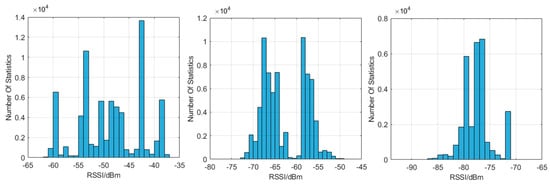
Figure 1.
The RSSI statistical histogram of the Wi-Fi signal.
As shown in Figure 1, the distribution of the Wi-Fi signal is difficult to describe [11] with known distribution models, so the polynomial model was chosen to fit the discrete Wi-Fi data. The assumed polynomial model is shown in Equation (1).
The parameters a0, a1, …, an can be solved according to the least squares method. In the offline stage, these parameters are stored in the position fingerprint library as the distribution characteristic of the model. When positioning, the probability values corresponding to different reference points can be calculated by substituting the online data into the polynomial model.
Figure 2 shows the partial statistical results of the FM signal.
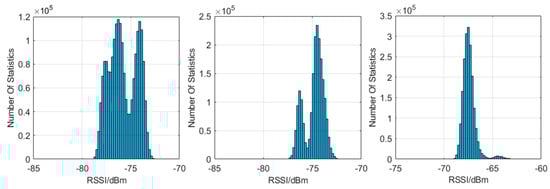
Figure 2.
The RSSI statistical histogram of the FM signal.
As shown in Figure 2, the distribution of FM signals can be described by a multimodal Gaussian distribution model. The multimodal Gaussian curve can be regarded as the superposition of multiple unimodal Gaussian curves. Taking the bimodal Gaussian model as an example, its probability density function is shown in Equation (2).
a, b, c in the above equation are the parameters of the model. With the increase of peaks, the number of parameters will also increase, and these parameters need to be stored in the database as the position fingerprint information features of the multi-peak Gaussian distribution model. Therefore, in order to avoid wasting too much storage space, the peak number of the model should not be set too high, under the condition that it can meet the positioning requirements. When fitting the data using the m-peak Gaussian model, according to the actual distribution, any data not above the m-peak can be fitted, so the unimodal distribution can be regarded as a special case of the multimodal distribution.
It is worth mentioning that the distribution of FM signals is different in different periods, as shown in Figure 3. However, after three consecutive days of testing, the FM signal in the same period found that, although the distribution model parameters of the signal were not the same, the overall distribution state of the signal did not produce large differences and there was almost no change in the number of peaks, as shown in Figure 4.
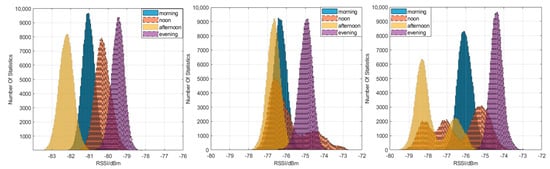
Figure 3.
Histogram of the FM signal statistics for the different periods.
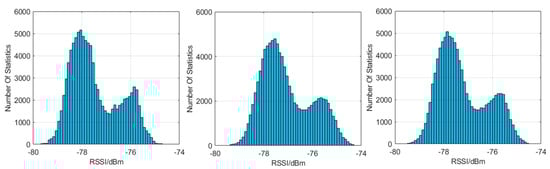
Figure 4.
Histogram of the FM signal statistics for the same period.
Figure 5 shows the partial statistical results of the DTMB signal.
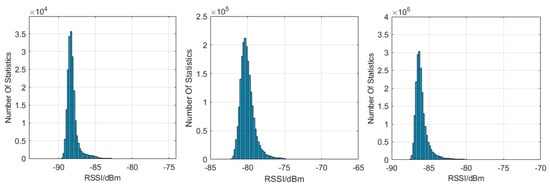
Figure 5.
The RSSI statistical histogram of the DTMB signal.
As shown in Figure 5, the “trailing” phenomenon of the signal statistics was found repeatedly while observing the received DTMB signal, and this data distribution state is closer to the Rayleigh distribution relative to the Gaussian distribution. The Rayleigh distribution is a distribution model [12] used to describe the time-varying characteristic of independent multipath components or flat fading signal receiving envelopes, and its probability density function is shown in Equation (3).
The parameters of the Rayleigh distribution model are in this formula, which is the feature information that needs to be stored in the location fingerprint database. The data x require a positive value, but the received signal RSSI unit is dBm, and the value is generally less than zero. Therefore, the processing of the data is needed before fitting the distribution model, adding a bias parameter, b, to convert Equation (3) into the form of Equation (4).
In contrast to the FM signals, the DTMB signal did not clearly show the time-related differences in the signal distribution, so the segmentation of the fingerprint libraries in different periods was not considered in the process of using the DTMB localization.
2.2. Multistage Fingerprint Structure
This paper adopts a multi-level structure of the location fingerprint database when online positioning by establishing the index to access a part of the fingerprint data. This achieves the purpose of saving computing resources. First, the fingerprint data in different periods are marked for the signal with distribution time degeneration, and the time index was obtained directly according to the time information when positioning.
In addition, when the overall positioning area covers a large physical space, each fingerprint matching requires comparing the fingerprint data of the entire positioning space [13], which wastes a great deal of resources. Therefore, before positioning, a pre-trained classifier was used to initially screen out the region where the target is located, obtain a region index, and search the target fingerprint set jointly with the temporal index, thus reducing the matching time of fingerprint localization. The multi-level fingerprint localization process is shown in Figure 6.
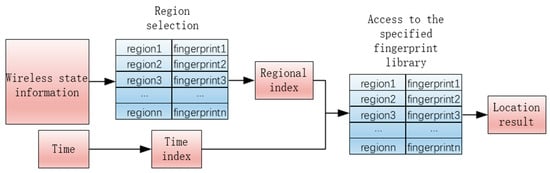
Figure 6.
Flow chart of multilevel fingerprint positioning.
When obtaining a region index, you do not have to determine the exact location of the target, just get the approximate range of location. In this paper, Support Vector Machine (SVM) was used to conduct region classification. Combined with map information, the positioning space was divided into one region corresponding to a label. In the offline stage, the RSSI of wireless signal is the input to train the region classifier.
2.3. Multi-Source Data Self-Decision Fusion Localization Algorithm
After obtaining the specified subset of fingerprint data, the final positioning process was entered. First, the main positioning source and the auxiliary positioning source are selected. In this paper, Wi-Fi is used as the main source, and FM and DTMB are used together as the auxiliary source to avoid the overcompensation phenomenon caused by using a single auxiliary source.
In the positioning phase, a primary positioning result was obtained through the main positioning source, and the auxiliary positioning source is also used for positioning. In order to initially reduce the influence of signal fluctuations on positioning accuracy, it is necessary to use auxiliary positioning sources to calculate n positioning results in a short time. Since each collection and positioning of information takes a certain amount of time, the value of n should not be too large. After n results were obtained from the auxiliary location source, the sum of the distance from the remaining location results was calculated for each auxiliary location result coordinate, as shown in Equation (5).
After calculating the corresponding distance of each positioning result, the distance and result were sorted from small to large. The smaller the sum of the distances, the higher the reliability of the positioning result, while positioning results with larger distance sums are considered invalid positioning results. Set a parameter k, extract the first k positioning results from the above ranking results, put them into the positioning result set of the signal source, and give the corresponding weights according to the corresponding distance and size of the different positioning results [14]. The calculation method is as shown in Equation (6).
The auxiliary source weighted positioning coordinates shown in Equation (7) were then obtained.
After entering the reliability of the auxiliary source determination stage, assuming that the weighted localization results obtained from the auxiliary data source a and the auxiliary data source b are law and lbw, respectively, the distance between the weighted localization results and the primary localization results is dam and dbm, respectively, artificially set a threshold , and discuss the relationship between the distance and threshold to make different decisions. The following introduces four possible situations. (1) Neither dam nor dbm exceeded the threshold value. In this case, the positioning results of the auxiliary source a and the auxiliary source b are both close to the main positioning result. At this time, it can be considered that the auxiliary sources a and b can compensate for the main positioning source and jointly decide on the final positioning result. (2) One out of dam and dbm does not exceed the threshold value , and the other is higher than the threshold value . At this time, the situation shows that only one of the two auxiliary sources are close to the main positioning result. Assuming that the auxiliary data source a is close, the positioning result of the data source b is considered invalid. Therefore, in order to make the result decision, only the main positioning source and the auxiliary positioning source a need to be considered. (3) dam and dbm are higher than , but dab does not exceed the threshold . The localization results of the auxiliary sources deviate from the main localization results, but the localization results of the auxiliary sources are similar. It can be considered that the result of the main localization source has a large error and the reliability of the auxiliary source is high. The two auxiliary sources participate in the decision of the final fusion localization. (4) dam and dbm are higher than , and dab is also above the threshold . Due to the large differences in the positioning results of different auxiliary sources, it is difficult to ensure the reliability of the auxiliary data source. At this time, only the positioning coordinates of the main positioning source were selected as the global positioning result.
In conclusion, before the weighted fusion of multiple localization results, the fusion weights can be automatically adjusted according to the distance relationship between the localization results of different signal sources. Multi-source data self-decision fusion positioning algorithm expression are shown in Equation (8).
3. Results
The positioning space selected in this paper is the laboratory place for daily learning. It includes three laboratory rooms and a corridor, with a total area of 7 × 24 = 168 . There were 107 reference points in the whole positioning space, the distance between adjacent reference points in each separate area was 1 m, and there were 183 test points. The relative positional relationship of the localization space to the test point of the reference point is shown in Figure 7.
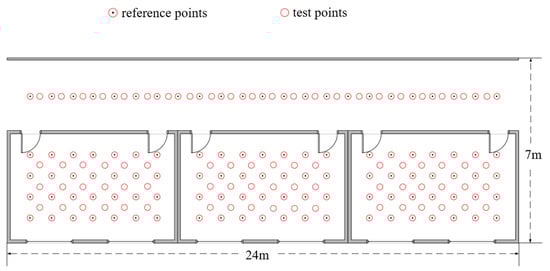
Figure 7.
Positioning space diagram.
Although the selection of the above positioning space is limited to the laboratory and corridors, the experimental environment selected in this experiment is diverse. Among the three laboratories selected above, there are two laboratories with complex environment, with items such as a test bench, computer, bookshelf, and chair. These account for 80% of the laboratory room area; there was a laboratory with a simple environment, which only contained a chair and a computer, which accounted for less than 5% of the laboratory room area. At the same time, compared with the laboratory room, the personnel flow in the corridor was relatively large. In conclusion, the experimental environment contained complex environments, contracted environments, environments with small personnel mobility, and an environment with large personnel mobility. Therefore, the applied test methods and the experimental conclusions obtained in this experimental environment are universal.
A large number of experiments were performed in the above experimental environment, and the experimental results are as described below. When mapping using the Wi-Fi signal, the average localization error obtained using a Gaussian distribution model was 2.64 m and 2.25 m using the putative distribution model. For localization using FM signals, the average localization error obtained using a Gaussian distribution model was 3.57 m and 2.65 m using the putative distribution model. For localization using the DTMB signal, the average localization error obtained using the Gaussian distribution model was 3.44 m and 2.80 m using the inferred distribution model. The experimental results show that the performance of Bayesian localization algorithm seriously depends on the selection of signal distribution model. In the experiment, the statistical analysis of the signal model can be reasonably inferred by collecting a large amount of signal data to improve the localization accuracy of Bayesian algorithm based on signal distribution characteristics. The more detailed Bayesian localization results of Wi-Fi, FM, and DTMB signals are summarized in Table 1.

Table 1.
Bayesian localization results of wireless signals.
The multi-source data self-decision fusion localization algorithm was compared with the Wi-Fi localization alone, as shown in Figure 8, while either FM or DTMB was introduced for single-source-assisted localization. The localization method presented in this paper has an average error of 1.41 m, which improves the final localization accuracy by 30% compared to the Wi-Fi localization. Figure 9 is a plot of the error accumulation distribution for the different localization methods. As shown in Figure 9, if one of the FM signals or DTMB signals were used to assist Wi-Fi for positioning, the final positioning error is slightly higher than the result obtained by Wi-Fi alone. The accuracy of Wi-Fi with FM signal and DTMB signal was greatly improved.
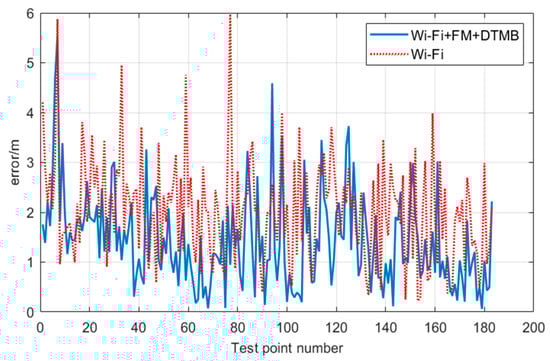
Figure 8.
Comparison of the error distribution of the localization system before and after the fusion.
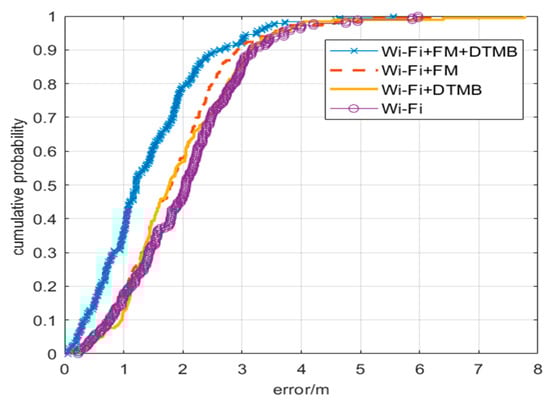
Figure 9.
Cumulative distribution diagram of localization errors.
4. Discussion
With the upgrading of intelligent technology, intelligent services adapted to various needs have emerged one after another. A large number of hardware and software applications have put forward the requirements for high-quality positioning services. This paper proposes a fingerprint fusion localization method based on wireless signal distribution characteristic, using common Wi-Fi, FM, and DTMB as localization sources, reducing the deployment costs, and exploring the potential possibility of ubiquitous wireless signals as a fusion localization source.
The fingerprint fusion positioning method based on the wireless signal distribution characteristics proposed in this paper mainly innovates in the following three aspects. Firstly, the selection of the signaling model. When using the Wi-Fi signal for positioning, compared with the positioning results obtained by simply using the Gaussian distribution model, the accuracy of the positioning results obtained by selecting the inferred model is at least 15% higher. When using FM signal for positioning, compared with the positioning results obtained by simply using the Gaussian distribution model, the accuracy of the positioning results obtained by selecting the inferred model was improved by at least 25%. When using the DTMB signal, the accuracy of the positioning results obtained by selecting the inferred model was at least 18% higher compared with the positioning results obtained by simply using the Gaussian distribution model. Secondly, it builds a multi-stage structured positional fingerprint database for multi-level search based on the spatial index and temporal index, which greatly reduces the fingerprint matching time. Finally, the self-decision fusion localization algorithm was proposed, which is used to dynamically assign the weight in the final result according to the relationship between the main signal source and the auxiliary signal source.
On the basis of the theory, we conducted many experiments and collected a large amount of data to count the RSSI of different signals to assign the most appropriate distribution model for each signal. After experiment verification, the Bayesian localization algorithm based on the signal distribution characteristic had higher accuracy compared with other fingerprint localization algorithms. Based on this result, the localization experiments were conducted in an indoor area of 7 × 24 . The results show that the average localization error of the proposed multi-source data self-decision fusion localization algorithm is about 1.41 m, which improves the localization accuracy by 30% compared to using Wi-Fi alone.
Author Contributions
Conceptualization, B.Y.; methodology, J.Y.; software, S.L. (Shichen Li); validation, S.L. (Shichen Li); formal analysis, S.L. (Shuo Li); investigation, H.W. and C.C.; resources, H.W. and C.C.; data curation, H.W.; writing—original draft preparation, X.L.; writing—review and editing, X.L.; visualization, S.L. (Shuo Li); supervision, J.Y.; project administration, B.Y.; funding acquisition, B.Y. All authors have read and agreed to the published version of the manuscript.
Funding
This research was funded by State Key Laboratory of Satellite Navigation System and Equipment Technology, grant number CEPNT-2021KF-13.
Data Availability Statement
The data that support the findings of this study are available from the corresponding author upon reasonable request.
Acknowledgments
We would like to express our sincere gratitude to all individuals who have contributed to the preparation of this paper, such as some researchers of The 54th Research Institute of CETC and some students and teachers of information and Communication Engineering of Nankai University. Their assistance and support have been invaluable throughout the completion of this research. We also wish to thank the reviewers for their constructive comments and suggestions, which helped to improve the quality of this paper.
Conflicts of Interest
We declare that we have no financial and personal relationships with other people or organizations that can inappropriately influence our work, there is no professional or other personal interest of any nature or kind in any product, service and company that could be constructed as influencing the position presented in, or the review of the manuscript entitled.
References
- Yang, M.; Wu, H. Deep learning approach for device free localization based on Internet of Things. Electron. Lett. 2020, 56, 575–577. [Google Scholar] [CrossRef]
- Deng, Z.L.; Yu, Y.P.; Yuan, X.; Wan, N.; Yang, L. Situation and development tendency of indoor positioning. China Commun. 2013, 10, 42–55. [Google Scholar] [CrossRef]
- Liu, H.; Darabi, H.; Banerjee, P.; Liu, J. Survey of Wireless Indoor Position Techniques and Systems. IEEE Trans. Syst. Man Cybernatics Part C 2007, 37, 1067–1080. [Google Scholar] [CrossRef]
- Chehri, A.; Fortier, P.; Tardif, P.M. Time delay estimation for UWB non coherent receiver in indoor environment, from theory to practice. J. Wirel. Commun. Netw. 2018, 2018, 284. [Google Scholar] [CrossRef]
- Sun, J.; Yu, X.; Liu, D.; Zhai, Y.; Wang, C. Research on Indoor Location Technology based on the Fusion of WiFi and PDR. In Proceedings of the 2020 13th International Conference on Intelligent Computation Technology and Automation (ICICTA), Xi’an, China, 24–25 October 2020; pp. 416–419. [Google Scholar]
- Yamashita, K.; Oyama, S.; Otani, T.; Yamashita, S.; Furukawa, T.; Kobayashi, D.; Sato, K.; Sugano, A.; Funada, C.; Mori, K.; et al. Smart hospital infrastructure: Geomagnetic in-hospital medical worker tracking. J. Am. Med. Inf. Assoc. 2021, 28, 477–486. [Google Scholar] [CrossRef] [PubMed]
- Wang, J.; Li, H.; Zhang, X.; Wu, R. VLC-based indoor positioning algorithm combined with OFDM and particle filter. China Commun. 2019, 16, 86–96. [Google Scholar]
- Youssef, A.; Krumm, J.; Miller, E.; Cermak, G.; Horvitz, E. Computing location from ambient FM radio signals. In Proceedings of the IEEE Wireless Communications and Networking Conference (WCNC’05), New Orleans, LA, USA, 13–17 March 2005; Volume 2, pp. 824–829. [Google Scholar]
- Lee, Y.H.; Lin, C.S. WiFi fingerprinting for indoor room localization based on CRF prediction. In Proceedings of the 2016 International Symposium on Computer, Consumer and Control(IS3C), Xi’an, China, 4–6 July 2016. [Google Scholar]
- He, S.; Chan, S.-H.G. Wi-Fi Fingerprint-Based Indoor Positioning: Recent Advances and Comparisons. IEEE Commun. Surv. Tutor. 2016, 18, 466–490. [Google Scholar] [CrossRef]
- Ko, C.-H.; Wu, S.-H. A Framework for Proactive Indoor Positioning in Densely Deployed WiFi Networks. IEEE Trans. Mob. Comput. 2022, 21, 1–15. [Google Scholar] [CrossRef]
- Taricco, G. On the Convergence of Multipath Fading Channel Gains to the Rayleigh Distribution. IEEE Wirel. Commun. Lett. 2015, 4, 549–552. [Google Scholar] [CrossRef]
- Wu, H.; Wang, Q.; Zhao, Y.; Ma, X.; Yang, M.; Liu, B.; Tang, R.; Xu, X. Indoor localization using FM radio and DTMB signals. Radio Sci. 2016, 51, 1030–1037. [Google Scholar] [CrossRef]
- Yang, M.; Wu, H.; Liu, Z.; Ding, S.; Peng, H. Indoor Positioning Using Public FM and DTMB Signals Based on Compressive Sensing. China Commun. 2019, 16, 171–180. [Google Scholar] [CrossRef]


Disclaimer/Publisher’s Note: The statements, opinions and data contained in all publications are solely those of the individual author(s) and contributor(s) and not of MDPI and/or the editor(s). MDPI and/or the editor(s) disclaim responsibility for any injury to people or property resulting from any ideas, methods, instructions or products referred to in the content. |
© 2023 by the authors. Licensee MDPI, Basel, Switzerland. This article is an open access article distributed under the terms and conditions of the Creative Commons Attribution (CC BY) license (https://creativecommons.org/licenses/by/4.0/).