Article

Residual Depth Feature-Extraction Network for Infrared Small-Target Detection

School of Integrated Circuits and Electronics, Beijing Institute of Technology, Beijing 100081, China
*
Author to whom correspondence should be addressed.
Electronics 2023, 12(12), 2568; https://doi.org/10.3390/electronics12122568
Submission received: 7 April 2023 / Revised: 1 June 2023 / Accepted: 5 June 2023 / Published: 6 June 2023

Abstract

:
Deep-learning methods have exhibited exceptional performance in numerous target-detection domains, and their application is steadily expanding to include infrared small-target detection as well. However, the effect of existing deep-learning methods is weakened due to the lack of texture information and the low signal-to-noise ratio of infrared small-target images. To detect small targets in infrared images with limited information, a depth feature-extraction network based on a residual module is proposed in this paper. First, a global attention guidance enhancement module (GAGEM) is used to enhance the original infrared small target image in a single frame, which considers the global and local features. Second, this paper proposes a depth feature-extraction module (DFEM) for depth feature extraction. Our IRST-Involution adds the attention mechanism to the classic Involution module and combines it with the residual module for the feature extraction of the backbone network. Finally, the feature pyramid with self-learning weight parameters is used for feature fusion. The comparative experiments on three public datasets demonstrate that our proposed infrared small-target detection algorithm exhibits higher detection accuracy and better robustness.

1. Introduction

Infrared search and track systems (IRST) are widely used in various fields, including military target location and tracking, maritime rescue, defect detection, and outdoor fire prevention, among others [1]. Compared to other imaging methods such as radar detection, infrared detection offers several advantages, including long imaging distance, strong anti-jamming ability, clear images, and low cost [2]. However, infrared detection is not without its challenges, including unclear texture and loss of information [3]. The infrared sensing image is often affected by background clutter and detection distance, resulting in a low signal-to-clutter ratio (SCR) scene. As a result, dim small targets may be submerged in background clutter and noise, making target detection more challenging [4]. Recent years have seen significant improvements in the performance of infrared imaging equipment, enabling the capture of high-quality single-frame infrared images that provide the basic support for detecting infrared small targets [5]. The success or failure of the project depends heavily on the quality of the infrared small-target detection algorithm. Detecting the target is the primary requirement for the aforementioned application [6].
Over the past few decades, numerous methods have been proposed for infrared target detection, including filter-based methods [7], methods based on the human visual system (HVS) [8], low-rank and sparse representation methods [9], and deep-learning methods.
Filter-based methods: The use of max–mean and max–median filters [10] for infrared target detection was one of the earliest methods developed. Zheng et al. [11] used a modified Top-hat transformation and a difference in Gaussian filter to process a raw infrared image. In [12,13,14], a variety of improved infrared filters were designed. Although the filter-based method has a simple algorithm and can achieve real-time detection tasks end to end, the use of limited empirical features for target detection may result in poor accuracy and robustness in complex scenes.
Human visual system (HVS) method: This method utilizes the local difference between the target and the background to construct a saliency map that highlights the target for further detection. Local contrast measure (LCM) [15] is effective at enhancing the target area, but it can also amplify clutter with high background brightness. Improved algorithms based on LCM include novel local contrast measure (NLCM) [16] and relative local contrast measure (RLCM) [17]. Y. Wei et al. [18] proposed a biologically inspired method called multiscale patch-based contrast measure (MPCM), which adjusts the slider size according to the target size to enhance the saliency map. Multiscale local contrast measure (MLCM) [19] adds a local energy factor to calculate the impact of the central pixel on the Frobenius norm. Based on the human visual system, [20,21,22] incorporate mathematical functions that match the characteristics of small infrared targets. Weighted double local contrast measure (WDLCM) [23] utilizes a weighted function to fuse the standard deviation between the target area and the background area, as well as the variance within the target area, to enhance the target. However, the HVS method may not be effective in detecting small targets with lower brightness than the background.
Low-rank and sparse representation method: Gao et al. [24] proposed the Infrared Patch Image (IPI) algorithm, which transforms the problem into a low-rank matrix optimization problem. Later, they developed the reweighted IPI (ReWIPI) algorithm [25] to address the over-convergence problem of the IPI model by introducing weighted nuclear norm minimization. Another algorithm, the Nonconvex Rank Approximation Model (NRAM) [26], uses the L_2,1 norm to suppress background clutter. The Reweighted Infrared Patch-Tensor method (RIPT) [27] detects infrared targets in the tensor domain. Improved algorithms have also been proposed [28,29,30]. These methods use mathematical optimization to extract features for infrared small-target detection, addressing the limitations of manually designed filters based on experience. However, the convergence speed of the optimization algorithm may not meet real-time requirements as the background complexity increases.
Deep-learning method: In recent years, the emergence of infrared small-target datasets has led to the rapid development of data-driven detection methods [31]. Deep learning for infrared small-target detection completely discards the limitations of manual feature extraction, and the trained network can also achieve end-to-end real-time requirements. Initially, researchers proposed network architectures that combine the advantages of model-driven and data-driven approaches. For example, Hou et al. [32] constructed RISTDNet, which combines manual local comparison measurement with convolutional neural network feature extraction. ALCNet [33] designed a cyclic shift scheme to combine local contrast measurement with an end-to-end neural network. To fully utilize the ability of automatic feature extraction of convolutional networks, the proposed network architecture gradually becomes purely data-driven. MDvsFA [34] uses two adversarial training networks to minimize false alarms and misdetections, and finally achieves network convergence. The effect of GAN networks on enhancing infrared small-target synthetic data is also remarkable [35]. IAANet [36] introduces a region proposal network (RPN) to obtain coarse target areas and filters the background to narrow the extraction range of the backbone network. DNANet [37] has designed a dense nested interactive module to increase the ability to extract high-level and low-level features. IRSTFormer [38] is the first to apply Transformers to infrared images. AFFPN [39] uses atrous convolution with three different dilation rates to increase the perceptual field. The ACM [40] has designed a feature fusion module from top to bottom and from bottom to top to integrate the deep feature map and shallow feature map. The AGPCNet [41] proposed by Zhang introduced an attention mechanism and asymmetric feature fusion. MPANet [42] and ISTDU-Net [43] also propose some ideas for improvement. The above methods have achieved good results and overcome the limitations of manual feature extraction. However, the features that can be extracted before the infrared image is input into the network are limited, and the backbone network designs are mostly based on existing conventional target-detection networks, which may not be suitable for detecting small infrared targets.
To overcome the above problems, this paper proposes a residual depth feature-extraction network. The main contributions of this paper are as follows: (1) To address single-frame images with only gray information, this paper proposes the global attention guidance enhancement module (GAGEM) which combines global planning with local details to enhance the input image features. (2) We designed a new DFEMs backbone network that is ideal for detecting small infrared targets. This network incorporates IRST-Involution for increased detail extraction, while also retaining the benefits of residual modules. (3) A learnable Feature Pyramid Network (FPN) with fusion weights has been designed for feature fusion, and it has achieved the best results on the existing dataset.
This paper is organized as follows: In Section 2, we review the related work on IRST and provide a detailed description of the proposed residual depth feature-extraction network (RDFENet). In Section 3, we report on the experimental results and evaluation of the proposed method. Finally, in Section 4, we present our conclusions and outline future research directions.

2. Materials and Methods

The overall algorithm structure is depicted in Figure 1, which is comprised of three parts: GAGEM, DFEMs, and a learnable feature pyramid network. First, GAGEM enhances the features of the input original image by dividing it into grids of varying sizes and then utilizing the local feature mean value as the attention header to preprocess the image. Next, DFEMs are used to extract depth features from the images, and our convolutional kernel, IRST-Involution, is particularly effective in extracting features of small infrared targets. Finally, a learnable feature pyramid network is employed to output a segmented image that is the same size as the original input image.

2.1. The Global Attention Guidanceenhancement Module (GAGEM)

2.1.1. Motivation

Before the emergence of convolutional neural networks (CNNs), the extraction of features from small infrared targets relied on local contrast between the target and background pixels. Several conventional methods primarily concentrate on distinguishing the target from the background within a fixed n × n (usually 9) region. Examples include methods based on the human visual system (HVS). Additionally, salt-and-pepper noise may be mistaken for a small target within small local blocks but can be eliminated by a simple mean square filter applied to the entire image. To address this issue, we propose using global attention as a guiding mechanism for local feature extraction, thus enabling feature enhancement by combining the global background and local details of the image to predict whether a pixel is a target.

2.1.2. The Global Attention Guidance Enhancement Module

As shown in Figure 2, we divided the single-frame infrared image into small blocks with a length of H / s i and width of W / s i . The nonlocal block was then performed on each divided local block (( B l o c k s i 2 )) to obtain the relationship between adjacent pixels within the block. The nonlocal block uses a 1 × 1 convolution kernel to produce three feature graph outputs, which can extract features between pixels to the maximum extent. The algorithm flow of the nonlocal block is shown in Algorithm 1. The nonlocal approach utilizes Q* reshaping (K) × V to compute the association weight between a particular pixel and all other pixels in the entire image, therefore amplifying the interaction between the pixel of interest and the entire image. Additionally, we used the adaptive avgpool2d function to calculate global average pooling, and the output is B l o c k a v g . Finally, we performed channel multiplication between the B l o c k s i 2 calculated above and the B l o c k a v g . To further reduce the amount of computation, we introduced channel compression in the above two-step reasoning process. The specific compression ratio was set to 4 based on experimental results. The local blocks are described by the following formula:
B l o c k s i 2 = b l o c k 1 , b l o c k 2 , , b l o c k s i 2
B l o c k a v g = A d a p t i v e a v g p o o l 2 d   X
where X is the input image, X R b a t c h s i z e c H W , B l o c k R b a t c h s i z e c H s i W s i .   b l o c k i is the divided local area, and Adaptiveavgpool2d is the adaptive average pooling function. Considering the small targets on the block boundaries are prone to be missed and the potential overfitting issue during the training process, our GAGEM module adopts a residual form, which treats the original infrared image as one of the feature channels that enhances the output feature maps of GAGEM. The output formula of GAGEM is as follows:
f o u t p u t i = m u l ( b l o c k i j , B l o c k a v g i )
f o u t p u t = i = 0 3 f o u t p u t i + X
where m u l is the multiplication of corresponding pixel values, i = 1 , 2 , 3 ; j = 1 , 2 , 3 s i 2 . f o u t p u t i is the result of multiplication, and f o u t p u t is the output of GAGEM.
Algorithm 1 Implementation Algorithm of Nonlocal.
 1: Input X R c h w
 2: Update Q = conv1*1(X), Q R c r h w ;
        K = conv1*1(X), K R c r h w ;
        V = conv1*1(X), V R c h w .
 3: Update Q = Reshape(Q), Q R h w c / r ;
        K = Reshape(K), K R c r h w ;
        Energy = Q*K; Attention = SoftMax (Energy);
 4: Update V = Reshape(V), V R h w c ;
        Out = V * Energy;
 5: Output Out = Reshape (Out), Out R C h w
Note: conv1 × 1() represents 1 × 1 convolution kernel;
    SoftMax() represents torch.softmax();
The reason for dividing the input infrared image into smaller areas for processing is due to the limited availability of information across the entire image. Performing local correlation analysis on pixels can help amplify detailed features of small infrared targets while greatly reducing computation requirements. Drawing inspiration from CBAM’s channel attention mechanism [44], incorporating global pooling as an attention module can enhance channel characteristics and integrate both global and local relationships.

2.2. Depth Feature-Extraction Module (DFEMs)

The design principles of backbone networks for infrared small-target detection have yet to be fully established. Currently used methods, such as SSD, Faster-RCNN, YOLO, and Mask-RCNN, were originally proposed for visible-light datasets and are not necessarily optimal for small-target detection in the infrared spectrum. DFEMS is a backbone network model that has been specifically designed to extract information from infrared small targets. This model can be extended to other application scenarios involving infrared small targets.
The visible-light dataset contains many optical channels and high-resolution images, with COCO dataset images having pixels ≤ 640 × 480 and VOC dataset images having pixels ≤ 500 × 400. However, the SIRST infrared dataset used in this article has a lower resolution of 256 × 256 and fewer optical channels, which limits the number of features that the backbone network can extract. Additionally, the proportion of small infrared targets in the whole image is often too small to be easily distinguishable by the human eye. According to SPIE, an international organization, an area of less than 80 pixels in an image of 256 × 256 is considered a small target (i.e., less than 0.12% of the image is a small target). Existing methods often use pooling operations to eliminate redundant information and reduce computation. However, when detecting small targets, the small targets of single-digit pixels may be lost after several pooling operations. To address this problem, the backbone network designed in this paper avoids using traditional pooling operations.
Advancements in detection accuracy have prompted neural networks to grow deeper, allowing for the extraction of higher-dimensional features and leading to improved network performance. However, it is important to note that the texture features of the image are preserved in the shallow hidden layer output. Therefore, deepening the network may not necessarily improve the detection performance of small targets. To address this, our paper limits the number of backbone network layers to only 9, which is roughly equivalent to the structure of ResNet18.

2.2.1. Description of IRST-Involution

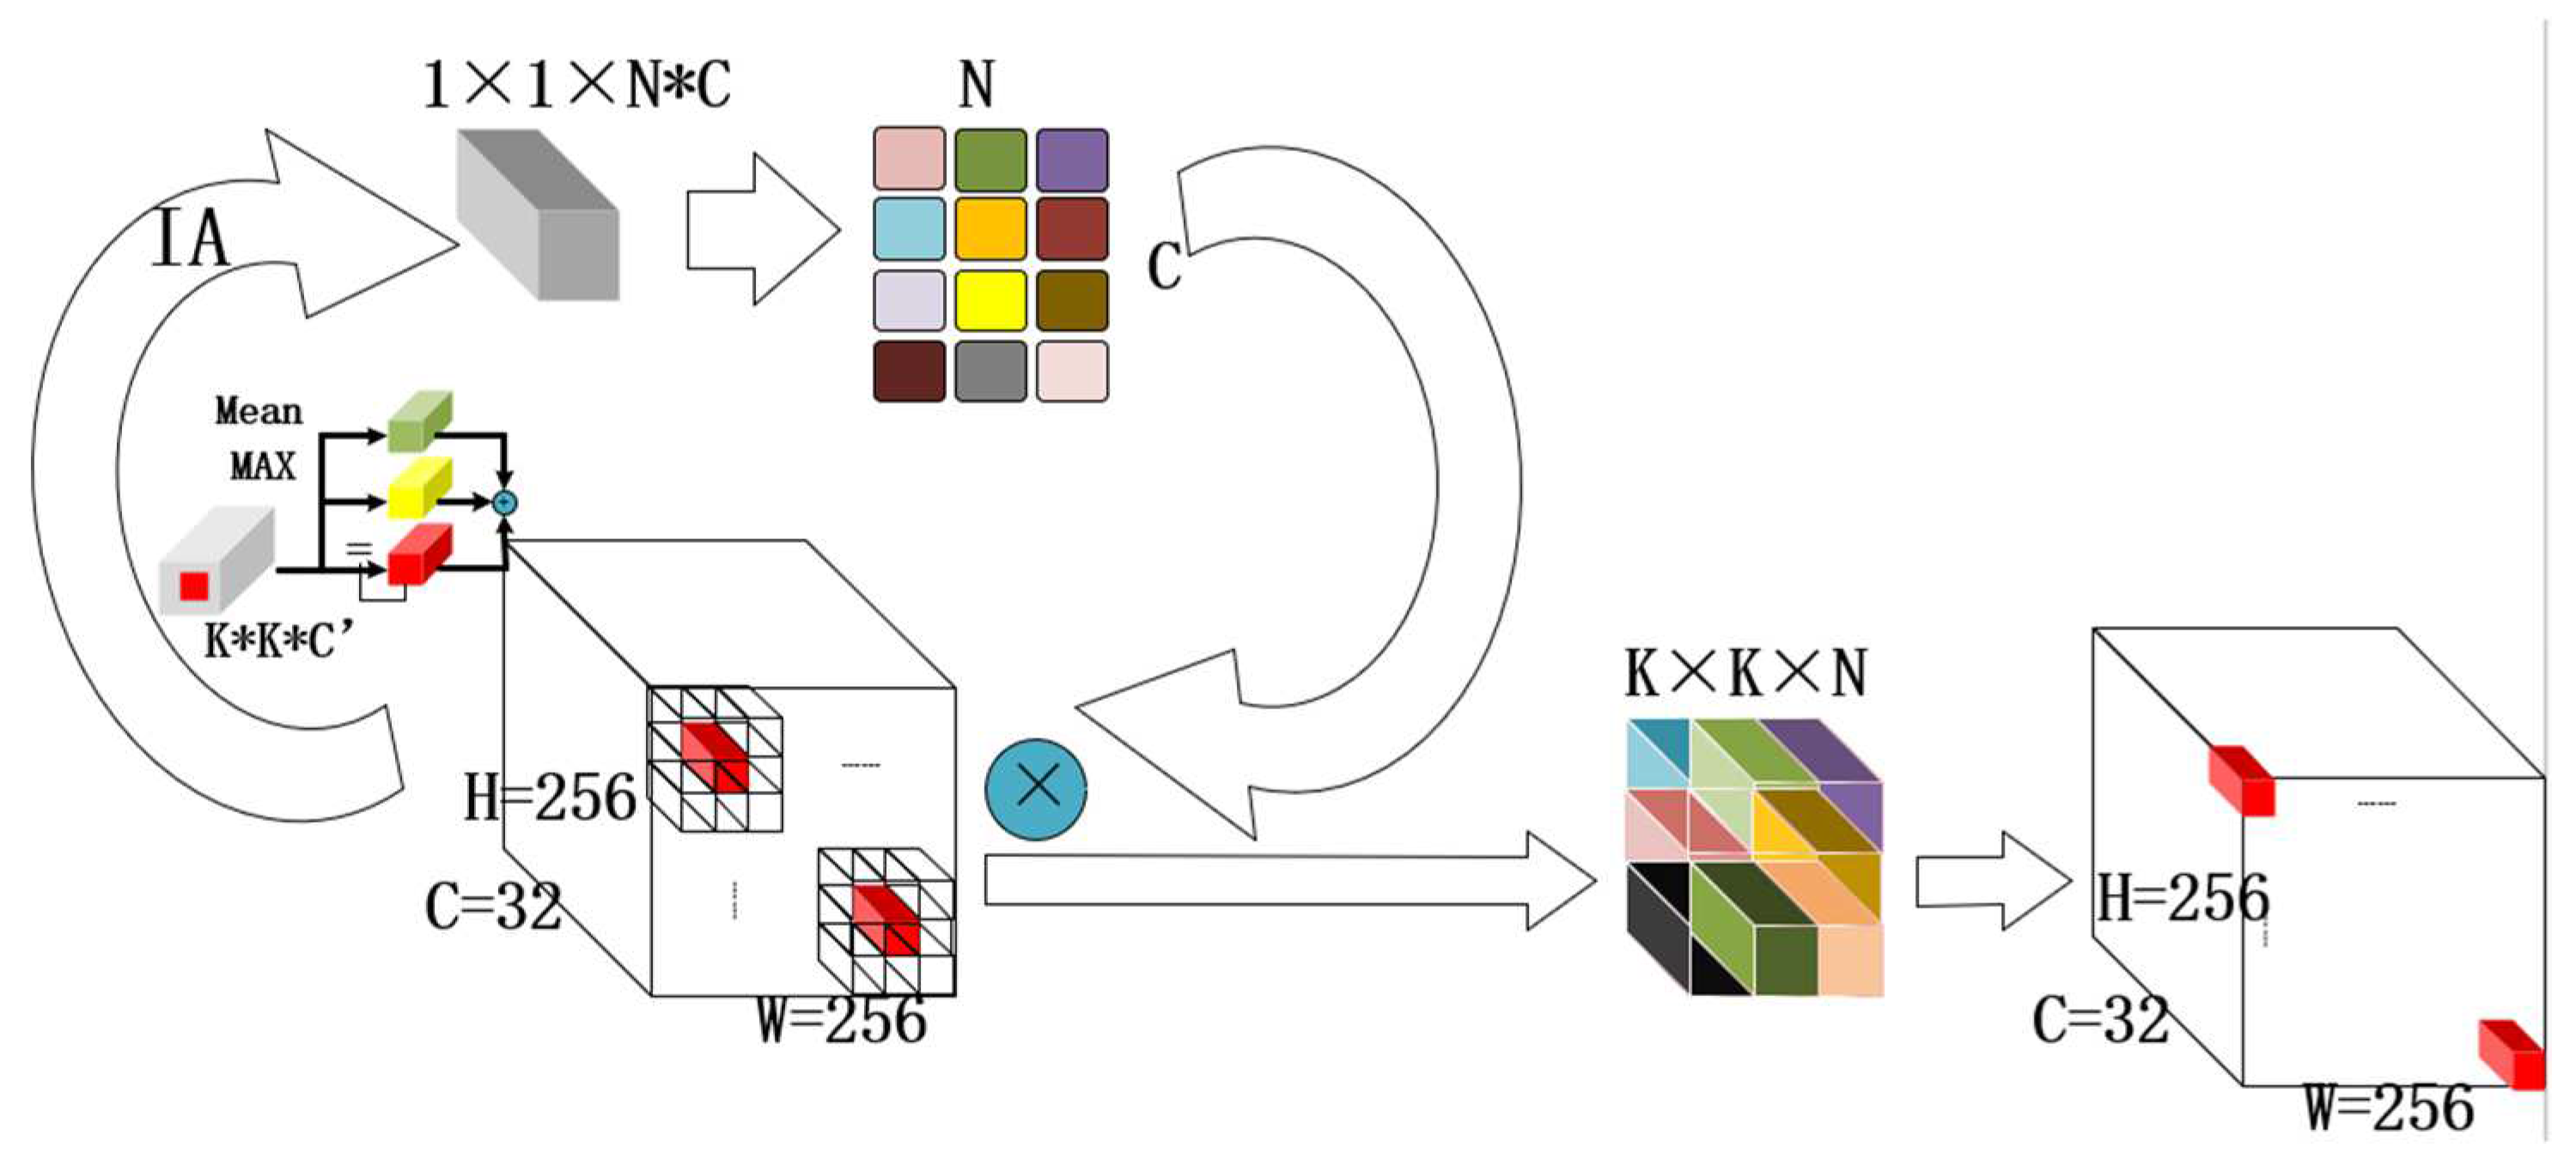
Figure 3 illustrates our proposed IRST-Involution, which is equivalent to a two-dimensional convolutional kernel of size K × K in a network. The “involution” was first introduced at the 2021 CVPR conference, where it was proposed to rethink the inherent attributes of traditional convolutional kernels in spatial and channel dimensions, and to introduce self-attention into visual learning. However, our experiments revealed that simply replacing the traditional convolutional layers with the self-attention Involution module did not lead to significant improvements in infrared small-target detection performance. We hypothesize that this is because the intrinsic identifiable features of small infrared targets are limited and the relationships between pixels are not complex. Many traditional methods assume that small infrared targets follow a Gaussian distribution. To address this issue, we first manually computed the average and maximum values of each K × K-sized superpixel, which represent the background and target characteristics of the infrared small-target detection process. Next, we fused the maximum and minimum values with the center pixel, which is the most likely location of small targets, to generate attention guidance for IRST-Involution. In terms of spatial representation, the superpixel space with dimensions of K × K introduces its dedicated attention mechanism, which disrupts the spatial invariance typically found in traditional convolutions. Our developed Infrared Attention (IA) mechanism specifically accounts for the prominent attributes of small infrared targets, such as their higher gray value and the relationship between the background and central pixels. As a result, IA demonstrates superior efficacy in extracting features from infrared small targets when compared to the self-attention mechanism. The calculation process is as follows:
IA = i = 1 K j = 1 K X i , j K × K + max X i , j +   X K + 1 2 , K + 1 2
where K represents the selected superpixel [16] size, i.e., the size of the sliding small window in the figure. IA represents the attention mechanism after fusion. X R C × k × k .
To further extract features, we enhance the dimensionality of the obtained IA through a Multilayer Perceptron (MLP) with a hidden layer containing only a 1 × 1 convolution kernel. Additionally, an attention head N is added to the MLP to increase feature dimensions and improve feature-extraction capabilities.
I A = M L P I A , I A   R C × 1 × 1 ; I A R N C × 1 × 1
To obtain the fused matrix out of dimensions KK × N, expand X and IA into two-dimensional matrices of dimensions KK × C and C × N, respectively, and then multiply the two matrices:
o u t k k × N = Mul ( Tran C × K × K K K × C X , Tran N × C × 1 C × N I A )
where Mul represents the matrix multiplication function, and Tran (x) represents the transformation of x into a two-dimensional matrix. o u t k k × N R k k × N .
After obtaining the fused matrix out of dimensions KK × N, it needs to be converted back to a 3D form of dimensions R k × k × N for the next group element-wise multiplication and summation. To address the redundancy issue in the channel dimension of traditional convolution, the N channels of the newly generated kernel are shared by the C channels of the input superpixel. The final output result should have the same size and channel dimension as the input. To our knowledge, this is the first application of the space-specificity and channel invariance principles of Involution in the domain of infrared small targets. Unlike traditional convolution, which treats all pixels equally in terms of spatial processing, IRST-Involution introduces a more suitable attention mechanism for small infrared targets within each superpixel. This approach effectively addresses the limitation of traditional convolution in fully utilizing the spatial information available in infrared images.

2.2.2. Depth Feature-Extraction Module

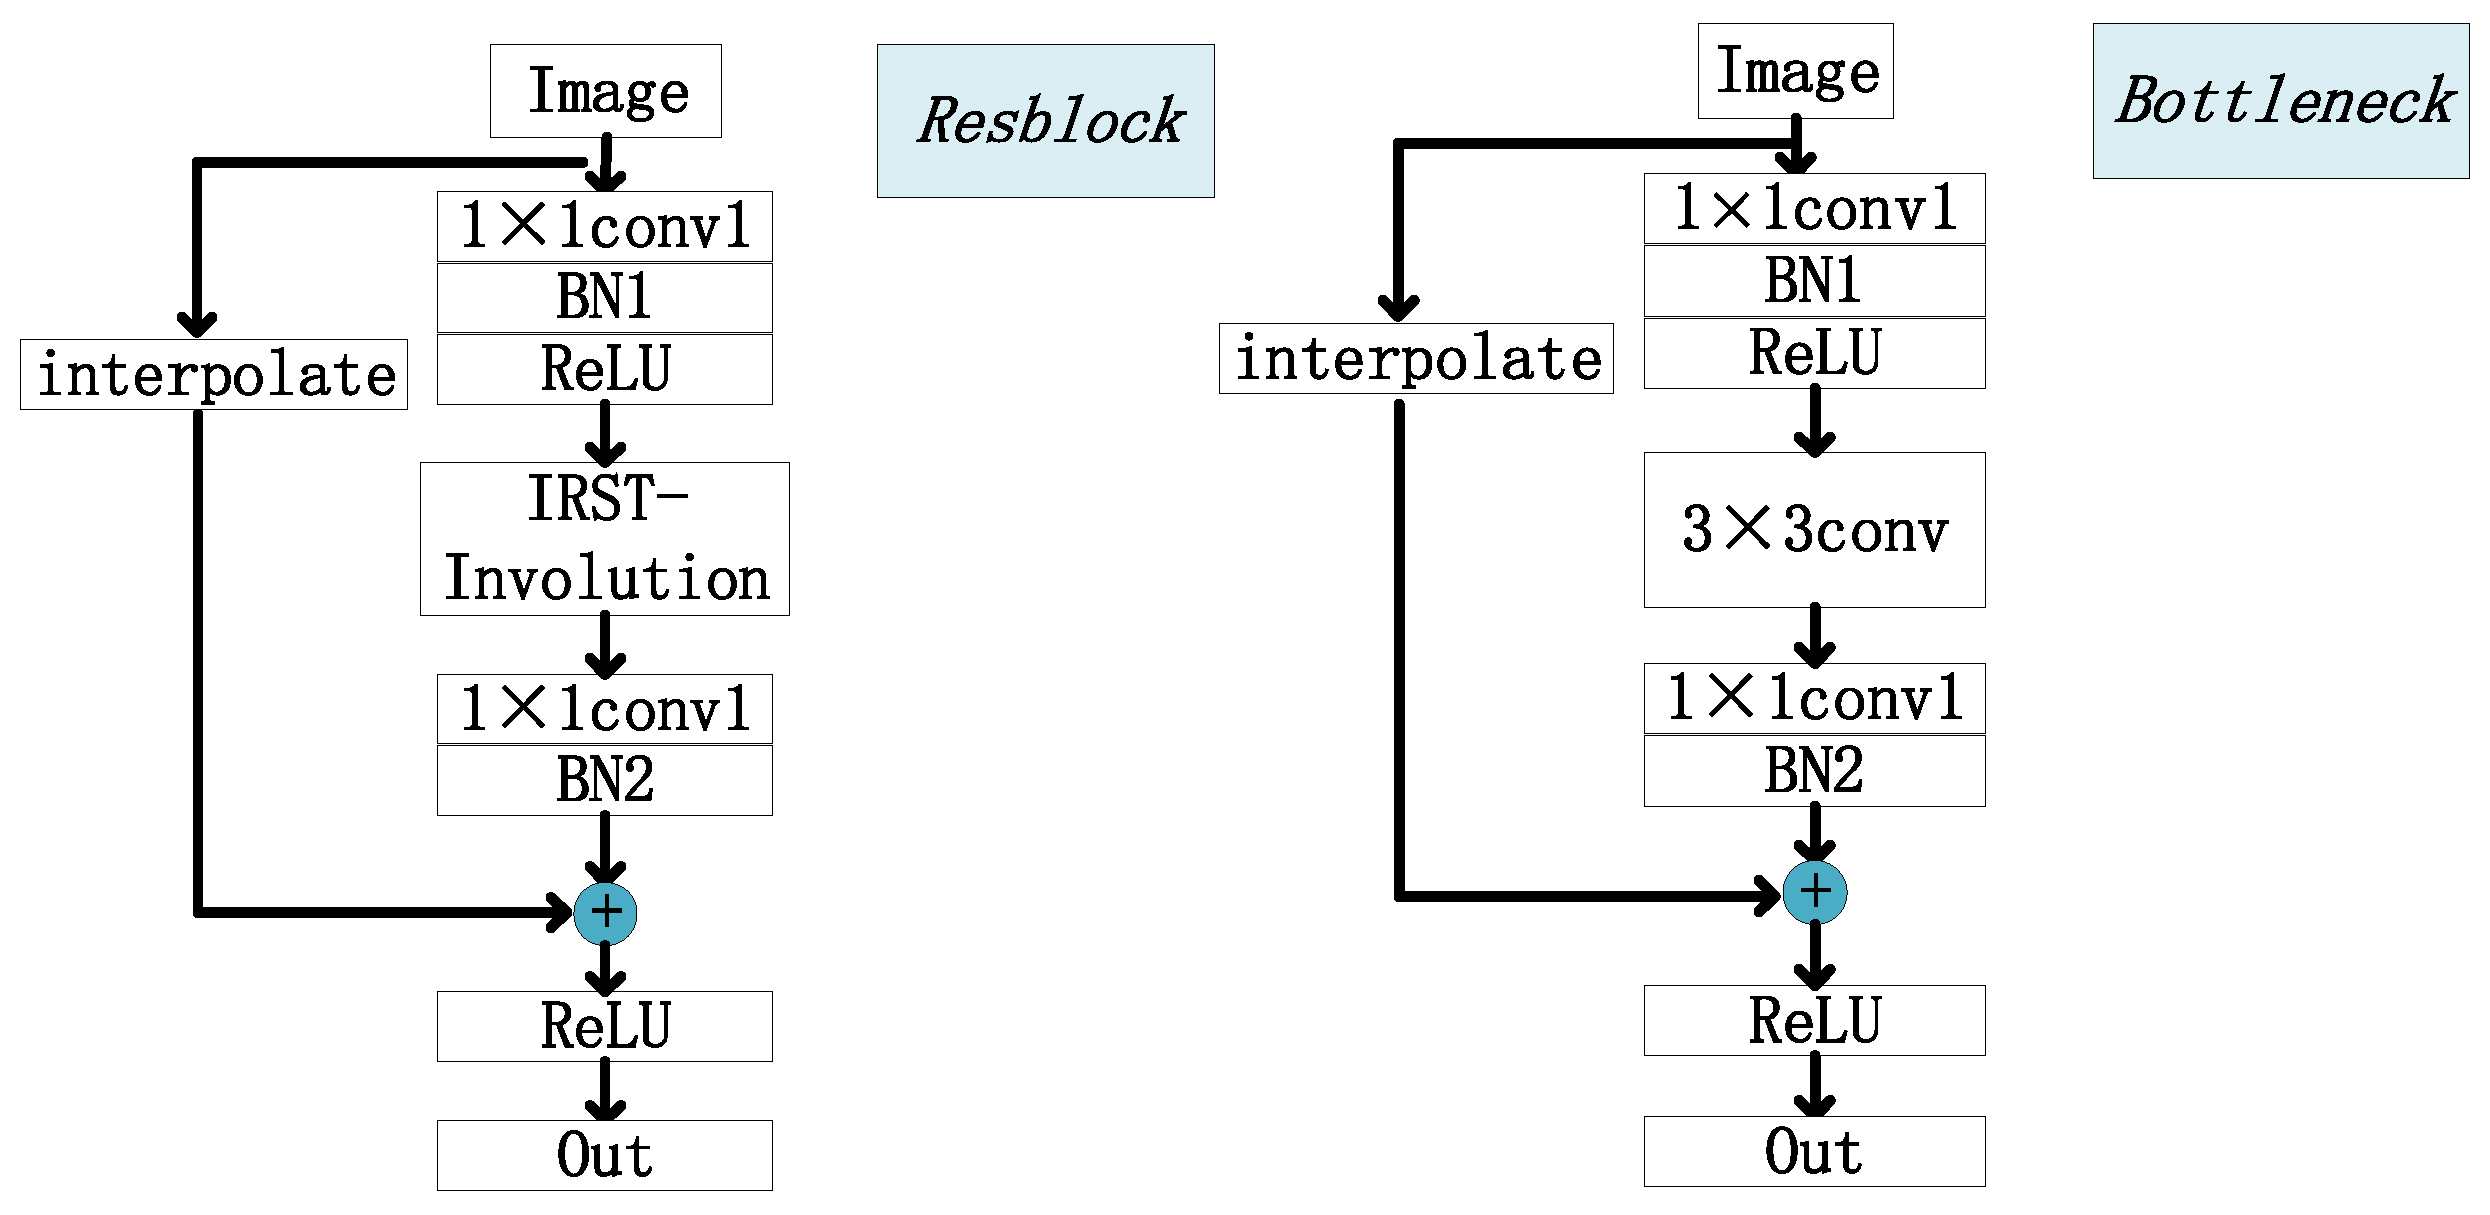
As illustrated in Figure 4, the ResBlock module employs IRST-Involution instead of the traditional 3 × 3 convolution kernel. It is important to note that the output of IRST-Involution is equivalent to that of the traditional 3 × 3 convolution kernel.
The ResBlock in our approach is specifically designed to extract spatial features through the utilization of IRST-Involution. In contrast, the basic module in ResNet, known as the Bottleneck, prioritizes non-deformation and channel specificity. In our DFEM module, we adopt a two-cascaded approach to extract features from infrared small targets. This approach aims to simultaneously emphasize both spatial and channel features.

2.2.3. Establishment of Backbone Network

The Bottleneck is the fundamental residual module in ResNet 18. When the IRST-Involution in Figure 4 is replaced with a traditional convolution kernel, it becomes Bottleneck. The ResBlock with IRST-Involution can learn the characteristics of superpixels in the spatial dimension, while the main function of the Bottleneck with a traditional convolution kernel is to enhance the channel space. Figure 5 shows the overall architecture of the backbone.
In the overall design process of the backbone network, the first DFEM module adopts a Bottleneck with an output channel dimension of 64 and ResBlock with a step size of 1. The goal is to preserve the texture details as much as possible during the initial shallow feature-extraction stage. Following this, three DFEMs are used in succession to complete the feature-extraction task. The Bottleneck of all three modules has a convolution kernel step size of 1, and the output channel dimension is twice the input. The step size of the ResBlock is consistently set to 2, therefore halving the size of the output feature map layer by layer after DFEM2. Table 1 provides the output results of each layer.

2.3. Feature Fusion

Infrared small-target detection involves feature fusion in three aspects: First, how to fuse feature maps of different sizes; second, how to fuse feature maps with different channel dimensions; and thirdly, what kind of fusion mode is more suitable for small targets with large differences in size.
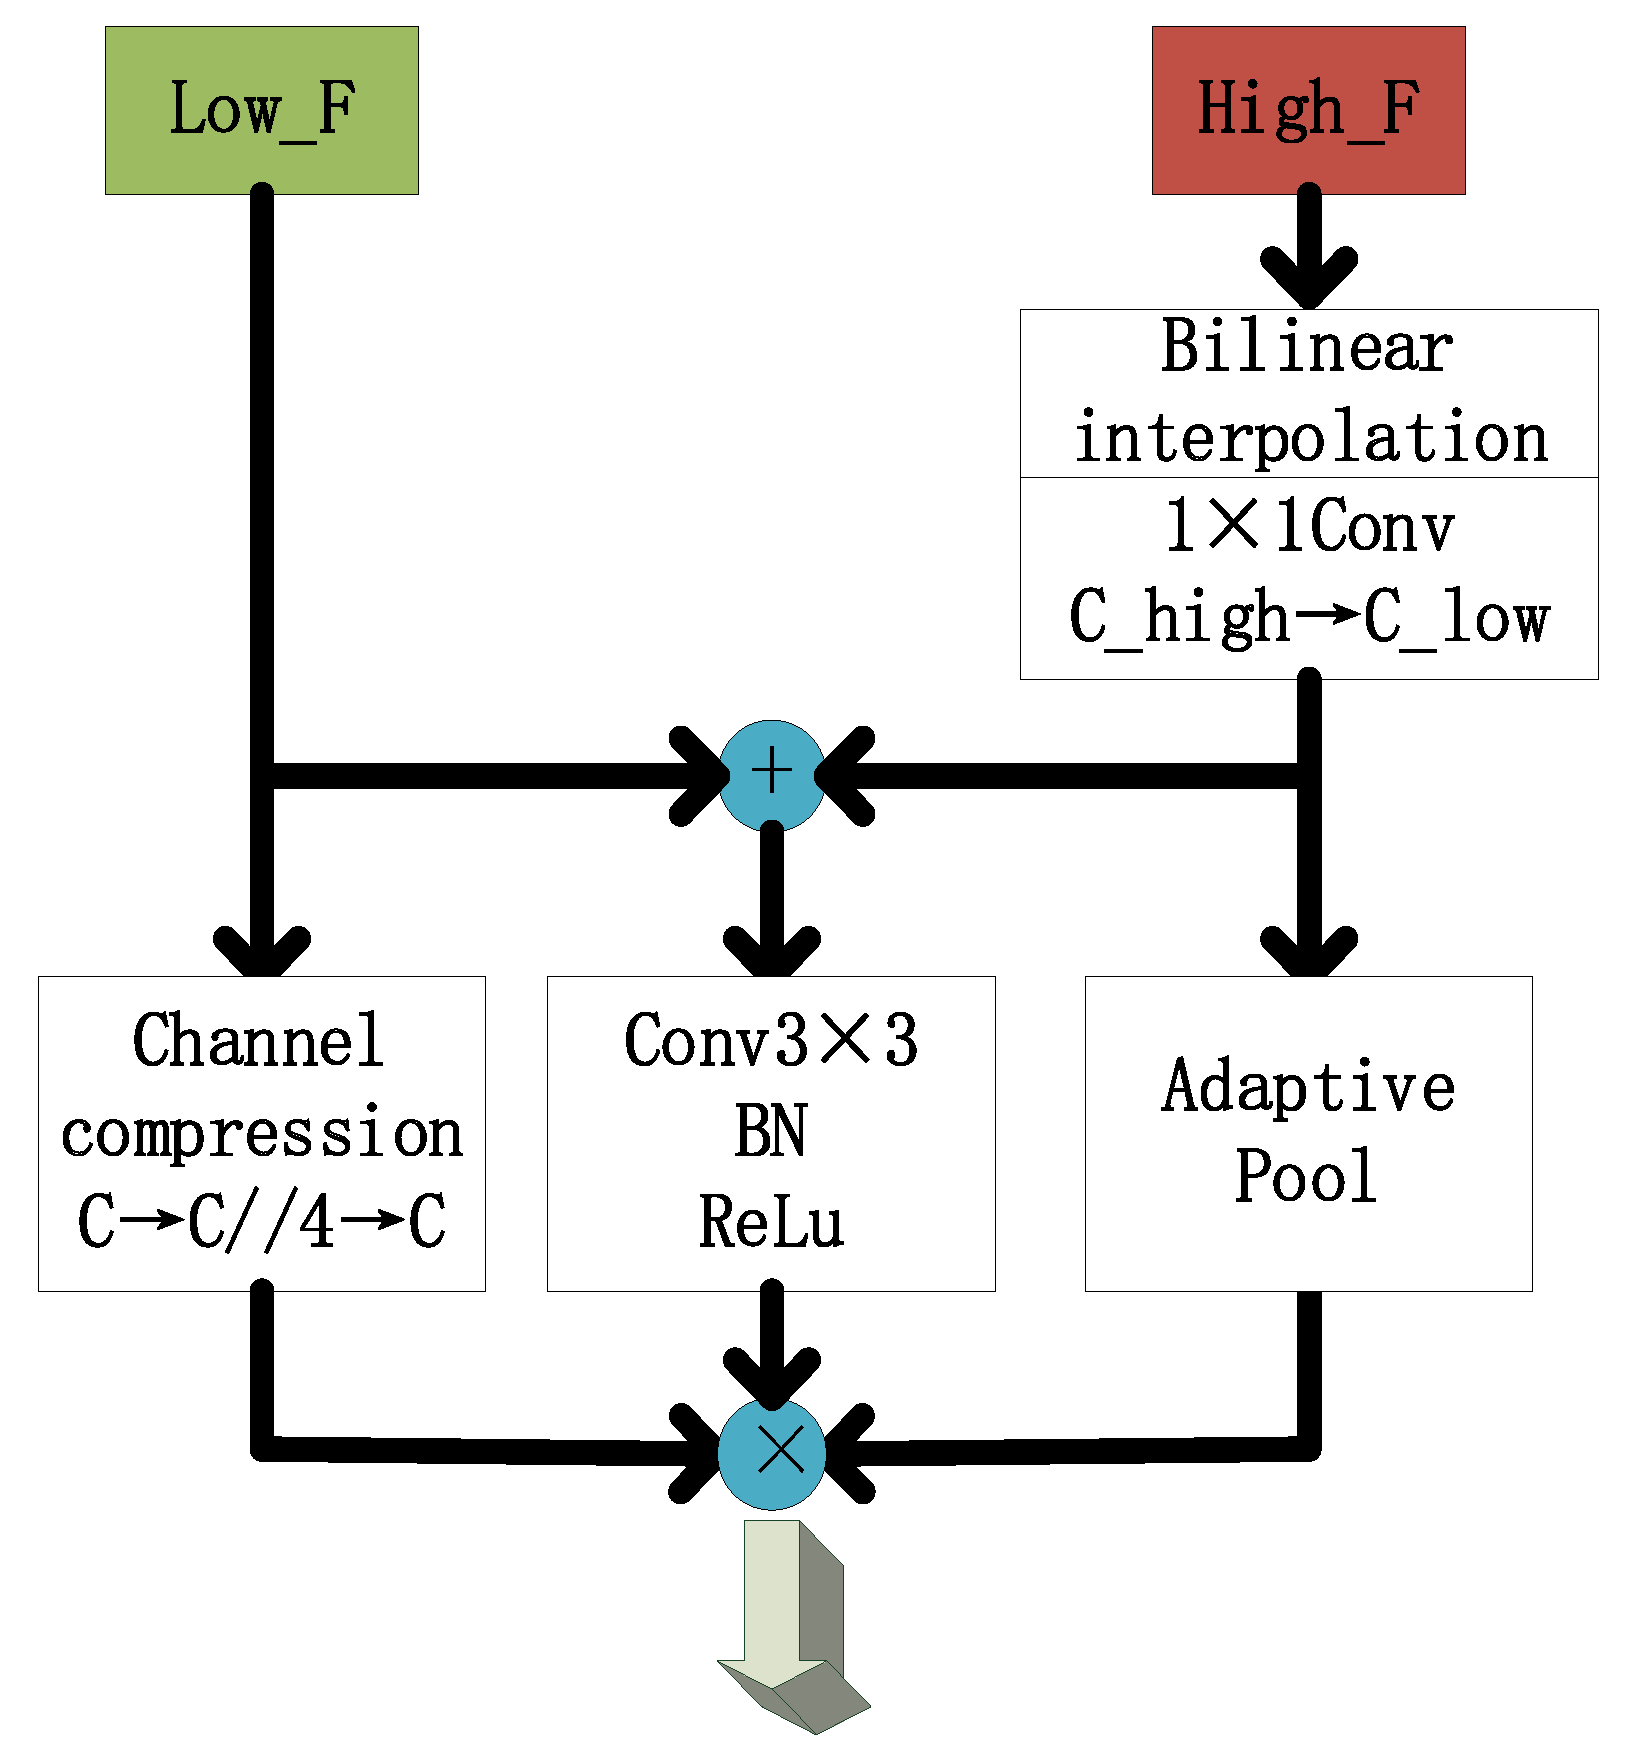
In this paper, we have selected bilinear interpolation as the method for up-sampling high-dimensional features based on several experimental results. The experimental results comparing bilinear interpolation and deconvolution up-sampling indicate that bilinear interpolation outperforms deconvolution in terms of both parameter count and resulting image quality [45]. The poor performance of deconvolution could be attributed to the limited availability of training samples. The backbone network used in this study expended a lot of energy during the training process to identify spatial features. Although channel characteristics are also important, having too many channels in the output can lead to information redundancy. To address this, we have employed a 1 × 1 convolution kernel to reduce the dimensionality of high-dimensional features to match the underlying dimension that needs to be fused. The transformed high-dimensional features are then globally pooled to obtain a two-dimensional (1 × 1) adaptive mean. We then multiply and add the feature maps with the same size and channel dimension. The schematic diagram of the fusion process is shown in Figure 6, and the calculation formula is as follows:
o u t h i g h = c o n v 1 h i g h 2 l o w I n t e r p H i g h F
o u t h i g h = A d a p t i v e P o o l o u t h i g h
o u t l o w = R E L U B N c o n v 1 l o w 2 l o w ÷ 4 L o w F
o u t l o w = R E L U B N c o n v 1 l o w ÷ 4 2 l o w o u t l o w
o u t m i d = R E L U B N c o n 3 l o w 2 l o w L o w F + o u t h i g h
o u t f u s e = o u t h i g h o u t l o w o u t m i d
This paper aims to fuse the outputs C i , i = 1 , 2 , 3 , 4 . Considering that the shallow feature map contains more texture information, we have optimized and upgraded the Feature Pyramid Network (FPN).
We fuse the feature maps from C4 to C1, C3 to C1, and C2 to C1 into feature pyramids, respectively. Finally, we fuse the feature maps from the three layers according to different weight proportions. This is to maximize the preservation of the shallow feature map, which contains the texture information of small targets. Figure 7 illustrates this fusion method. The fusion method, combined with the proposed backbone in this paper, has achieved a significant performance improvement, as demonstrated in the next section.
We employ a self-learning parameter approach to fuse features from different levels, allowing the network to determine each layer’s contribution proportion through training. Traditional FPN follows a downward sequential fusion approach, treating each feature layer as equally important. However, we contend that deep and shallow features should not hold equal importance for small infrared target detection, and their contribution proportions are difficult to ascertain empirically. Therefore, we fuse feature maps from varying depths downward and employ self-learning parameters to determine each layer’s impact on the output.

3. Experimental Results

3.1. Dataset Description

We have validated the effectiveness of our proposed algorithm on three public datasets, namely the SIRST dataset [40], the SIRST_AUG dataset [41], and the MDvsFA dataset [34]. The SIRST dataset [40] comprises single-frame infrared images and includes only a few representative images from each sequence due to the limited availability of infrared sequences. This dataset consists of 427 infrared images and 480 targets, including short-wave, medium-wavelength, and 950 nm infrared images. Approximately 90% of the images contain only one target, while the remaining 10% have multiple targets. Moreover, the target area of around 55% of the images is less than 0.02%. To overcome the limited size of the SIRST dataset, researchers utilized various data augmentation techniques, such as rotation, cropping, and contrast enhancement, resulting in a training set of 8525 images and a test set of 545 images. Considering the size of the dataset, we employed the enhanced dataset, SIRST_AUG dataset [41], for our ablation experiments and conducted comparative experiments with other advanced methods on all three datasets. Before entering the network, the images are uniformly converted into tensors needed for training.

3.2. Experimental Configuration

All experiments were conducted using the PyTorch deep-learning framework on a computer with two NVIDIA GeForce RTX 3090 GPUs with 48-GB RAM and Ubuntu 20.04 operating system. Stochastic gradient descent (SGD) was used as the optimizer with a momentum of 0.9 and weight decay of 0.0001. The initial learning rate was set to 0.05, and each iteration decreased according to the Poly strategy. The batch size was set to 8, and the loss function was a combination of SoftIouloss and BCEloss. Finally, the epoch of the SIRST_AUG dataset was set to 6. The SIRST training set only has over 400 images, set to 300 epochs according to the original paper.
The infrared small-target detection network finally outputs the target pixel as white and the background pixel as black, which can be regarded as the binary classification of the input image. SoftIouloss and BCEloss are commonly used loss functions in the field of binary classification. Finally, the loss function used by the authors in [38] was used for reference. SoftIouloss makes predictions in a holistic manner, and BCEloss focuses on the binary classification of each pixel. SoftIouloss plays a major role in the early stage of infrared small-target prediction, and more attention is paid to the BCEloss of each pixel when the learning rate decreases in the middle and late stages. The formula is as follows:
SoftIouLoss = 1 C C p i x e l s y t r u e y p r e d p i x e l s y t r u e + y p r e d y t r u e y p r e d
BCELoss = w y t r u e ln y p r e d + 1 y t r u e ln 1 y p r e d
Loss = SoftIouLoss + log 10 1 + 100 B C E L o s s
In terms of evaluating network performance, this article employs classical semantic segmentation evaluation metrics such as F-measure and mean Intersection over Union (mIoU). Additionally, the authenticity of the network can be better assessed by the AUC curve, which approaches a value of 1. The method proposed in this article aims to segment the target point and background in infrared images, excluding the detection frame. The evaluation metrics used are more comprehensive and objective, and do not include false alarm rate and detection rate, which are typically used in network evaluation. The formula for calculating the AUC curve, or the area under the ROC curve, is as follows:
Precision = TP / TP + FP
Recall = TP / TP + FN
F measure = 2 Precision Recall / Precision + Recall
mIoU = Area   of   Overlap / Area   of   Union
where TP means the positive class is predicted as positive, FP means the negative class is predicted as positive, and FN means the positive class is predicted as negative.

3.3. Parameters Setting

Ks in ResNet block: The parameter Ks in the ResNet block reflects the size of the receptive field during feature extraction. A larger receptive field means that the central pixel is connected to more surrounding pixels. In our experiments, we chose three different values for Ks (1, 3, and 5) and determined the best patch size through empirical evaluation. As shown in Figure 8a, all evaluation metrics reach their maximum values when Ks is set to 3. This suggests that, for small targets, a receptive field that is too large or too small does not improve detection performance. Therefore, we set Ks to 3 in this paper.
Parameter N: The value of N is an important factor that affects the performance of ResNet, as it determines the degree of dimension-raising transformation of the input feature map. To determine the best value, we conducted four experiments where N was set to {4, 8, 16, 32} respectively, and the results are shown in Figure 8b. Our findings indicate that setting N to 16 results in optimal performance across all indicators. Although increasing N can extract features in more detail, blindly increasing it can lead to slower network reasoning speed and redundant information, ultimately reducing detection performance.
Scales: In GAGEM, the scales refer to the number of local blocks that the original image is divided into. For our experiments, since the size of the input infrared image is 256 × 256, we divided the scales into (16, 10), (25, 16), and (25, 16, 10). The results of these experiments are shown in Figure 8c. From the figure, it is evident that the best performance is achieved when the scales are selected as (16, 10).

3.4. Ablation Experiment

We performed ablation experiments on the SIRST_AUG dataset [45] to assess the efficacy of our proposed module and evaluate its impact on the overall performance of the network.
To demonstrate the effectiveness of GAGEM, we evaluated its impact on the performance of the overall network. The results, presented in Figure 9, show the blue curve representing the direct input of the image in the dataset and the orange curve representing the output of the network after incorporating GAGEM. The results show a clear improvement with the addition of GAGEM. Specifically, after 1.5 K cycles, the network’s mIOU improved by 17.69% compared to the original network, and the F-measure improved by 10.27%.
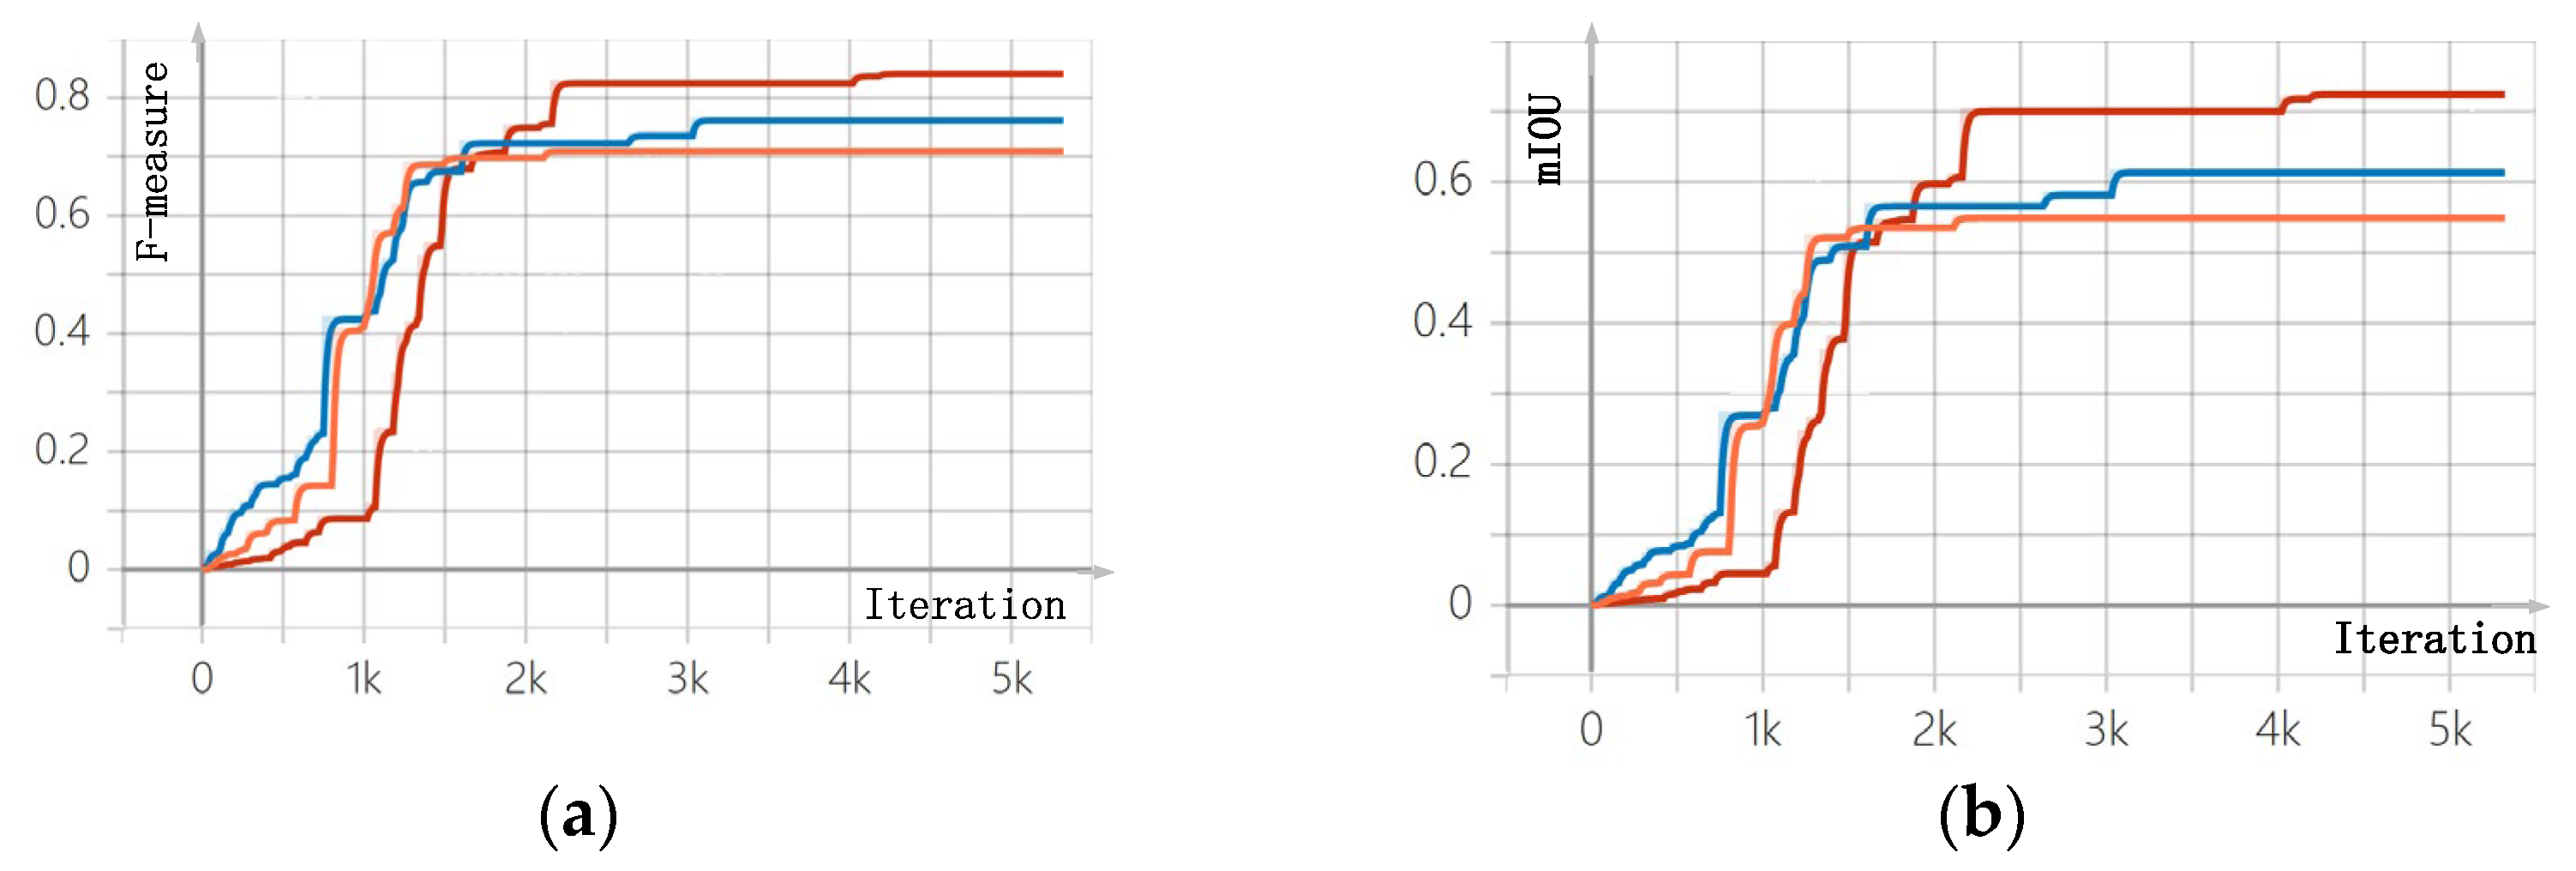
Our proposed backbone network completely discards pooling operations, and the size and channel changes depend on the stride of the convolutional kernel. Figure 10 demonstrates the performance results of CNN, Resnet18, and DFEMs, all with the same depth selected for the backbone network. It can be observed that the backbone network proposed in this paper is most suitable for processing infrared small targets, even when compared to networks with the same convolution layer depth. Additionally, we compared our backbone network to Resblocks with varying depths, and the results are presented in Table 2. The network’s performance does not necessarily improve with an increase in the number of layers for feature extraction. This finding suggests that the texture information of the infrared small target is effectively preserved in the shallow feature map.
The ablation experiment results show that the proposed GAGEM and DFEM modules have a positive effect on improving the performance of infrared small-target detection.

3.5. Comparison with the State-of-the-Arts

In the previous section, we demonstrated the effectiveness of our proposed model through ablation experiments. In this section, we will compare our proposed network model with the most advanced methods, including traditional methods such as Top-hat [24] and RLCM [25], as well as deep-learning methods such as MDvsFANet [26], AGPCNet [18], and DNANet [22]. To ensure fair experimental results, all methods are executed under the same experimental configuration, and multiple experiments are conducted to avoid accidental results.
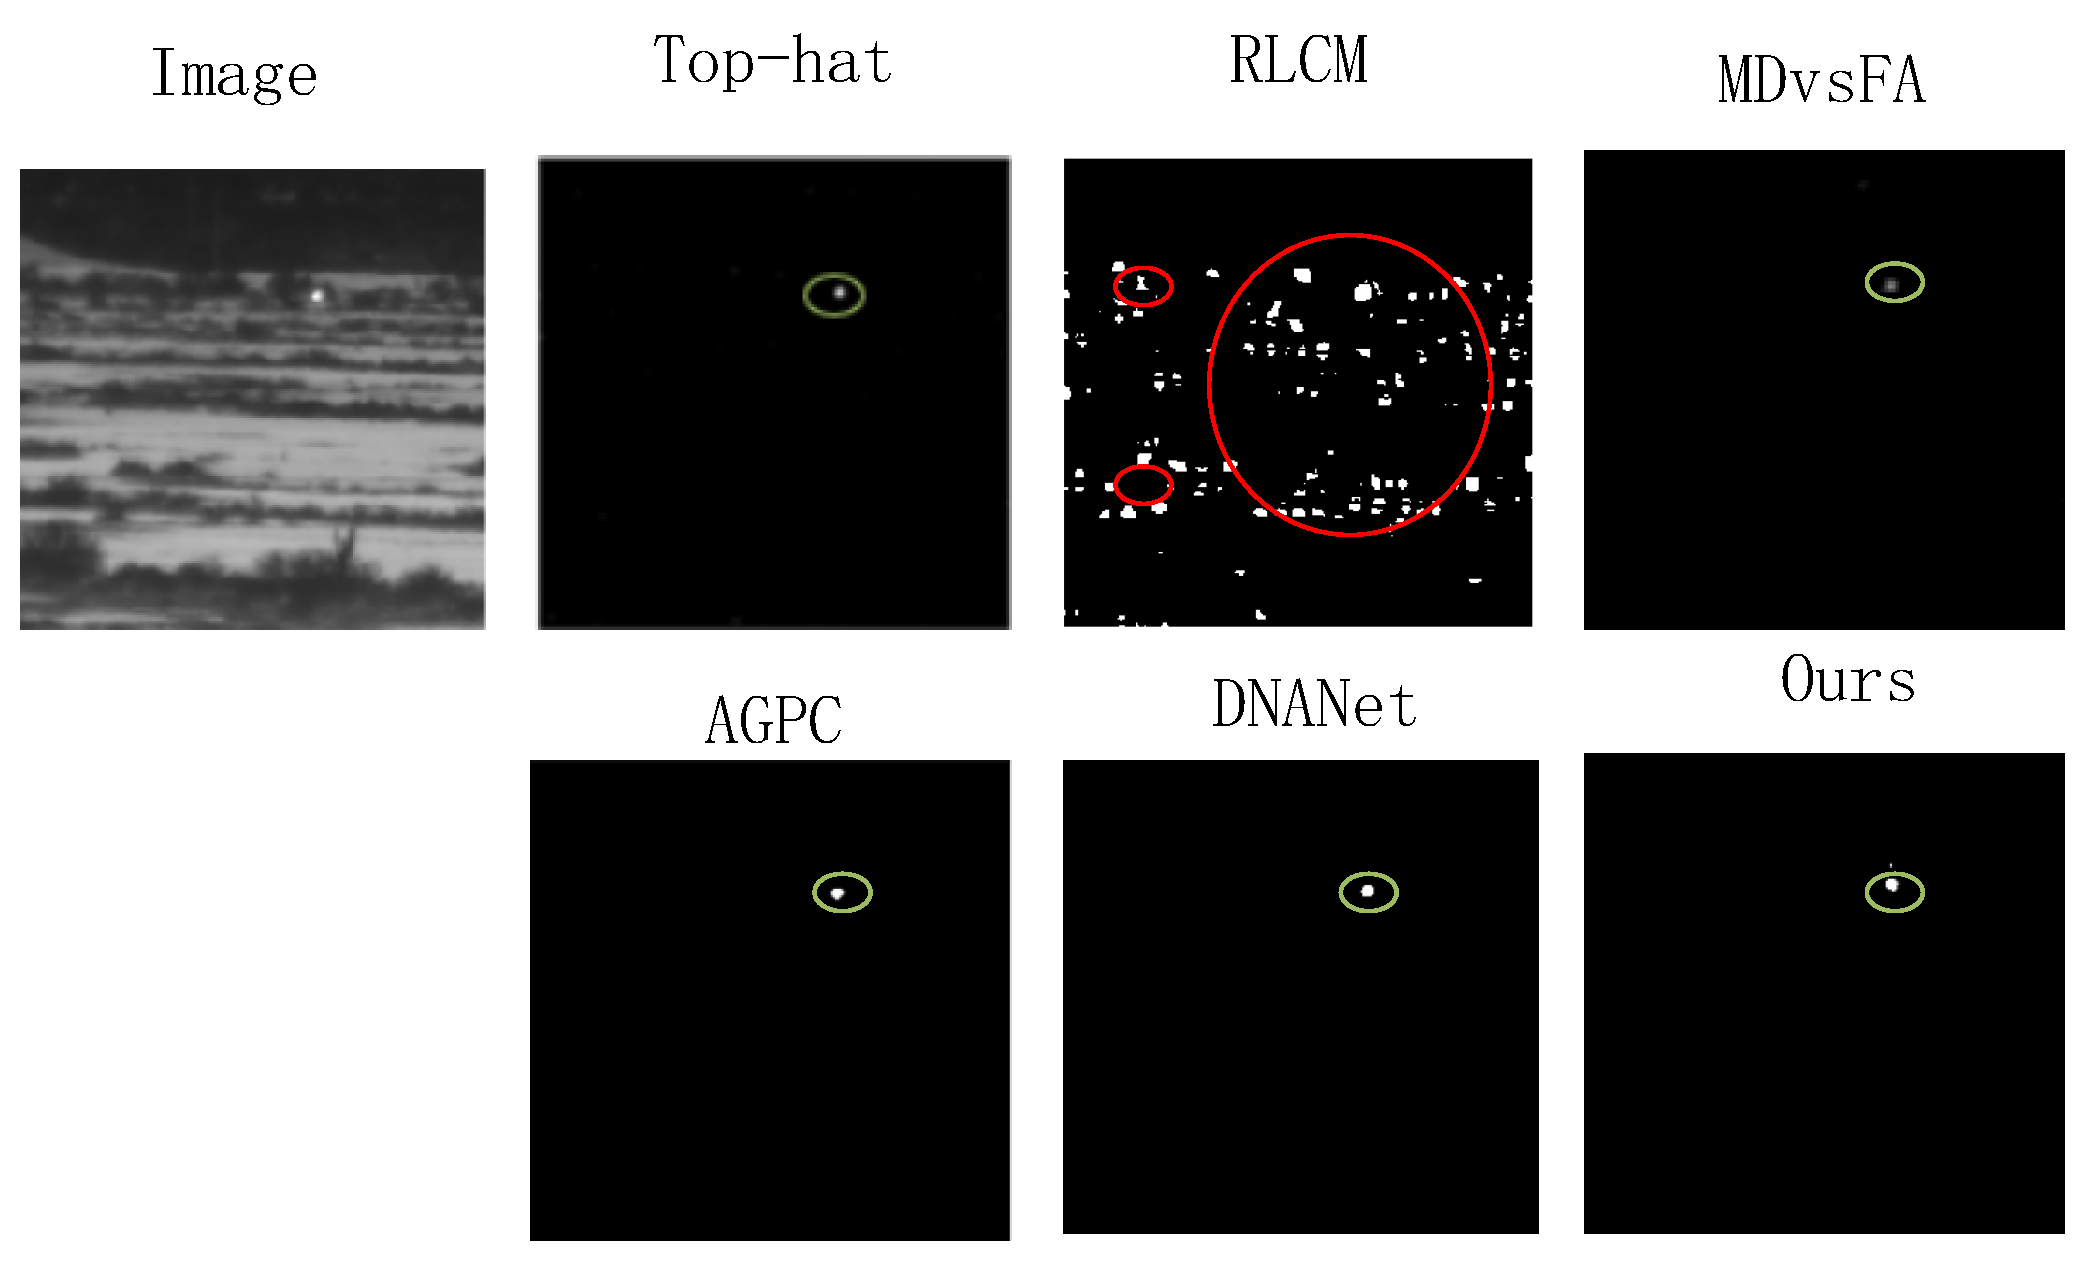
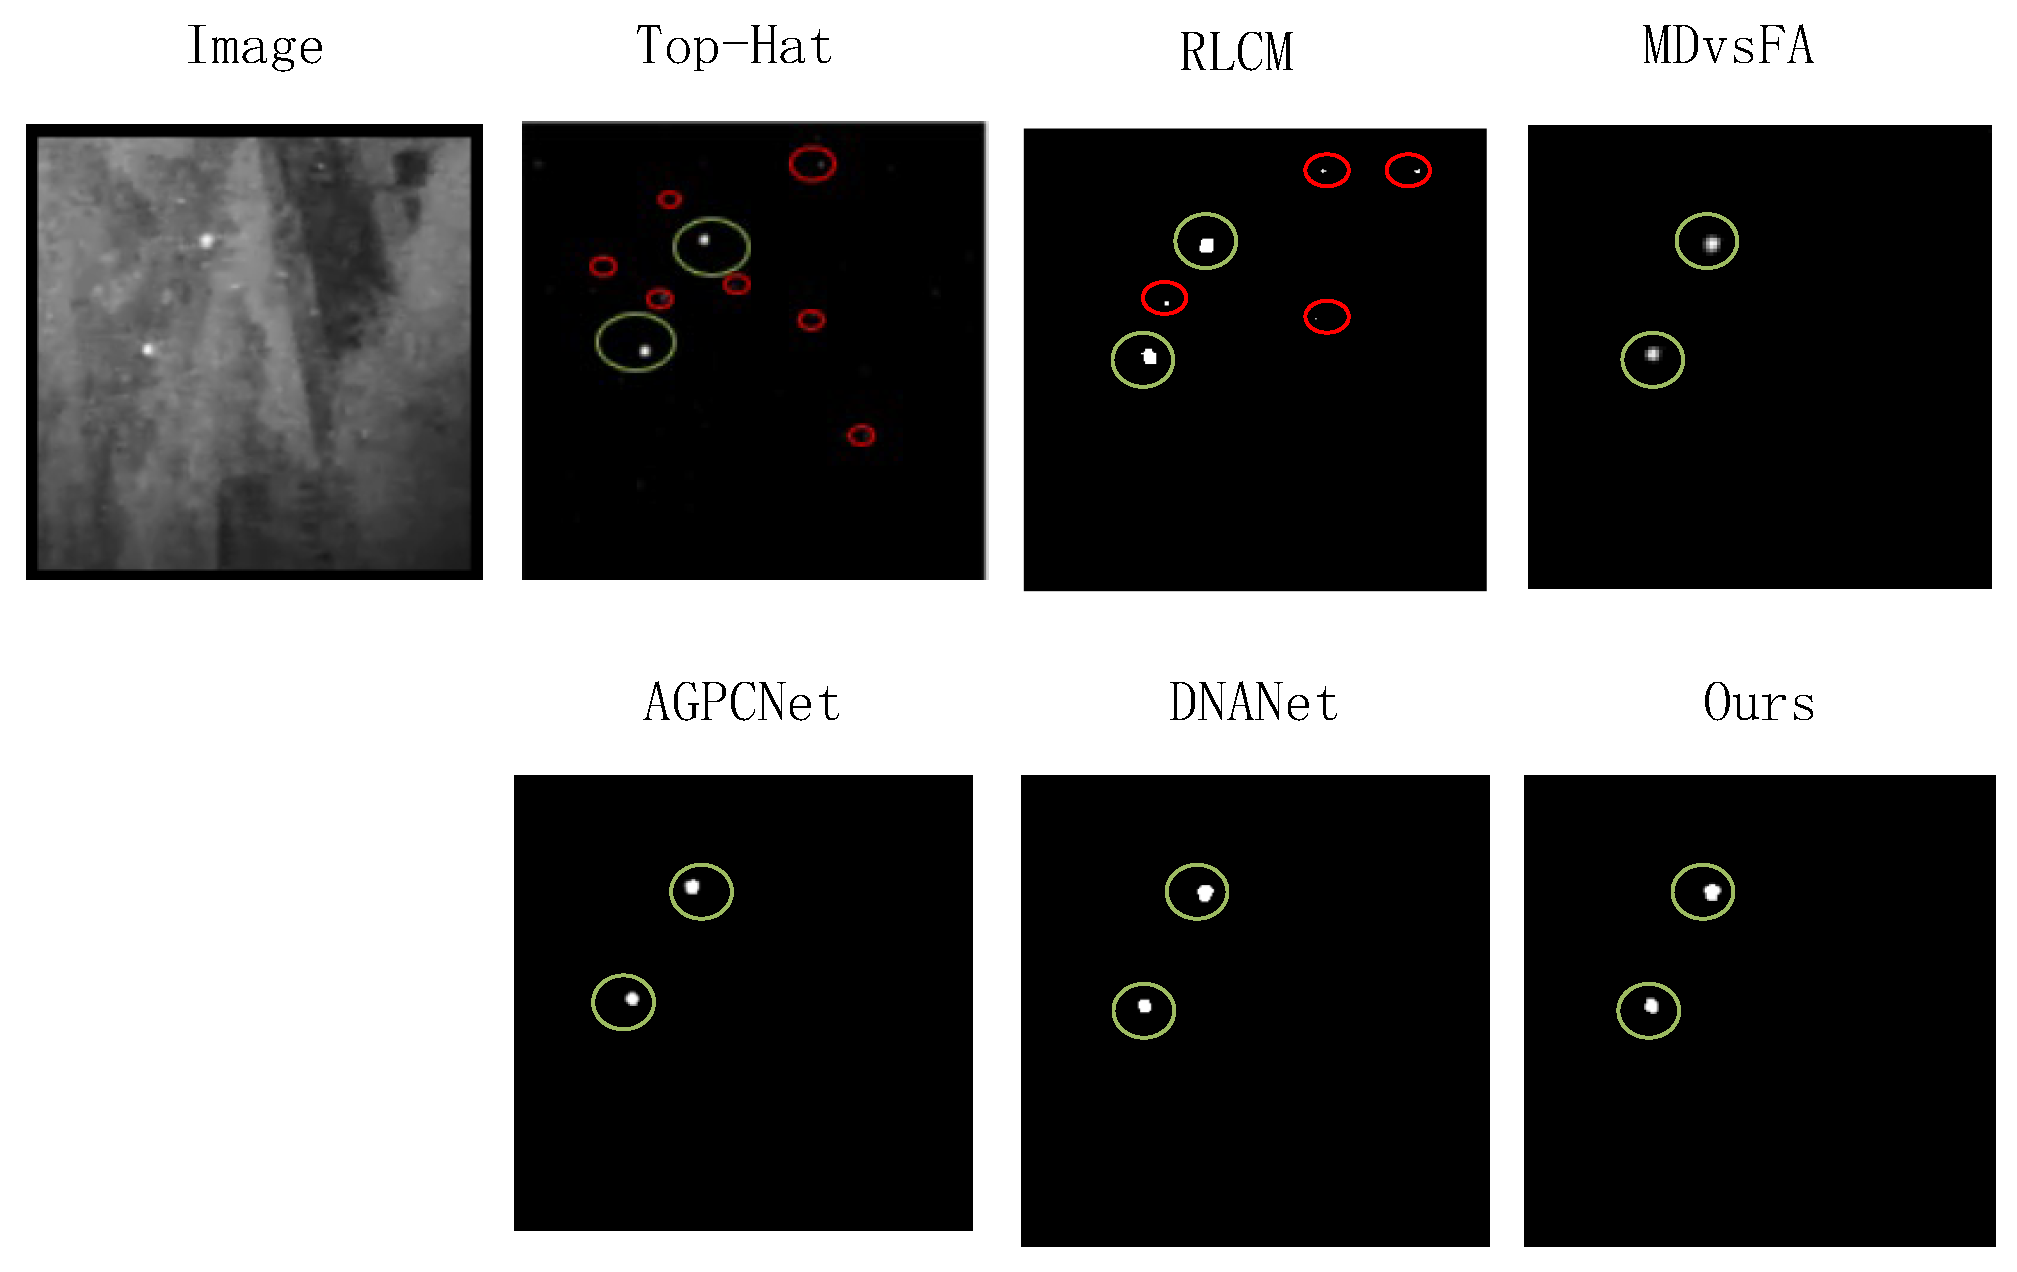
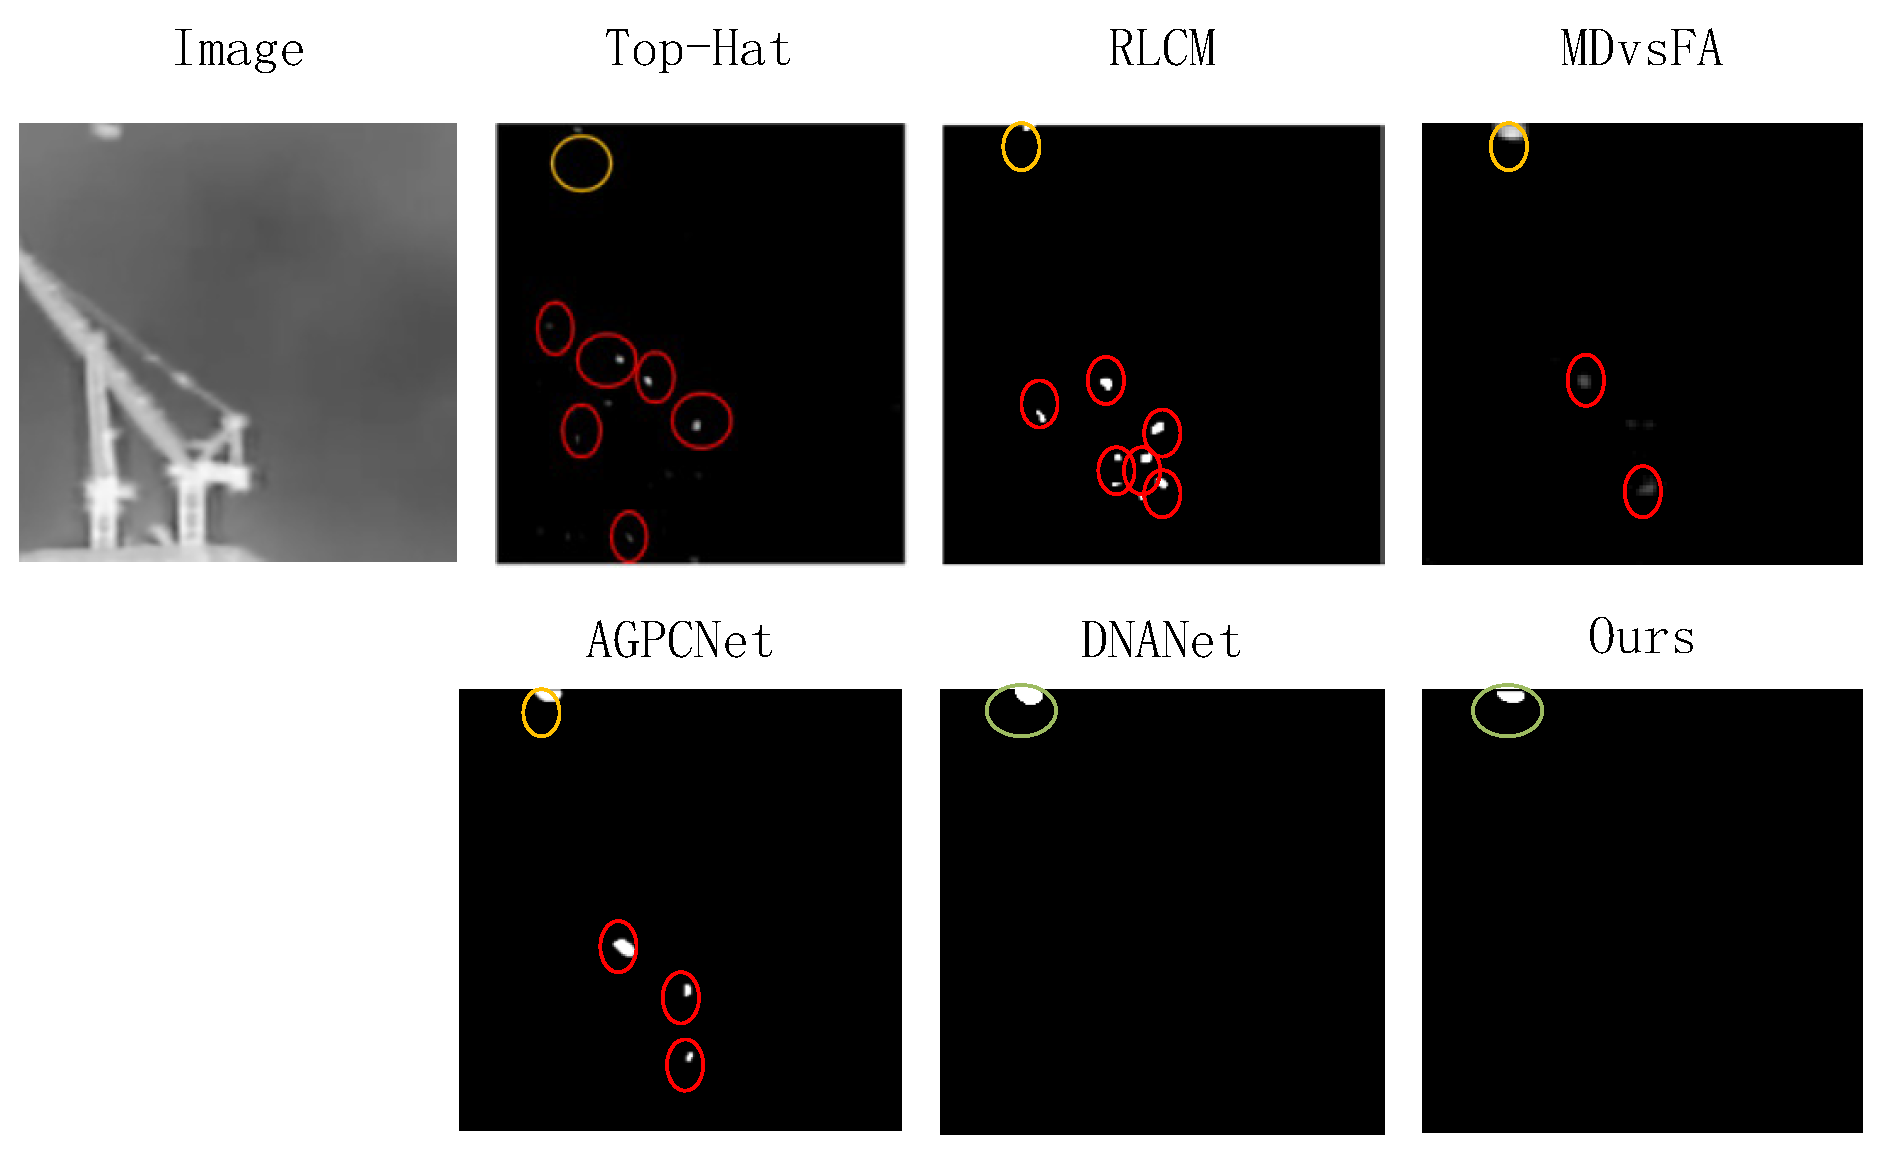
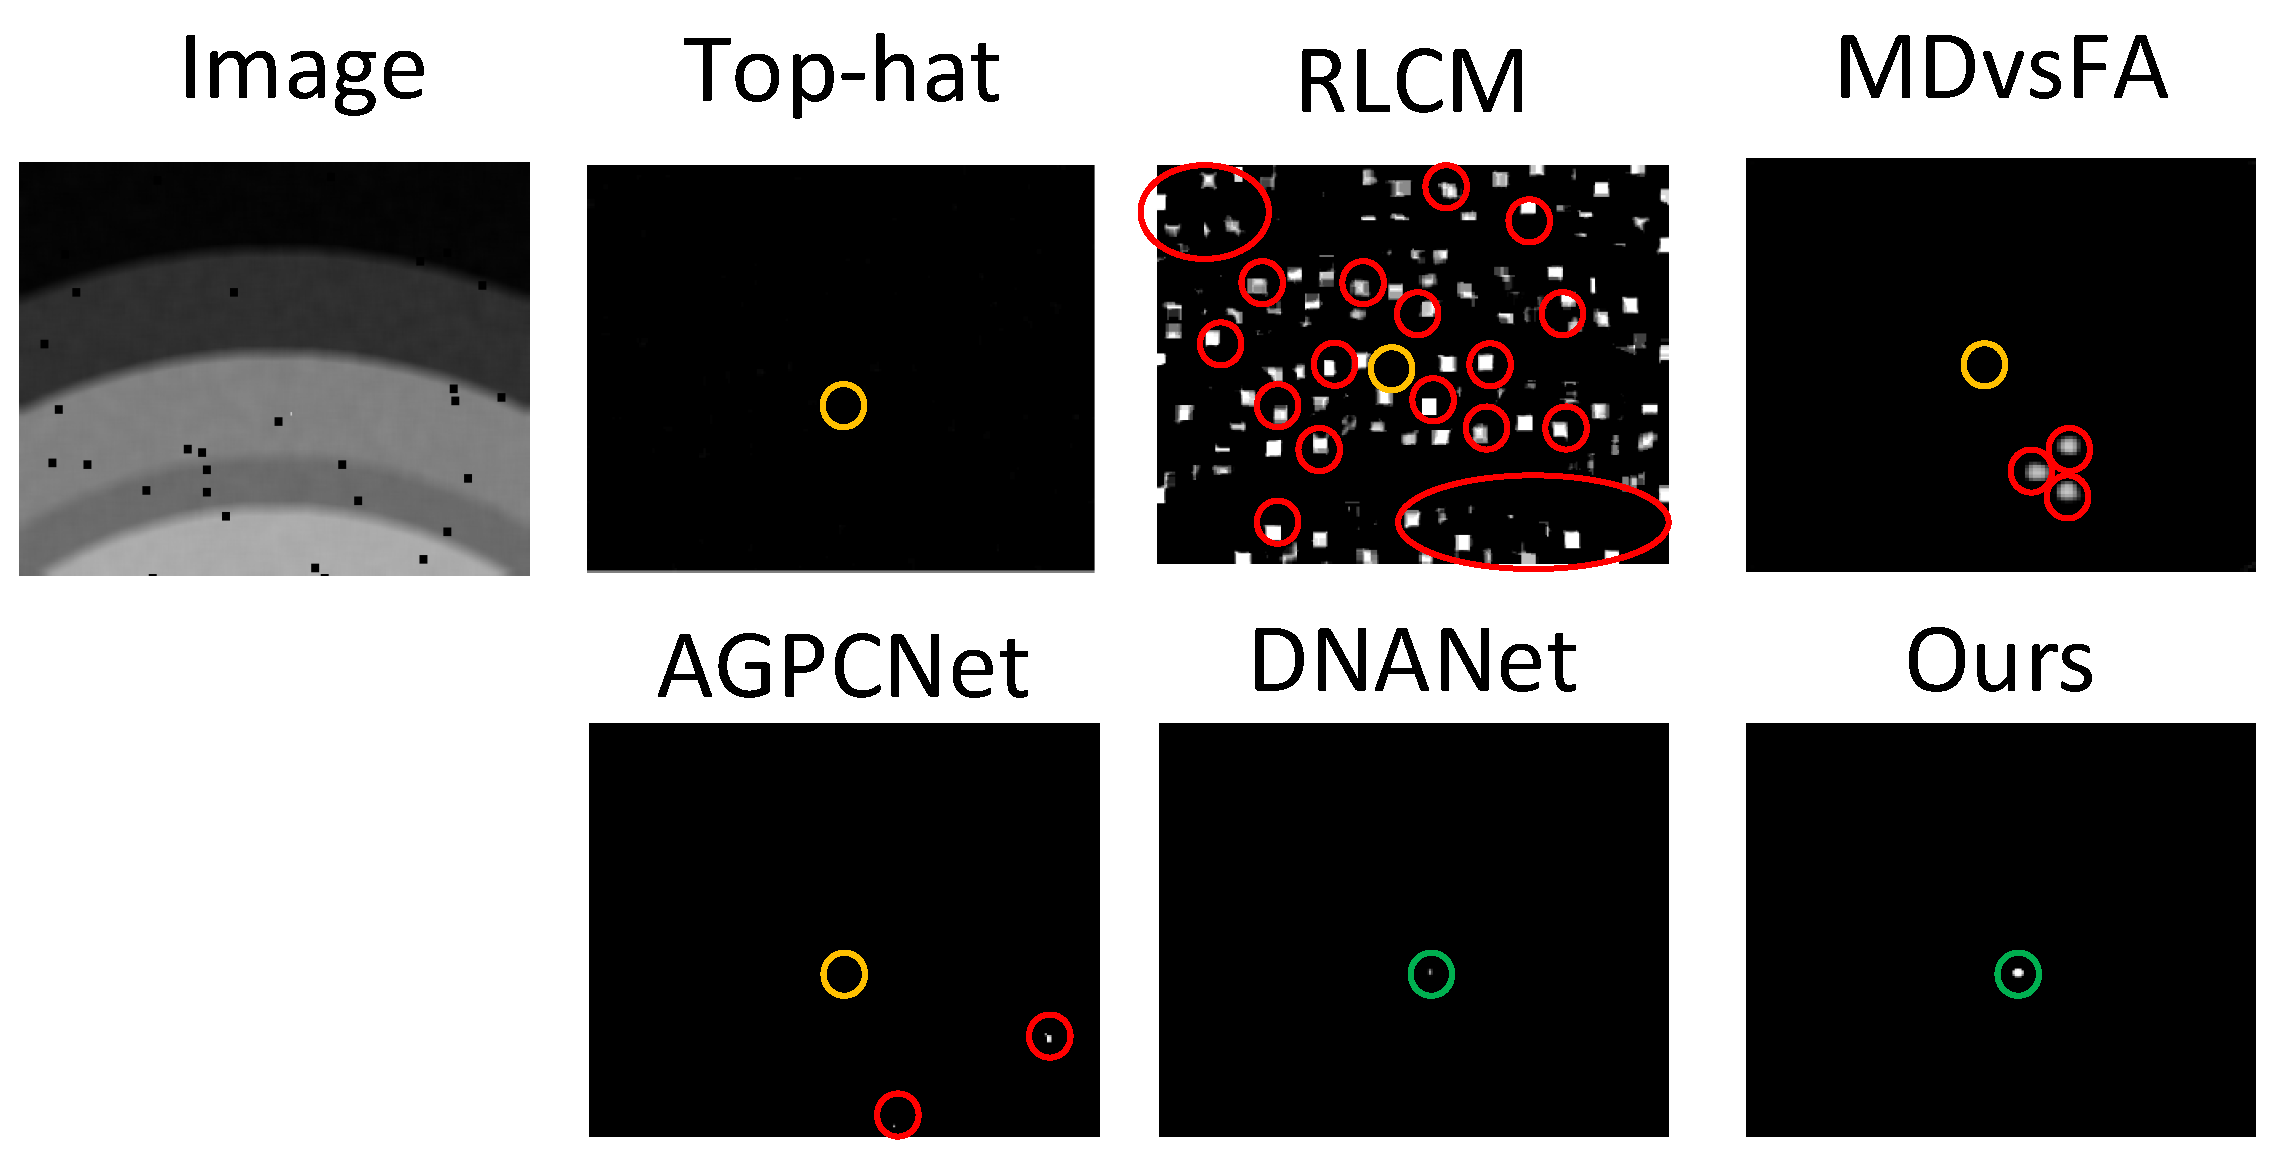
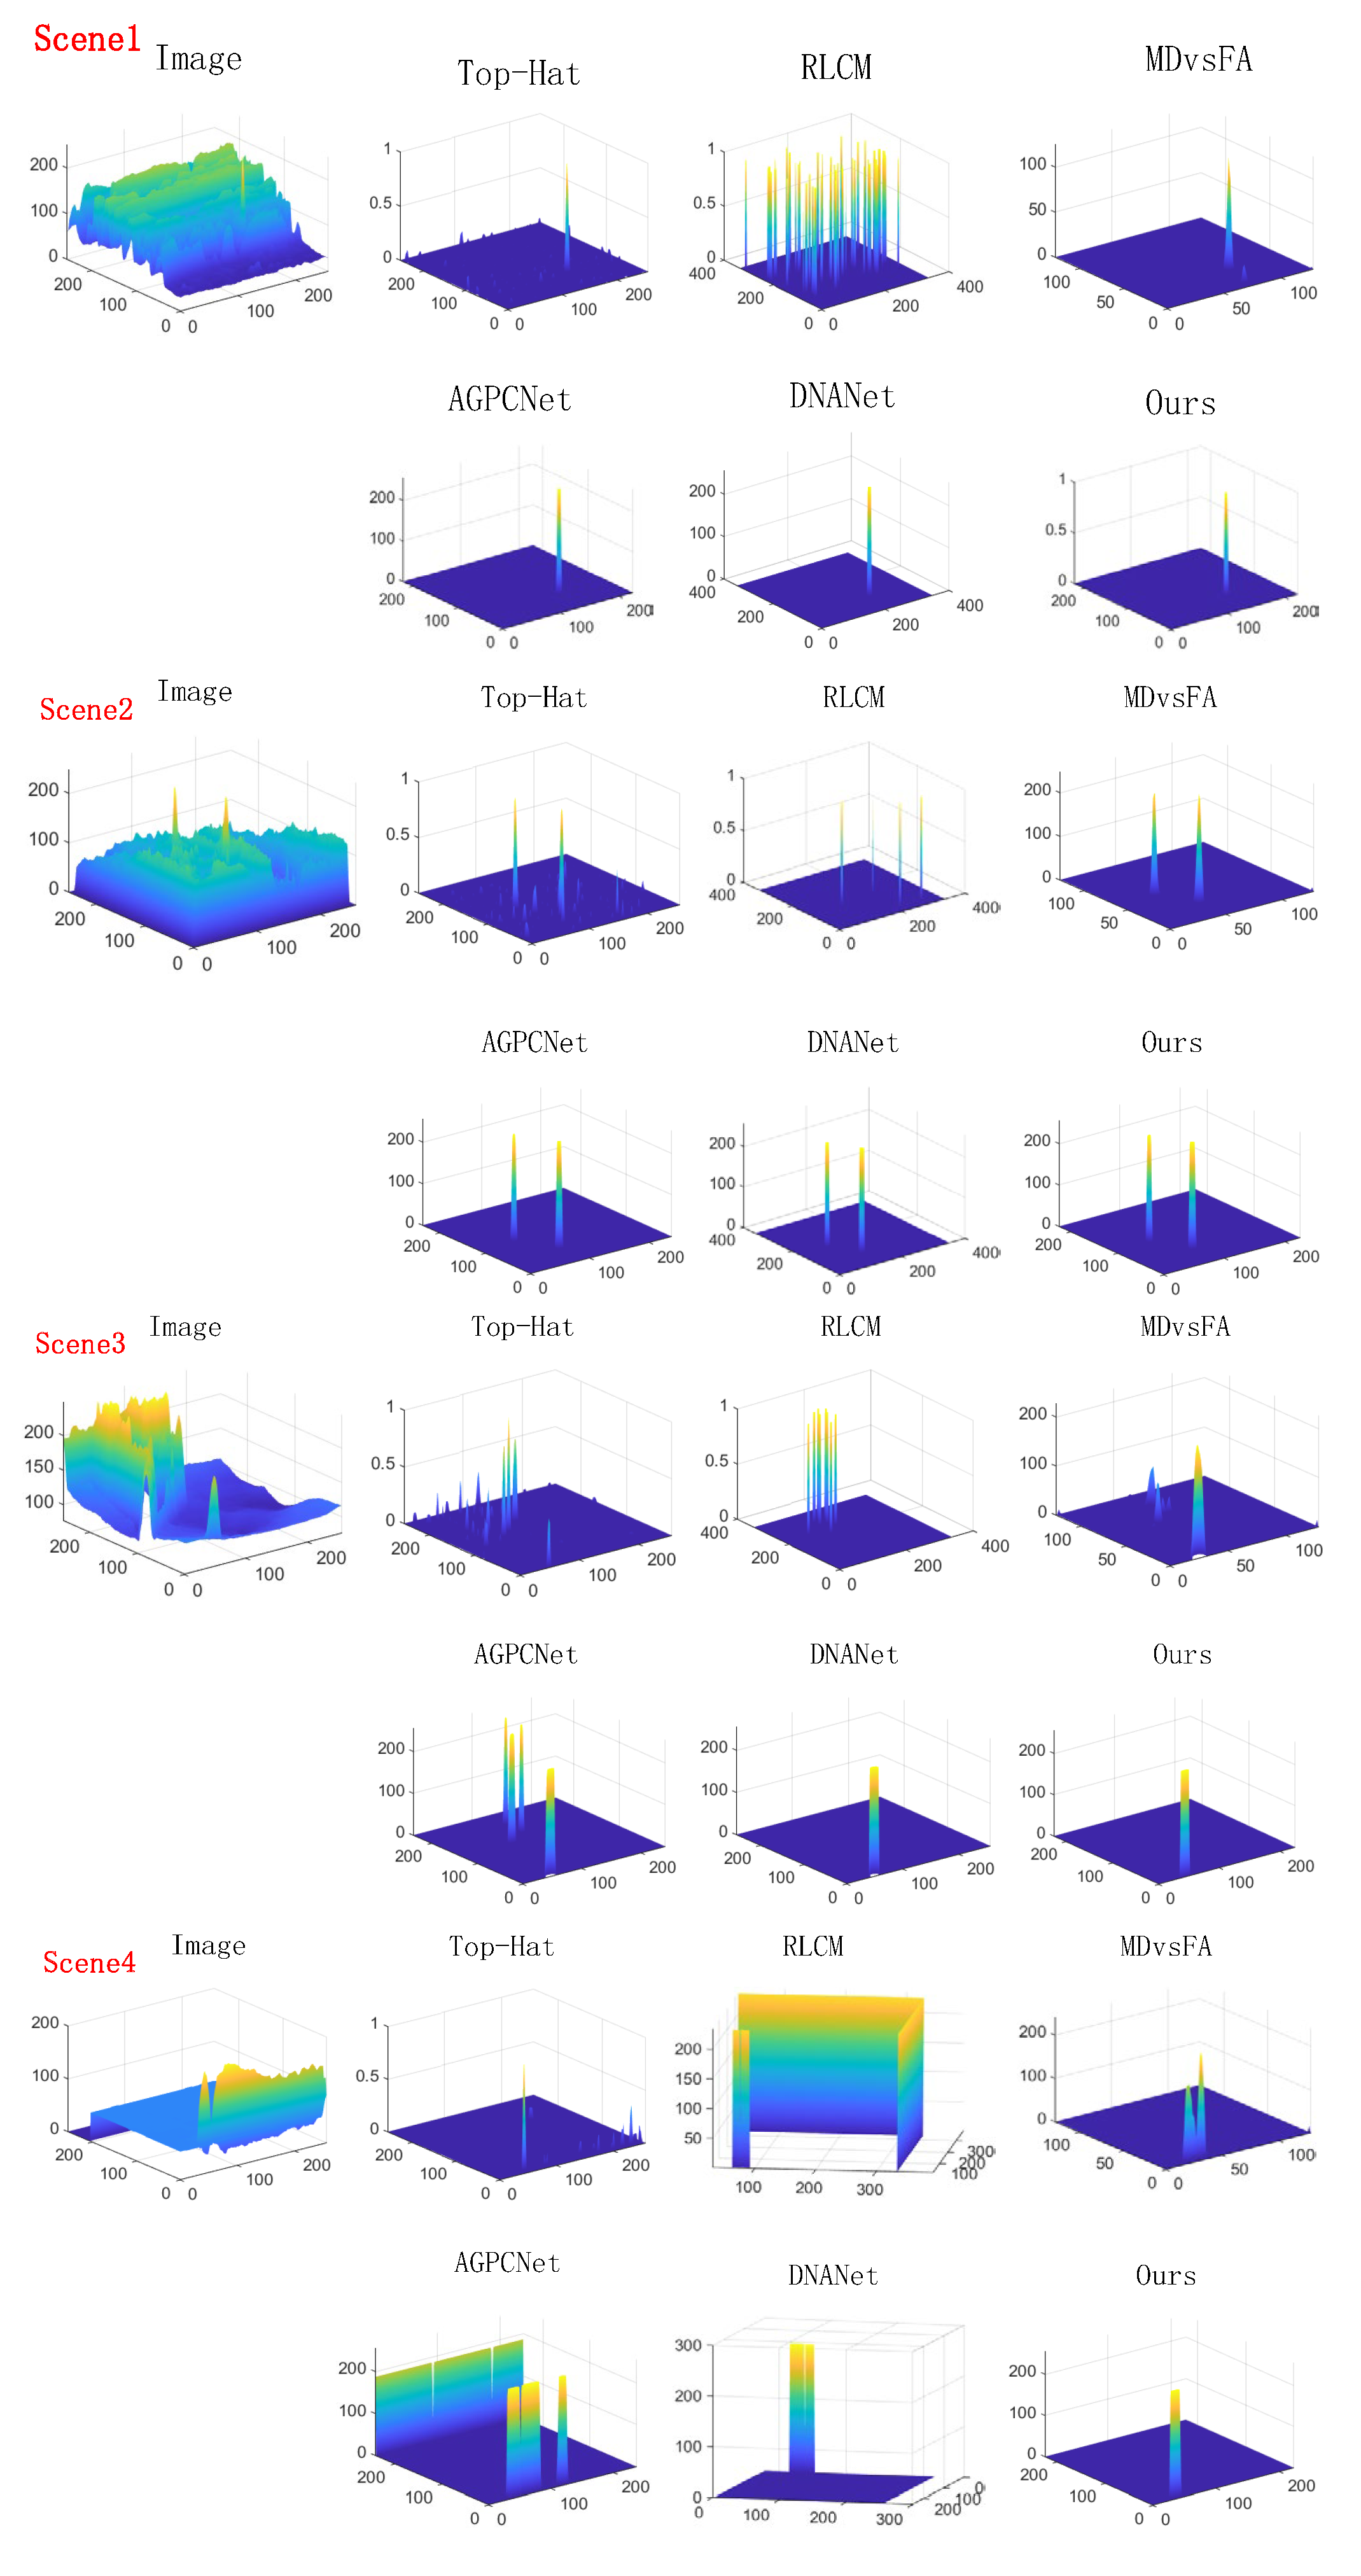
(1) Qualitative comparison. Figure 11, Figure 12, Figure 13 and Figure 14, taken from the SIRST_AUG dataset, present the detection results of six methods applied to four classical infrared small-target images. In Scene 1, the target detection was performed in a complex environment, whereas Scene 2 depicts a multi-target scenario. Scene 3 shows a high brightness interference scenario, and in Scene 4, an air defense scene is depicted. This last scenario is a common situation in the detection of enemy aircraft. In Scene 5 (Figure 15), taken from the MDvsFA dataset, we see an infrared detection scene with significant salt-and-pepper noise. In Scene 6 (Figure 16), from the SIRST dataset, the target is set against a highly exposed sky background. In all scenes, successful detection is indicated by a green circle, false detection by a red circle, and missed detection by a yellow circle.
From Figure 11 and Figure 12, it is evident that both the Top-hat and RLCM methods struggle to handle even simple scenes. When confronted with infrared images that have more clutter and complex backgrounds, a considerable number of missed and false detections are likely to occur. Moreover, traditional feature-extraction methods are not sufficiently generalized to fulfill the demands of multi-scene detection. Deep-learning methods exhibit accurate detection of the targets depicted in Figure 11 and Figure 12. These results demonstrate the robust feature-extraction capabilities acquired through training data, enabling effective detection of small targets with high brightness levels on the ground.
In data-driven approaches, as shown in Figure 13, MDvsFANet and AGPCNet may identify bright spots in surrounding buildings as small targets when there is high brightness interference around the target. Although these misdetected targets may exhibit some characteristics of small targets, it is important to evaluate them based on their surrounding background and the entire infrared image. Relying solely on a small area for detection increases the risk of false positives. This highlights the effectiveness of our proposed method in integrating both global and local features, ensuring more accurate detections. For Scene 4, which presents high detection difficulty, DNANet also struggles to accurately detect small targets. For scene 4, which presents a high level of difficulty in detection, the target size is large, and the flight path behind the target closely overlaps with it. DNANet also struggles to accurately detect small targets. In contrast, the ResBlock module in RDFENet’s backbone network extracts features using superpixels as the fundamental unit. This approach effectively addresses the challenge posed by targets and interfering pixels that share similar shapes and are near each other.
Figure 15 shows that our designed GAGEM data enhancement module can effectively remove salt-and-pepper noise from input infrared images. Although both the Top-hat algorithm and the DNANet algorithm are capable of detecting the target, the 3D display in Figure 17 highlights the superiority of the proposed algorithm. The results obtained from the other algorithms classify some of the target pixels as background, leading to a loss of important information. Furthermore, in the high-exposure scene depicted in Figure 16, our algorithm can still detect small targets effectively. Figure 11, Figure 12, Figure 13, Figure 14, Figure 15 and Figure 16 depict infrared small-target detection scenes within highly complex environments, providing empirical support for RDFENet’s robust detection capability in challenging backgrounds. This outcome signifies the network’s commendable generalization performance.
Figure 17 illustrates the 3D visualization results obtained from various methods in the aforementioned four scenarios. This display method is more convenient to observe the clutter of the output results. The Top-hat and RLCM techniques exhibit a high false detection rate, which indicates their susceptibility to noise and clutter interference. Although some other deep-learning methods can also detect the target, our approach demonstrates superior robustness based on the 3D visualization results. Notably, our method can accomplish detection tasks that are unachievable by other methods.
(2) Numerical quantitative comparison. Table 3, Table 4 and Table 5 present the evaluation metrics for precision, recall, mIoU, F-measure, and AUC for six different methods. The best results in each column have been highlighted. These results demonstrate that each module of the RDEFNet, which was designed by our team, has achieved the expected level of performance and has a significant impact on infrared small-target detection and segmentation. RDFENet did not achieve the highest mIoU or precision on the SIRST dataset, which consisted of a relatively small number of images. This suggests that the nonlinear operation, which replaces the traditional linear multiplication and addition operation of convolution, requires a larger training set to effectively train the model. F-Measure, which is the weighted and balanced average of Precision and Recall, is necessary for a comprehensive evaluation when there is a contradiction between Precision and Recall. It is worth noting that RDFENet achieved the highest F-measure on all three datasets.

4. Conclusions

In this paper, we propose a new algorithm called RDFENet for small-target detection. First, we utilize an image enhancement module (GAGEM) to integrate local and global features from the input infrared image, addressing the issue of simplistic features in single-frame infrared small targets. Second, we combine the spatial-specific concept of Involution with an attention mechanism tailored for infrared small targets, resulting in our proposed backbone network DFEMs, which effectively extract depth information from infrared images. Furthermore, to emphasize the texture information of the shallow feature map, we modify the output feature map of FPN to incorporate self-learning weights for fusion. Compared with the most advanced methods, our designed RDFENet achieves outstanding pixel-level detection performance. It has achieved a precision of 0.8517, an F-measure of 0.8399, and an AUC of 0.9193 on the SIRST-AUG dataset. Our DRFENet also delivered impressive results on the other two datasets.
However, some issues with our approach need to be addressed. The replacement of the 3 × 3 convolution kernel requires the tensor to be fully expanded for explicit operation, which causes the network parameters to increase and affects the training time. In the future, we will study the lightweight of the network and the deployment of FPGA or other hardware devices.

Author Contributions

Conceptualization, L.W. and Y.Z.; methodology, L.W.; software, L.W. and Y.X.; validation, R.Y., S.L., and L.W.; formal analysis, R.Y. and S.L.; investigation, L.W.; writing—original draft preparation, L.W.; writing—review and editing, Y.X. and Y.Z.; funding acquisition, Y.Z. All authors have read and agreed to the published version of the manuscript.

Funding

This research was funded by the National Key Research and Development Program of China under Grant 61404130221.

Data Availability Statement

The data used for training and test set SIRST_AUG are available at: https://github.com/Tianfang-Zhang/SIRST-Aug, accessed on 15 September 2022. The data used for training and test set SIRST are available at: https://github.com/YimianDai/sirst, accessed on 15 September 2022. The data used for training and test set MDvsFA are available at: https://github.com/wanghuanphd/MDvsFA_cGAN, accessed on 15 September 2022.

Conflicts of Interest

The authors declare no conflict of interest.

References

  1. Huang, S.; Liu, Y.; He, Y.; Zhang, T.; Peng, Z. Structure-Adaptive clutter suppression for infrared small target detection: Chain-growth filtering. Remote Sens. 2020, 12, 47. [Google Scholar] [CrossRef] [Green Version]
  2. Li, Z.; Liao, S.; Zhao, T. Infrared Dim and Small Target Detection Based on Strengthened Robust Local Contrast Measure. IEEE Geosci. Remote Sens. Lett. 2022, 19, 1–5. [Google Scholar] [CrossRef]
  3. Wang, X.; Peng, Z.; Zhang, P.; He, Y. Infrared Small Target Detection via Nonnegativity-Constrained Variational Mode Decomposition. IEEE Geosci. Remote Sens. Lett. 2017, 14, 1700–1704. [Google Scholar] [CrossRef]
  4. Liu, C.; Xie, F.; Dong, X.; Gao, H.; Zhang, H. Small Target Detection from Infrared Remote Sensing Images Using Local Adaptive Thresholding. IEEE J. Sel. Top. Appl. Earth Obs. Remote Sens. 2022, 15, 1941–1952. [Google Scholar] [CrossRef]
  5. Liu, D.; Cao, L.; Li, Z.; Liu, T.; Che, P. Infrared small target detection based on flux density and direction diversity in gradient vector field. IEEE J. Sel. Top. Appl. Earth Obs. Remote Sens. 2018, 11, 2528–2554. [Google Scholar] [CrossRef]
  6. Wang, C.; Qin, S. Adaptive detection method of infrared small target based on target-background separation via robust principal component analysis. Infrared Phys. Technol. 2015, 69, 123–135. [Google Scholar] [CrossRef]
  7. Ranka, S.; Sahni, S. Efficient serial and parallel algorithms for median filtering. IEEE Trans. Signal Process. 1991, 39, 1462–1466. [Google Scholar] [CrossRef] [Green Version]
  8. Han, J.; Ma, Y.; Zhou, B.; Fan, F.; Liang, K.; Fang, Y. A robust infrared small target detection algorithm based on human visual system. IEEE Geosci. Remote Sens. Lett. 2014, 11, 2168–2172. [Google Scholar] [CrossRef]
  9. He, Y.; Li, M.; Zhang, J.; An, Q. Small infrared target detection based on low-rank and sparse representation. Infrared Phys. Technol. 2015, 68, 98–109. [Google Scholar] [CrossRef]
  10. Deshpande, S.D.; Er, M.H.; Ronda, V.; Chan, P. Max-mean and max-median filters for detection of small-targets. Proc. SPIE Int. Soc. Opt. Eng. 1999, 3809, 74–83. [Google Scholar]
  11. Zhang, Y.; Zheng, L.; Zhang, Y. Small Infrared Target Detection via a Mexican-Hat Distribution. Appl. Sci. 2019, 9, 5570. [Google Scholar] [CrossRef] [Green Version]
  12. Zhou, J.; Lv, H.; Zhou, F. Infrared small target enhancement by using sequential top-hat filters. Proc. SPIE Int. Soc. Opt. Eng. 2014, 9301, 417–421. [Google Scholar] [CrossRef]
  13. Deng, L.; Zhu, H.; Zhou, Q.; Li, Y. Adaptive top-hat filter based on quantum genetic algorithm for infrared small target detection. Multimed. Tools Appl. 2018, 77, 10539–10551. [Google Scholar] [CrossRef]
  14. Gao, J.; Lin, Z.; An, W. Infrared small target detection using a temporal variance and spatial patch contrast filter. IEEE Access 2019, 7, 32217–32226. [Google Scholar] [CrossRef]
  15. Chen, C.L.P.; Li, H.; Wei, Y.; Xia, T.; Tang, Y.Y. A local contrast method for small infrared target detection. IEEE Trans. Geosci. Remote Sens. 2014, 52, 574–581. [Google Scholar] [CrossRef]
  16. Qin, Y.; Li, B. Effective Infrared Small Target Detection Utilizing a Novel Local Contrast Method. IEEE Geosci. Remote Sens. Lett. 2016, 13, 1890–1894. [Google Scholar] [CrossRef]
  17. Han, J.; Yu, Y.; Liang, K.; Zhang, H. Infrared small-target detection under complex background based on subblock-level ratio-difference joint local contrast measure. Opt. Eng. 2018, 57, 103105. [Google Scholar] [CrossRef]
  18. Wei, Y.; You, X.; Li, H. Multiscale patch-based contrast measure for small infrared target detection. Pattern Recognit. 2016, 58, 216–226. [Google Scholar] [CrossRef]
  19. Xia, C.; Li, X.; Zhao, L.; Shu, R. Infrared Small Target Detection Based on Multiscale Local Contrast Measure Using Local Energy Factor. IEEE Geosci. Remote Sens. Lett. 2020, 17, 157–161. [Google Scholar] [CrossRef]
  20. Han, J.; Ma, Y.; Huang, J.; Mei, X.; Ma, J. An Infrared Small Target Detecting Algorithm Based on Human Visual System. IEEE Geosci. Remote Sens. Lett. 2016, 13, 452–456. [Google Scholar] [CrossRef]
  21. Hsieh, T.-H.; Chou, C.-L.; Lan, Y.-P.; Ting, P.-H.; Lin, C.-T. Fast and Robust Infrared Image Small Target Detection Based on the Convolution of Layered Gradient Kernel. IEEE Access 2021, 9, 94889–94900. [Google Scholar] [CrossRef]
  22. Wu, L.; Fang, S.; Ma, Y.; Fan, F.; Huang, J. Infrared small target detection based on gray intensity descent and local gradient watershed. Infrared Phys. Technol. 2022, 123, 104171. [Google Scholar] [CrossRef]
  23. Lu, X.; Bai, X.; Li, S.; Hei, X. Infrared Small Target Detection Based on the Weighted Double Local Contrast Measure Utilizing a Novel Window. IEEE Geosci. Remote Sens. Lett. 2022, 19, 1–5. [Google Scholar] [CrossRef]
  24. Gao, C.; Meng, D.; Yang, Y.; Wang, Y.; Zhou, X.; Hauptmann, A.G. Infrared Patch-Image Model for Small Target Detection in a Single Image. IEEE Trans. Image Process. 2013, 22, 4996–5009. [Google Scholar] [CrossRef] [PubMed]
  25. Guo, J.; Wu, Y.; Dai, Y. Small target detection based on reweighted infrared patch-image model. Iet Image Process. 2018, 12, 70–79. [Google Scholar] [CrossRef]
  26. Zhang, L.; Peng, L.; Zhang, T.; Cao, S.; Peng, Z. Infrared Small Target Detection via Non-Convex Rank Approximation Minimization Joint l(2,1) Norm. Remote Sens. 2018, 10, 1821. [Google Scholar] [CrossRef] [Green Version]
  27. Dai, Y.; Wu, Y. Reweighted Infrared Patch-Tensor Model with Both Nonlocal and Local Priors for Single-Frame Small Target Detection. IEEE J. Sel. Top. Appl. Earth Obs. Remote Sens. 2017, 10, 3752–3767. [Google Scholar] [CrossRef] [Green Version]
  28. Zhang, T.; Peng, Z.; Wu, H.; He, Y.; Li, C.; Yang, C. Infrared small target detection via self-regularized weighted sparse model. Neurocomputing 2021, 420, 124–148. [Google Scholar] [CrossRef]
  29. Liu, T.; Yang, J.; Li, B.; Xiao, C.; Sun, Y.; Wang, Y.; An, W. Nonconvex Tensor Low-Rank Approximation for Infrared Small Target Detection. IEEE Trans. Geosci. Remote Sens. 2022, 60, 1–18. [Google Scholar] [CrossRef]
  30. Rawat, S.S.; Alghamdi, S.; Kumar, G.; Alotaibi, Y.; Khalaf, O.I.; Verma, L. Infrared Small Target Detection Based on Partial Sum Minimization and Total Variation. Mathematics 2022, 10, 671. [Google Scholar] [CrossRef]
  31. Ryu, J.; Kim, S. Small infrared target detection by data-driven proposal and deep learning-based classification. Proc. SPIE—Int. Soc. Opt. Eng. 2018, 10624, 134–143. [Google Scholar] [CrossRef]
  32. Hou, Q.; Wang, Z.; Tan, F.; Zhao, Y.; Zheng, H.; Zhang, W. RISTDnet: Robust Infrared Small Target Detection Network. IEEE Geosci. Remote Sens. Lett. 2022, 19, 1–5. [Google Scholar] [CrossRef]
  33. Dai, Y.; Wu, Y.; Zhou, F.; Barnard, K. Attentional Local Contrast Networks for Infrared Small Target Detection. IEEE Trans. Geosci. Remote Sens. 2021, 59, 9813–9824. [Google Scholar] [CrossRef]
  34. Wang, H.; Zhou, L.; Wang, L. Miss detection vs. false alarm: Adversarial learning for small object segmentation in infrared images. In Proceedings of the 2019 IEEE/CVF International Conference on Computer Vision (ICCV), Seoul, Republic of Korea, 27 October–2 November 2019; pp. 8508–8517. [Google Scholar] [CrossRef]
  35. Kim, J.-H.; Hwang, Y. GAN-Based Synthetic Data Augmentation for Infrared Small Target Detection. IEEE Trans. Geosci. Remote Sens. 2022, 60, 1–12. [Google Scholar] [CrossRef]
  36. Wang, K.; Du, S.; Liu, C.; Cao, Z. Interior Attention-Aware Network for Infrared Small Target Detection. IEEE Trans. Geosci. Remote Sens. 2022, 60, 1–13. [Google Scholar] [CrossRef]
  37. Li, B.; Xiao, C.; Wang, L.; Wang, Y.; Lin, Z.; Li, M.; An, W.; Guo, Y. Dense Nested Attention Network for Infrared Small Target Detection. IEEE Trans. Image Process. 2022, 32, 1745–1758. [Google Scholar] [CrossRef]
  38. Chen, G.; Wang, W.; Tan, S. IRSTFormer: A Hierarchical Vision Transformer for Infrared Small Target Detection. Remote Sens. 2022, 14, 3258. [Google Scholar] [CrossRef]
  39. Zuo, Z.; Tong, X.; Wei, J.; Su, S.; Wu, P.; Guo, R.; Sun, B. AFFPN: Attention Fusion Feature Pyramid Network for Small Infrared Target Detection. Remote Sens. 2022, 14, 3412. [Google Scholar] [CrossRef]
  40. Dai, Y.; Wu, Y.; Zhou, F.; Barnard, K. Asymmetric contextual modulation for infrared small target detection. In Proceedings of the 2021 IEEE Winter Conference on Applications of Computer Vision (WACV), Waikoloa, HI, USA, 3–8 January 2021; pp. 949–958. [Google Scholar] [CrossRef]
  41. Zhang, T.; Cao, S.; Pu, T.; Peng, Z. AGPCNet: Attention-guided pyramid context networks for infrared small target detection. arXiv 2021, arXiv:2111.03580. [Google Scholar]
  42. Wang, A.; Li, W.; Wu, X.; Huang, Z.; Tao, R. Mpanet: Multi-Patch Attention for Infrared Small Target Object Detection. arXiv 2022, arXiv:2206.02120. [Google Scholar] [CrossRef]
  43. Hou, Q.; Zhang, L.; Tan, F.; Xi, Y.; Zheng, H.; Li, N. ISTDU-Net: Infrared Small-Target Detection U-Net. IEEE Geosci. Remote Sens. Lett. 2022, 19, 1–5. [Google Scholar] [CrossRef]
  44. Woo, S.; Park, J.; Lee, J.-Y.; Kweon, I.S. CBAM: Convolutional block attention module. In Computer Vision—ECCV 2018. ECCV 2018. Lecture Notes in Computer Science; Ferrari, V., Hebert, M., Sminchisescu, C., Weiss, Y., Eds.; Springer: Cham, Switzerland, 2018; Volume 11211. [Google Scholar]
  45. Rukundo, O. Normalized Weighting Schemes for Image Interpolation Algorithms. Appl. Sci. 2023, 13, 1741. [Google Scholar] [CrossRef]
Figure 1. Overall network architecture. Prior to feeding the image into the feature-extraction backbone network, GAGEM is employed to enhance the image. The backbone network consists of four DFEM cascades, with C1, C2, C3, and C4 representing the respective outputs at different depths. LFPN denotes the learnable distribution weight of the feature pyramid network.
Electronics 12 02568 g001
Figure 2. The global attention guidance enhancement module. The pink block represents the nonlocal module, and the orange block represents the global average module.
Electronics 12 02568 g002
Figure 3. Description of IRST-Involution. Calculate the average and maximum value of superpixel points of super K × K × C size, and fuse them with the central pixel point as a new attention mechanism. N is the attention head. Then, we group the element-wise multiplication and summation with the original input to obtain K × K × C output.
Electronics 12 02568 g003
Figure 4. The difference between Resblock and Bottleneck. The traditional 3 × 3 convolution is replaced by our designed IRST-Involution. BN refers to Batch Normalization, which is a normalization function commonly used in deep-learning models. ReLU stands for Rectified Linear Unit and is an activation function used in neural networks.
Electronics 12 02568 g004
Figure 5. Overall architecture of the backbone. (a, b, c, d) means (Inplanes, Outplanes, Stride, Feature drawing size) Stride denotes the sliding step size of IRST-Involution and 3 × 3 convolution. Feature drawing size indicates the output feature drawing size.
Electronics 12 02568 g005
Figure 6. Fusion process of different feature layers.
Electronics 12 02568 g006
Figure 7. Description of LFPN. Ci (i = 1,2,3,4) represents the different depth feature maps extracted from the backbone network. Fuse module represents the fusion method mentioned above. Up-sampling adopts bilinear interpolation.
Electronics 12 02568 g007
Figure 8. (a) Represents test results for different convolution kernel sizes Ks. (b) Represents test results for different attention heads N. (c) Represents the test results of GAGEM dividing different grid sizes.
Electronics 12 02568 g008
Figure 9. (a) shows the impact of GAGEM on F-measure. (b) shows the impact of GAGEM on mIoU. The blue curve is the result of not adding GAGEM during training, while the orange curve is the result of adding GAGEM during training.
Electronics 12 02568 g009
Figure 10. (a) shows the impact of DEFMs on F-measure. (b) shows the impact of DEFMs on mIoU. The blue curve represents the backbone network as Resnet18, the orange curve represents the backbone network as CNN, and the red curve represents the backbone network as DEFMs.
Electronics 12 02568 g010
Figure 11. Qualitative results of the different methods for infrared Scene 1. (SIRST_AUG). The successful detection is indicated by a green circle, false detection by a red circle, and missed detection by a yellow circle.
Electronics 12 02568 g011
Figure 12. Qualitative results of the different methods for infrared Scene 2. (SIRST_AUG). The successful detection is indicated by a green circle, false detection by a red circle, and missed detection by a yellow circle.
Electronics 12 02568 g012
Figure 13. Qualitative results of the different methods for infrared Scene 3. (SIRST_AUG). The successful detection is indicated by a green circle, false detection by a red circle, and missed detection by a yellow circle.
Electronics 12 02568 g013
Figure 14. Qualitative results of the different methods for infrared Scene 4. (SIRST_AUG). The successful detection is indicated by a green circle, false detection by a red circle, and missed detection by a yellow circle.
Electronics 12 02568 g014
Figure 15. Qualitative results of the different methods for infrared Scene 5. (MDvsFA). The successful detection is indicated by a green circle, false detection by a red circle, and missed detection by a yellow circle.
Electronics 12 02568 g015
Figure 16. Qualitative results of the different methods for infrared Scene 6. (SIRST). The successful detection is indicated by a green circle, false detection by a red circle, and missed detection by a yellow circle.
Electronics 12 02568 g016
Figure 17. Three-dimensional representation of the results.
Electronics 12 02568 g017aElectronics 12 02568 g017b
Table 1. Feature map dimensions.
LayersInput Channel/Output ChannelInput Size/
Output Size
Translayer8/16256 × 256/256 × 256
DFEM116/64256 × 256/256 × 256
DFEM264/128256 × 256/128 × 128
DFEM3128/256128 × 128/64 × 64
DFEM4256/51264 × 64/32 × 32
Table 2. Comparison of backbone performance at different depths. The best results are bolded.
Convolution DepthPrecisionRecallmIoUF-MeasureAUC
30.74580.77650.61400.76080.9024
90.85170.82830.72390.83990.9193
130.80580.75810.64100.78120.8837
Table 3. Results obtained by different methods on the SIRST dataset. The best results are bolded.
MethodsPrecisionRecallmIoUF-MeasureAUC
Top-Hat 0.25680.52130.28750.34410.8341
RLCM0.45130.60210.21650.51590.8797
MDvsFA0.67500.7266-0.6999-
AGPCNet0.68810.92500.65180.78920.9689
DNANet0.81740.76920.70460.7926-
Ours0.69480.94130.66600.79950.9784
Table 4. Results obtained by different methods on the SIRST_AUG dataset. The best results are bolded.
MethodsPrecisionRecallmIoUF-MeasureAUC
Top-Hat 0.59720.06770.16880.14510.7541
RLCM0.84560.18640.16520.19840.8010
MDvsFA0.64080.7982-0.7109-
AGPCNet0.80570.80410.67350.80490.9160
DNANet0.77720.70840.60670.7412-
Ours0.85170.82830.72390.83990.9193
Table 5. Results obtained by different methods on the MDvsFA dataset. The best results are bolded.
MethodsPrecisionRecallmIoUF-MeasureAUC
Top-Hat 0.04860.10480.02650.06640.7023
RLCM0.63290.15800.14520.25290.8362
MDvsFA0.65850.5297-0.56230.9025
AGPCNet0.56010.70170.45240.62990.8429
DNANet0.52100.67820.46130.5893-
Ours0.55930.74800.47060.64000.8748
Disclaimer/Publisher’s Note: The statements, opinions and data contained in all publications are solely those of the individual author(s) and contributor(s) and not of MDPI and/or the editor(s). MDPI and/or the editor(s) disclaim responsibility for any injury to people or property resulting from any ideas, methods, instructions or products referred to in the content.