Article

Recommender System Metaheuristic for Optimizing Decision-Making Computation

1
Scientific Systems Company, Inc., Woburn, MA 01801, USA
2
Raytheon BBN, Cambridge, MA 02138, USA
3
Interactive Aptitude, LLC, San Diego, CA 92129, USA
*
Author to whom correspondence should be addressed.
Electronics 2023, 12(12), 2661; https://doi.org/10.3390/electronics12122661
Submission received: 25 April 2023 / Revised: 1 June 2023 / Accepted: 9 June 2023 / Published: 14 June 2023
(This article belongs to the Special Issue Data-Driven Processing from Complex Systems Perspective)

Abstract

:
We implement a novel recommender system (RS) metaheuristic framework within a nonlinear NP-hard decision-making problem, for reducing the solution search space before high-burden computational steps are performed. Our RS-based metaheuristic supports consideration of comprehensive evaluation criteria, including estimations of the potential solution set’s optimality, diversity, and feedback/preference of the end-user, while also being fully compatible with additional established RS evaluation metrics. Compared to prior Operations Research metaheuristics, our RS-based metaheuristic allows for (1) achieving near-optimal solution scores through comprehensive deep learning training, (2) fast metaheuristic parameter inference during solution instantiation trials, and (3) the ability to reuse this trained RS module for traditional RS ranking of final solution options for the end-user. When implementing this RS metaheuristic within an experimental high-dimensionality simulation environment, we see an average 91.7% reduction in computation time against a baseline approach, and solution scores within 9.1% of theoretical optimal scores. A simplified RS metaheuristic technique was also developed in a more realistic decision-making environment dealing with multidomain command and control scenarios, where a significant computation time reduction of 87.5% is also achieved compared with a baseline approach, while maintaining solution scores within 9.5% of theoretical optimal scores.

1. Introduction

In this article, we provide a framework for adapting traditional recommender systems (RSs) for minimizing the decision-making search space within Operations Research applications, specifically for deterministic nonlinear NP-hard problems. The proposed framework also supports the traditional RS use of ranking final solutions for the end-user.
Operations Research refers to the use of quantitative techniques for enhancing any system’s operation and performance, such as health systems and industrial systems. Operations Research applications consist of either linear or nonlinear problem formulations, with either deterministic or stochastic constraints [1,2,3,4,5]. For higher computational complexity nonlinear or NP-hard problems, a reduction in the decision-making search space can be critical for reaching near-optimal solutions in a timely manner. Within the field of Operations Research, a reduction in the search space is generally performed through metaheuristic methods that iteratively attempt to find “shortcuts” in minimizing the solution’s soft constraints while complying with all hard constraints. Common metaheuristic methods are often categorized as evolution-based, swarm-based, sciences-based, or human-based [6,7,8]. In this article, we study a novel category of metaheuristics, namely our RS-based metaheuristics, which recommend top parameter combinations for solution instantiation trials, using an RS trained a domain-specific set of evaluation criteria.
Our RS-based metaheuristic method leverages existing research outside the field of Operations Research, namely from the field of RSs. RSs generally seek to predict the preference a user would give to an item (e.g., web search results, e-commerce product options, streaming videos, etc.). The user’s information can be acquired either explicitly (e.g., collecting user ratings, surveys, etc.) or implicitly (e.g., monitoring user/market behavior within an application, etc.). In industry, RSs typically attempt to maximize a company’s revenues through a feedback loop of tuning/updating the RS and measuring key performance indicators (such as sales/ad revenue, user engagement, etc.), while also considering business conditions (such as a need to increase short-term profits, increase long-term user engagement, etc.) [9,10,11,12]. Our novel RS metaheuristic implementation reuses these existing RS technologies, specifically leveraging their abilities for (1) supporting heterogeneous data inputs and (2) ranking and instantiating promising parameter/solution trials using well-researched RS models and evaluation criteria.
In our experimentation, we study the problem of command and control (C2) in particular, to fulfill end-user requests in the Find Fix Track Target Engage Assess (F2T2EA) mission cycle, while supporting multidomain assets (i.e., supporting domains of land, maritime, air, space, and cyber). This problem is inherently an NP-hard nonlinear stochastic differential game; however, in this study, we assume a static adversary and deterministic observations/actions, simplifying the study to an NP-hard nonlinear deterministic problem. Prior work on multidomain C2 RS ranking techniques for the end-user can be adapted for use as an RS metaheuristic for this C2 problem [13]. C2 Operations Research systems are generally not published publicly due to their sensitive nature; thus, a survey of existing C2 solution methods cannot be easily compiled. However, there are several RS publications available related to Department of Defense applications, including cyber-security prioritized actions as a result of network and misinformation attacks [14,15], RSs for military ground-to-ground kinetic effects [16], RSs for real-time control of drone swarms [17], RSs for organizing unstructured websites/documents/audio/video for intelligence data mining [14], considering cross-cultural issues in an RS for commander decisions [18], hierarchical organization effects on RS theoretical architectures [19], and considering human psychology for accurately measuring RS performance [20].
In this study, we (1) formulate an RS system for both metaheuristic optimization and ranking of final solution options based on example C2 requirements, (2) develop a method to optimize RS performance, and (3) discuss RS model tuning/execution results for both a realistic C2 system as well as an experimental C2 decision-making system considering larger problem dimensionalities.

2. Problem Context

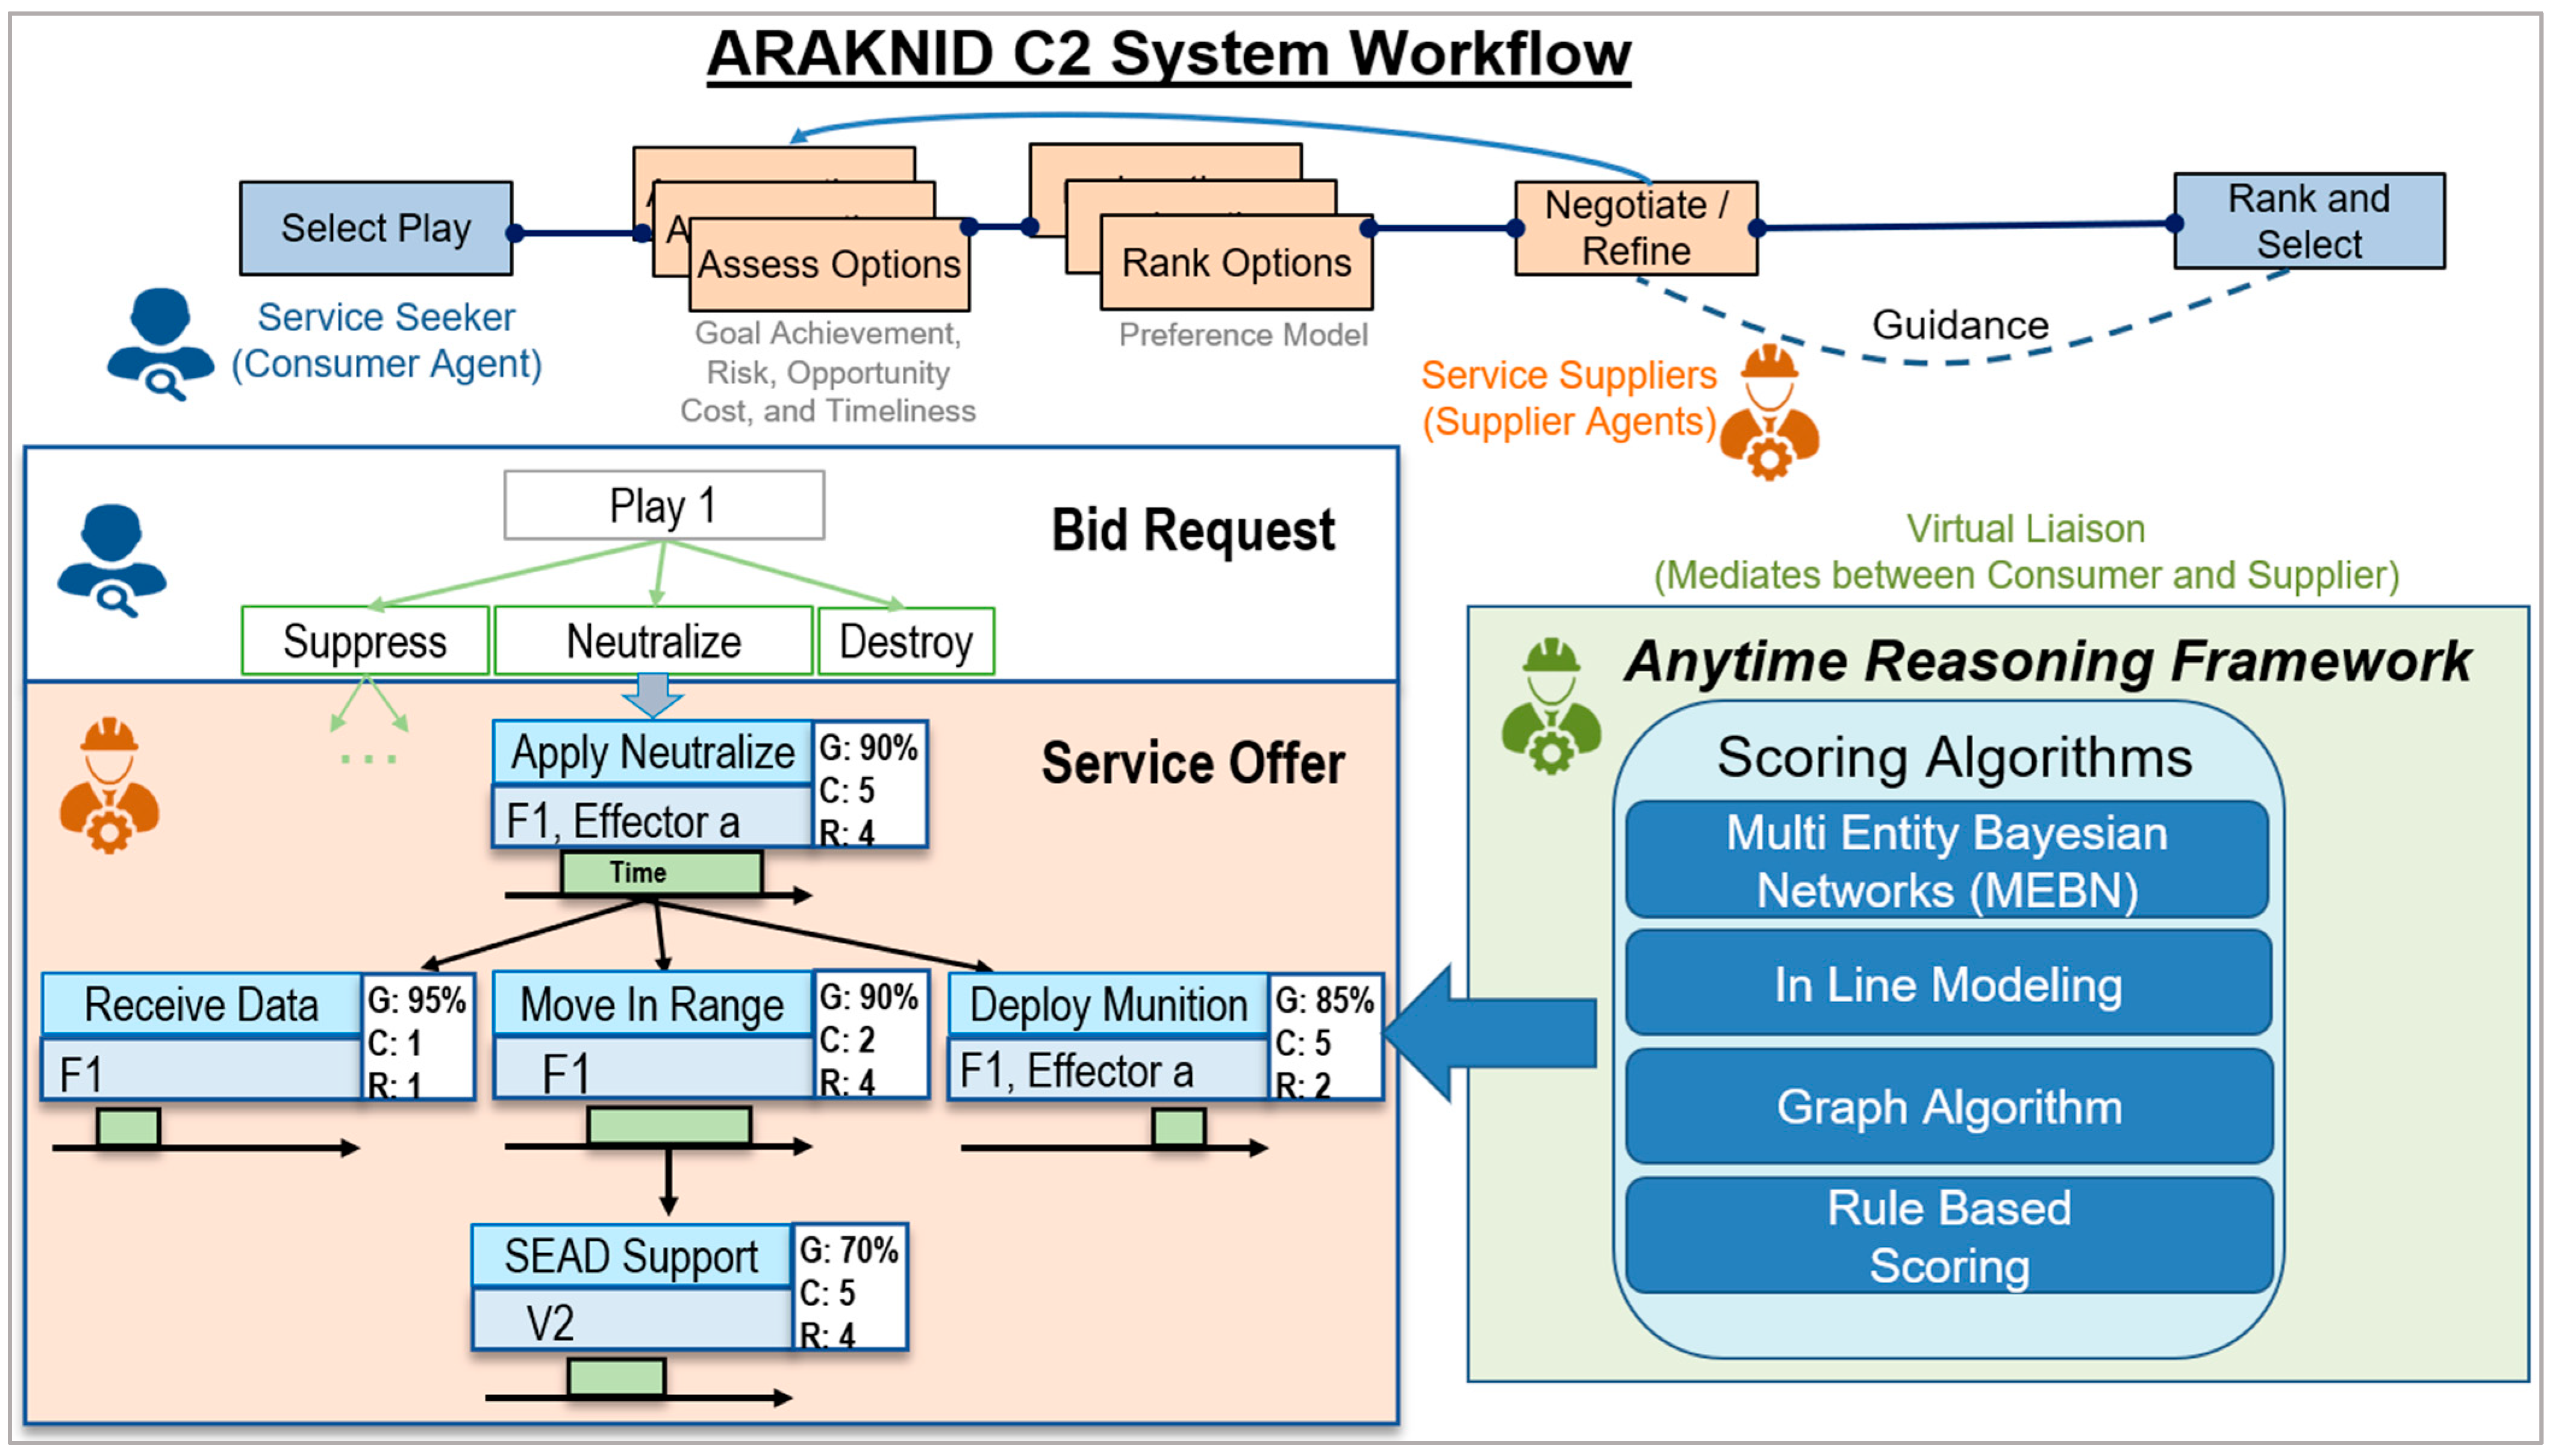
2.1. Command and Control Problem Summary

Successful battle management via C2 software requires a CoA (Course of Action) generator that can connect sensors to effectors across all warfighting domains within seconds to respond to dynamic pop-up events [21]. Our implemented C2 system provides such a capability by using techniques to compute, analyze, and score thousands of CoA options within seconds, providing battle managers with meaningful and explainable tradeoffs.
For engagement missions, the current state of the art is focused on assembling kill-chains, involving a small number of sensors and effectors, usually sourced from the same warfighting domain, to support the Find Fix Track Target Engage Assess (F2T2EA) mission cycle. Forming a new kill-chain takes significant planning that is measured in days. This has led to Air Tasking Orders (ATOs) being produced in a daily battle rhythm. However, the battlespace landscape can change dynamically over shorter timescales. For defensive missions, new tracks, including threats, can show up any time, and offensive missions might encounter pop-up targets of opportunity. To increase mission effectiveness, it is therefore important to adapt existing battle plans dynamically, within seconds, to adjust to evolving conditions.
To address this gap in dynamic battlespace planning, we developed a distributed system consisting of multiple agents that together form C2-chains with a rich set of cross-connects between available sensors and effectors across all warfighting domains—a concept we call a C2-web. This C2 system is named ARAKNID (Analysis for Kill-Web Negotiation and Instantiation across Domains) [22] and is based on work performed under DARPA funding. Our system directly supports the vision of JADC2 (Joint All Domain Command and Control) [23] via the following functions:
  • Automatically computes, scores, and ranks C2-webs involving multiple Courses of Action (CoAs) sourced in real-time with assets across all warfighting domains;
  • Provides battle managers with meaningful tradeoffs to select the CoA that best meets commander’s intent;
  • Reduces latencies via machine-to-machine messaging during CoA execution.
ARAKNID consists of three different types of agents. The Consumer Agent is the user-facing component that hosts the user interface and enables battle managers to issue effect requests, which describe the desired effect (e.g., neutralize) to be imposed on a specific set of targets (e.g., three specific air tracks). Conversely, the Supplier Agent is the asset-facing component which either executes directly on an asset or has connections to C2 networks that provide visibility and control of assets. The main logic of the C2 system is implemented through the Virtual Liaison Agents (VLs). The current DoD doctrine enables joint operations between the armed forces through liaison officers that help coordinate resource allocations. The VLs in this C2 system fill a similar role, in that a VL has authority over a certain set of assets that can be committed to building CoAs. Upon receiving the effect request from the consumer agent, a VL goes through a multistep process to form CoAs.
The first step in the ARAKNID decision-making engine involves instantiating possible CoAs from a set of templates that were specified upfront in the form of Hierarchical Task Networks (HTNs) [24]. Next, preconditions are validated for the various tasks and subtasks per inline modeling algorithms, e.g., to determine whether air assets have enough fuel to reach the target and return to base. CoAs are ranked based a number of metrics, including goal achievement (probability of success that the requested effect will be applied on the target), risk (likelihood of blue force attrition), opportunity cost (how asset commitments affect reserve capacity), timeliness (how close timing constraints are met), collateral damage (additional undesired effects, e.g., to civilians), and constraint violations (soft-constraint violations that require a waiver, including overriding lower priority missions). ARAKNID agents load a set of playbooks which contain plays that define how a type of supplier can produce a desired effect. Each play is an HTN that provides a rich description of tasks and subtasks, together with dependencies on each other and on environmental attributes. For example, a play can describe how an air domain supplier can provide an identify effect by flying to a location near a target, taking a sensor reading of the target, and passing that data to a compute node where an image recognition algorithm can produce an identification. Figure 1 provides a visual summary of this ARAKNID system workflow.

2.2. Data Available for Further Optimization

Achieving fast response times from a C2 system requires significant optimizations to minimize computation times while maximizing C2 offer quality. To achieve these goals, in Table 1, we identify and summarize the C2 data fields that can possibly be used for metaheuristic optimization via an RS method. These specific data fields may vary drastically depending on the application.
Based on our C2 context, there exist additional pragmatic constraints that should be considered in the implementation of an RS optimization technique, listed below:
  • Requester preferences: The C2 requester may have the option to manually enter key metric preferences into our RS system (such as wanting to value the key metric of risk more than timeliness, etc.), or the C2 system may have an automated system for determining the requester preferences (such as automatically choosing to value timeliness more than risk if the request consists of a rescue scenario), both of which can be considered within our optimizations.
  • CoA optimality: Near-optimal choices are important because this computation step can be the difference between, for example, a rescue mission succeeding or failing, an incoming cruise missile being successfully intercepted or allowed into a populated area, etc. CoA optimality is measured as a weighted average of each CoA’s key metrics (timeliness, risk, etc.).
  • CoA diversity: Diversity of CoAs provided in the output options is important because it provides the requester flexibility in choosing a slightly less optimal CoA in terms of calculated metrics, which may be a better fit based on the requester’s past experiences.
  • CoA feedback: Incorporation of feedback from users, simulations, and real-world results into the RS is important because we want the RS to consider collective human wisdom/experience during CoA selection, as well as prior simulations and real-world results of similar scenarios portraying which types of CoA choices result in the best global outcomes.
  • RS computation time: Overall C2 computation response time is often required to be a few seconds or less in crisis-level situations. To support the overall C2 system’s need for fast response times, RS inference computation time must also be minimal.
With our all-domain C2 context and constraints understood, we can next discuss the methods of optimizing C2 computation via our RS metaheuristic search space reduction technique.

3. Methods

3.1. Solution Formulation

To lay groundwork for an RS design, RS data inputs/outputs from the C2 system are identified and summarized in Figure 2. Within these abstracted steps of a C2 system, we portray how the RS can interact with a C2 system for both (1) minimizing the C2 search space as a metaheuristic and (2) ranking final offers to be presented to the end-user.

3.2. RS Metric Calculation Methods

It is considered important to define RS evaluation metrics for determining the success of any given RS system. Accurately defined metrics can then be used as feedback during RS optimization cycles for meeting these measures as closely as possible. RS evaluation metrics for existing applications are generally categorized into Rating metrics (used to evaluate how accurate a recommender is at predicting ratings that users gave to items), Ranking metrics (used to evaluate how relevant recommendations are for users), Classification metrics (used to evaluate binary labels), and Non-Accuracy-Based metrics (these do not compare predictions against ground truth but instead evaluate the following properties of the recommendations, such as novelty, diversity, serendipity, and coverage) [25,26,27,28].
The decision is made to convert previously discussed constraints of requester preferences, CoA optimality, CoA diversity, and CoA feedback into respective measures named for explanation purposes:
  • Preference measure: Based on user preferences, the metric ranks the CoAs based on a simple weighted sum against quantitative CoA key metrics;
  • Optimality measure: A novel “Pareto-mesh” technique for quantitative CoA metrics, which offers robust and computationally efficient comparisons of Pareto-front percent coverages among ranking options;
  • Diversity measure: A novel “linchpin-based qualitative/quantitative diversity” technique that considers qualitative data’s Hamming distances, quantitative data’s Euclidean distances, and optimizes diversity of returned CoAs based a chosen top linchpin CoA using maximin optimization;
  • Feedback measure: Based on implicit user choices, peripheral simulation results, and real-world scenario results, collaborative filtering methods such as Neural Collaborative Filtering (NCF) [29] can be used to predict requester/CoA ratings.
The measures of Preference, Optimality, Diversity, and Feedback each involve calculation methods, which have been explained thoroughly in a prior publication [13]. For the more innovative measures of Optimality and Diversity, their ranking methods are summarized in Figure 3.
A full example of the inputs and outputs from this RS are provided in Table 2. In this example, a user type of “Commander” submits a request with the class of “Rescue”, with a request having a priority of “2” out of “5”. A total of 100 CoAs’ qualitative and quantitative attributes are either estimated (in the case of the RS being used for minimizing computation search space) or fully calculated (in the case of providing final CoA recommendations). The RS then calculates Preference/Feedback/Optimality/Diversity measures and finally ranks all CoAs based on these results. In this example, the top 10 CoAs are provided out of the total 100 CoAs evaluated.

3.3. Optimization of RS Performance

The hyperparameters of the RS system are identified, namely two for the measure of Optimality, three for the measure of Diversity, and six for the measure of Feedback using the NCF (Neural Collaborative Filtering) model. To improve RS performance, we run an optimizer to choose each hyperparameter for the purpose of maximizing the global performance of this RS across all these measures, and across several training runs. To determine the per-measure ranking optimality, we calculate an “Inversion Score”, which uses each measure’s required sorting inversions as the source of error in a CoA list. Over a number of training runs, we vary the aforementioned hyperparameters until we closely converge to meet the following maximization goal in each training run:
max i m W i × i n v e r s i o n S c o r e S i , 1 , , S i , k k × m a x ( S i , 1 , , S i , k ) m a x ( S i )
In this maximization goal, m represents each defined RS measure type (Preference, Feedback, Optimality, and Diversity). Given an assigned weight W i (in our case W P , W O , W D , and W F for each defined RS measure of Preference/Optimality/Diversity/Feedback), we are able to maximize the weighted sum of these measure weights combined with the “Inversion Score” of each ordered measure corresponding to each top-K CoA, i n v e r s i o n S c o r e S i , 1 , , S i , k . The term m a x ( S m , 1 , , S m , k ) m a x ( S m ) is included to proportionally penalize top-K candidate lists of CoAs that do not include the maximum measure value to avoid shifting too far away from each measure’s maximum value during the training runs. For further clarification, S i represents each measure’s result corresponding to a ranked CoA candidate list and is a vector of size c (the number of candidate CoAs), where S i R c . Adding the k term in our representation, such as S m , k , subselects each top-K offer’s respective measure value, such that S m , k R . Finally, the “inversionScore()” function takes the S i , 1 , , S i , k vector input (where lower values represent better measure scores), counts the number of inversions to obtain the vector input sorted through a basic brute force Selection Sorting algorithm [30] (of time complexity O ( n 2 ) ), notes the total possible number of inversions (derived from the “nCr” combination calculation, also known as the binomial coefficient), calculates the percentage of inversions experienced, then turns this value into our final “Inversion Score” ranging from zero to one. As an example, a higher Inversion Score means the top-K CoA measure values were already sorted in near-optimal order.
A purpose-built Genetic Algorithm (GA) technique [31] was created to perform this parameter search; however, many existing multiobjective optimization techniques can also be adapted for this application. Our purpose-built GA technique consists of the GA optimization objective (described in Equation (1)) within our GA representation, seen in Figure 4.

4. Results

4.1. RS Model Tuning Results

We next discuss the tuning results of the RS measures of Feedback, Optimality, Diversity, and Preference. We aim to optimize RS measures using the GA optimizer summarized in the previous section. First, we share results of GA optimization when only the Optimality and Diversity measures are considered, simplifying the explanation of the results by disregarding the Preference and Feedback metrics which require human parameter input. Figure 5 provides these GA optimization results for the Optimality and Diversity measures only. The dataset used consists of a total of 11,664 unique combinations of CoA qualitative data, and quantitative data are randomized each GA generation cycle. In the GA parameter search plot provided, we see each parameter’s trend across 300 GA generations. We see that convergence is reached for all 5 parameters due to minimal parameter value changes within roughly the last 50 generations.
We next discuss how the Feedback measure is tuned. The Feedback measure is calculated via a trained collaborative filtering model, where we query using C2 request and CoA details and receive the expected Feedback rating. Input data are formatted for collaborative filtering methods to be compatible with algorithms such as Neural Collaborative Filtering (NCF). Coarse parameter searches are conducted, and adequate performance is ensured through bias/variance analysis of the training curves. When tuning the models considering both evaluation criteria Precision@K and Recall@K, we are aiming to optimize Precision@K while ensuring Recall@K does not fall unreasonably low, because in the C2 RS domain, we prefer a short list of highly relevant recommendations than a longer, possibly less targeted list. For understanding the effect of expected total dataset size on Feedback metric performance, input data are varied to the following number of dataset rows: 1944 rows, 3888 rows, 11,664 rows, 18,144 rows, and 29,160 rows. These rows represent unique combinations of qualitative CoA and user/request data, where the Collaborative-Filtering-formatted data are aggregated to have columns “CoA ID”, “User ID”, and “rating” for ease of computation. Each “CoA ID” represents all combinations of C2 domain types, domain schemes, actor/personnel types, and actor/personnel IDs. Each “User ID” represents all combinations of columns, i.e., all unique combinations of qualitative user/request options.
To vary the overall dataset size, CoA domain types, domain schemes, actor/personnel types, and actor/personnel IDs are added/removed to vary the number of “CoA ID” options in our dataset. Meanwhile, the “User ID” number of options stays consistent across these experiments, with combinations generated from 3 user types (“commander”, “officer”, and “analyst”), 5 priorities (“1”, “2”, “3”, “4”, and “5”), and 4 request types (“rescue”, “control”, “defensive” and “offensive”). Training/testing data percentage split is also varied to understand how much training data may be required for calculating an adequate Feedback ranking, varied among training data split percentages of 10%, 30%, 50%, and 70%. Each scenario is then tested with Monte Carlo randomized input data, with 5 trials for each experimental scenario. Average metrics and computation times are recorded, along with 95% confidence intervals over each run set. The metrics Precision@K and Recall@K are recorded for a desired top-K of ten CoAs, with a threshold successful rating of 3.0 (chosen because it is the average of the largest and smallest possible ratings, 5.0 and 1.0, respectively). The results of these training procedures are summarized graphically in Figure 6 and Figure 7.
Next, we run GA optimizations on hyperparameters of all four measures (Optimality, Diversity, Feedback, and Preference) in unison. We use the following conditions: top-K of 10 CoAs, 300 GA generations, 100 randomized candidate CoAs per run, and 11,664 total CoA combination options. Figure 8 provides optimization results of all 4 measures, assuming human input of 22% for the Preference weight, and varying between 0%, 11%, 22%, and 33% for the other human-input Feedback weight. We see that as we increase our Feedback measure weight, we are generally diminishing the Optimality and Diversity measures, while the Preference measure stays relatively constant. Lastly, we notice that even though incorporating Preference and Feedback weights generally diminishes Optimality and Diversity scores, there is an increase in the global sum of all measures’ inversion scores. Thus, based on the tested data, if compromises are acceptable between these four measures, overall RS performance can possibly be improved through increases in Feedback weight. Convergence time for our GA parameter set training takes an average of 0.93 h per each of the 4 trials, which is acceptable for being performed offline in the context of C2 systems.
GA tuning of all measures in unison resulted in the final hyperparameters provided in Table 3. The dataset used for this final tuning consists of a total of 11,664 unique combinations of CoA qualitative data, and quantitative data are randomized each GA generation cycle. A 50% training/testing data split percentage was used during this final tuning procedure, mimicking the low availability of realistic training data.

4.2. Realistic C2 System’s Simplified RS Metaheuristic Results against Baseline

Next, we implement a simplified RS metaheuristic technique within the realistic ARAKNID C2 system. Through this implementation, we gather computation time data and ranking estimator accuracy data to be used in the next section’s full RS metaheuristic implementation in a higher-dimensionality experimental Monte-Carlo-simulated C2 system.
Within this simplified RS technique in a realistic C2 system, we attempt to estimate ranking for the Optimality ranking measure only and do not consider Diversity, Feedback, or Preference. We are specifically interested in how accurately we can estimate the final ranking of CoAs during our RS “search space minimization” step. To do so, we implemented four Optimality “ranking estimators” within the ARAKNID system. These ranking estimators use various qualitative/quantitative parameters that can be considered before CoA instantiation for the purpose of ranking CoA parameter options and reducing computation search space. The following “ranking estimators” were implemented:
  • “pK”: Estimates ranking of potential CoA parameters with the goal of maximizing probability of successful engagement with an enemy, which is an estimation of the “goal achievement” C2 metric;
  • “ClosestAgents”: Estimates ranking of potential CoA parameters with the goal of choosing agents that are closest to the requested mission area, which is an estimation of the “timeliness” and “goal achievement” C2 metrics;
  • “LowestCurrentTasking”: Estimates ranking of potential CoA parameters with the goal of choosing agents which have minimal existing tasking within their schedules, for reducing potential availability conflicts during instantiation, which is again an estimation of both the “timeliness” and “goal achievement” C2 metrics;
  • “AllThree”: Estimates ranking of potential CoA parameters through a combination of the three aforementioned ranking estimators.
We compare these Optimality ranking estimators against a baseline combinatorics case. This baseline case instantiates all possible CoA options, with no RS search space reduction implemented. These ranking estimators all displayed significant benefits in CoA computation time through reducing the C2 exploration search space. Figure 9 shows that the baseline C2 method has a high linear trend of increasing computation time with an increase in CoAs considered per run, while each of the ranking estimators show much lower linear trends. This is largely due to this simplified RS’s search space reduction capability in minimizing the costly instantiation time of each CoA. Each of the ranking estimation methods also show similar trends comparing computation times, due to their similar algorithmic methods of reducing search space before CoA instantiation.
Next, we compare the overall C2 metric scores produced by the ranking estimation techniques against the baseline using Figure 10. The baseline algorithm serves as the theoretical optimal performance of each CoA run, due to its instantiation of all possible CoA options. We see that all ranking estimators are able to follow reasonably close to the theoretical optimal performance. Variation in the baseline’s theoretical optimal score is due to the randomized scenarios tested for each CoA set. The “pK” ranking estimator scores within roughly 13.6% of the baseline score on average across the CoA set sizes, while the remaining three ranking estimators score within roughly 9.5% of the baseline theoretical optimal score.

4.3. Experimental C2 System’s Comprehensive RS Metaheuristic Results against Baseline

The full RS metaheuristic model, including all four measures of Optimality, Diversity, Feedback, and Preference, is evaluated next for its expected benefits in reducing the computation search space when generating CoAs in a high-dimensionality C2 deterministic nonlinear problem, simulated using Monte-Carlo-randomized data generation. Training/testing data were also generated based on assumptions derived from the realistic ARAKNID C2 system results from the previous section, namely:
  • Instantiation computation time per CoA: 9.8 ms, with a standard deviation of 3.8 ms;
  • RS ranking accuracy for select C2 metrics:
    “Timeliness” metric average accuracy of 92.7% with a standard deviation of 6.1%;
    “Goal achievement” metric average accuracy of 86.8% with a standard deviation of 11.4%.
We run experiments to measure resulting overall scores and computation times for the following C2 RS metaheuristic algorithms:
  • Baseline: Baseline algorithm using a pure combinatorics technique to instantiate all possible CoA options, with no RS search space reduction implemented;
  • RS to Maximize Optimality: Maximizes Optimality based on the estimated realistic C2 system’s “ranking accuracy” of each C2 metric;
  • RS to Maximize Optimality/Diversity/Feedback/Preference: Maximizes Optimality, Diversity, Feedback, and Preference using the model tuning parameters discussed in a prior section, a human-input Feedback weighting of 22%, and a human-input Preference weighting of 22%
This experimental C2 system displayed significant benefits in CoA computation time when reducing the C2 exploration search space using this RS technique. Figure 11 shows that the baseline C2 method has a high linear trend of increasing computation time as more CoAs are considered per run. Using the RS to maximize all measures (Optimality, Diversity, Feedback, and Preference) shows a shallow linear trend. This is largely due to the RS’s search space reduction capability in minimizing the costly instantiation time of each CoA. This RS also has a low computation time footprint on the overall C2 system, able to rank CoA parameters for consideration in an average of 2.18 s in all the CoA sets tested, which is considered acceptable to meet C2 computation time requirements.
Overall CoA scores were computed for this experimental Monte-Carlo-generated C2 system, and visual results are provided in Figure 12. The baseline algorithm provides the theoretical optimal score, due to this algorithm’s purpose of instantiating all possible CoA options. When only considering the RS Optimality ranking measure and ignoring Diversity/Feedback/Preference, we see an average 9.1% reduction in the overall CoA score, which is understandable due to our assumed realistic C2 system “ranking accuracies” used for each C2 metric. Ranking accuracy has the potential to be improved with additional software development efforts within the realistic C2 system’s ranking estimator algorithms. When including all RS raking measures (Optimality/Diversity/Feedback/Preference), we see a significant drop in the overall CoA scores in the returned CoA sets. This makes sense due to the tuned RS’s additional focus on Diversity/Feedback/Preference ranking measures, which are more focused on end-user experience quality rather than optimality. When using all RS measures, in practice, the RS can also be tuned to increase optimality at the expense of Diversity/Feedback/Preference if desired.

5. Discussion

Our RS metaheuristic method was able to optimize solution results using a comprehensive set of ranking measures of particular importance within the C2 domain, namely Optimality, Diversity, Feedback, and Preference. When using the RS to reduce the computational search space within a high-dimensionality experimental C2 system, we see an average 91.7% reduction in computation time against a baseline approach. This RS metaheuristic also demonstrated final CoA scores within 9.1% of theoretical optimal scores. We also see a fast RS metaheuristic inference time on the order of 0.02 milliseconds on average, and an acceptable offline average training time of 0.93 h. When implementing a simplified RS metaheuristic in a realistic C2 system, we also reach a computation time reduction of 87.5% compared with a baseline approach, and we maintain CoA scores within 9.5% of theoretical optimal scores. While these results are specific to the domain of C2 decision making, we believe it is reasonable to reuse these methods for similar decision-making optimizations within other domains.
The main limitations of this RS metaheuristic method include that (1) it does not consider the stochasticity or partial observability of states, nor the partial control of state transitions, and (2) there is possible incompatibility with highly dynamic environments, due to its offline training methodology.
Future research directions for this RS search space minimization technique include (1) identifying how this technique can be merged with other metaheuristic methods to further optimize solutions and response times; (2) considering additional metaheuristics to maximize output scores while minimizing computational speeds; (3) incorporating dynamic online optimization of ranking measures and ranking estimator choices; (4) generalizing this RS-based metaheuristic to be easily retrained for new domains; (5) verifying the compatibility of this RS metaheuristic with highly dynamic environments by evaluating the possibility of online/adaptive retraining; and (6) considering stochasticity, including both the partial observability of states and partial control of state transitions (likely related to studies of Partially Observable Markov Decision Processes, Markov Chains, and Hidden Markov Models [32,33,34]).

6. Conclusions

In the domain of Operations Research decision making, we implemented a framework for an RS metaheuristic to efficiently reduce computational search spaces. Through experimentation within two separate NP-hard nonlinear deterministic C2 experiments, our RS metaheuristic approach exhibited on the order of ~90% reduction in computation times, while maintaining a reasonable reduction in solution optimality of ~9%. This RS framework also supported the ranking of the final solution output options for the end-user, providing two valuable functions from this same RS software module.

Author Contributions

Conceptualization, V.B. and B.B.; methodology, V.B., S.L. and B.B.; software, S.L., J.V., V.B. and B.B.; validation, S.L. and V.B.; formal analysis, J.V., S.L. and V.B.; investigation, V.B.; resources, V.B.; data curation, V.B. and B.B.; writing—original draft preparation, V.B. and S.L.; writing—review and editing, V.B., B.B. and C.R.; visualization, V.B.; supervision, M.C., B.B. and V.B.; project administration, B.B. and V.B.; funding acquisition, B.B., M.C. and V.B. All authors have read and agreed to the published version of the manuscript.

Funding

This research was funded by Defense Advanced Research Projects Agency (DARPA) and the Air Force Research Laboratory (AFRL) under contract reference FA8750-19-C-0056.

Data Availability Statement

The data may be available on request to the corresponding author. The data are not publicly available due to U.S. Department of Defense privacy restrictions.

Acknowledgments

This article is based upon work sponsored by the Defense Advanced Research Projects Agency (DARPA) and the Air Force Research Laboratory (AFRL), on contract reference FA8750-19-C-0056. Any opinions, findings, conclusions, or recommendations expressed are those of the authors and do not necessarily reflect the views of DARPA, AFRL, the U.S. Air Force, the U.S. Department of Defense, or the U.S. Government. Per DISTAR Case #37919, this document is marked with Distribution Statement “A” (Approved for Public Release, Distribution Unlimited).

Conflicts of Interest

The authors declare no conflict of interest. The funders had no role in the design of the study; in the collection, analyses, or interpretation of data; in the writing of the manuscript, or in the decision to publish the results.

References

  1. Hamdy, T. Operations Research: An Introduction, 10th ed.; Pearson: London, UK, 2016. [Google Scholar]
  2. Adam, E.E.; Ebert, R.J. Production and Operations Management: Concepts, Models, and Behavior; Prentice Hall: Englewood Cliffs, NJ, USA, 1992. [Google Scholar]
  3. Assad, A.A.; Gass, S.I. Profiles in Operations Research: Pioneers and Innovators; Springer Science & Business Media: New York, NY, USA, 2011; Volume 147. [Google Scholar]
  4. Balci, O. Computer Science and Operations Research: New Developments in Their Interfaces; Elsevier: New York, NY, USA, 2014. [Google Scholar]
  5. Winston, W.L. Operations Research: Applications and Algorithms, 4th ed.; Brooks/Cole: Boston, MA, USA, 2004. [Google Scholar]
  6. Du, K.L.; Swamy, M.N.S. Search and Optimization by Metaheuristics; Birkhäuser: Cham, Switzerland, 2016. [Google Scholar] [CrossRef]
  7. Gendreau, M.; Potvin, J.-Y. Handbook of Metaheuristics; Springer: New York, NY, USA, 2010; Volume 2. [Google Scholar]
  8. Glover, F.W.; Kochenberger, G.A. Handbook of Metaheuristics; Springer Science & Business Media: New York, NY, USA, 2006; Volume 5. [Google Scholar]
  9. Li, D.; Lian, J.; Zhang, L.; Ren, K.; Lu, D.; Wu, T.; Xie, X. Recommender Systems: Frontiers and Practices; Publishing House of Electronics Industry: Beijing, China, 2022. (In Chinese) [Google Scholar]
  10. Argyriou, A.; González-Fierro, M.; Zhang, L. Microsoft Recommenders: Best Practices for Production-Ready Recommendation Systems. In Proceedings of the WWW 2020: Companion Proceedings of the Web Conference 2020, Taipei, Taiwan, 20–24 April 2020. [Google Scholar] [CrossRef]
  11. Zhang, L.; Wu, T.; Xie, X.; Argyriou, A.; González-Fierro, M.; Lian, J. Building Production-Ready Recommendation System at Scale. In Proceedings of the ACM SIGKDD Conference on Knowledge Discovery and Data Mining 2019 (KDD 2019), Anchorage, AK, USA, 4–8 August 2019. [Google Scholar]
  12. Graham, S.; Min, J.K.; Wu, T. Microsoft recommenders: Tools to accelerate developing recommender systems, RecSys ’19. In Proceedings of the 13th ACM Conference on Recommender Systems, Copenhagen, Denmark, 16–20 September 2019. [Google Scholar] [CrossRef]
  13. Bajenaru, V.; Vaccaro, J.; Colby, M.; Benyo, B. Comprehensive top-K recommender system for command and control, using novel evaluation and optimization algorithms. In Proceedings of the Artificial Intelligence and Machine Learning for Multi-Domain Operations Applications IV, Online, 2–4 April 2022; Volume 12113. [Google Scholar] [CrossRef]
  14. Gadepally, V.N.; Hancock, B.J.; Greenfield, K.B.; Campbell, J.P.; Campbell, W.M.; Reuther, A.I. Recommender systems for the Department of Defense and intelligence community. Linc. Lab. J. 2016, 22, 74–89. [Google Scholar]
  15. Fernandez, M.; Bellogín, A. Recommender Systems and misinformation: The problem or the solution? OHARS’20. In Proceedings of the Workshop on Online Misinformation- and Harm-Aware Recommender System, Virtual, 25 September 2020. [Google Scholar]
  16. Bedi, P.; Sinha, A.K.; Agarwal, S.; Awasthi, A.; Gaurav, P.; Saini, D. Influence of Terrain on Modern Tactical Combat: Trust-based Recommender System. Def. Sci. J. 2010, 60, 405–411. [Google Scholar] [CrossRef] [Green Version]
  17. Debie, E.; El-Fiqi, H.; Fidock, J.; Barlow, M.; Kasmarik, K.; Anavatti, S.; Garratt, M.; Abbass, H. Autonomous recommender system for reconnaissance tasks using a swarm of UAVs and asynchronous shepherding. Hum.-Intell. Syst. Integr. 2021, 3, 175–186. [Google Scholar] [CrossRef]
  18. Cerri, T.; Laster, N.; Hernandez, A.; Hall, S.B.; Stothart, C.R.; Donahue, J.K.; French, K.; Soyka Tradoc, G.M.; Johnson, A.; Sleevi Tradoc, G.N.F. Approved for public release; Distribution unlimited using AI to assist commanders with complex decision-making. In Proceedings of the Interservice/Industry Training, Simulation, and Education Conference (I/ITSEC), Paper No. 18072, Orlando, FL, USA, 15 November 2018. [Google Scholar]
  19. Pilarski, M.G. The concept of recommender system supporting command and control system in hierarchical organization. In Proceedings of the 2014 European Network Intelligence Conference, Wroclaw, Poland, 29–30 September 2014; pp. 138–141. [Google Scholar]
  20. Schaffer, J.; O’Donovan, J.; Höllerer, T. Easy to please: Separating user experience from choice satisfaction. In Proceedings of the 26th Conference on User Modeling, Adaptation and Personalization, Singapore, 8–11 July 2018. [Google Scholar]
  21. Marius, V.; Alberts, D.S.; Agre, J.R. C2 Re-Envisioned: The Future of the Enterprise; CRC Press: New York, NY, USA, 2015; p. 1. ISBN 9781466595804. [Google Scholar]
  22. Benyo, B.; Atighetchi, M.; Broderick-Sander, R.; Jeter, S.; Hiebel, J.; Bajenaru, V. Building Adaptive Cross-Domain Kill-Webs. In Proceedings of the IEEE MILCOM 2022 Restricted Access Technical Program, Systems Perspectives Session, National Capital Region, Online, 30 November 2022. [Google Scholar]
  23. Lingel, S.; Hagen, J.; Hastings, E.; Lee, M.; Sargent, M.; Walsh, M.; Zhang, L.A.; Blancett, D.; Zhang, L.A.; Blancett, D. Joint All Domain Command and Control for Modern Warfare: An Analytic Framework for Identifying and Developing Artificial Intelligence Applications; RAND: Santa Monica, CA, USA, 2022. [Google Scholar]
  24. Erol, K.; Hendler, J.A.; Nau, D.S. Semantics for Hierarchical Task-Network Planning; DTIC Document: Fort Belvoir, VA, USA, 1995. [Google Scholar]
  25. Gunawardana, A.; Shani, G. A Survey of Accuracy Evaluation Metrics of Recommendation Tasks. J. Mach. Learn. Res. 2009, 10, 2935–2962. [Google Scholar]
  26. Paraschakis, D.; Nilsson, B.J.; Hollander, J. Comparative Evaluation of Top-N Recommenders in e-Commerce: An Industrial Perspective. In Proceedings of the 2015 IEEE 14th International Conference on Machine Learning and Applications (ICMLA), Miami, FL, USA, 9–11 December 2015. [Google Scholar]
  27. Koren, Y.; Bell, R. Advances in Collaborative Filtering. In Recommender Systems Handbook; Springer: Berlin/Heidelberg, Germany, 2015. [Google Scholar]
  28. Cauteruccio, F.; Terracina, G.; Ursino, D. Generalizing identity-based string comparison metrics: Framework and techniques. Knowl.-Based Syst. 2020, 187, 104820. [Google Scholar] [CrossRef]
  29. He, X.; Liao, L.; Zhang, H.; Nie, L.; Hu, X.; Chua, T.-S. Neural Collaborative Filtering. In Proceedings of the 26th International Conference on World Wide Web, WWW ’17, Perth, Australia, 3–7 April 2017. [Google Scholar]
  30. Knuth, D. The Art of Computer Programming, Volume 3: Sorting and Searching, 3rd ed.; Addison–Wesley: Boston, MA, USA, 1997; ISBN 0-201-89685-0. [Google Scholar]
  31. Mitchell, M. An Introduction to Genetic Algorithms; MIT Press: Cambridge, MA, USA, 1996. [Google Scholar]
  32. Bellman, R.E. Dynamic Programming, Dover Paperback ed.; Princeton University Press: Princeton, NJ, USA, 2003; ISBN 978-0-486-42809-3. [Google Scholar]
  33. Feinberg, E.A.; Shwartz, A. (Eds.) Handbook of Markov Decision Processes; Kluwer: Boston, MA, USA, 2002; ISBN 9781461508052. [Google Scholar]
  34. Guo, X.; Hernández-Lerma, O. Continuous-Time Markov Decision Processes. In Stochastic Modelling and Applied Probability; Springer: Berlin/Heidelberg, Germany, 2009; ISBN 9783642025464. [Google Scholar]
Figure 1. High-level architecture of the C2 system workflow.
Electronics 12 02661 g001
Figure 2. RS black-box data inputs/outputs.
Electronics 12 02661 g002
Figure 3. Example rankings per CoA for measures of (a) Optimality using our “Pareto-mesh” technique and (b) Diversity using our “linchpin-based qualitative/quantitative diversity” technique, where green denotes a higher score and red denotes a lower score.
Electronics 12 02661 g003
Figure 4. GA representation for the evolution of C2 RS hyperparameter sets.
Electronics 12 02661 g004
Figure 5. GA optimization of Optimality and Diversity parameters per generation.
Electronics 12 02661 g005
Figure 6. NCF Feedback measure tested on various scenarios to determine Precision@k and Recall@k values.
Electronics 12 02661 g006
Figure 7. NCF Feedback measure tested on various scenarios, to determine computation times.
Electronics 12 02661 g007
Figure 8. GA optimization results of all 4 metrics, assuming human input of 22% for Preference weight and varying between 0%, 11%, 22%, and 33% for the Feedback weight.
Electronics 12 02661 g008
Figure 9. Realistic C2 system’s scores of the baseline C2 method vs. RS metaheuristic method, where the shaded regions represent standard deviation across runs.
Electronics 12 02661 g009
Figure 10. Realistic C2 system’s computation time of baseline C2 method vs. RS metaheuristic method, where the shaded regions represent one third of the standard deviation across runs.
Electronics 12 02661 g010
Figure 11. Experimental C2 system’s computation time of baseline C2 method vs. RS search space reduction method, where the shaded region represents standard deviation across runs.
Electronics 12 02661 g011
Figure 12. Experimental system’s scores of the baseline C2 method vs. RS search space reduction method, where the shaded region represents standard deviation across runs.
Electronics 12 02661 g012
Table 1. Identification of RS required/optional input data, extracted from C2/peripheral systems.
System Input CategorySystem Input SubcategorySystem Input Data
Each computed CoA’s detailsEach CoA’s requestor’s original intentRequesting user type (commander, analyst, etc.)
Request priority (1–5, 1 being highest)
Request class (rescue, control, defensive, offensive, etc.)
Request subclass (find, fix, track, target, engage, assess, etc.)
Request detail (estimated region of effect, time constraints, etc.)
User’s preference model for the specific request (weights of each key success metric)
Related requests, their details, and pointers to computed CoA’s (other requests desired to be performed in series/parallel/etc.)
Each CoA’s detailsEach subtask within CoA (perform imaging, classification, then data transfer, etc.)
Each subtask’s domain (space, air, ground, maritime, cyber, etc.)
Each asset/personnel ID per subtask
Each asset/personnel type per ID (LEO Satellite, OSINT analyst, SIGINT analyst, etc.)
Each CoA’s calculated key success metrics (timeliness = 85%, risk = 20%, etc.)
Human feedbackImplicit data when CoA’s presentedChosen CoA’s and associated CoA properties are rated well (e.g., ratings of 5 stars out of 5 are aggregated into data pool)
Ignored CoA’s are rated poorly (e.g., ratings of 2 stars out of 5 are aggregated into data pool)
Explicit data when CoA’s presentedDuring simulations/live execution/historical execution, commanders/analysts can rate all CoA’s based on their experience (e.g., rating of 1–5 stars)
Automated system feedbackRepresentative scenario simulation resultsAs C2 system runs Monte Carlo simulations, determines overall scenario successes/failures, and rates accordingly (e.g., rating of 1–5 stars)
Real-world scenario resultsAs C2 system runs live, determines overall scenario successes/failures, and rates accordingly (e.g., rating of 1–5 stars)
Table 2. Example top-K-ranked CoAs, including CoA qualitative/quantitative attributes, calculated RS metrics, and resulting Inversion Scores.
CoA Qualitative AttributesCoA Quantitative AttributesRS Metrics
CandidateCoA ID #DomainTask TypeAsset/Person TypeEffector TypeTimeliness
(CommanderPref = 0.21)
Risk
(CommanderPref = 0.04)
Goal Achievement
(CommanderPref = 0.38)
Opportunity Cost
(CommanderPref = 0.37)
PreferenceFeedbackOptimalityDiversity
23AirFind: EO ScanHALE DroneEO-High-Res0.880.760.890.480.590.526.30 × 10−10.92
4SpaceFind: IR ScanLEO EO/IRIR-Low-Res0.560.740.820.740.550.562.55 × 10−10.92
78MaritimeFind: RF ScanSAR ShipRF-Short-Range0.050.630.570.740.400.603.67 × 10−110.92
46CyberFind: Net. Sig.Net. AnalystNet-Analysis0.160.170.300.420.750.584.50 × 10−530.86
54SpaceFind: EO ScanMEO EO/IREO-Low-Res0.590.560.060.930.430.511.06 × 10−10.43
11MaritimeFind: EO ScanSAR ShipEO-High-Res0.090.560.880.520.490.571.69 × 10−30.64
3AirFind: IR ScanMALE DroneIR-High-Res0.180.840.330.140.690.686.78 × 10−30.64
92AirFind: RF ScanHALE DroneRF-Med-Range0.420.250.570.770.480.426.29 × 10−110.64
74MaritimeFind: RF ScanSAR ShipRF-Short-Range0.650.330.710.100.270.367.86 × 10−110.64
36SpaceFind: RF ScanMEO RF SatRF-Long-Range0.350.080.340.570.270.488.10 × 10−360.30
Inversion Scores:0.690.640.710.91
Table 3. Hyperparameters (HPs) after tuning RS model.
Optimality/Diversity HPsNCF Feedback HPs
optimalityParetoFavoringExpWeight = 2.38
diversityQuantitativeWeight = 0.06
diversityQualitativeExpWeight = 0.04
diversityQualitativeWeight = 0.21
optimalityVsDiversityWeight = 0.82
model type = NeuMF
dim. of latent space = 5
MLP layer sizes = 4, 8, 16
number of epochs = 150
batch size = 1024
learning rate = 1 × 10⁻⁴
Disclaimer/Publisher’s Note: The statements, opinions and data contained in all publications are solely those of the individual author(s) and contributor(s) and not of MDPI and/or the editor(s). MDPI and/or the editor(s) disclaim responsibility for any injury to people or property resulting from any ideas, methods, instructions or products referred to in the content.

