Article

Expansion Joints Risk Prediction System Based on IoT Displacement Device

1
Jnvalue Co., Ltd., Daejeon 34068, Republic of Korea
2
Department of Information Security, Pai Chai University, Daejeon 35345, Republic of Korea
3
Division of AI Software Engineering, Pai Chai University, Daejeon 35345, Republic of Korea
*
Authors to whom correspondence should be addressed.
Electronics 2023, 12(12), 2713; https://doi.org/10.3390/electronics12122713
Submission received: 15 April 2023 / Revised: 13 June 2023 / Accepted: 14 June 2023 / Published: 17 June 2023

Abstract

:
Damage to bridge expansion joints arises from a variety of causes such as increasingly deteriorated bridges, abnormal temperatures, and increased traffic. To detect anomalies in the expansion joints, this study proposes an Artificial Intelligence (AI)-model-based diagnosis method of analyzing the vibration of the bridge bearing that supports the upper structure of a bridge. The proposed system establishes big data with the measured displacement of a bridge bearing and makes an AI-based prediction about the risk of bridge expansion joints. Replacing a bridge bearing makes it possible to manage the bridge displacement before and after construction and helps improve safety inspections and diagnosis methods. It is necessary to prepare a bridge with anomalies for the AI model training. For this reason, a bridge with a bridge bearing was simulated. In addition, a vehicle suitable for the bridge was simulated. The displacement data in normal and abnormal situations were collected, cleaned, and applied to the AI analysis model. The system was found to have over 90% accuracy of prediction about expansion joint faulting and damage.

1. Introduction

A bridge expansion joint sealing device has the function of accepting the expansion change made by temperature change, and the longitudinal and transverse displacement of the bridge’s upper structure by a variety of external forces. In addition, it smoothly takes drying shrinkage based on concrete age, and the movement and rotational behavior of the upper structure by live load. Therefore, the device plays a critical role in presenting the soundness of overall behavior after bridge construction. An expansion joint is key to the acceptance of bridge shrinkage and expansion. Generally, with the use of a bridge and the expansion of concrete pavement, a bridge expansion joint gap becomes narrow frequently. This phenomenon seems to be attributable to increasingly deteriorated bridges, rapidly changing weather, abnormal temperature change, traffic increase, wind, and long-term anchorage effect [1,2]. Expansion joints are damaged faster than other components of bridges and in the case of long-span bridges, premature failure is increasingly observed, resulting in high maintenance costs [3]. Damage to bridge expansion joint sealing devices give negatively influences bridges in three aspects [4]. First, if the temperature goes up fast, the girder end is destructed, and the main girder has limited movement longitudinally. Second, the road surface near the destroyed expansion joint has undulations, which increases the impact load caused by vehicle traffic. Consequently, the expansion joint is damaged faster. Third, the sealing performance of a bridge expansion joint sealing device becomes poor, and thus, it is highly likely to erode nearby structural steel and concrete.
Existing manual inspection methods for confirming damage to expansion joints are generally inefficient, cost high, and have difficulty providing accurate timely warnings of formal function and deterioration of expansion joints [5]. Therefore, it is necessary to develop a system to diagnose anomalies in bridge expansion joint sealing devices. In addition to damage, destruction of the bridge by corrosion may occur. In general, corrosion detection is the process of evaluating the type of corrosion involved in a particular environment and identifying important variables that affect propagation speed. It can be divided into corrosion inspection and corrosion monitoring [6]. Corrosion monitoring measures the damage of corrosion and the variables that accelerate the rate of corrosion over a long period, and it has received much attention as a means of ensuring the safe operation of structures in various industries [7]. The method of identifying structural systems is an important component of SHM, which evaluates the parameters of structural models [8]. Structural system identification applications established in the structural response can be grouped into static [9,10] and dynamic [11,12,13], and the Dynamic Structural System Identification technique is natural. It requires the dynamic characteristics of the structure (such as damping ratio, mode shape, frequency, etc.) [14,15]. Generally, modal analysis is used to determine the mechanical properties of infrastructure [16,17]. The required vibration response of a structure for modal analysis is usually obtained using accelerometers [18,19]. The four most common types of accelerometers are micro-electro-mechanical systems (MEMS) [20], differential capacitive [21], Piezoresistive [22], and piezoelectric [23] accelerometers are used, and piezoelectric accelerometers are the most traditionally used in SHM applications [24]. Infrastructure condition assessment throughout the life cycle of a bridge is essential in verifying serviceability and structural safety [25], thereby minimizing repair costs [26]. The Structure Health Monitoring (SHM) system can provide essential information about the current structural performance, status, and response of the infrastructure [27]. SHM technology draws attention to infrastructure owners and civil engineers [28]. As the SHM system has been developed recently, it is possible to test the operation performance of bridge expansion joints [29,30].
This study proposes an AI-based diagnosis method of measuring at all times the displacement of a bridge with a bridge bearing with the use of an Internet of Things (IoT) sensor and detecting anomalies of a bridge expansion joint based on the measured data. Bridge bearings have the function of delivering the load of the upper structure to the lower structure and absorbing the rotational behavior and expansion behavior of the upper structure. They move to absorb such behavior and then return to their home position. In other words, bridge bearings continue to move along with wind load or vehicle load, and the displacement between the upper structure and lower structure of a bridge occurs. Accordingly, bridge expansion joint sealing devices also move together. If these bridge expansion joint sealing devices have anomalies such as narrowness or faulting, the pattern of the displacement becomes different finely. Therefore, the proposed method tries to diagnose any anomaly of an expansion joint by using the AI classifier that makes it possible to classify and learn the data collected by the IoT sensor transmitting displacement values continuously in connection with the cloud. To assess the applicability and generality of the proposed method, this study simulated a bridge with abridge bearing and analyzed and evaluated the performance score of the Adaboost [31] and ANN [32] models in normal and abnormal situations.
This paper is composed of as follows. Section 1 describes the background and necessity of the proposed model as an introduction. Section 2 describes the studies related to expansion joint and bridge inspection and IoT displacement measuring devices. Section 3 describes the configuration diagram of the proposed model, wireless displacement measurement device, H/W implementation and precision measurement, measurement device experiment, and S/W design and implementation. Section 4 describes experimental device production and AI model implementation. Section 5 describes the experimental results of the proposed model.

2. Related Works

2.1. Expansion Joint and Bridge Inspection

In general, bridges are regularly inspected and maintained, and most bridge management systems in the past were managed mainly through visual inspection data-based information [33]. However, visual inspection is expensive due to manual work, takes a relatively long time, and has reliability problems because it depends on an inspector’s judgment [34]. To solve these problems, the SHM strategy is used. The strategy improved from the conventional inspection method using the availability of the sensor data-based measurement. With the development of such technologies as signal processing and transmission system and data collection, a SHM system provides new functions for infrastructure managers, inspectors, and bridge operators. Additionally, the system makes it possible to address a wide range of issues including evaluation of bridge state, quantization, prediction of residual effective life, and structural damage detection [35]. By using a variety of information in the system, it is possible to determine maintenance based on state, inspect designs, and make management after disasters [36,37]. Generally, the SHM system used recently has a transducer that is connected to a data collection and transmission system over a network. A transducer extracts analyzable functions with the uses of data-based technology and physical technology and supports decision-making. As smart transducers and low-cost and high-performance sensors are popularized, smart materials are made available. They can be used for dense [38,39] and sparse [40,41] networks. It is expected that the SHM system plays a more critical role in managing traffic infrastructure.

2.2. IoT Displacement Measurement Device

As the number of bridges gradually increases, it is necessary to understand the condition of bridges through intelligent monitoring using measurement data. This is because various types of data measured on bridges are very useful information for structural analysis to evaluate the safety of bridges. With the gradual rise in the number of bridges, intelligent monitoring to check the state of a bridge is of very importance. To make a bridge remain in its optimal state, it is necessary to achieve systematic maintenance and inspection. The measured displacement of a bridge is very useful information in structural analysis to assess bridge safety [42,43]. Since the monitoring system for displacement measurement is important in bridge maintenance and safety, precise sensors such as accelerometer [44], differential transformer [45], and Global Positioning System (GPS) are generally used to measure the displacement of a bridge. However, these devices have many limitations [46].
An accelerometer or differential transformer requires the additional installation of such equipment as a data logger with cable and power supplier. For this reason, it is inconvenient to apply it to a large structure or bridge, and the extra cost of monitoring the state of a bridge occurs. The measurement monitoring technique using an accelerometer determines a displacement value by integrating acceleration values twice simply so that it is an easy-to-access method. Nevertheless, it can cause unstable results in biased initial conditions [47]. The measurement technique using GPS has very low accuracy in measuring vertical displacement [48]. The measured displacement is very useful information when the structural state of a bridge is monitored to guarantee its structural safety. Most displacement measurement techniques are based on cables. These techniques are labor-intensive and require a lot of costs. Wireless measurement methods face many different restrictions to data transmission distance and have a lot of difficulties with data management and equipment maintenance [49].
Since this paper aims to evaluate the safety of bridges by comprehensively analyzing the displacements of bridge bearings or their surroundings and the vibrations applied to bridges by passing vehicles, it is necessary to apply a method of acquiring both precise displacement data and vibration data. However, conventional vibration sensors and accelerometers not only have difficulty with displacement measurement but are very inaccurate for long-term displacement. GPS devices do not meet the precision required by us. Therefore, by developing a new measuring device with an LVDT (Linear Variable Displacement Transducer) sensor attached, measuring the displacement at a very fast sampling interval, and reprocessing it as vibration data, these researchers have prepared a plan to acquire both displacement and vibration data. Most measuring devices are operated by wire. However, the wired method is inconvenient in an environment such as a bridge. The newly developed displacement measuring device is a wireless system and is convenient to use in the field. In addition, the measuring device used in this paper can basically be operated by supplying power and can operate for about 50 h without a power supply by applying a built-in battery.

3. Proposed Scheme

In this section, the structure of the proposed model and the wireless displacement measurement device are described. The configuration of the wireless displacement device and self-developed H/W are explained, and the test device configuration and design for S/W implementation are explained.

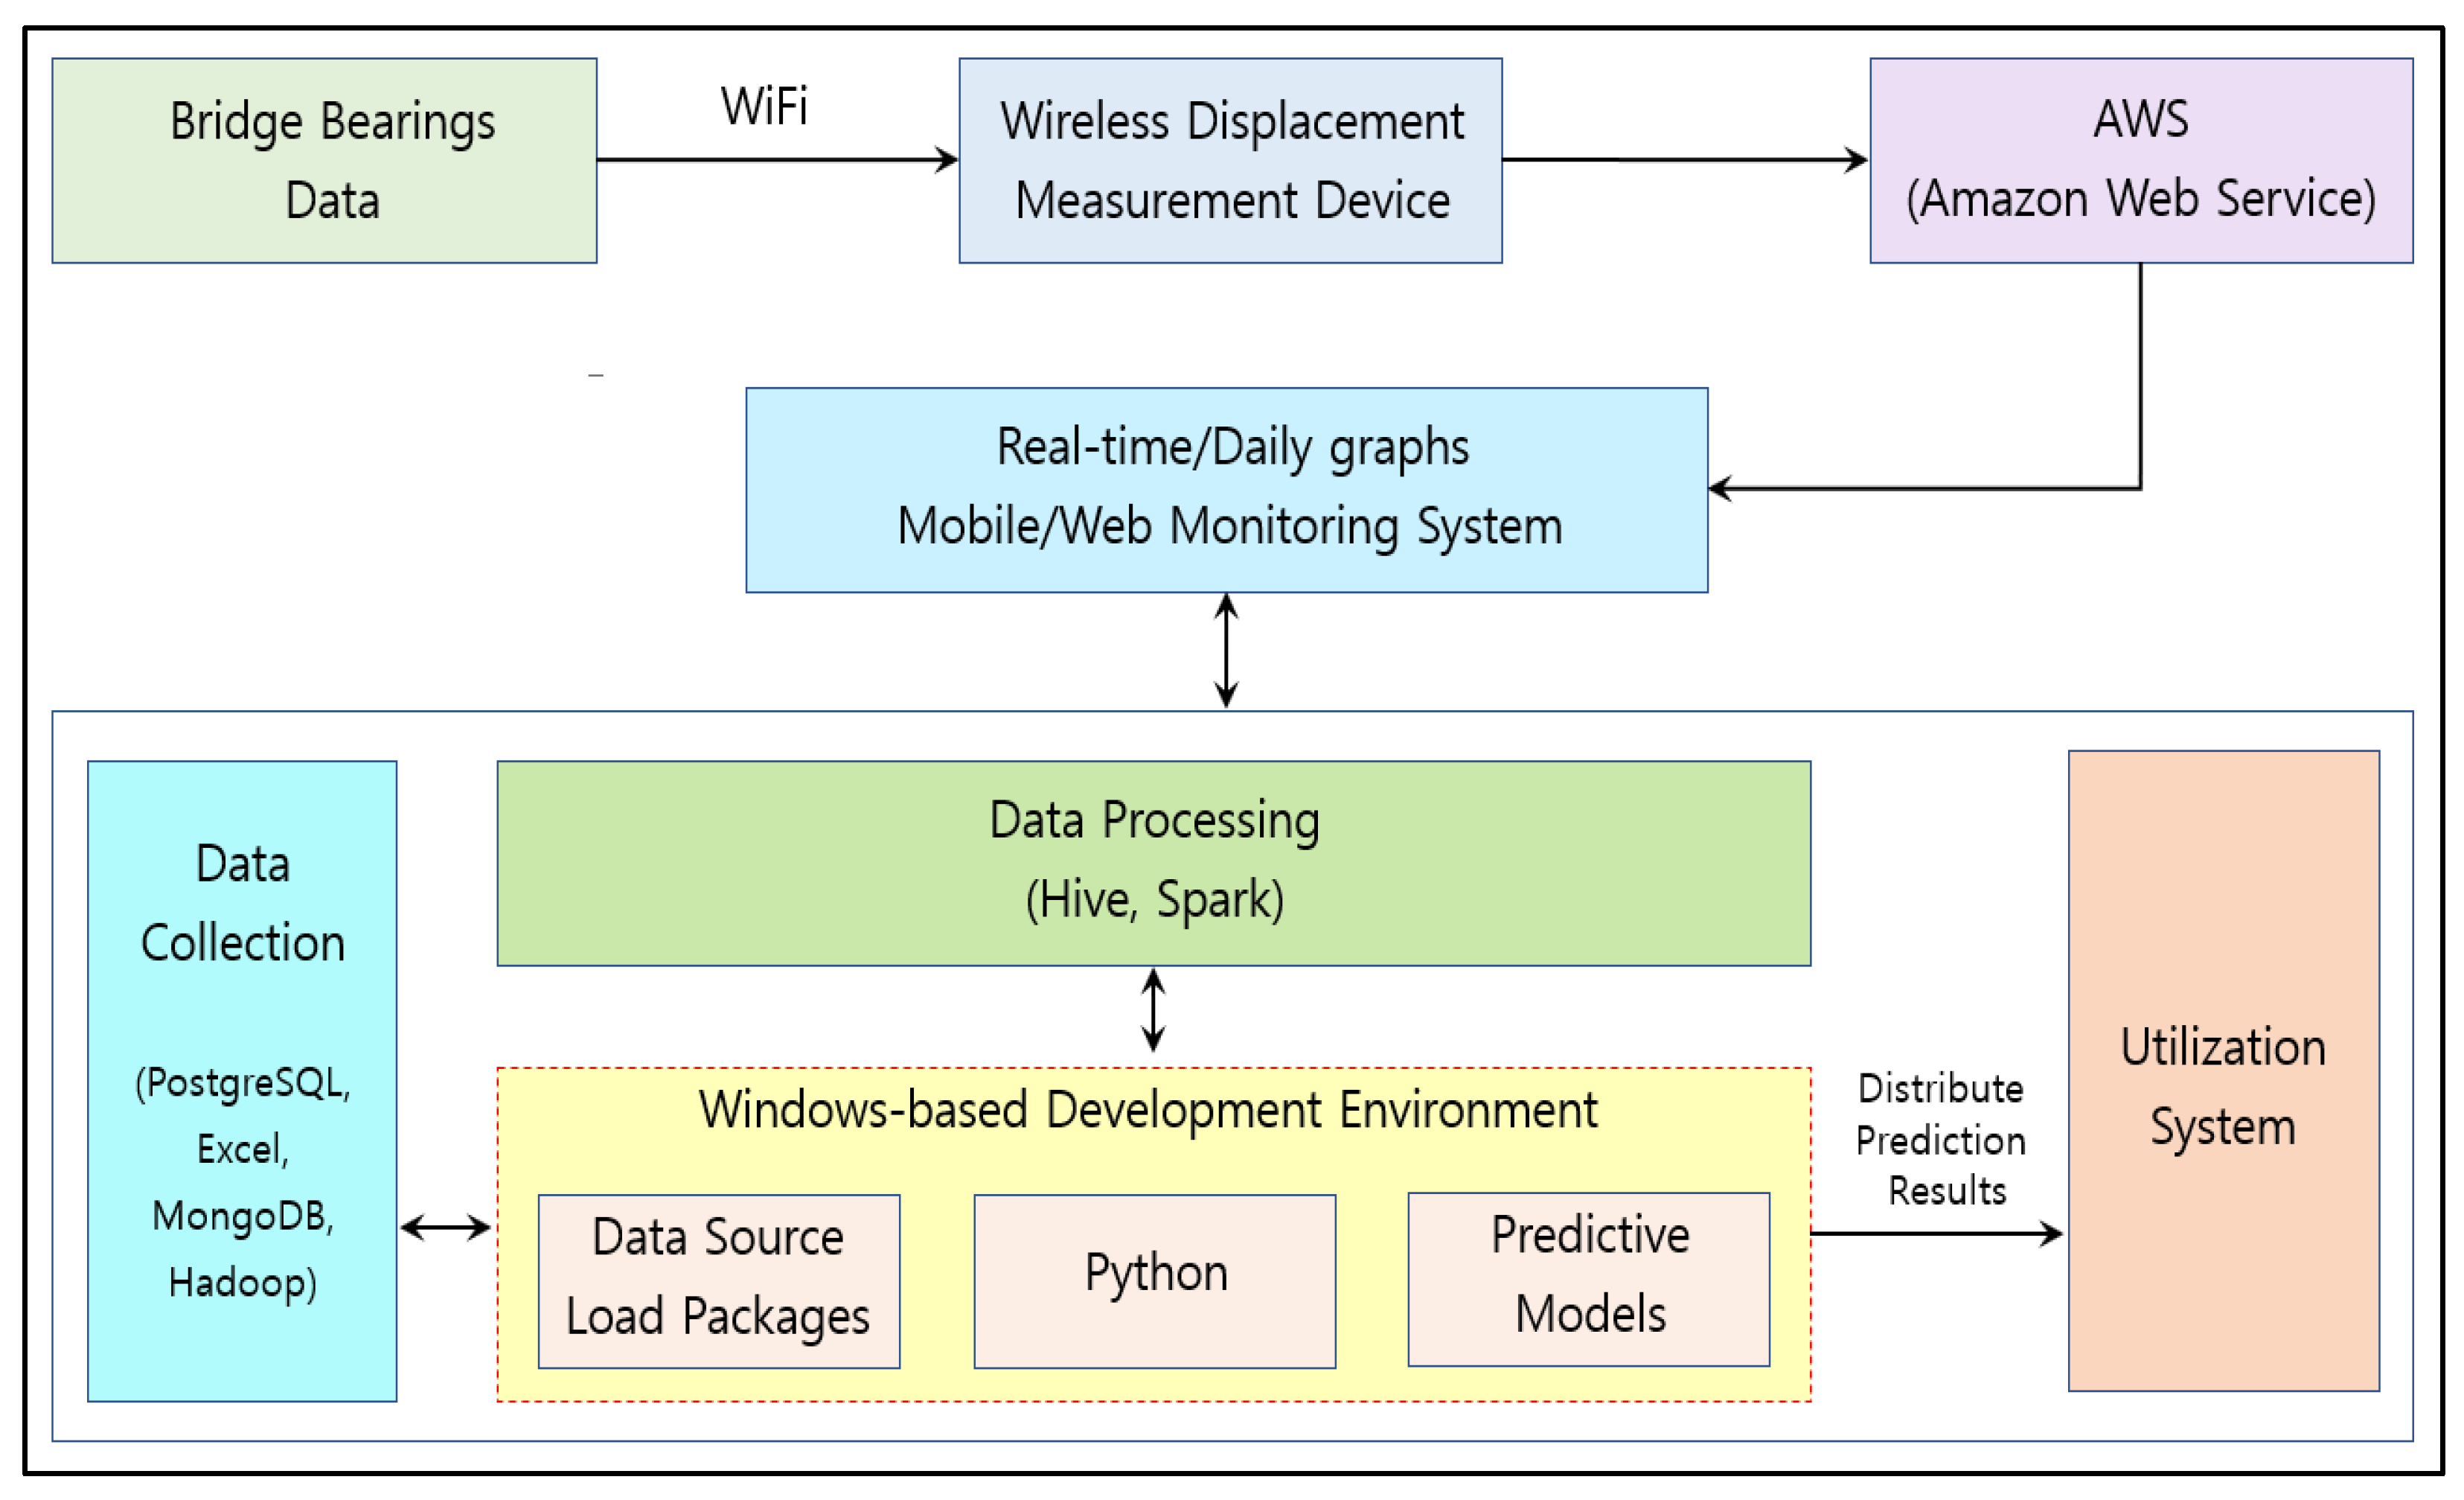
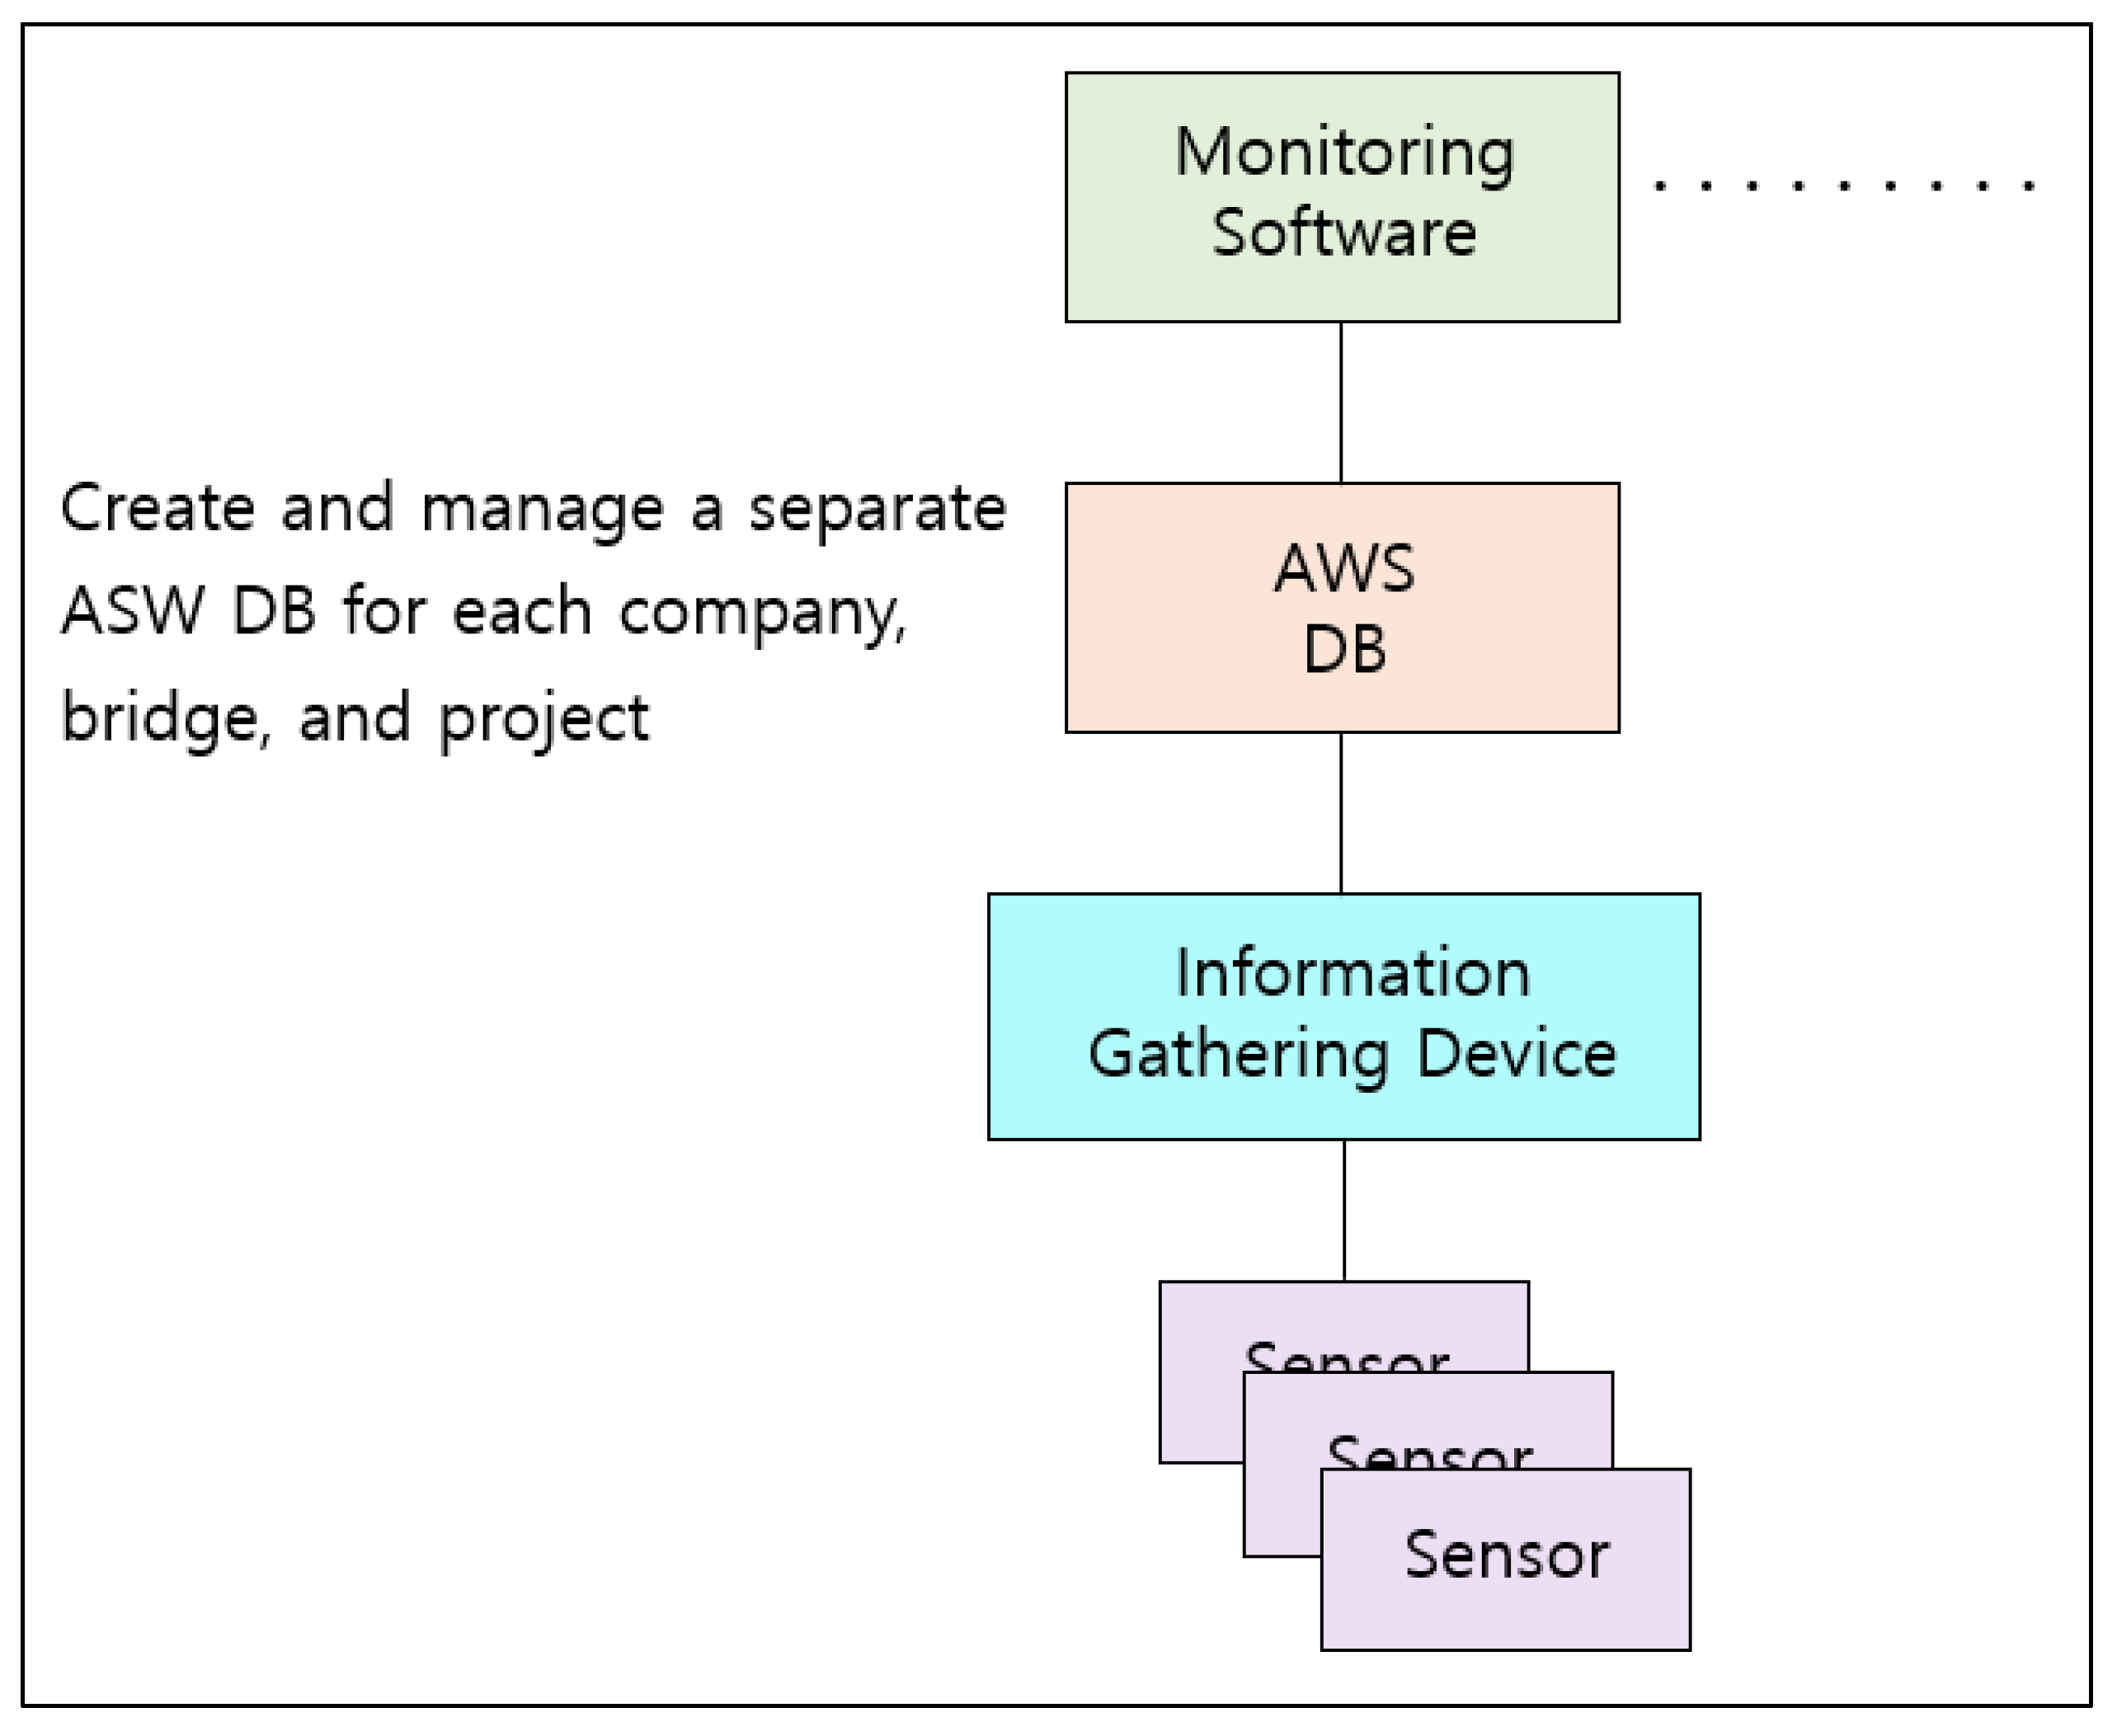
3.1. Architecture of the Proposed System

Figure 1 illustrates the architecture of the risk prediction system of expansion joints proposed in this study.
The proposed system predicts the risk of bridge expansion joints based on artificial intelligence by measuring the displacement of a bridge bearing and establishing big data. With the predicted risk, it is possible to operate and manage bridges. The basic concepts of the proposed system are to measure the displacement of bridge bearings to manage bridge safety, to monitor bridge bearings at all times, to establish big data, and thereby to predict the risk of bridge expansion joints based on AI. With the use of the collected data, it is possible to manage the displacement of a bridge bearing before and after the replacement of the device, to help improve a safety inspection and diagnosis method for bridge bearings, and to predict the risk of expansion joints to prevent accidents.

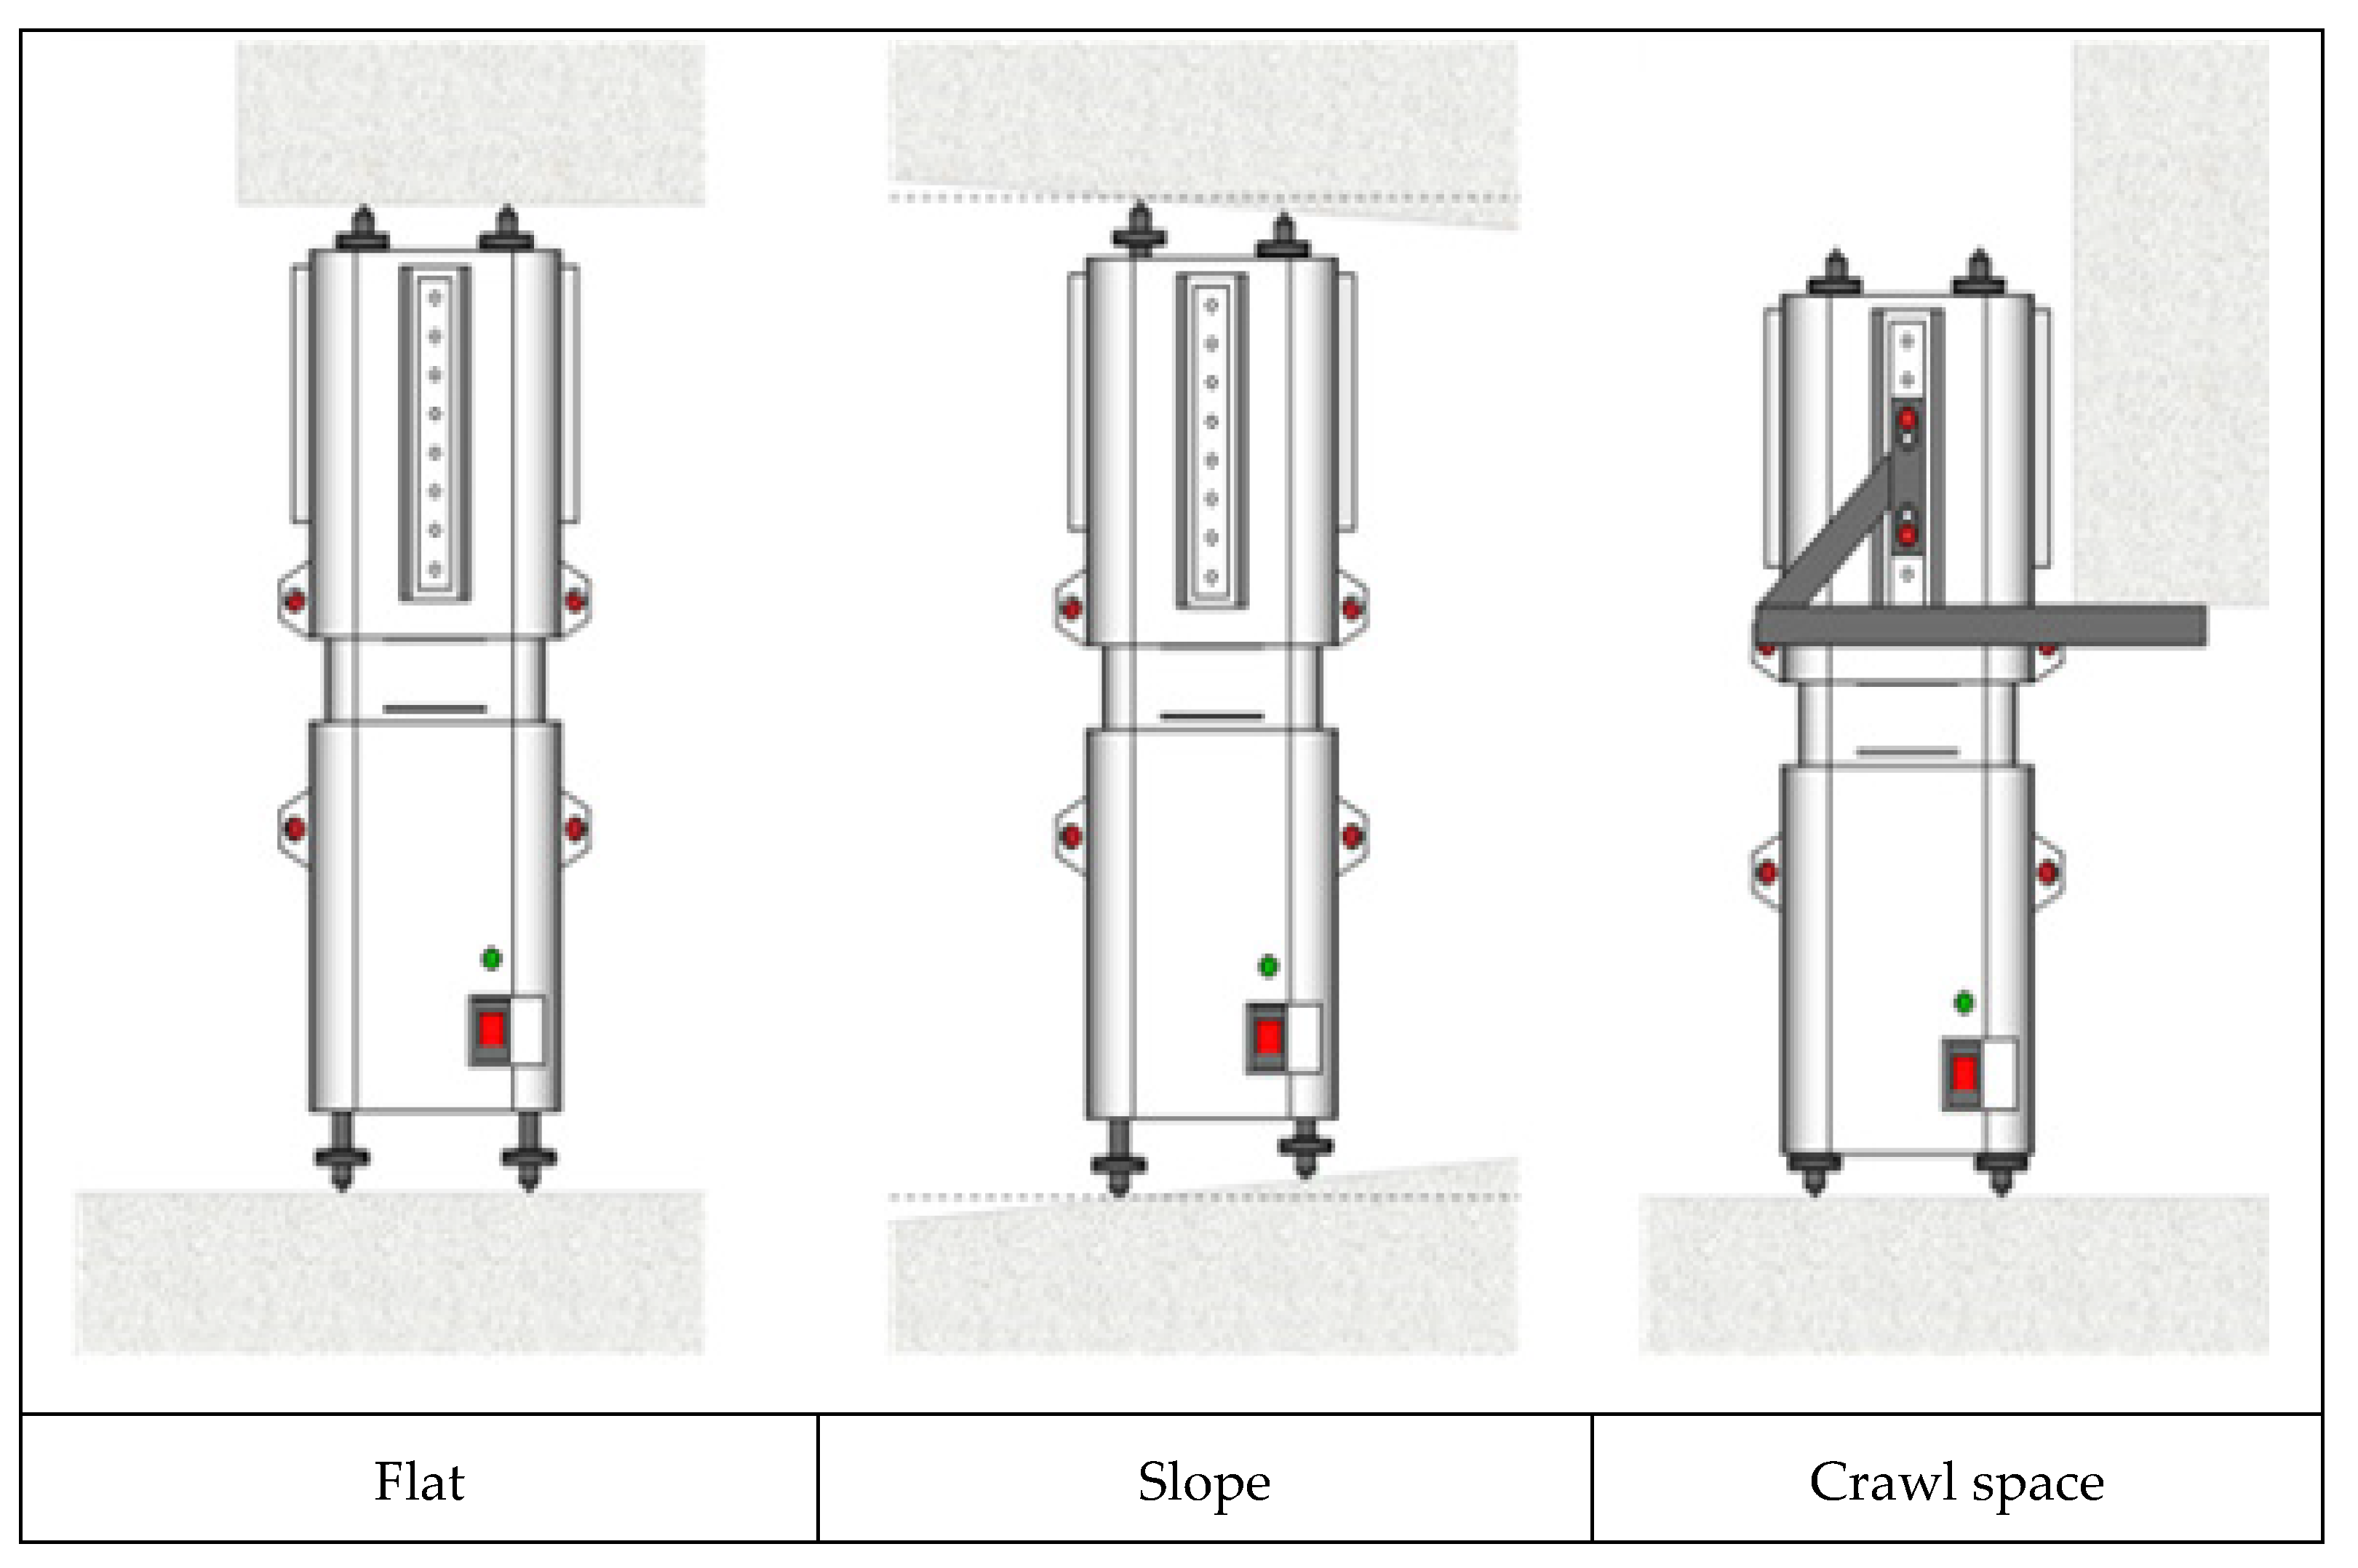
3.2. Wireless Displacement Measurement Device

3.2.1. Design of Wireless Displacement Measurement Device

Figure 2 illustrates the electrical and electronic device configuration.
To measure the relative range from the bridge pier to the bridge deck under the control of a particular bridge bearing, this study tested the acceleration sensor and vibration sensor by NCD.io and the position sensor by Miran as bridge bearings. Based on the test results, a commercial sensor was selected. Conventionally, up to eight measuring devices are wired with one control box. Each measuring device measures the displacement with the pulley System and Time of Flight (TOF) Laser displacement sensor. That has problems with field use and precision of measuring devices. Wired I2C (Inter-Integrated Circuit) communications do not work normally when a cable has a length of over 5 M because the voltage is unstable. If eight measuring devices are operated, it is required to use a very high-capacity battery and it is not easy to transport the device’s fieldwork. ToF Laser displacement sensor has limitations to precision (about 1 mm) and measurement range. To increase the precision of the sensor, Pulley System is used. As a result, its precision came to improve max. five times (0.2 mm). However, there is a difficulty with more improvement. Pulley System has a limited measurement range of 20 mm. In terms of user convenience, there is a lack of installation flexibility, since it has no display part to check external operation and has a short expansion range of its fixed arms.
A point to be considered in designing a conventional measuring device is an independently operating wireless measuring device. For the convenience of assembly and disassembly, two units of the main body are separated. In addition, in design, the parts attached directly to the lower main body are separated from the parts attached to the back panel of the lower main body. The parts attached to the lower main body include Linear Sensor, LED Display, switch, temperature/humidity sensor, and battery. The parts to be attached to the back panel of the lower main body include a control board, power board, ADC board, wireless LAN, and USB Port for data processing. For the convenience of operation, the arms for the fixture are expandable, so that their height is controllable in line with installation conditions. It is possible to control levels with the use of the expansion function of the arms for the fixture. When the device is powered on, it sends data to Amazon Web Services (AWS) automatically. The measuring device used for a bridge was designed to have a sealing structure in consideration and waterproof and dustproof features.
Sealing rings are applied to the area between the upper main body and the lower main body to block any inflow of water and scattered dust. For the convenience of transport and the minimization of mechanical friction, the length and width sizes of housing are reduced. Measuring devices were designed each in round and square forms. For the convenience of making, the square form was selected. Figure 3 illustrates the outside view of the wireless displacement measurement device for expansion joints.
The size of the proposed expansion joint is reduced by 25% based on the previously used unit, making it lighter. Extending the height according to the actual bridge bearings is also possible. The minimum measurement range using the bracket is 110 mm, and in this case, there is a reduction effect of about 30% compared to the existing device. The measurement range of the measuring instrument is 40 mm.

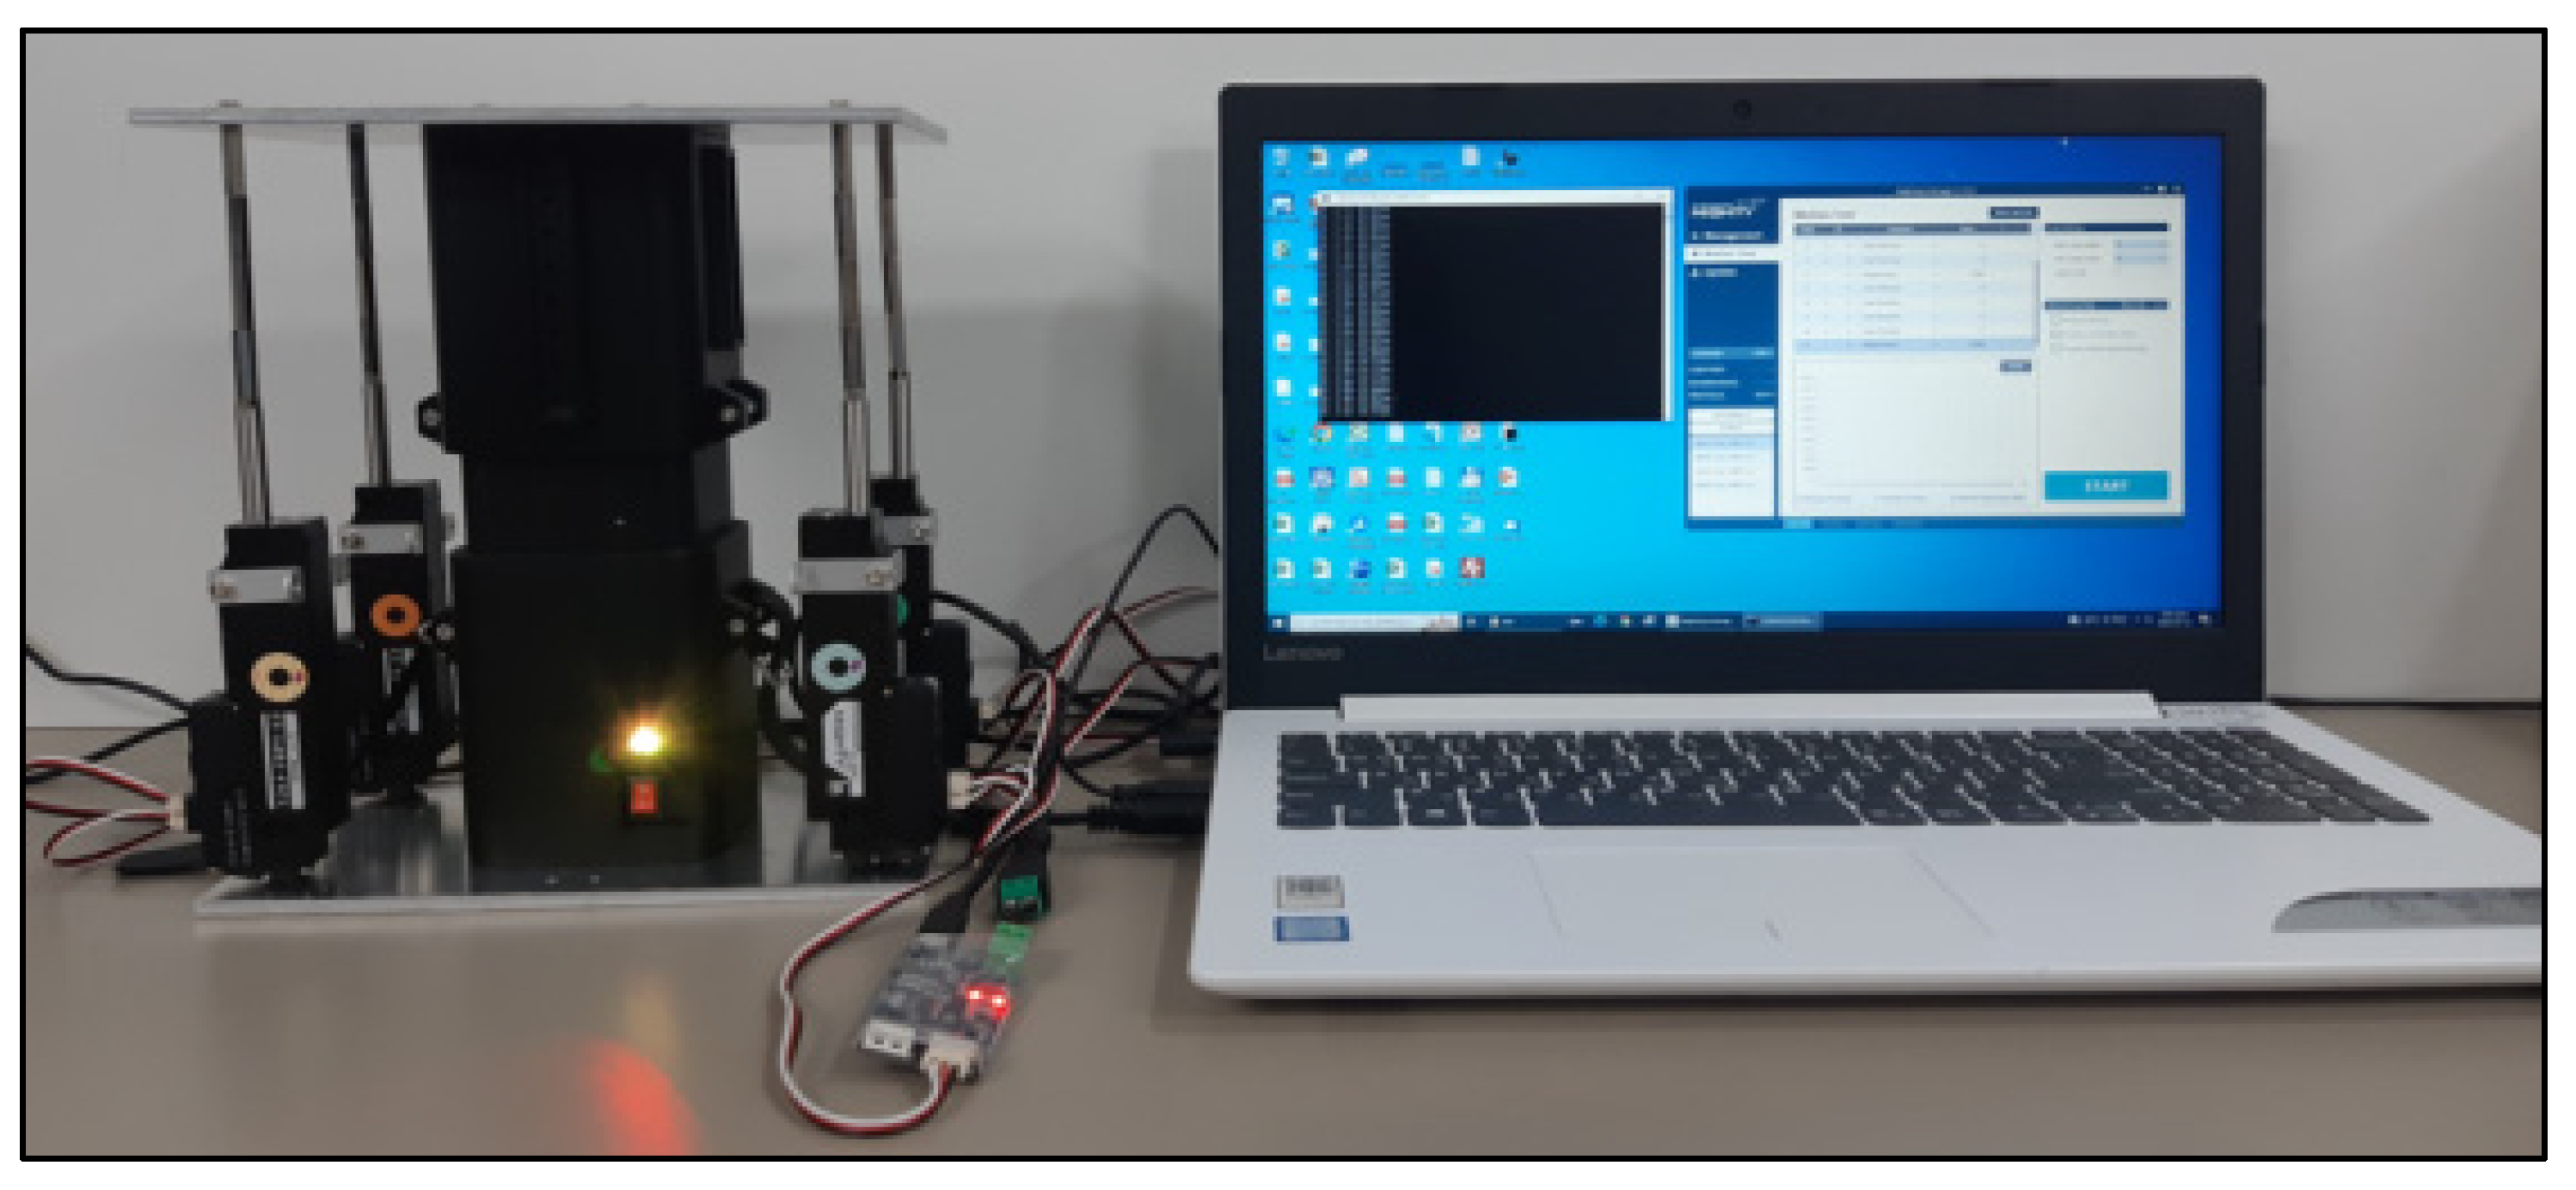
3.2.2. H/W Implementation and Precision Measurement

The measuring device used in this paper was developed. More precisely, existing commercial parts were selected, and the housing was designed and manufactured to best acquire the data required for the bridge. The main parts that are made up of the measuring device are shown in Table 1 below. The internal composition is illustrated in Figure 4. The LVDT, which is a key component, has a total measurement range of 50 mm, and since the measured value is a method of transmitting voltage as an analog signal, it is converted into a digital value using an Analog to Digital Converter (ADC).
Table 1 shows the list of measuring device materials and parts.
Figure 5 shows the measurement range of the measuring device, which is determined by the range of the maximum relaxation and compression states.
As shown in Figure 6, the measuring device is designed to be easily installed in various situations around the bridge brace. In general, installation can be simply conducted by compressing the measuring device (in the middle or below) and releasing the compression at the place where you want to install it, and you can adjust the height of the Fixing Foot to correspond to the height interval. In addition, it can be installed horizontally by adjusting the height of each fixing foot in an inclined place, and it can be installed using a fixing bracket in a crawl space.
According to the independent test on the repeatability of the measuring device, it is required to obtain the result within the target error of 0.1 mm. The precision should be within 0.1 mm. The repeatability of the displacement device should be tested and verified. Therefore, the displacement measurement device to measure a displacement value when the target object has the initial state (lower displacement)-displacement occurrence (upper displacement)-initial state (lower displacement) change was tested to see how much its displayed reference displacement and displacement occurrence value are constant. In this way, the reliability of the repeatability of the measuring device was evaluated. In test evaluation criteria, the performance criteria of repeatability are that the same value display rate within the error of 0.1 mm should be over 90% and that the count of test repetition should be over 1000 times.
To test the repeatability of the improved displacement measurement device, this study generated a certain type of displacement repeatedly and let the device measure the displacement value. Accordingly, a test device to generate the displacement repeatedly was made independently. The test section was 10 mm–34 mm out of the measuring device’s working range (0~400 mm). This section was divided into units of 2 mm, and repeated measurement was carried out more than 100 times. Regarding the sampling interval and the number of data acquired in each position, the sampling interval of the measuring device was 1 s. The displacement can be measured in the course of moving from lower displacement and upper displacement to lower displacement. For this reason, out of a total of seven measured upper or lower displacement values, three in the middle of the time series were used as effective values. In the way of measurement, all the measured data are saved in AWS, and the S/W for measurement data display saves effective values only in a raw data file format. The test device is capable of generating the designated displacement (upper displacement and lower displacement) automatically and repeatedly. After the measuring device is installed and fixed, it is possible to control four actuators precisely, generate a certain type of displacement repeatedly, and thereby acquire measured data. Figure 7 presents the isometric view and front view of the test device.
Figure 8 illustrates the setting of the test tools. As shown in the figure, the communications and power of the test device’s actuator and the control PC are connected. When the measuring device is installed and fixed, and then is powered on, it is possible to check the measurement mode through red/green light flickering. The test procedure is as follows: the test section of 10~34 mm is divided into units of 2 mm, and reference displacement (lower displacement) and occurrence displacement (upper displacement) are measured repeatedly more than 100 times.
Each test unit has the same test procedure. Therefore, the test procedure of the unit section of 32~34 mm only is described here. The communications and power of the test device’s actuator and the control PC are connected. After the measuring device is installed and fixed, it is powered on. When the data display S/W is turned ON, data are displayed at an interval of 1 s. Figure 9 presents the display of the measured data.
Table 2 shows the repeated test results of the measuring device. As for the controller S/W setting, an actuator value is adjusted and obtained until the low measurement value (Low value 32 mm) is displayed in the data display S/W. An actuator value is adjusted and obtained until the high measurement value (High value 34 mm) is displayed in the data display. The motion test of Actuator Control S/W was set with the obtained low and high actuator values, and the delay time between the upper displacement and upper displacement was set to 7 s. As a result, the repeated test count was 1250 times, the minimum error was 0.05 mm, the maximum error was 0.10 mm, and the average error was 0.074 mm.
In general, the amount of expansion of an expansion joint is much larger than 34 mm. However, the displacement measured in this paper is the displacement in the direction of gravity, not the amount of expansion and contraction of the expansion joint, and the size is usually within the range of 5 mm or less. The gravitational displacement of the expansion joint means the level difference, and if the value is more than 5 mm, it causes an accident or causes a great inconvenience to passing vehicles, so the set value of 34 mm is a very sufficient value.
As shown in Figure 8, an automatic repetitive measurement experiment device with four actuators that can be precisely controlled was manufactured, and the measurement range of 10 mm to 34 mm, which is very frequently used among the total measurement range of 34 mm of the measurement device, was divided into 2 mm units to conduct a repeated measurement experiment. It was conducted more than 100 times for each section to increase reliability. The resulting values are shown in Table 1, and the error represents the error in repeat accuracy, indicating the target repeat accuracy of 0.1 mm or less. In Case 1 of Table 2, the first measured value was 10 mm, and a displacement of 2 mm (measuring device display value 12 mm) was repeated 118 times in succession. During 118 repeated measurements, a displacement of 10 mm occurred among the displayed values. The minimum value by the measuring device is 10.00 mm, the maximum value is 10.05 mm, and the average of all 118 measured values is 10.02 mm. Similarly, among the values displayed by the measuring device for a displacement of 12 mm during 118 repeated measurements, the minimum value was 11.99 mm, and the maximum value was 12.04 mm, which means that the average value of all 118 measurement values was 12.01 mm. Moreover, the other cases in Table 2 can be interpreted with the same concept.

3.3. S/W Implementation and Design

Monitoring S/W searches for real-time sensor data and shows the results to a user. Mostly, it monitors the sensor data of temperature, humidity, and illuminance. With the improvement in the performance of smartphones, the monitoring software supports not only PC or laptops but smartphones. As cloud service is developed, it is not unusual to see that the monitoring system processes massive sensor data smoothly in interaction with cloud service. To monitor the data of the sensors installed in a bridge, it is required to not only search for sensor data in real-time but acquire information on each sensor’s position in the bridge for users’ easy recognition. It costs a lot to establish a system, and it is difficult to manage a complex system. For this reason, such a system was applied to a large bridge. The monitoring S/W proposed in this study is a simple system, supporting infinite extension. In addition, based on a virtual bridge, it is possible to make easy management. Therefore, the monitoring S/W applies to a small bridge thanks to its low cost and high efficiency.

Design

The information sent by the sensors installed and operated in a bridge is displayed. The received data are corrected and displayed by an information-gathering device. The software was developed in Unity to run on Windows, Android, and iOS. As for database design, AWS NoSQL DynamoDB was selected for efficient management. It is possible to pay per use with no separate establishment of a server. A service with constant performance is provided at all times regardless of size. Figure 10 presents the design of the basic concept of the software.
Conventional software is complicated, so it is hard to use it on a field site. Therefore, the developed software provides an easy-to-use display in both PC and mobile environments. As for wireless networks, the software supports commercial mobile telecommunications networks (LTE, 5 G, etc.). Data can be collected from the wireless measuring device and other IoT sensors. In addition, the communication interface enabled IOT data to be received and processed according to rules, and data was processed by connecting to AWS DynamoDB in unity. General users who want to use the technology related to this paper do not need to know deeply about how data is stored and processed in AWS. This is because users can view bridge safety information by accessing the separate monitoring software developed by us. However, access and viewing rights must be granted. Among the techniques in this paper, storing and processing data in AWS is just one way to configure a database, and it is used after it is judged most appropriate for the research. For reference, the AWS used for this study is contracted for 24 h continuous use, unlimited capacity, and payment based on usage. Once future storage needs are identified, it is possible to reduce costs by changing contracts based on storage capacity.

4. Test Device Making

To predict the faulting of a bridge expansion joint with the use of displacement big data and AI of an IoT displacement measurement device, it is required to analyze the characteristics of the displacement of the bridge bearing, which occurs due to the live load of vehicles in diverse conditions. A simulated bridge (lab-like environment) was established as the test device to acquire the displacement data of the bridge bearing on which live load (vehicle) is imposed in diverse conditions of an expansion joint. It was applied to the development and verification of the AI prediction model, factors, and filtering algorithm. There are about 37,999 bridges in South Korea. To analyze expansion joints as a main subject, this study analyzed the most critical and main features of bridges, which are the number of spans, maximum span length, total width, and design load. The criteria of bridges with high distribution were applied to the design of the simulated bridge. In terms of the distribution of the number of spans that main bridges have in the nation, bridges with five spans or less account for about 84%, bridges with 6 to 10 spans 12%, and bridges with 11 spans or more 4%. Regarding the distribution of maximum span length, the rate of bridges with a span length of 30 m is the highest, and bridges with a span length of 30 m or less account for 70%. As for the distribution of total width, bridges with a total width of less than 12 m account for about 47%, bridges with total widths of 12 m to 20 m about 32% and bridges with a total width of 20 m or less about 79%. Regarding the distribution of design load, bridges with a design load of DB-24 account for about 84%. In consideration of the main features of bridges in the nation, the real bridge is to be considered as a standard and the simulated bridge has the following sizes as in Table 3.
In terms of IoT displacement function, it is possible to make horizontal displacement and vertical displacement artificially. In a simulated bridge bearing, the modulus of elasticity is changeable. The simulated bridge bearing was designed in consideration of the width for the concurrent running of vehicles and the attachment of diverse sensors.

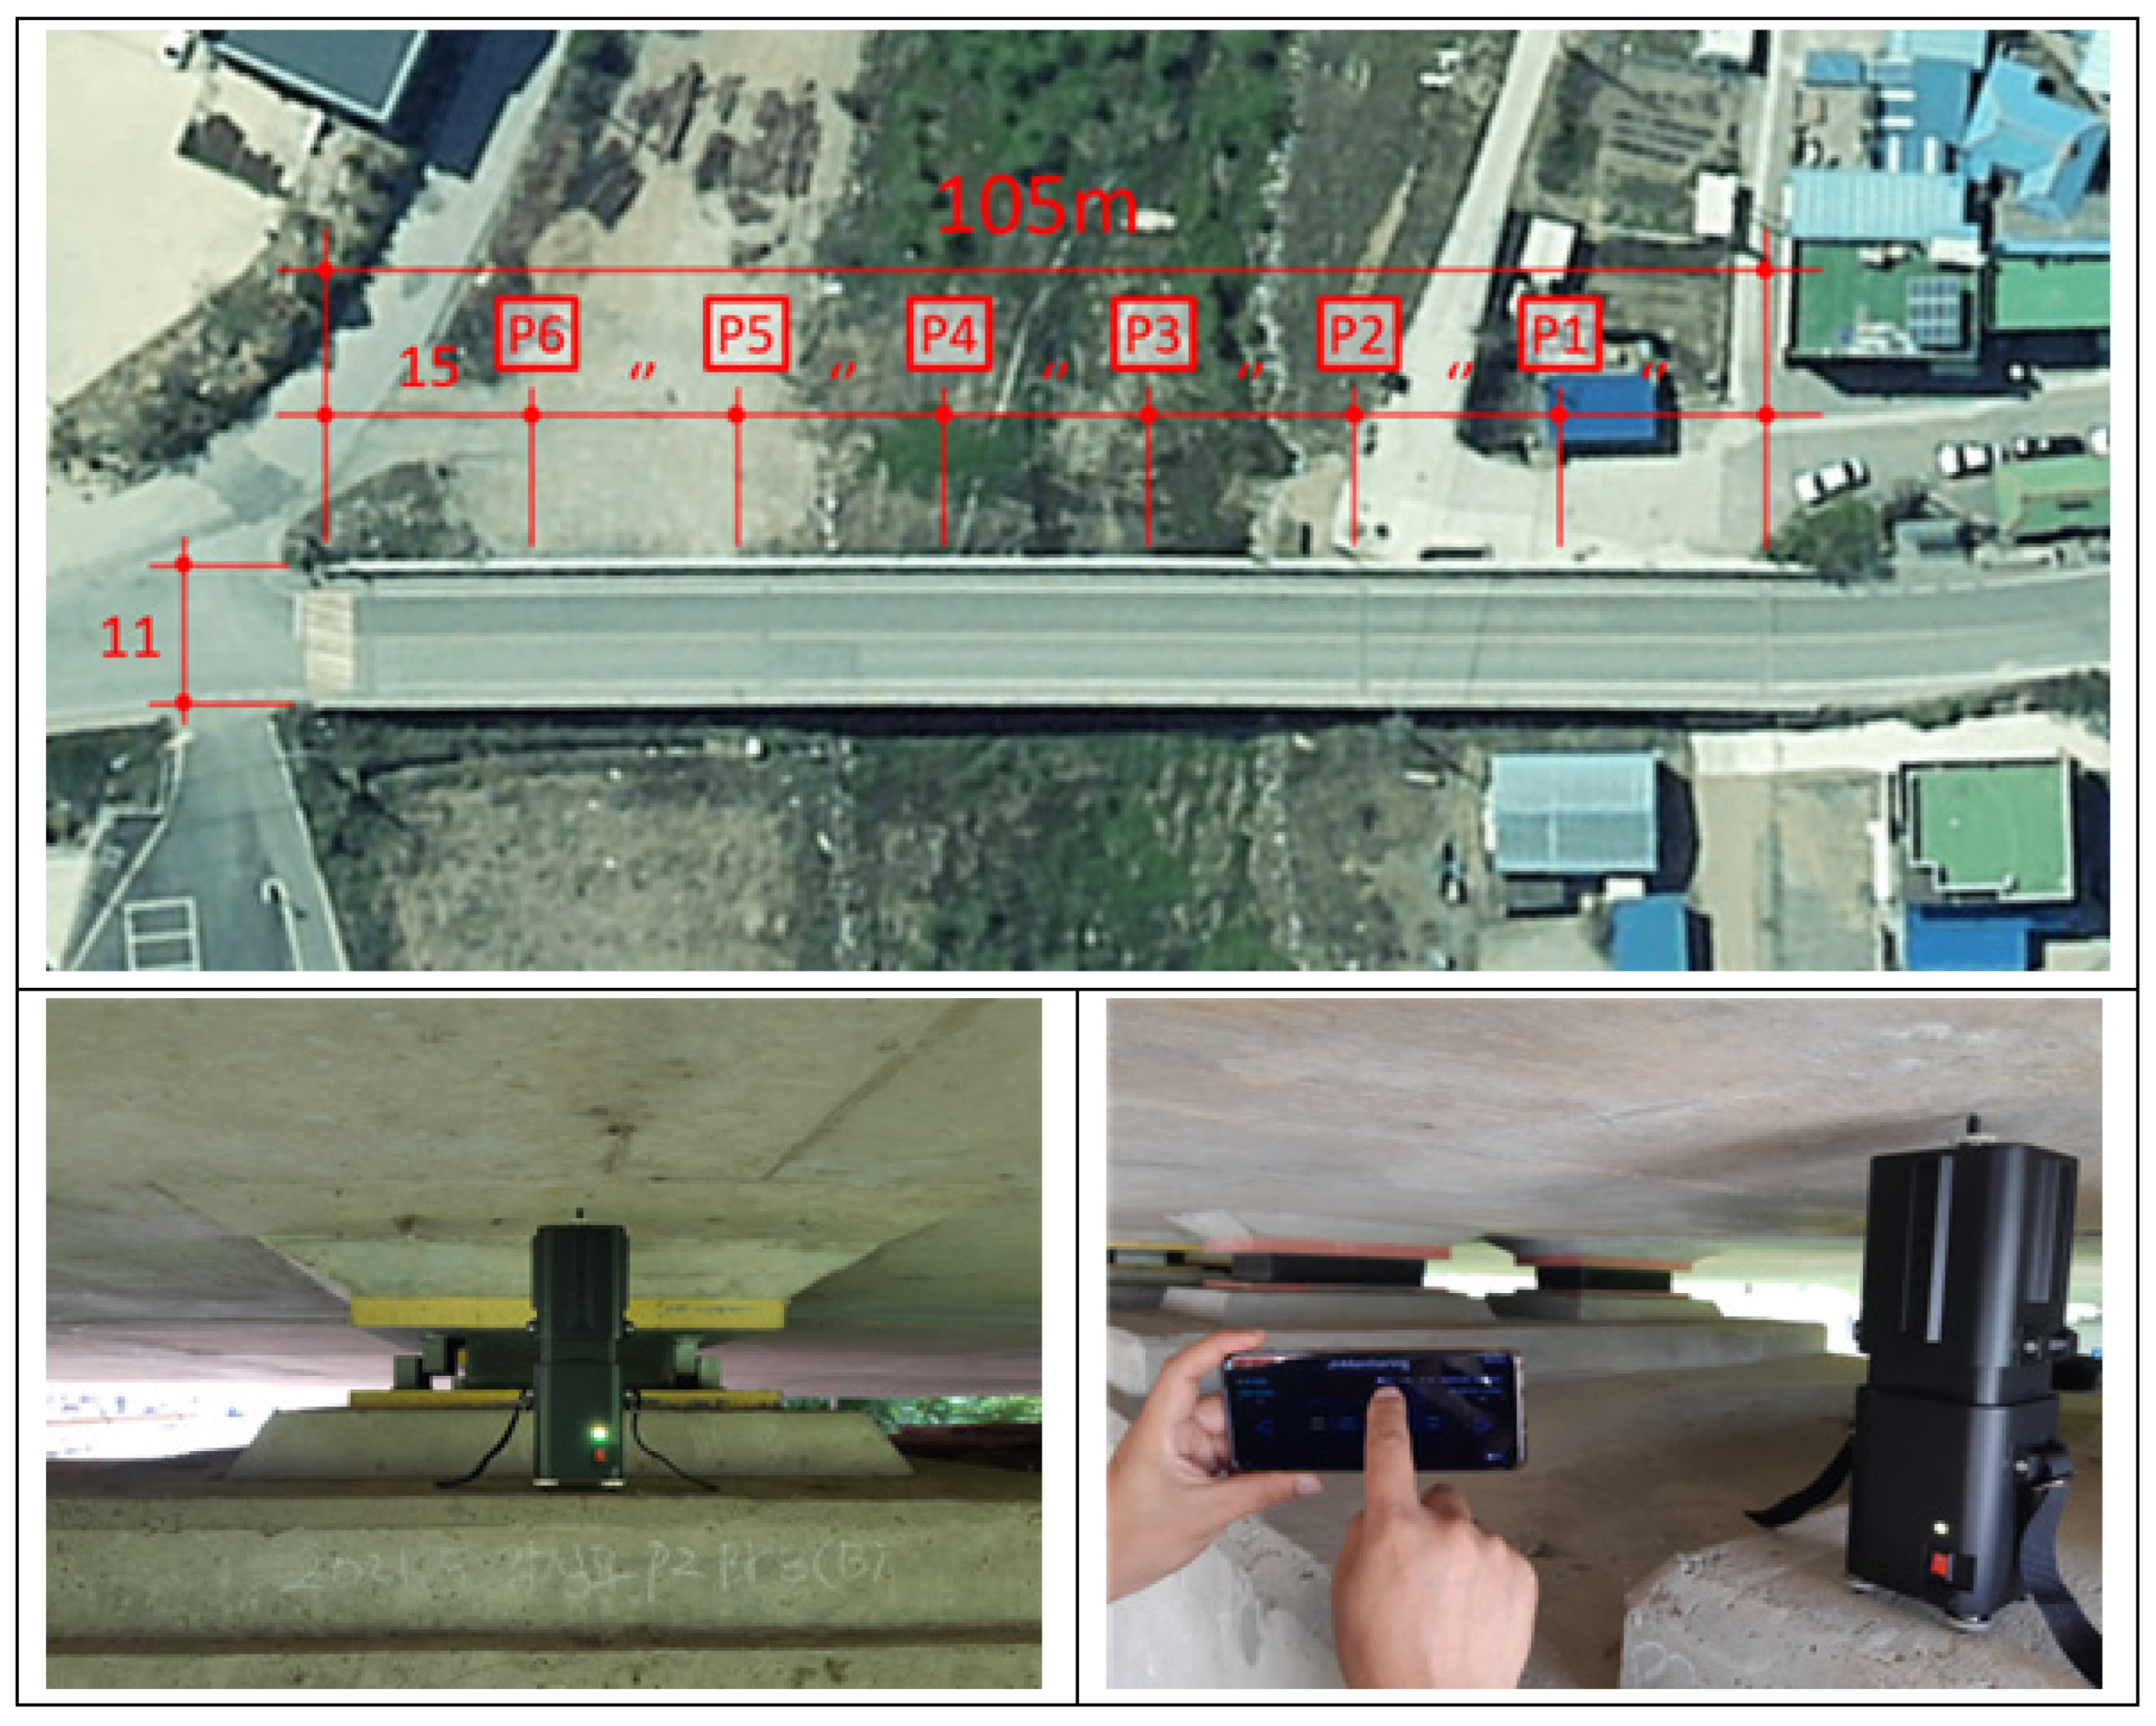
4.1. Experiment of the Simulated Bridge

Figure 11 presents the simulated vehicles used in the simulation. Vehicles were produced targeting trucks, buses, and general passenger cars.
Figure 12 shows a simulated bridge manufactured. The functional goal of the simulated bridge is to artificially generate horizontal and vertical displacements, and the simulated bridge was designed so that the modulus of elasticity can be changed in consideration of the modulus of elasticity of the bridge bearing. In addition, it was manufactured in a shape that can attach various sensors to the bridge and a size that allows more than two simulated vehicles to move simultaneously.
To acquire data, it is impossible to impose the relative displacement on the upper structure and lower structure of the real bridge discretionally. The bridge simulated based on the data of a standard real bridge was used to acquire displacement data in diverse conditions (faulting and live load). The data cleansing technology of analyzing the data acquired in the simulated bridge experiment and processing them in line with a purpose was developed. The data type for AI training was identified. The hypothesis for the experiment was that a bridge bearing is installed in between the lower structure (pier or abutment) and the upper structure (deck) just as in the real bridge. The simulated bridge, such as the real bridge, works as a single-type bridge. As for the behavior for the live load of the single-type bridge, it is possible to make analysis and identification by applying main factors to correct a difference to an other-type bridge with a similar structure. Main factors are not used in a quantitative calculation but are used for recognizing, identifying, and analyzing a specific-type bridge in an AI algorithm.
Figure 13 shows the test of the proposed device applied to an actual bridge. The actual bridge length was 105 m, the bridge width was 11 m, and six proposed bridge bearings were installed at 15 m intervals and tested. P1 ~ P6 shows the location of the proposed Bridge Bearings.

4.2. Factor

The Factor is the reduction ratio of the simulated bridge and the real bridge (set as a standard). The reduction ratio of the simulated bridge span is 1/30, the reduction ratio of the simulated vehicle wheelbase is 1/30, the reduction ratio of the simulated vehicle wheel is 1/14, the reduction ratio of the simulated vehicle weight is 1/1200, the reduction ratio of the simulated vehicle axial load is 1/1200, and the reduction ratio of the simulated vehicle speed is 1/25. To obtain the predictive value with high accuracy when the AI analysis algorithm learned with the test data in the simulated bridge is applied to a specific-type bridge (real bridge), the main factors were applied. Faulting and gap factors can be defined in consideration of the reduction ratio of the real vehicle wheel and the simulated vehicle wheel. The reduction ratio of the real bridge and the simulated bridge is 1/30, and the reduction ratio of the real vehicle wheel and the simulated vehicle wheel is 1/14. Therefore, each of the faulting and gap factors is about 0.46. Table 4 shows an example of the application of faulting and gap factors.
As for the time of the displacement occurrence by live load (vehicle), the time from the start of the initial displacement by live load (vehicle) to its end is determined by the wheelbase reduction ratio ‘1/30’ and the vehicle speed reduction ratio ‘1/25’. The displacement occurrence time factor is about 0.83 (25/30). Table 5 presents an example of the application of the displacement occurrence time factor.
As for the amount of displacement by live load (vehicle), the influential points on the displacement by the live load are vehicle speed, vehicle weight (axial load), the elastic modulus of the elastic body of a bridge bearing, and the number of bridge bearings. The speed reduction ratio is 1/25, and the vehicle weight reduction ratio is 1/1200. There are multiple cases for the elastic modulus of a bridge bearing and the number of bridge bearings. Therefore, it is efficient to access bridge bearings from the perspective of big data in which a variety of real field data are analyzed comprehensively. Table 6 shows factor information.

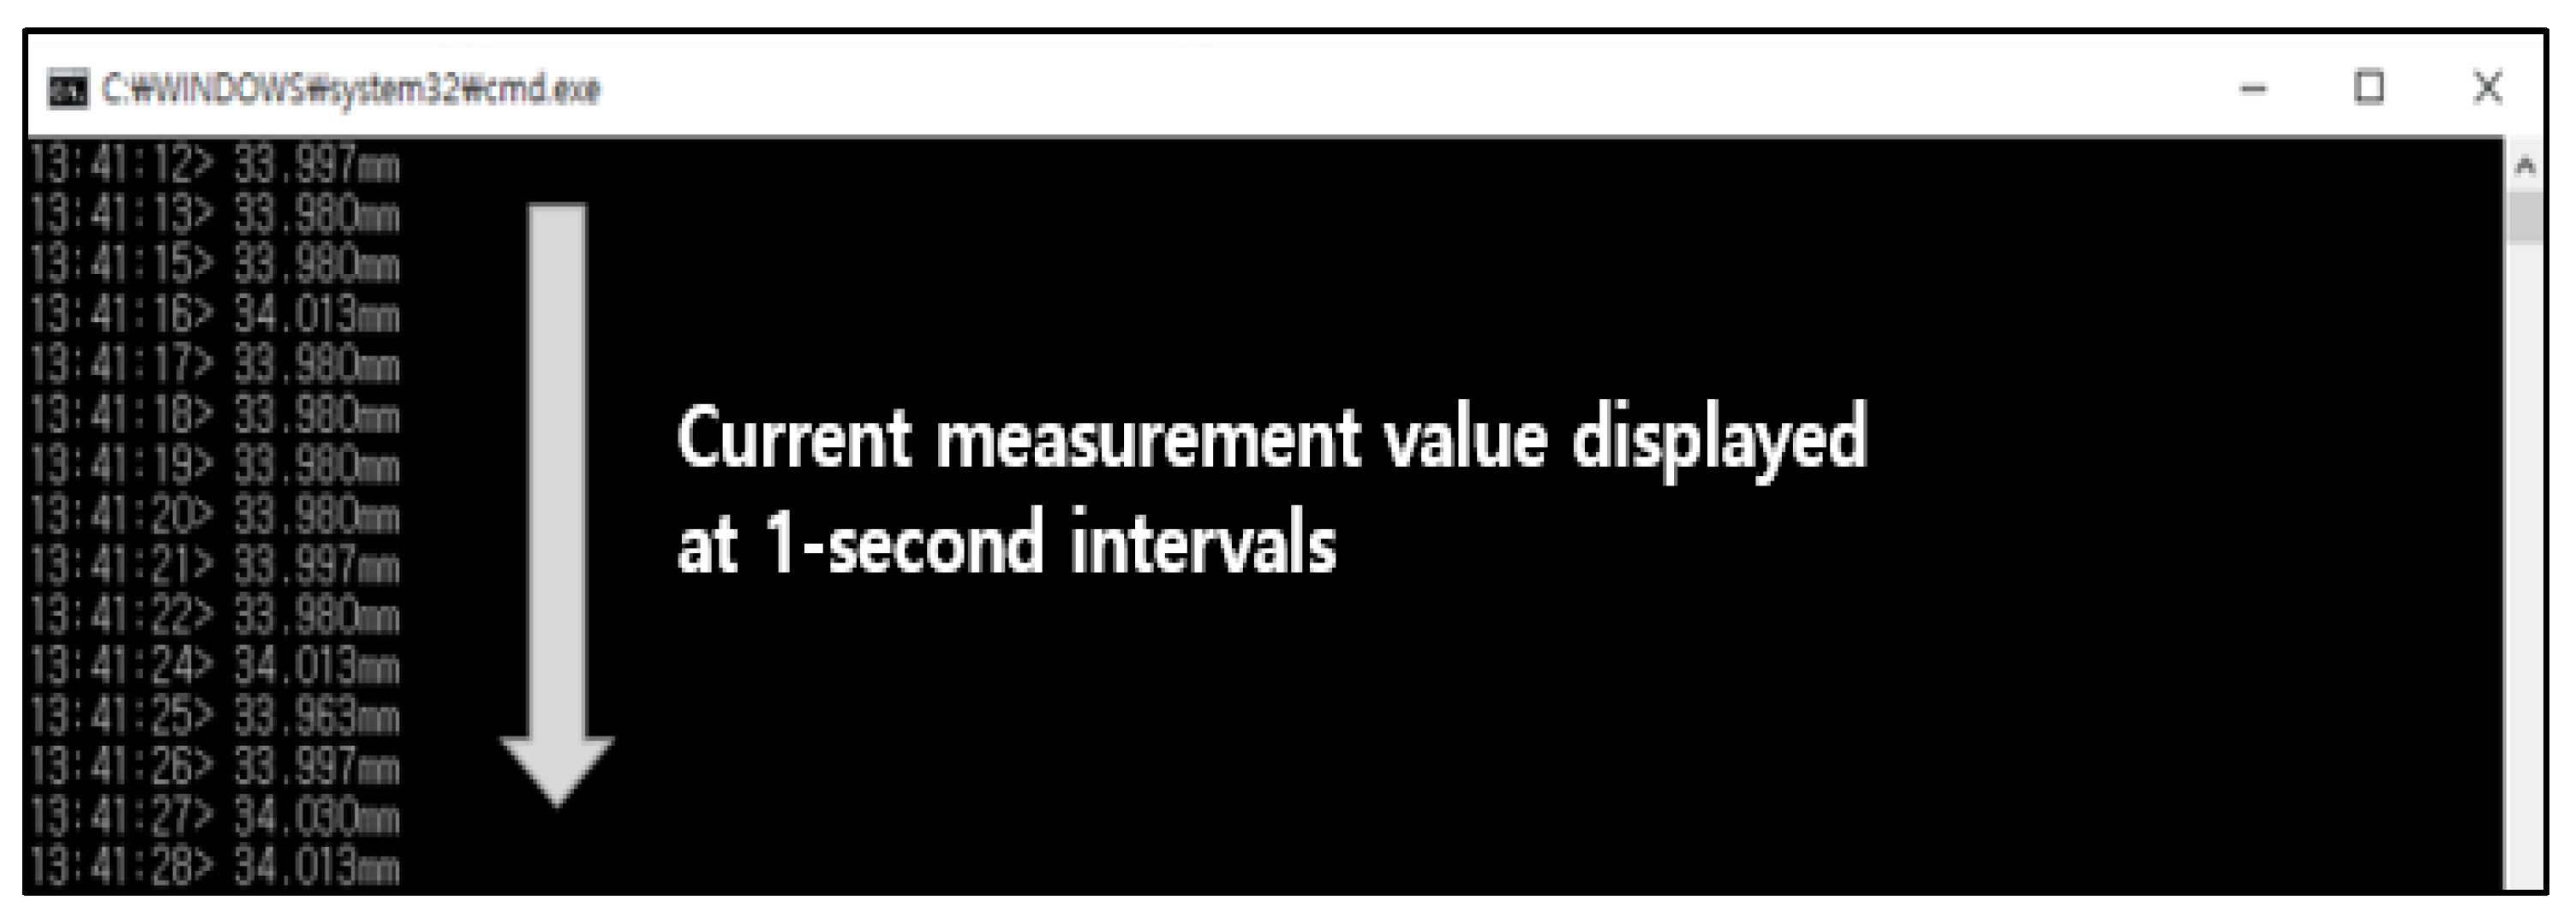
4.3. Testing and Data Acquisition

To acquire the training and analysis data for predicting the risk of bridge expansion joints based on AI, the simulated bridge was used for testing. Experimental conditions are as follows: two cases of the model, three to five cases of simulated vehicle speed, seven cases of expansion joint faulting of the simulated bridge, and three cases of expansion joint gap of the simulated bridge. Table 7 shows the experimental conditions of the simulated bridge. As for the speed of the simulated vehicle, a reduction ratio of 1/25 was applied based on the national road standard speed of the actual vehicle. Table 7 shows simulated bridge test conditions.
The experimental conditions were two cases of model vehicle, 3–5 cases of model vehicle speed, seven cases of simulated bridge expansion joint gap, and three cases of simulated bridge expansion joint gap. By combining them, it was possible to obtain data on about 210 experimental cases. In each case, about 20 sets of sensor data were collected from eight sensors. The total data sets collected were about 4200. Each of the 4200 data sets constitutes about 1400 data (line). Therefore, the total number of data is six million.

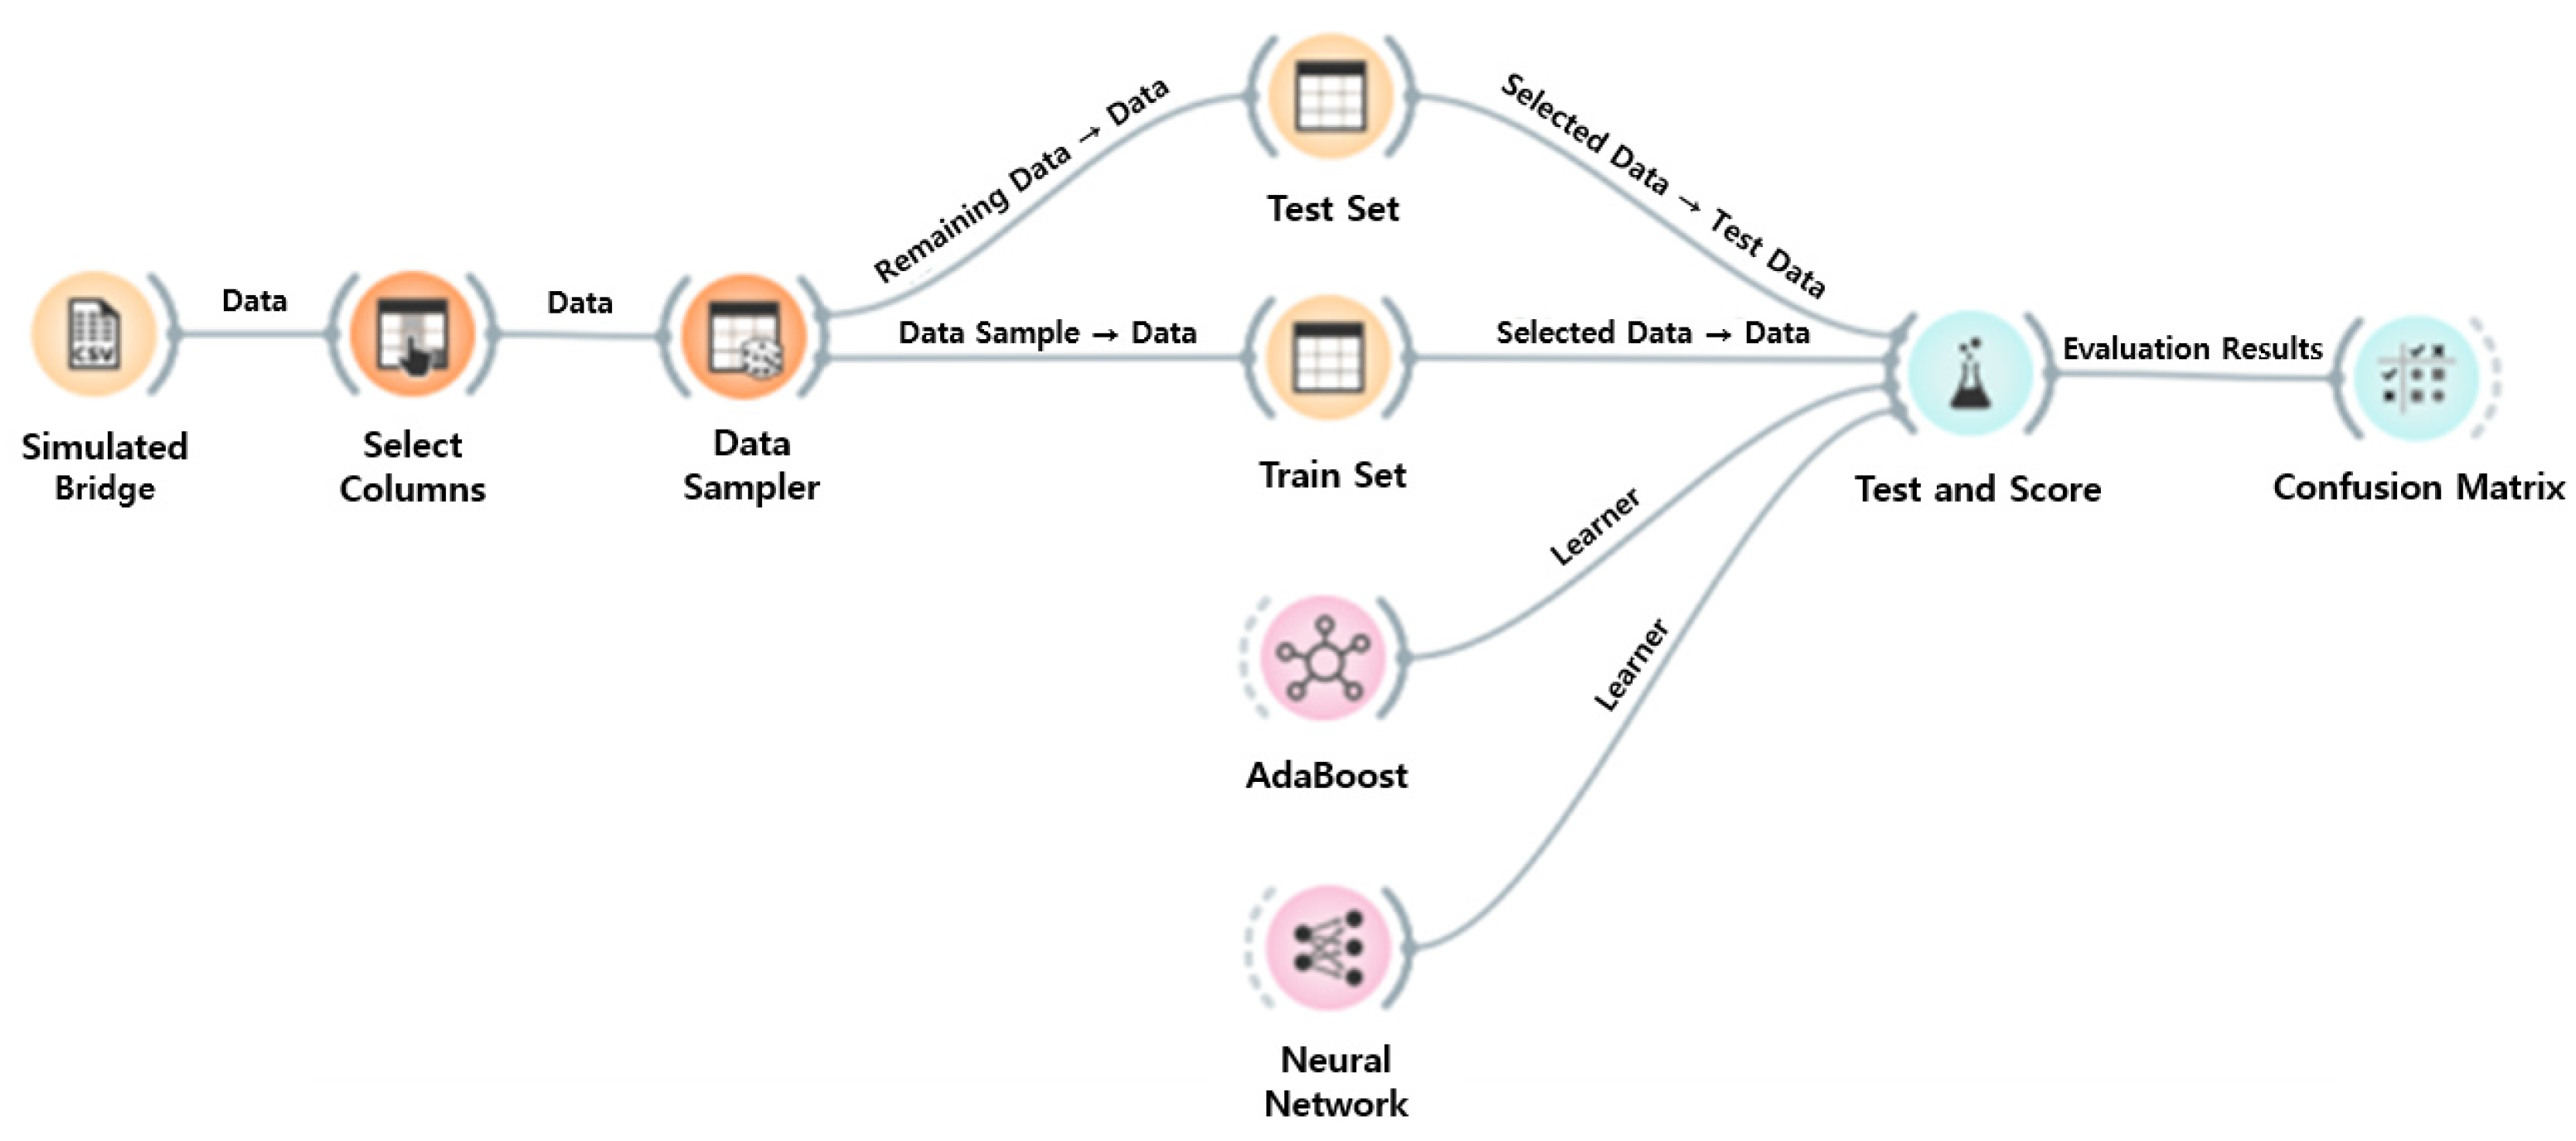
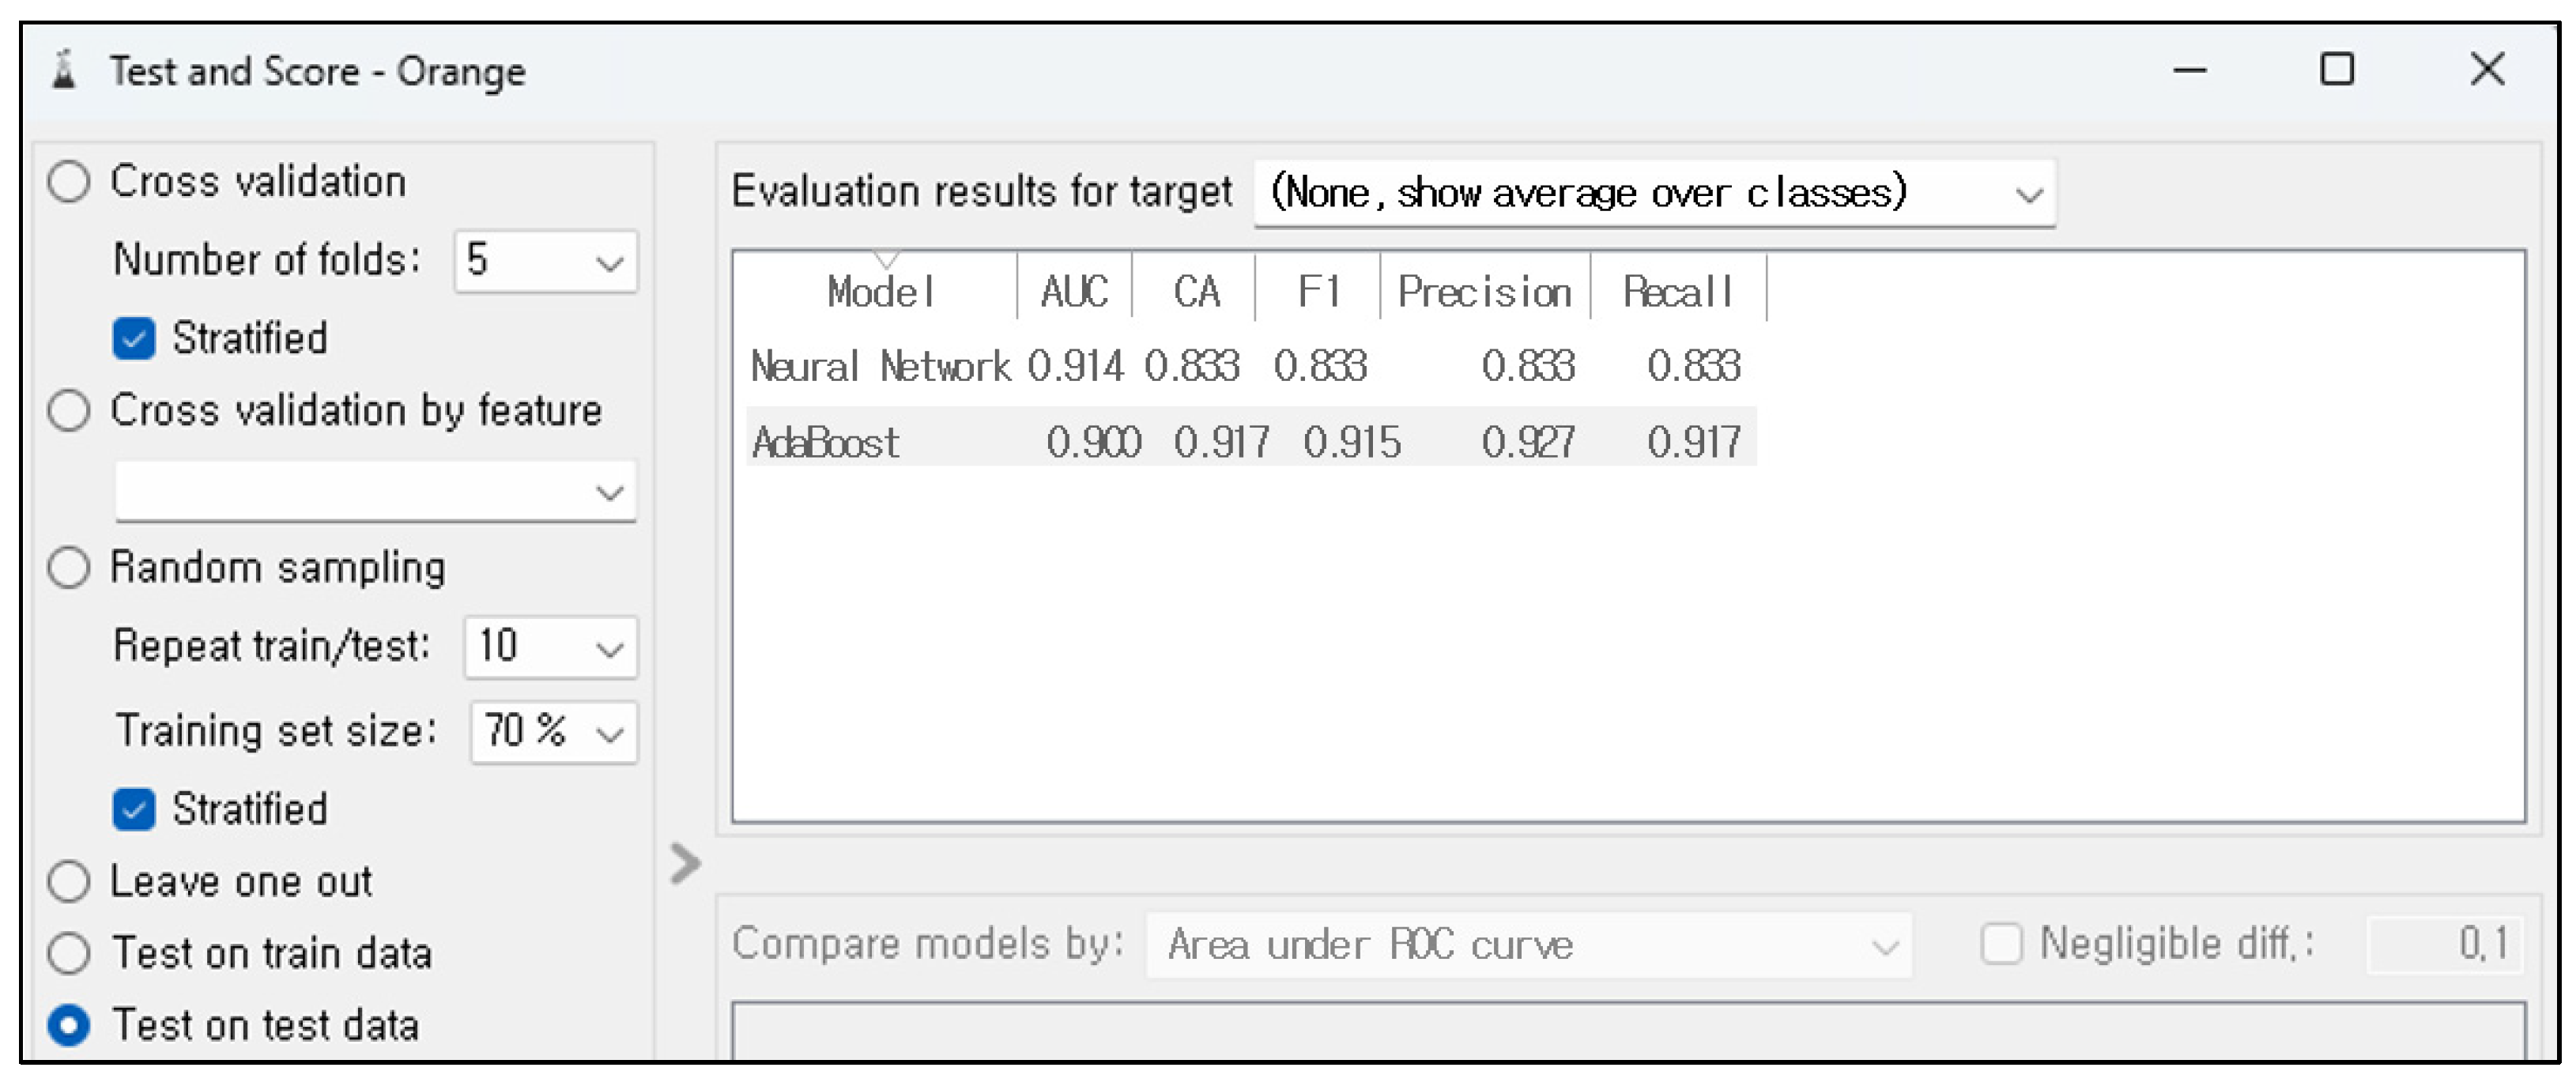
4.4. AI Model Training and Evaluation

Figure 14 is a flow chart of AI model training and evaluation. The AI model is trained and evaluated to diagnose expansion joint abnormalities of the bridge.
The raw data acquired from IoT sensors have three fields: TimeStamp, SensorID, and LVDT. These data should be cleaned in consideration of the installation position of a bridge bearing, measurement time, vehicle type, and vehicle speed. As for the installation position of a bridge bearing, its elasticity generates the displacement of the upper structure and the lower structure of a bridge. Figure 15 illustrates an example of the cleaned data. Acceleration sensors, vibration sensors, and position sensors were used as sensors to measure the displacement of the bridge bearings. Among the data acquired through these, missing values such as NaN and null values, and outliers that are out of the general range were removed and cleaned data was only used.
It is necessary to integrate the data obtained from the sensors installed on the bridge and train AI models based on it. However, since the measurement time of each sensor is not the same, interpolation was performed to extract data by a vehicle passing time and type, and then refined data was used. According to the result from the performance evaluation of an AI model, the AI model is trained in the way of chaining a data cleaning method. The cleaned data are classified into normal (normal state of expansion joints) data and abnormal data and are labeled. In an AI model, AdaBoost is selected based on the classification function. For the model training, the traditional method ANN is set as a comparative group. The performance of each AI model is evaluated. The AI model with the highest score is applied to diagnose anomalies of expansion joints.

4.5. IoT Data Processing

Out of about 37,000 bridges with upper and lower structures in the nation, about 17,300 have a type of bridge with bridge bearings and expansion joints. Given the study purpose, this analysis is efficient for pre-processing IoT displacement data or classifying AI training model categories. About 10% of the annual cumulative data about 17,300 bridges were analyzed. According to the data analysis, the number of bridges is 1730, the number of spans per bridge is about 5, the number of bridge bearings per span is 8, the number of acquired data per second is 10, and the volume per 1000 data is about 100 Kb.
The amount of data per second is about 692,000, the number of daily data is about 59.7 billion, the number of annual data is about 21.7 trillion, and the annual data volume is about 20 TB.

4.6. Development of AI Model

The data acquired with the uses of the simulated bridge and simulated vehicle were used. The context was classified into faulting situations and non-faulting situations. For AI model training based on supervised learning, the diagnosis data by context were added. For the performance evaluation and selection of AI models based on the data about the simulated bridge, 70% training data and 30% test data were used. A Support vector machine was applied to evaluate the performance score of each model, and a predictive value was set to 0.883. Additionally, the performance of AdaBoost and Neural Network was evaluated. The performance of AdaBoost scored 0.917, and that of Neural Network 0.833. Figure 16 illustrates AI model training and evaluation. Figure 17 presents the confusion matrix of AdaBoost as the model selected in this study.
In Figure 16, Area Under the Curve (AUC) is a calculated value of the area under the curve of Receiver Operating Characteristic (ROC), a graph for evaluating the performance of a classification model and represents the degree of separation. A higher value means that the model is good at predicting class 0 as 0 and class 1 as 1. Precision is an indicator that indicates the proportion of samples that are positive among predicted positive samples and recall is an indicator that indicates the proportion of samples that are predicted positive among positive samp. Classification Accuracy (CA) is an index that indicates the proportion of correctly classified samples out of all samples, and the F1 score is an index that indicates the harmonic average of precision and recall.
The confusion matrix is a matrix that compares the predicted value and the actual value to evaluate the performance of the classification model and represents the classification result as a matrix. It is generally composed of a 2 × 2 matrix and represents four cases of actual and predicted values. Here, D is the predicted positive and the actual positive, and S is the predicted negative and the actual negative.

5. Conclusions

Bridge expansion joint sealing devices accept longitudinal and transverse displacement according to a variety of external forces and expansion changes and play a critical role in presenting the soundness of overall bridge behavior. Unfortunately, due to various external effects, such as increasingly deteriorated bridges, rapid weather change and abnormal temperature, and traffic increase, bridge expansion joint gaps become narrow frequently. This study proposes a method of diagnosing anomalies of expansion joints based on AI with the use of a wireless displacement device. The proposed system predicts the risk of bridge expansion joints based on AI by measuring the displacement of a bridge bearing and establishing big data. Based on the predicted risk, it applies to traffic operation and management. For AI model training, a bridge with anomalies is needed. It is impossible to make a real bridge abnormal artificially. For this reason, a bridge with a bridge bearing was simulated, and a simulated vehicle in line with the simulated bridge was made for testing. To give the simulated bridge the bridge bearing function, the elastic body with a spring and urethane type was installed between the deck, and the lower support. The IoT sensor and monitoring software developed independently were applied to gather and clean the data about displacement that occurs when the simulated vehicle passes over the simulated bridge. In addition, an AI model was trained and evaluated. For the training and evaluation of AI models, Orange3 software was used. According to the AI model training and evaluation, F1 of AdaBoost scored 0.915, which was 0.082 more than that of ANN or 0.833. This result is limited to the simulated bridge and is not drawn with the use of data about a real bridge. If the proposed system is implemented in consideration of diverse variables in a real bridge, it is expected to prevent accidents caused by damage to the bridge expansion joint sealing device.

Author Contributions

Conceptualization, J.-S.P. and Y.-H.A.; methodology, J.-S.P. and H.-M.H.; software, validation, formal analysis, J.-S.P., Y.-H.A. and H.-M.H.; investigation, J.-S.P.; resources, J.-S.P. and Y.-H.A.; data curation, Y.-H.A. and H.-M.H.; writing—original draft preparation, J.-S.P. and Y.-H.A.; writing—review and editing, H.-M.H.; visualization, J.-S.P. and Y.-H.A.; supervision, H.-M.H. and Y.-H.A.; project administration, H.-M.H.; funding acquisition, H.-M.H. and Y.-H.A. All authors have read and agreed to the published version of the manuscript.

Funding

This research was supported by the MSIT (Ministry of Science and ICT), Korea, under the Innovative Human Resource Development for Local Intellectualization support program (IITP-2023-RS-2022-00156334) supervised by the IITP (Institute for Information & Communications Technology Planning & Evaluation).

Data Availability Statement

Not applicable.

Conflicts of Interest

The authors declare no conflict of interest.

References

  1. Malla, R.B.; Shaw, M.T.; Shrestha, M.R.; Brijmohan, S.B. Development and laboratory analysis of silicone foam sealant for bridge expansion joints. J. Bridge Eng. 2007, 12, 438–448. [Google Scholar] [CrossRef]
  2. McCarthy, E.; Wright, T.; Padgett, J.E.; DesRoches, R.; Bradford, P. Development of an experimentally validated analytical model for modular bridge expansion joint behavior. J. Bridge Eng. 2014, 19, 235–244. [Google Scholar] [CrossRef]
  3. Lima, J.M.; de Brito, J. Inspection survey of 150 expansion joints in road bridges. Eng. Struc. 2009, 31, 1077–1084. [Google Scholar] [CrossRef]
  4. Huang, H.B.; Yi, T.H.; Li, H.N.; Liu, H. New representative temperature for performance alarming of bridge expansion joints through temperature-displacement relationship. J. Bridge Eng. 2018, 23, 04018043. [Google Scholar] [CrossRef]
  5. Ni, Y.Q.; Wang, Y.W.; Zhang, C. A Bayesian approach for condition assessment and damage alarm of bridge expansion joints using long-term structural health monitoring data. Eng. Struc. 2020, 212, 110520. [Google Scholar] [CrossRef]
  6. Roberge, P.R. Corrosion Inspection and Monitoring; John Wiley & Sons: Hoboken, NJ, USA, 2007; ISBN 9780470099766. [Google Scholar]
  7. Komary, M.; Komarizadehasl, S.; Tošić, N.; Segura, I.; Lozano-Galant, J.A.; Turmo, J. Low-Cost Technologies Used in Corrosion Monitoring. Sensors 2023, 23, 1309. [Google Scholar] [CrossRef]
  8. Lei, J.; Lozano-Galant, J.A.; Xu, D.; Turmo, J. Structural system identification by measurement error-minimizing observability method. Struct. Control Health Monit. 2019, 26, e2425–e2444. [Google Scholar] [CrossRef]
  9. Kalybek, M.; Bocian, M.; Nikitas, N. Performance of Optical Structural Vibration Monitoring Systems in Experimental Modal Analysis. Sensors 2021, 21, 1239. [Google Scholar] [CrossRef]
  10. Komarizadehasl, S.; Khanmohammadi, M. Novel plastic hinge modification factors for damaged RC shear walls with bending performance. Adv. Concr. Constr. 2021, 12, 355–365. [Google Scholar] [CrossRef]
  11. Peng, T.; Nogal, M.; Casas, J.R.; Turmo, J. Role of sensors in error propagation with the dynamic constrained observability method. Sensors 2021, 21, 2918. [Google Scholar] [CrossRef]
  12. Xia, Y.; Hao, H.; Zanardo, G.; Deeks, A. Long term vibration monitoring of an RC slab: Temperature and humidity effect. Eng. Struct. 2006, 28, 441–452. [Google Scholar] [CrossRef]
  13. Hajializadeh, D.; Wang, Y.; Kullaa, J. Damage Detection and Localization under Variable Environmental Conditions Using Compressed and Reconstructed Bayesian Virtual Sensor Data. Sensors 2022, 22, 306. [Google Scholar] [CrossRef]
  14. Farré-Checa, J.; Komarizadehasl, S.; Ma, H.; Lozano-Galant, J.A.; Turmo, J. Direct simulation of the tensioning process of cable-stayed bridge cantilever construction. Autom. Constr. 2022, 137, 104197. [Google Scholar] [CrossRef]
  15. Nogal, M.; Lozano-Galant, J.A.; Turmo, J.; Castillo, E. Numerical damage identification of structures by observability techniques based on static loading tests. Struct. Infrastruct. Eng. 2016, 12, 1216–1227. [Google Scholar] [CrossRef] [Green Version]
  16. Laurendeau, D.; Ručevskis, S.; Rogala, T.; Katunin, A. Optimal Sensor Placement for Modal-Based Health Monitoring of a Composite Structure. Sensors 2022, 22, 3867. [Google Scholar] [CrossRef]
  17. Dumitriu, M. Condition Monitoring of the Dampers in the Railway Vehicle Suspension Based on the Vibrations Response Analysis of the Bogie. Sensors 2022, 22, 3290. [Google Scholar] [CrossRef]
  18. Feng, D.; Feng, M.Q. Model Updating of Railway Bridge Using in Situ Dynamic Displacement Measurement under Trainloads. J. Bridge Eng. 2015, 20, 04015019–04015031. [Google Scholar] [CrossRef]
  19. Guo, T.; Frangopol, D.M.; Chen, Y. Fatigue reliability assessment of steel bridge details integrating weigh-in-motion data and probabilistic finite element analysis. Comput. Struct. 2012, 112–113, 245–257. [Google Scholar] [CrossRef]
  20. Komarizadehasl, S.; Mobaraki, B.; Ma, H.; Lozano-Galant, J.-A.; Turmo, J. Development of a Low-Cost System for the Accurate Measurement of Structural Vibrations. Sensors 2021, 21, 6191. [Google Scholar] [CrossRef]
  21. Khandpur, R.S. Accelerometer; Wiley: Hoboken, NJ, USA, 2020; ISBN 9781119288121. [Google Scholar]
  22. Shi, Y.; Zhang, J.; Jiao, J.; Zhao, R.; Cao, H. Calibration Analysis of High-G MEMS Accelerometer Sensor Based on Wavelet and Wavelet Packet Denoising. Sensors 2021, 21, 1231. [Google Scholar] [CrossRef]
  23. Wojnar, G.; Burdzik, R.; Wieczorek, A.N.; Konieczny, Ł. Multidimensional Data Interpretation of Vibration Signals Registered in Different Locations for System Condition Monitoring of a Three-Stage Gear Transmission Operating under Difficult Conditions. Sensors 2021, 21, 7808. [Google Scholar] [CrossRef] [PubMed]
  24. Taniwaki, M.; Hanada, T.; Sakurai, N. Device for acoustic measurement of food texture using a piezoelectric sensor. Food Res. Int. 2006, 39, 1099–1105. [Google Scholar] [CrossRef] [Green Version]
  25. Zhuang, Y.; Chen, W.; Jin, T.; Chen, B.; Zhang, H.; Zhang, W. A review of computer vision-based structural deformation monitoring in field environments. Sensors 2022, 22, 3789. [Google Scholar] [CrossRef] [PubMed]
  26. Gayakwad, H.; Thiyagarajan, J.S. Structural damage detection through EMI and wave propagation techniques using embedded PZT smart sensing units. Sensors 2022, 22, 2296. [Google Scholar] [CrossRef] [PubMed]
  27. Civera, M.; Surace, C. Non-destructive techniques for the condition and structural health monitoring of wind turbines: A literature review of the last 20 years. Sensors 2022, 22, 1627. [Google Scholar] [CrossRef]
  28. Bado, M.F.; Tonelli, D.; Poli, F.; Zonta, D.; Casas, J.R. Digital twin for civil engineering systems: An exploratory review for distributed sensing updating. Sensors 2022, 22, 3168. [Google Scholar] [CrossRef]
  29. Seo, J.; Hu, J.W.; Lee, J. Summary review of structural health monitoring applications for highway bridges. J. Perform. Constr. Fac. 2016, 30, 04015072. [Google Scholar] [CrossRef]
  30. Yi, T.H.; Huang, H.B.; Li, H.N. Development of sensor validation methodologies for structural health monitoring: A comprehensive review. Measure 2017, 109, 200–214. [Google Scholar] [CrossRef]
  31. Lu, J.; Hu, H.; Bai, Y. Generalized radial basis function neural network based on an improved dynamic particle swarm optimization and AdaBoost algorithm. Neurocomputing 2015, 152, 305–315. [Google Scholar] [CrossRef]
  32. Mohammady, S.; Delavar, M.R.; Pahlavani, P. Urban growth modeling using an artificial neural network a case study of Sanandaj City, Iran. Int. Arch. Photogramm. Remote Sens. Spat. Inf. Sci. 2014, XL-2/W3, 203–208. [Google Scholar] [CrossRef] [Green Version]
  33. Gattulli, V.; Chiaramonte, L. Condition assessment by visual inspection for a bridge management system. Comput.-Aided Civ. Infrastruct. Eng. 2005, 20, 95–107. [Google Scholar] [CrossRef]
  34. Liu, C.; Gong, Y.; Laflamme, S.; Phares, B.; Sarkar, S. Bridge damage detection using spatiotemporal patterns extracted from dense sensor network. Meas. Sci. Technol. 2016, 28, 014011. [Google Scholar] [CrossRef] [Green Version]
  35. An, Y.; Chatzi, E.; Sim, S.H.; Laflamme, S.; Blachowski, B.; Ou, J. Recent progress and future trends on damage identification methods for bridge structures. Struct. Control Health Monit. 2019, 26, e2416. [Google Scholar] [CrossRef]
  36. Brownjohn, J.M. Structural health monitoring of civil infrastructure. Philos. Trans. A Math. Phys. Eng. Sci. 2007, 365, 589–622. [Google Scholar] [CrossRef] [Green Version]
  37. Sim, S.H. Decentralized Identification and Multimetric Monitoring of Civil Infrastructure Using Smart Sensors; University of Illinois at Urbana-Champaign ProQuest Dissertations Publishing: Ann Arbor, MI, USA, 2011. [Google Scholar]
  38. Laflamme, S.; Cao, L.; Chatzi, E.; Ubertini, F. Damage detection and localization from dense network of strain sensors. Shock Vib. 2016, 2016, 2562949. [Google Scholar] [CrossRef] [Green Version]
  39. Downey, A.; Laflamme, S.; Ubertini, F. Reconstruction of in-plane strain maps using hybrid dense sensor network composed of sensing skin. Meas. Sci. Technol. 2016, 27, 124016. [Google Scholar] [CrossRef] [Green Version]
  40. O’Connor, S.M.; Lynch, J.P.; Gilbert, A.C. Compressed sensing embedded in an operational wireless sensor network to achieve energy efficiency in long-term monitoring applications. Smart Mater. Struct. 2014, 23, 085014. [Google Scholar] [CrossRef]
  41. Noel, A.B.; Abdaoui, A.; Elfouly, T.; Ahmed, M.H.; Badawy, A.; Shehata, M.S. Structural health monitoring using wireless sensor networks: A comprehensive survey. IEEE Commun. Surv. Tutor. 2017, 19, 1403–1423. [Google Scholar] [CrossRef]
  42. Chen, Z.; Zhou, X.; Wang, X.; Dong, L.; Qian, Y. Deployment of a smart structural health monitoring system for long-span arch bridges: A review and a case study. Sensors 2017, 17, 2151. [Google Scholar] [CrossRef] [Green Version]
  43. Vallan, A.; Casalicchio, M.L.; Perrone, G. Displacement and acceleration measurements in vibration tests using a fiber optic sensor. IEEE Trans. Instrum. Meas. 2010, 59, 1389–1396. [Google Scholar] [CrossRef] [Green Version]
  44. Park, J.W.; Sim, S.H.; Jung, H.J. Wireless displacement sensing system for bridges using multi-sensor fusion. Smart Mater. Struct. 2014, 23, 045022. [Google Scholar] [CrossRef]
  45. Sung, Y.C.; Lin, T.K.; Chiu, Y.T.; Chang, K.C.; Chen, K.L.; Chang, C.C. A bridge safety monitoring system for prestressed composite box-girder bridges with corrugated steel webs based on in-situ loading experiments and a long-term monitoring database. Eng. Struct. 2016, 126, 571–585. [Google Scholar] [CrossRef]
  46. Jo, B.W.; Lee, Y.S.; Jo, J.H.; Khan, R.M.A. Computer vision-based bridge displacement measurements using rotation-invariant image processing technique. Sustainability 2018, 10, 1785. [Google Scholar] [CrossRef] [Green Version]
  47. Park, K.T.; Kim, S.H.; Park, H.S.; Lee, K.W. The determination of bridge displacement using measured acceleration. J. Eng. Struct. 2005, 27, 371–378. [Google Scholar] [CrossRef]
  48. Psimoulis, P.; Pytharouli, S.; Karambalis, D.; Stiros, S. Potential of Global Positioning System (GPS) to measure frequencies of oscillations of engineering structures. J. Sound Vib. 2008, 318, 606–623. [Google Scholar] [CrossRef]
  49. Hou, S.; Wu, G. A low-cost IoT-based wireless sensor system for bridge displacement monitoring. Smart Mater. Struct. 2019, 28, 085047. [Google Scholar] [CrossRef]
Figure 1. The Architecture of the risk prediction system of expansion joints.
Electronics 12 02713 g001
Figure 2. Electric & electronic device configuration.
Electronics 12 02713 g002
Figure 3. Outside view of wireless displacement measurement device for expansion joint.
Electronics 12 02713 g003
Figure 4. Exploded view of measuring device.
Electronics 12 02713 g004
Figure 5. Range of measuring devices.
Electronics 12 02713 g005
Figure 6. Installation method of measuring device.
Electronics 12 02713 g006
Figure 7. Isometric view and front view of the test device.
Electronics 12 02713 g007
Figure 8. Test tool setting.
Electronics 12 02713 g008
Figure 9. Display of measured data.
Electronics 12 02713 g009
Figure 10. Design of the basic concept of S/W.
Electronics 12 02713 g010
Figure 11. Simulated vehicle.
Electronics 12 02713 g011
Figure 12. Simulated bridge.
Electronics 12 02713 g012
Figure 13. Actual bridge installation test.
Electronics 12 02713 g013
Figure 14. AI model training and evaluation flow chart.
Electronics 12 02713 g014
Figure 15. An example of the cleaned data.
Electronics 12 02713 g015
Figure 16. AI model training and evaluation.
Electronics 12 02713 g016aElectronics 12 02713 g016b
Figure 17. AdaBoost confusion matrix.
Electronics 12 02713 g017
Table 1. List of measuring device materials and parts.
NoPartProduct Name/ContentQuantity
1Linear Position Sensor (LVDT)Miran KTR3-501
2Control BoardRaspberry Pi Zero 2W1
3Power BoardAda Fruit Power boost 1000c1
4ADC BoardMulti-Purpose Board1
5ADCMCP32081
6ADC Socket16 pin DIP1
7Wireless LANUSB LAN1
8Switchtoggle Switch1
9DisplayLED1
10BatteryCustomized Li-ion 5200 mAh1
11Thermo-hygrometerHigh precision sensor1
Table 2. Results from the repeated testing of the measuring device.
CaseTypeMeasured Value
DisplacementCountMinMaxThe MeanError
1Lower10 mm11810.0010.0510.020.05
Upper12 mm11.9712.0412.010.07
2Lower12 mm10211.9912.0512.020.06
Upper14 mm13.9514.0414.000.09
3Lower14 mm10313.9914.0514.020.06
Upper16 mm15.9816.0316.010.05
4Lower16 mm10215.9616.0316.010.07
Upper18 mm17.9718.0418.010.07
5Lower18 mm10417.9718.0418.010.07
Upper20 mm19.9620.0520.010.09
6Lower20 mm10319.9920.0520.020.06
Upper22 mm21.9722.0622.010.09
7Lower22 mm10221.9722.0422.010.07
Upper24 mm23.9524.0524.020.10
8Lower24 mm10423.9824.0624.010.08
Upper26 mm25.9826.0526.010.07
9Lower26 mm10125.9826.0626.020.08
Upper28 mm27.9828.0528.020.07
10Lower28 mm10427.9728.0628.010.09
Upper30 mm29.9830.0430.010.06
11Lower30 mm10429.9830.0630.020.08
Upper32 mm31.9732.0632.010.09
12Lower32 mm10331.9732.0732.010.10
Upper34 mm33.9834.0534.010.07
Table 3. The reduction ratio of the simulated bridge.
ItemReal Bridge
(Standard)
Simulated BridgeReduction
Ratio
Remark
No. of spans10 or less5-Abutment and span
Max. span length24 m0.8 m1:30-
Total width18 m0.6 m1:30-
Design loadDB-24--Standard truck running
Table 4. An example of the application of faulting and gap factors.
TypeSimulated BridgeFactorReal Bridge
Faulting1 mm0.460.46 mm
Gap1 mm0.460.46 mm
Table 5. An example of the application of displacement occurrence time factor.
TypeSimulated BridgeFactorReal Bridge
Time of displacement by impacts1 s0.830.83 s
Table 6. Factors.
Table 6. Factors.
TypeFactorValue
FaultingFs0.46
GapFg0.46
Time of displacement by impactsFt0.83
An amount of displacementFw-
Table 7. Simulated bridge test conditions.
CategorySpeedFaultingGap
Simulated bus2.3 km/h−3~3 mm (1 mm distance)0~4 mm (2 mm distance)
2.5 km/h−3~3 mm (1 mm distance)0~4 mm (2 mm distance)
2.7 km/h−3~3 mm (1 mm distance)0~4 mm (2 mm distance)
2.9 km/h−3~3 mm (1 mm distance)0~4 mm (2 mm distance)
3.1 km/h−3~3 mm (1 mm distance)0~4 mm (2 mm distance)
Simulated truck2.3 km/h−3~3 mm (1 mm distance)0~4 mm (2 mm distance)
2.5 km/h−3~3 mm (1 mm distance)0~4 mm (2 mm distance)
2.7 km/h−3~3 mm (1 mm distance)0~4 mm (2 mm distance)
Disclaimer/Publisher’s Note: The statements, opinions and data contained in all publications are solely those of the individual author(s) and contributor(s) and not of MDPI and/or the editor(s). MDPI and/or the editor(s) disclaim responsibility for any injury to people or property resulting from any ideas, methods, instructions or products referred to in the content.

