Abstract
Visual quality assessment is often used as a key performance indicator (KPI) to evaluate the performance of electronic devices. There exists a significant association between visual quality assessment and electronic devices. In this paper, we bring attention to alternative choices of perceptual loss function for end-to-end deep video coding (E2E-DVC), which can be used to reduce the amount of data generated by electronic sensors and other sources. Thus, we analyze the effects of different full-reference quality assessment (FR-QA) metrics on E2E-DVC. First, we select five optimization-suitable FR-QA metrics as perceptual objectives, which are differentiable and thus support back propagation, and use them to optimize an E2E-DVC model. Second, we analyze the rate–distortion (R-D) behaviors of an E2E-DVC model under different loss function optimizations. Third, we carry out subjective human perceptual tests on the reconstructed videos to show the performance of different FR-QA optimizations on subjective visual quality. This study reveals the effects of the competing FR-QA metrics on E2E-DVC and provides a guide for further future study on E2E-DVC in terms of perceptual loss function design.
1. Introduction
Visual quality assessment pertains to the evaluation of the aesthetic presentation of images or videos. Electronic products serve as the means by which these visual media are displayed. Thus, there exists a significant association between visual quality assessment and electronic devices, given that the quality of the latter directly impacts the visual presentation of media content. Employing visual quality assessment methods can effectively gauge the optimal display performance of electronic products, thereby enabling the enhancement of user enjoyment and satisfaction, as well as facilitating quality control and improvement of electronic devices.
Visual quality evaluation focuses on users’ subjective perception of images or video quality, while security privacy evaluation focuses on the degree to which sensitive information is protected and the ability to mitigate potential threats. The combination of these evaluation methods can ensure that the system or product not only provides a high-quality user experience but also has the necessary security and privacy protection capabilities.
In the context of electronics devices, visual quality assessment can be used to evaluate the performance of systems that use visual sensors [1], such as cameras, to monitor physical processes. For example, in a manufacturing plant, cameras may be used to monitor the quality of products as they move through the production line. The visual data captured by these cameras can then be analyzed to detect defects or other issues that may affect product quality. In addition, electronic devices generate and store large amounts of data from sensors and other sources [2], which must be processed and transmitted efficiently to enable real-time control [3] and decision making. Therefore, compression technology [4,5] is important for electronic devices to reduce the amount of data generated by sensors and other sources [6,7], which can help to optimize system performance. Obviously, a good quality assessment (QA) metric is the key to guide and evaluate the compression coding.
Since the original distortion-free images/frames are available during the coding process, the QA metrics referred to in this paper are full-reference (FR) metrics, which derive the quality of a distorted image/frame by comparing it with the original one. Nowadays, some FR-QA metrics, such as mean squared error (MSE) and peak signal-to-noise ratio (PSNR), are already widely used in video compression, such as High Efficiency Video Coding (HEVC) [8] and Versatile Video Coding (VVC) [9]. However, many FR-QR metrics have poor correlation with the perception of the human visual system (HVS) and are not precise enough to reflect the perceptual quality of an image. To address this issue, a variety of perceptual FR-QA metrics have been developed in the past two decades, which can be divided in to early prior knowledge based models [10,11], traditional machine learning based algorithms [12,13], and the latest, emerging end-to-end deep-learning-based models [14,15].
In traditional hybrid video coding frameworks (shown in Figure 1), such as AVC, HEVC, and VVC, coding tools basically perform rate–distortion optimization on their own within a specific codec structure. Currently, modularized neural video coding (MOD-NVC) integrates a modular learning-based coding tool into the traditional video coding framework, either as a stand-alone module replacing the original module, as an enhancement to the original module, or as a part of the coding strategy. MOD-NVC can improve the performance of traditional video coding algorithms but is still constrained by the coupling between coding tools; so, MOD-NVC is a local optimization of the traditional hybrid video coding framework. In contrast, end-to-end deep video coding (E2E-DVC) can overcome these shortcomings and enable a simple replacement of the network model to an overall end-to-end optimization. As shown in Figure 1, an E2E-DVC model is essentially a deep learning model based on autoencoders (AE), and most existing E2E-DVC models still follow the basic idea of hybrid coding. Currently, a variety of different neural network structures are used in the design of AE, including the use of convolutional neural network (CNN), recurrent neural network (RNN), generative adversarial network (GAN), long short-term memory (LSTM), gated recurrent unit (GRU), and attention mechanism [16], which significantly improve the E2E-DVC models’ performance.
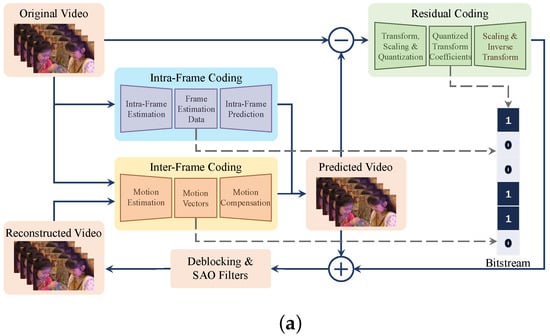
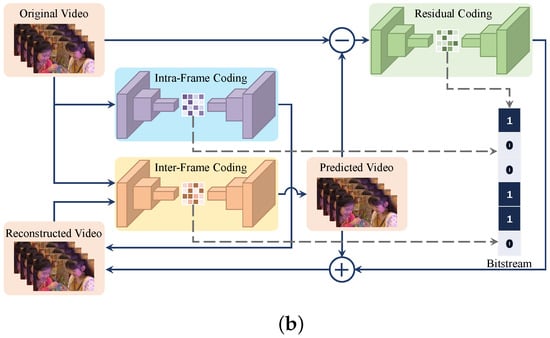
Figure 1.
Framework of traditional hybrid video coding and E2E-DVC: (a) framework of traditional hybrid video coding and (b) framework of E2E-DVC.
The choice of a loss function is an important factor when designing and configuring neural networks. By using a stochastic gradient descent (SGD) algorithm to decrease a differentiable loss function, parameters of a neural networks model can be optimized. There have been some studies on loss functions for image processing [17], such as image restoration [18]. However, the impact of the loss functions has not received much attention in the context of E2E-DVC. Most existing E2E-DVC models use MSE or SSIM [19] as a part of the loss function. Since an important application of the FR-QA metrics is evaluating and guiding image/video compression coding, there are many other FR-QA metrics to be chosen as a loss function, and it can be challenging to know what to choose or even what role it plays.
To address the above problem, we bring attention to alternative choices of perceptual loss function for E2E-DVC and analyze the effects of different FR-QA metrics on E2E-DVC. The main contributions of this study are as follows:
- We select five optimization-suitable FR-QA metrics as perceptual objectives, which are differentiable and thus support back propagation, and use them to optimize an E2E-DVC model.
- We analyze the rate–distortion (R-D) behaviors of an E2E-DVC model under under different loss function optimizations, which provides a basis for further future study of the rate control of E2E-DVC.
- We conduct subjective human perceptual tests on the reconstructed videos to show the effects of different FR-QA optimizations on subjective visual quality and reveal the relative performance of the competing FR-QA metrics.
The remainder of this paper is structured in the following way. The relevant research is presented in Section 2. Section 3 describes the study in detail. In Section 4, comprehensive experiments are conducted to discuss the effects of different FR-QA optimizations from various aspects. Finally, we draw a conclusion in Section 5.
2. Related Work
2.1. End-to-End Deep Video Coding
The classic E2E-DVC model was proposed by Lu et al. [20] in 2019, showing the possibilities of E2E video coding techniques. Most existing E2E-DVC models that emerged subsequently still follow the framework of traditional hybrid coding, using supervised learning methods with different algorithms to efficiently represent spatial texture, temporal motion, and prediction residuals. Chen et al. [21] extended their nonlocal attention optimization and improved context (NLAIC) method for intraframe and residual coding and used second-order stream-to-stream prediction for a more compact motion representation, showing consistent R-D gain across content and bit rates. Rippel et al. [22] used composite features for the joint encoding of motion streams and residuals, embedded in aggregated multiframe information, to efficiently generate the encoding of motion streams and residuals. For the effective representation of temporal information in video coding, Liu et al. [23] proposed a learned video compression method via joint spatial–temporal correlation exploration. In this method, temporal correlation was predicted by first-order optical flow and second-order optical flow, and a single-stage unsupervised learning method was used to encapsulate the optical flow into quantized successive frame features, followed by context-adaptive entropy coding to remove second-order correlation.
2.2. QA Metrics for Perceptual Optimization
The use of FR-QA metrics as targets for designing and optimizing new image processing algorithms is one of its less studied but very promising applications [24]. The tuning of model parameters is usually performed in image processing systems, with minimizing MSE as the objective function. SSIM [19] was used in early studies for perceptual optimization and applied in image recovery, wireless video streaming, and image synthesis. Zhao et al. [18] found that the optimization of image recovery tasks using mean absolute error (MAE, -norm) was better than using MSE (-norm). A multiscale structural similarity metric (MS-SSIM) [25] is often used to guide neural-network-based image super-resolution and image compression. Laparra et al. [26] used normalized Laplace pyramid-based metrics [27] to optimize image rendering algorithms. Ding et al. [17] used different FR-QA metrics as loss functions to train deep neural networks for low-level image processing tasks, including denoising, deblurring, super-resolution, and image compression. Zhang et al. [28] designed a mixed loss function containing MSE and a mixed loss function for perceptual optimization of deep video compression.
3. FR-QA Model for Perceptual Optimization
3.1. Deep Video Compression
As shown in Figure 2, the encoding procedure of the deep video compression (DVC) [20] in the encoder side is as follows.
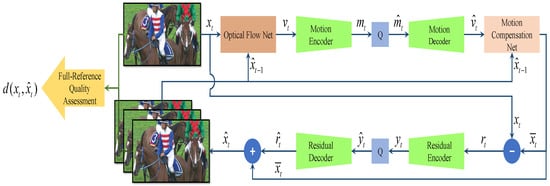
Figure 2.
Framework of the DVC and perceptual optimization.
Step 1. Motion estimation:
where is the frame at time step t (current frame), and is the reconstructed frame. is the optical flow net, and the output is the optical flow map.
Step 2. Motion information coding and quantification:
where is the result of the optical flow map encoded by an automatic encoder , and is the quantized version of .
Step 3. Motion compensation:
where is the motion information decoder, is the motion compensation net, is the reconstructed optical flow map, and is the predicted frame.
Step 4. Residual coding and quantification:
where is the residual between and , is the result of encoded by the residual encoder , and is the quantization result of .
Step 5. Frame reconstruction:
where is the residual decoder, and and represent the reconstructed residual and reconstructed frame, respectively.
The loss function of the model is rate–distortion loss, which is defined as follows:
where denotes the perceptual distortion between and , and represents the number of bits used for encoding the representations. is the super-parameter that balances the rate–distortion trade-off, commonly referred to as the Lagrangian coefficient.
3.2. Perceptual Quality Optimization
Since the loss function should encourage E2E-DVC models to reconstruct natural and perceptually pleasing videos, we chose five commonly used or the state-of-the-art FR-QA metrics to guide the learning of DVC model as follows:
- 1.
- Mean Absolute Error (MAE).
MAE, a popular error measurement method, is intuitive because, unlike RMSE, its variation is linear. MSE and RMSE have more of a “penalty” for larger errors, because the square of the error value increases the average error value. In MAE, the MAE value is measured as the average of the absolute error values, and the different errors are not weighted more or less but increase linearly as the error increases. When the MAE value is used as the quality loss in Equation (11), it is calculated as follows:
where is the resolution of the original image and the reconstructed image , and is the location coordinate of the pixel point. Although MAE focuses only on pixel-level changes in the image, it has shown better performance in image restoration tasks [18].
- 2.
- Multiscale Structural Similarity (MS-SSIM)
Unlike MAE, which compares pixel-level differences across an image, MS-SSIM [25] works on blocks of sliding windows. This approach better simulates the HVS function, because HVS can easily perceive local information differences in specific regions of two images rather than individual differences in pixel values over the entire region. MS-SSIM, as an SSIM-based method, extends SSIM at a single scale by retaining the results after multiple downsamplings to measure changes in structural information at multiple scales. When the MS-SSIM value is used as the quality optimization objective in Equation (11), it is calculated as follows:
where is the resolution of the original image and the reconstructed image , is the location coordinate of the pixel point, and , , and are the luminance contrast factor, contrast factor, and structure contrast factor of the original image at for the sliding window block at the h-th scale, respectively. For the original image, i.e., , it is calculated as follows:
where and are the means of and within the sliding window block at , respectively. and are the variances of and within the sliding window block at , respectively. is the covariance between and within the sliding window block at . The three fixed constants , , and in the formulas are set to , , and , where L is the dynamic range of the pixel values (256 for 8-bit images), and the default settings for and are 0.01 and 0.03, respectively. For the m-th scale, , , and are calculated on the image obtained after m low-pass filtering and downsampling with a factor of 2 (i.e., the image is reduced by ), and their calculation formulas are the same as , , and .
- 3.
- Visual Information Fidelity (VIF)
VIF [10] is an FR-QA method based on natural scene statistics and HVS to extract image information concepts, which uses information-theoretic metrics to measure image fidelity. In the information-theoretic framework, the reference image is modeled as the output of a random “natural” source that passes through the HVS channel and is subsequently processed by the brain. The information content of the reference image is quantified as the mutual information between the input and output of the HVS channel, which is the information that the brain can ideally extract from the reference image. Similarly, in the presence of an image distortion channel, the information capacity of the distorted image is quantified as the mutual information between the input of the distortion channel and the output of the HVS channel of the test image, which is the information that the brain can ideally extract from the distorted image.
VIF uses the Gaussian scale mixture (GSM) method to statistically model the wavelet coefficients after image pyramidal decomposition, i.e., an HVS multichannel model for a given sub-band of multiscale multidirectional decomposition.
The original image information model is
where is a scalar field taking positive values, is a Gaussian vector field with mean 0 and covariance , and is a spatial index set of sub-bands.
The distorted image information model is
where is a deterministic scalar gain field, is a Gaussian vector field with mean 0 and covariance , and is the identity matrix.
The HVS output models for the original image and the distorted image, respectively, are
where both and are Gaussian vector fields with mean 0 and covariance .
Let the superscript indicate that there are blocks in the j-th sub-band, then when VIF is used as the quality optimization objective in Equation (11), it is calculated as follows:
where is the maximum likelihood estimate of . is the mutual information between and , i.e., the information that the brain gets from the original image ; is the mutual information between and , i.e., the information that the brain gets from the reconstructed image , which can be calculated as follows:
- 4.
- Learned Perceptual Image Patch Similarity (LPIPS)
LPIPS [29], as a deep-learning-based approach, uses a CNN feature extractor to generate distances between low-dimensional features for the reference and distorted images and then a shallow network to produce a better probability of one over the other. the LPIPS model also solves the problem caused by the extraction of different ranges of features by each layer and introduces learning weights to weight the importance of different features.
Let the feature map of the original image obtained after the l-th layer of convolution be with a size of . Let the feature of on the k-th channel be ; the associated symbols of the reconstructed image are defined similarly. When the LPIPS value is used as the quality loss in Equation (11), it is calculated as follows:
where is the weight parameter obtained by LPIPS after training.
- 5.
- Deep Image Structure and Texture Similarity (DISTS)
DISTS [30], as a deep-learning-based model, is based on a pretrained VGG network as a feature extractor of the image and converts the image nonlinearly into a multiscale overcomplete representation, whose quality is then evaluated by a distance metric. Similar to the PIPAL, DISTS allows for small inconsistencies between the distorted and reference images in the texture information. DISTS can be seen as a version of the SSIM method in the depth domain, but DISTS contains only the luminance factor and the structure factor.
Let the feature map of the original image obtained after the l-th layer of convolution be , with a size of . Let the feature of on the k-th channel be ; the associated symbols of the reconstructed image are defined similarly. When the LPIPS value is used as the quality loss in Equation (11), it is calculated as follows:
where and are the weight parameters obtained from DISTS after training, and and are the luminance factor and structure factor, respectively, which are defined as follows:
where and are the means of and , respectively, and are the standard deviations of and , respectively, and is the covariance between and . and are the same as in Equations (14) and (15).
Since the scales of these metrics vary widely, we normalized them as follows for a fair comparison when training the DVC model. We normalize the difference mean opinion scores (DMOS) in the LIVE database [31] (the lower the value, the better the perceptual quality) into the range [0, 1] by min-max scaling. For each FR-QA metric Q, a nonlinear four-parameter logistic (4PL) regression is used to fit the relationship between normalized DMOS and Q as follows:
where is the predicted quality score, and are parameters to be estimated. Thus, the above five FR-QA metrics are mapped to around [0, 1] using the 4PL functions. This processing allows the DVC models trained with the same but with different FR-QA optimizations to encode a video at the most similar bit rates as possible.
Since the five selected FR-QA metrics are differentiable almost everywhere, and the 4PL function is also differentiable, supports backpropagation. In addition, as is an approximation to DMOS of , a smaller indicates a higher perceptual quality of the reconstructed frame . Therefore, in order to make the videos reconstructed by the DVC model have better perceptual quality, we optimize the DVC model by making in Equation (11) equal to in Equation (28). In addition, the normalization method used in this section allows the E2E-DVC model to obtain encoded videos with as similar bit rates as possible when trained with the same and different FR-QA optimizations.
4. Experiments
4.1. Implementation Details
We train (PyTorch 1.7.1, Nvidia GeForce GTX 3090 GPU with 24 GB memory, and Intel Core i9-12900K CPU with 64 GB memory) the DVC on the Vimeo-90k [32], which is built for evaluating different video processing tasks, such as video interpolation, video denoising/deblocking, and video super-resolution. The dataset contains 89,800 video clips covering a rich variety of video content. The model is trained using the Adam optimizer with parameters set to and , the batch size is set to 4, with an initial learning rate of 0.0001, and the learning rate is divided by 10 when the loss becomes stable. Both the codes for DVC and FR-QA metrics are online available at [33]. The rate–distortion weight factor is set to 256,512,1024,2048, and the resolution of the images for training is 256 × 256.
During the testing period, the HEVC standard test sequence was used to evaluate the performance of E2E-DVC, which is widely used to measure the performance of video compression algorithms because of the diversity of video content and resolutions in this dataset.
4.2. Objective Results
4.2.1. R-D Performance
As shown in Figure 3, we compare the coding perfomance of the DVC models optimized under different FR-QA loss functions on the HEVC Class B sequences. Since peak signal-to-noise ratio (PSNR) is the most commonly used metric for lossy compression codecs, we use it to describe R-D performance. The detailed PSNR values are shown in Table 1. We also found that the R-D data can be well fitted by the following function:
where and are parameters to be estimated, which are determined by the codec models and video content.
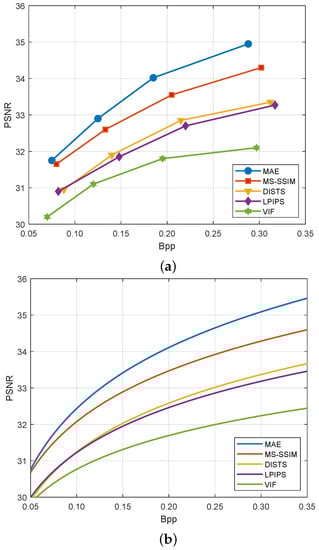
Figure 3.
Performance on the HEVC Class B dataset between different FR-QA metrics in term of PSNR: (a) R-D performance and (b) fitted R-D functions.

Table 1.
Objective or subjective comparisons.
4.2.2. Objective Model Ranking
For a fairer comparison, the five FR-IQAs self-evaluated and mutually evaluated the videos encoded and reconstructed by their respective optimized E2E-DVC models under the same settings. The average ranking on HEVC Class B sequences is shown in Figure 4, where 1 indicates the best and 5 indicates the worst.
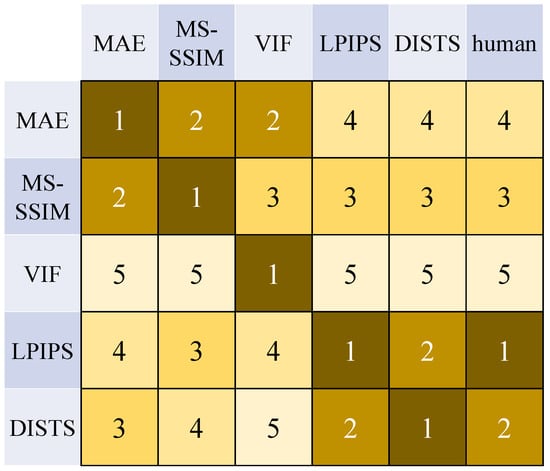
Figure 4.
Objective rankings and subjective ranking of the reconstructed videos by the five FR-QA metrics. The horizontal axis indicators are used for evaluation.
From Figure 4, it can be seen that the traditional MAE and MS-SSIM methods consider the deep-learning-based methods to perform more poorly when evaluating the deep-learning-based LPIPS and DISTS methods; conversely, the deep-learning-based LPIPS and DISTS methods also consider the traditional MAE and MS-SSIM methods to perform more poorly. This indicates that traditional methods and deep-learning-based methods are very different in nature. The human subjective perception believes that the E2E-DVC model optimized by the deep-learning-based methods can encode videos with higher visual quality. Moreover, VIF received the worst ranking in both human eye and other FR-IQA evaluations, which implies that modeling the visual channel of the human eye is a complex process and that using simple source channel coding theory in information theory is not sufficient to portray the perceptual characteristics of HVS; so, VIF is not suitable for optimizing and guiding image/video processing algorithms.
4.3. Subjective Results
It should be noted that PSNR has shown poor performance when it comes to estimating the perceptual quality of images and videos as perceived by humans. Thus, it is necessary to compare perceptual quality by performing subjective tests. We use the double-stimulus impairment scale (DSIS) method according to the methodology for the subjective assessment of the quality of television pictures of Recommendation ITU-R BT.500-13.
The monitor used in the subjective experiment was a Dell-U2720Q, with a viewing distance of 2.5 times the height of the screen. A total of 25 experimental observers between the ages of 22 and 35 participated in the subjective test, 11 of whom were female and 14 were male. All observers did not work in the video imaging industry, meaning that they had no expertise in the field of image and video processing, they had normal or normal corrected vision using glasses, and there were no color-weak or color-blind persons. A five-point scale was used for the subjective evaluation, with five indicating that the video distortion was imperceptible, four indicating that the video was perceptible but not annoying, three indicating that the video distortion was slightly annoying, two indicating that the video distortion was annoying, and one indicating that the video distortion was very annoying. Finally, the abnormal testers and abnormal scores were removed using the test screening method, and the observer’s mean opinion score (MOS) were derived as the quality scores of the video samples. Finally, the human eye subjective quality rankings of the five FR-IQA-optimized E2E-DVC model-encoded reconstructed videos are listed in Figure 4, and their rankings are LPIPS, DISTS, MS-SSIM, MAE, and VIF, in order from good to bad. The detailed MOS values are shown in Table 1.
The frame of the “BasketballDrive” sequence in HEVC class B constructed by the DVC models optimized by the five FR-QA metrics are shown in Figure 5. The MAE-guided reconstructed frame is somewhat blurred. The VIF-guided reconstructed frame has overenhanced global contrast and a lot of noise. Both LPIPS and DISTS succeed in reconstructed details of the original frame.
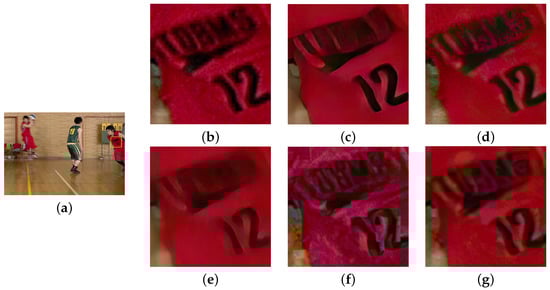
Figure 5.
Visual results of the DVC optimized using different FR-QA metrics: (a) reference, (b) original, (c) MS-SSIM, (d) LPIPS, (e) MAE, (f) VIF, and (g) DISTS.
5. Conclusions
Visual quality assessment is often used as a KPI to evaluate the performance of ICPS. In this paper, we bring attention to alternative choices of perceptual loss function for E2E-DVC, which can be used to reduce the amount of data generated by sensors and other sources in ICPS. We selected five optimization-suitable FR-QA metrics as perceptual objectives for analysis of effects of different FR-QA metrics on E2E-DVC. The R-D function of the DVC model in terms of PSNR is similar to traditional video coding. The subjective human perceptual tests on the reconstructed videos showed the perceptual performance of different FR-QA optimizations. In addition, further study of the R-D performance of E2E-DVC and perceptual loss function design is needed in the future.
Author Contributions
Conceptualization, W.X. and B.C.; methodology, W.X.; software, B.C., B.F. and X.W.; validation, K.G., Y.S. and B.F.; formal analysis, W.X.; investigation, Y.S.; resources, W.X. and J.L.; writing—original draft preparation, B.C.; writing—review and editing, all authors; visualization, Y.S.; supervision, B.F. and J.L. All authors have read and agreed to the published version of the manuscript.
Funding
This work was supported in part by the National Natural Science Foundation of China under Grant 62176027; in part by the General Program of the National Natural Science Foundation of Chongqing under Grant cstc2020jcyj-msxmX0790; in part by the Human Resources and Social Security Bureau Project of Chongqing under Grant cx2020073; in part by the Guangdong OPPO MOBILE Telecommunications Corp., Ltd. under Grant H20221694; in part by the Natural Science Foundation of ChongQing under Grant CSTB2022NSCQ-MSX0922; and in part by the Science and Technology Project of Shenzhen under Grant GXWD-20220811170603002.
Data Availability Statement
Not applicable.
Conflicts of Interest
The authors declare that they have no conflict of interest.
References
- Xu, X.; Dou, Y.; Qian, L.; Zhang, Z.; Ma, Y.; Tan, Y. A Requirement Quality Assessment Method Based on User Stories. Electronics 2023, 12, 2155. [Google Scholar] [CrossRef]
- Zhou, J.; Cao, K.; Zhou, X.; Chen, M.; Wei, T.; Hu, S. Throughput-Conscious Energy Allocation and Reliability-Aware Task Assignment for Renewable Powered In-Situ Server Systems. IEEE Trans. Comput.-Aided Des. Integr. Circuits Syst. 2022, 41, 516–529. [Google Scholar] [CrossRef]
- Zhou, J.; Zhang, M.; Sun, J.; Wang, T.; Zhou, X.; Hu, S. DRHEFT: Deadline-Constrained Reliability-Aware HEFT Algorithm for Real-Time Heterogeneous MPSoC Systems. IEEE Trans. Reliab. 2022, 71, 178–189. [Google Scholar] [CrossRef]
- Bross, B.; Chen, J.; Ohm, J.R.; Sullivan, G.J.; Wang, Y.K. Developments in International Video Coding Standardization After AVC, With an Overview of Versatile Video Coding (VVC). Proc. IEEE 2021, 109, 1463–1493. [Google Scholar] [CrossRef]
- Pfaff, J.; Schwarz, H.; Marpe, D.; Bross, B.; De-Luxan-Hernandez, S.; Helle, P.; Helmrich, C.R.; Hinz, T.; Lim, W.Q.; Ma, J.; et al. Video Compression Using Generalized Binary Partitioning, Trellis Coded Quantization, Perceptually Optimized Encoding, and Advanced Prediction and Transform Coding. IEEE Trans. Circuits Syst. Video Technol. 2020, 30, 1281–1295. [Google Scholar] [CrossRef]
- Hong, Y.; Wang, C.; Jiang, X. A No-Reference Quality Assessment Method for Screen Content Images Based on Human Visual Perception Characteristics. Electronics 2022, 11, 3155. [Google Scholar] [CrossRef]
- Varga, D. No-Reference Image Quality Assessment Using the Statistics of Global and Local Image Features. Electronics 2023, 12, 1615. [Google Scholar] [CrossRef]
- Sullivan, G.J.; Ohm, J.R.; Han, W.J.; Wiegand, T. Overview of the High Efficiency Video Coding (HEVC) Standard. IEEE Trans. Circuits Syst. Video Technol. 2012, 22, 1649–1668. [Google Scholar] [CrossRef]
- Bross, B.; Wang, Y.K.; Ye, Y.; Liu, S.; Chen, J.; Sullivan, G.J.; Ohm, J.R. Overview of the Versatile Video Coding (VVC) Standard and its Applications. IEEE Trans. Circuits Syst. Video Technol. 2021, 31, 3736–3764. [Google Scholar] [CrossRef]
- Sheikh, H.; Bovik, A. Image information and visual quality. IEEE Trans. Image Process. 2006, 15, 430–444. [Google Scholar] [CrossRef]
- Xue, W.; Zhang, L.; Mou, X.; Bovik, A.C. Gradient Magnitude Similarity Deviation: A Highly Efficient Perceptual Image Quality Index. IEEE Trans. Image Process. 2014, 23, 684–695. [Google Scholar] [CrossRef] [PubMed]
- Gastaldo, P.; Zunino, R.; Redi, J. Supporting visual quality assessment with machine learning. EURASIP J. Image Video Process. 2013, 2013, 54. [Google Scholar] [CrossRef]
- Liu, T.J.; Liu, K.H.; Lin, J.Y.; Lin, W.; Kuo, C.C.J. A ParaBoost Method to Image Quality Assessment. IEEE Trans. Neural Netw. Learn. Syst. 2017, 28, 107–121. [Google Scholar] [CrossRef] [PubMed]
- Bosse, S.; Maniry, D.; Müller, K.R.; Wiegand, T.; Samek, W. Deep Neural Networks for No-Reference and Full-Reference Image Quality Assessment. IEEE Trans. Image Process. 2018, 27, 206–219. [Google Scholar] [CrossRef] [PubMed]
- Sim, K.; Yang, J.; Lu, W.; Gao, X. MaD-DLS: Mean and Deviation of Deep and Local Similarity for Image Quality Assessment. IEEE Trans. Multimed. 2021, 23, 4037–4048. [Google Scholar] [CrossRef]
- Duan, W.; Lin, K.; Jia, C.; Zhang, X.; Ma, S.; Gao, W. End-to-End Image Compression via Attention-Guided Information-Preserving Module. In Proceedings of the 2022 IEEE International Conference on Multimedia and Expo (ICME), Taipei, Taiwan, 18–22 July 2022; pp. 1–6. [Google Scholar]
- Ding, K.; Ma, K.; Wang, S.; Simoncelli, E.P. Comparison of Full-Reference Image Quality Models for Optimization of Image Processing Systems. Int. J. Comput. Vis. 2021, 129, 1258–1281. [Google Scholar] [CrossRef]
- Zhao, H.; Gallo, O.; Frosio, I.; Kautz, J. Loss Functions for Image Restoration With Neural Networks. IEEE Trans. Comput. Imaging 2017, 3, 47–57. [Google Scholar] [CrossRef]
- Wang, Z.; Bovik, A.; Sheikh, H.; Simoncelli, E. Image quality assessment: From error visibility to structural similarity. IEEE Trans. Image Process. 2004, 13, 600–612. [Google Scholar] [CrossRef]
- Lu, G.; Ouyang, W.; Xu, D.; Zhang, X.; Cai, C.; Gao, Z. DVC: An End-To-End Deep Video Compression Framework. In Proceedings of the 2019 IEEE/CVF Conference on Computer Vision and Pattern Recognition (CVPR), Long Beach, CA, USA, 16–17 June 2019; pp. 10998–11007. [Google Scholar]
- Chen, T.; Liu, H.; Ma, Z.; Shen, Q.; Cao, X.; Wang, Y. End-to-End Learnt Image Compression via Non-Local Attention Optimization and Improved Context Modeling. IEEE Trans. Image Process. 2021, 30, 3179–3191. [Google Scholar] [CrossRef]
- Rippel, O.; Nair, S.; Lew, C.; Branson, S.; Anderson, A.; Bourdev, L. Learned Video Compression. In Proceedings of the 2019 IEEE/CVF International Conference on Computer Vision (ICCV), Seoul, Republic of Korea, 27 October–2 November 2019; pp. 3453–3462. [Google Scholar]
- Liu, H.; Shen, H.; Huang, L.; Lu, M.; Chen, T.; Ma, Z. Learned Video Compression via Joint Spatial-Temporal Correlation Exploration. In Proceedings of the AAAI Conference on Artificial Intelligence, New York, NY, USA, 7–12 February 2020; Volume 34, pp. 11580–11587. [Google Scholar]
- Zhou, J.; Shen, Y.; Li, L.; Zhuo, C.; Chen, M. Swarm Intelligence based Task Scheduling for Enhancing Security for IoT Devices. IEEE Trans. Comput.-Aided Des. Integr. Circuits Syst. 2022, 42, 1756–1769. [Google Scholar] [CrossRef]
- Wang, Z.; Simoncelli, E.; Bovik, A. Multiscale structural similarity for image quality assessment. In Proceedings of the Thrity-Seventh Asilomar Conference on Signals, Systems Computers, Pacific Grove, CA, USA, 9–12 November 2003; Volume 2, pp. 1398–1402. [Google Scholar]
- Laparra, V.; Berardino, A.; Ballé, J.; Simoncelli, E.P. Perceptually optimized image rendering. J. Opt. Soc. Am. A 2017, 34, 1511–1525. [Google Scholar] [CrossRef] [PubMed]
- Laparra, V.; Ballé, J.; Berardino, A.; Simoncelli, E. Perceptual image quality assessment using a normalized Laplacian pyramid. In Proceedings of the IS&T International Symposium on Electronic Imaging Science and Technology, San Francisco, CA, USA, 14–18 February 2016. [Google Scholar]
- Zhang, S.; Mrak, M.; Herranz, L.; Blanch, M.G.; Wan, S.; Yang, F. DVC-P: Deep Video Compression with Perceptual Optimizations. In Proceedings of the 2021 International Conference on Visual Communications and Image Processing (VCIP), Munich, Germany, 5–8 December 2021. [Google Scholar]
- Zhang, R.; Isola, P.; Efros, A.A.; Shechtman, E.; Wang, O. The Unreasonable Effectiveness of Deep Features as a Perceptual Metric. In Proceedings of the IEEE Conference on Computer Vision and Pattern Recognition (CVPR), Salt Lake City, UT, USA, 18–22 June 2018. [Google Scholar]
- Ding, K.; Ma, K.; Wang, S.; Simoncelli, E.P. Image Quality Assessment: Unifying Structure and Texture Similarity. IEEE Trans. Pattern Anal. Mach. Intell. 2022, 44, 2567–2581. [Google Scholar] [CrossRef] [PubMed]
- Sheikh, H.; Sabir, M.; Bovik, A. A Statistical Evaluation of Recent Full Reference Image Quality Assessment Algorithms. IEEE Trans. Image Process. 2006, 15, 3440–3451. [Google Scholar] [CrossRef] [PubMed]
- Xue, T.; Chen, B.; Wu, J.; Wei, D.; Freeman, W.T. Video enhancement with task-oriented flow. Int. J. Comput. Vis. 2019, 127, 1106–1125. [Google Scholar] [CrossRef]
- Xian, W. E2E-NVC. Available online: https://github.com/Math-Computer/E2E-NVC (accessed on 1 January 2023).


Disclaimer/Publisher’s Note: The statements, opinions and data contained in all publications are solely those of the individual author(s) and contributor(s) and not of MDPI and/or the editor(s). MDPI and/or the editor(s) disclaim responsibility for any injury to people or property resulting from any ideas, methods, instructions or products referred to in the content. |
© 2023 by the authors. Licensee MDPI, Basel, Switzerland. This article is an open access article distributed under the terms and conditions of the Creative Commons Attribution (CC BY) license (https://creativecommons.org/licenses/by/4.0/).